

It’s definitely a red-letter day.
Dr. Paul Maier, the lead author on the new paper Mitotree: The Universal Human Mitochondrial Reference Phylogeny at 10x the Resolution has uploaded the paper to the bioRxiv preprint server, here.
I want to congratulate all of the authors, most of whom are members of the FamilyTreeDNA R&D team as either employees or contractors. I’m a contractor and have had the honor of working with these amazing colleagues on this project since 2020.
About Mitotree
Mitotree was officially “born” on February 25, 2025, and the tree has been updated several times since. About 75% of FamilyTreeDNA’s customers who have taken the full-sequence mitochondrial DNA test received a more refined haplogroup with the release of Mitotree or subsequent updates. Those haplogroups are, on average, 2000 years newer than the person’s legacy Phylotree haplogroup, and some are much more recent.
This means that the tree branches have gotten much, much bushier close to the tips. In other words, lots more twigs and leaves!
Unfortunately, about 25% of testers did not receive a new haplogroup because they do not have any qualifying mutations:
- Either because they have no additional mutations
- Or because they have mutations, but they are unstable
- Or because they have mutations, but no other testers have yet tested that match them to split a branch
The good news is that with the addition of haplotype clusters, everyone benefits from new matching and grouping tools. Testers are grouped into clusters on their matches page, and on the Match Time Tree in Discover, which is much more useful for genealogy.
I know this paper has been a long time coming, but it’s well worth the wait.
Mitotree was a massive undertaking. We began with PhyloTree v17 which had 5,438 hand-curated branches constructed from 24,275 full and partial mitochondrial sequences. Phylotree was last updated in 2016 before subsequently being abandoned.
The Million Mito Team developed Mitotree, a robust phylogeny with more than 54,000 branches formed from over 330,000 complete mitochondrial sequences, of which 177,196 are unique sequences.
Let’s Look Under the Hood
There are three critical pieces of information in those statements.
First, the PhyloTree curation and maintenance was not automated, and a paper detailing their build process, what mutations were included or excluded, and under what circumstances was never published.
Approximately once a year, a new PhyloTree was published where newer samples were individually evaluated and new haplogroups were hand-grafted onto an existing backbone tree.
This methodology did not allow for deep splits to become apparent, because the tree itself was never recalculated. This is exactly how haplogroup L7 went undetected until the Million Mito Team recalculated the tree, including the backbone, in 2022, and published this paper about L7’s discovery.
In other words, while PhyloTree was publicly available, there was no recipe for how it was created or maintained.
Clearly, the tree-building process had to be automated, as hand-curation was unsustainable. There were no academic programs in existence capable of handling the number of samples involved. Not even in 2016 for fewer than 25,000 samples, let alone today.
To maintain haplogroup naming consistency, the first thing our team had to do was write software to phylogenetically reverse engineer PhyloTree v17 to establish a common foundation on which to build. This step was essential for consistency and maintaining the established haplogroup naming pattern.
That software also had to be capable of scaling up exponentially. The first versions took weeks to run, which clearly wasn’t an acceptable long-term solution. Still, being able to establish a foundational backbone to build on programmatically was a victory in and of itself.
Second, PhyloTree used partial sequences, meaning HVR1 and HVR2 samples. Early academic researchers did not perform full sequence testing, so the curators of PhyloTree used what was available to the best of their ability.
With over 330,000 full-sequence samples available today, we no longer include partial samples.
Third, 177,196 of the 331,221 full sequence samples used were unique. Before launching the program to construct the tree, identical samples from known immediate relatives are deduped, when possible, in order to reduce unnecessary clutter and processing time.
This means two things. The actual number of testers is greater than 331,000. But more importantly, anyone who thinks that mitochondrial DNA isn’t interesting should take another look. More than half of the sequences used for tree-building are unique, which handily dispels the myth that mitochondrial DNA doesn’t mutate often enough to be useful for genealogy.
The Mitotree initiative has been both scientifically and genealogically successful beyond anything we could have imagined. The base tree includes approximately 180 branches that are older than 30,000 years, including the discovery of haplogroup L7 at 100,000 years old. These branches both expand and more firmly root the oldest portions of the tree.
Amazingly, haplogroup L7 has living descendants whose earliest known family members are found in Turkey, Saudi Arabia, Yemen, the UAE, Palestinian Territory, Ethiopia, Sudan, and South Africa.
Another fun discovery involved Otzi, the Iceman, a mummy found frozen in the Italian Alps who lived more than 5,000 years ago. He was thought to carry an extinct haplogroup, K1ö, named in his honor, but as it turns out, he’s actually a member of haplogroup K1f, a clade with living descendants in Algeria. Additionally, Otzi now matches four ancient burials too, so he does have cousins.
We couldn’t have made these discoveries without the right people testing, so please encourage everyone and dispel the discouraging myth that mitochondrial DNA isn’t useful or interesting. It absolutely IS, and the success stories keep rolling in!
Why Build a Phylogenetic Tree?
Simply put, the history of our ancestors, both recently and reaching back into ancient history, is revealed in the tree – and there’s absolutely no other avenue to reach this information. Ironically, it’s readily available to everyone because everyone has mitochondrial DNA and can easily take the test.
Mitochondrial DNA is different than Y-DNA, which has its own phylogenetic tree based on SNP mutations, and autosomal DNA, which has no tree.
The reason that both Y-DNA and mitochondrial DNA can have phylogenetic trees is that they are inherited from the appropriate parent with only occasional mutations, while autosomal DNA is roughly halved in each generation.

Y-DNA is inherited by males only from their fathers, with no admixture from their mother, while mitochondrial DNA is inherited by everyone from only their mothers, with no admixture from their father.
Autosomal DNA is inherited through random recombination, with half coming from each parent, except for the X chromosome which has its own inheritance pattern. X-DNA is often confused with mitochondrial DNA, but they are entirely different types of DNA. I wrote about that here.
No tree is possible for autosomal DNA, because it gets diced and riced in each generation.
The mutations that occur occasionally and randomly in both Y and mitochondrial DNA form a trail of breadcrumbs leading backward in time, or in our case, they form both the trunk and branches on the tree.
Those unique mutations, once they occur, are inherited by subsequent generations, forming a path back in time.
In current generations, those mutations provide testers with the ability to identify our closest cousins who inherited those same mutations and who have taken either a Big Y-700 test, in males, or a mitochondrial DNA full sequence test for everyone.
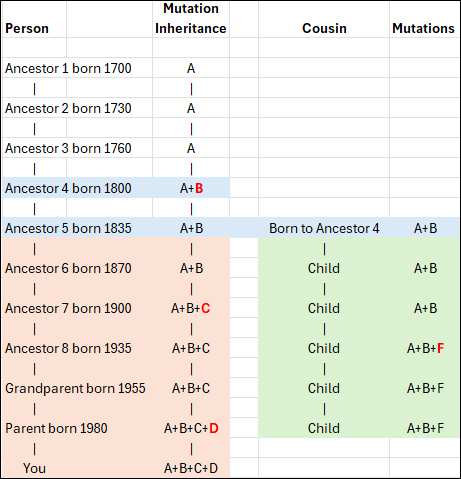
In this conceptual example, you can see that Ancestor 1 carries mutation A, as do the next two generations who inherited it from their parent. However, Ancestor 4 now has additional mutation B, so that person carries mutations A+B. This inheritance pattern continues through the apricol lineage as mutations C and D are added in subsequent generations, until “You” are born with A+B+C+D.
Your cousin’s ancestor, on the other hand, was also born to Ancestor 4 and carries both A+B, as seen in the green column. Three generations later, that line added mutation F. Your ancestor 7 added mutation C, so now the apricot and green lineages can easily be genetically distinguished from each other.
When a living person tests, we immediately know, based on the combination of their mutations, if and where they fit in this lineage, because both the apricot and green branches have accumulated unique mutations that the original blue Ancestor 4 and earlier ancestors did not have.
Using our knowledge of the tree branches, when and where they occurred, provides valuable genealogical information, along with fascinating Ancient Connections, both since and prior to the adoption of surnames.
Both Y-DNA and mitochondrial DNA can reach much further back in time than autosomal DNA because they are not diluted with DNA from the other parent in each generation.
So mitochondrial DNA is both broad, meaning many leaves, and deep, meaning it helps us look straight back in time like a laser sight, all the way to the common ancestor of all humanity, Mitochondrial Eve, who lived about 140,000 years ago in Africa.
Mitochondrial DNA Presents Unique Challenges
Mitochondrial DNA presents challenges not found in Y-DNA tree building.
For example, mitochondrial DNA only has 16,569 locations available to utilize, while Y-DNA currently uses roughly 22 million “gold standard” locations on the Y chromosome.
Of those 16,569 mitochondrial locations, some are not reliable enough for tree-building.
Unreliable mutations include:
- Insertions, where extra copies of a particular nucleotide (Thymine, Adenine, Cytosine and Guanine) have been inserted at a specific location. Those are indicated by designations such as 309.1C where 309 indicates the marker location, .1 indicates the number of insertions at that location, and C (for Cytosine in this example) indicates the nucleotide inserted.
- Heteroplasmies occur when multiple nucleotides are detected at a specific location. They are reported by a different letter than T, A, C or G, depending on which of multiple nucleotides are found. Heteroplasmies tend to “come and go” based on detection and threshold levels, so they can’t be used the same way as more stable mutations for tree building – and are often, but not always, unreliable for genealogy. I wrote about this in the article, What is a Heteroplasmy and Why Do I Care?.
Those locations and types of mutations have been excluded from forming tree branches, or downweighted, because they are too prone to mutating back and forth. However, they *might* be useful for genealogical purposes. Less-than-reliable mutations are now used to create haplotype clusters, even though they aren’t used to create new branches on the Mitotree.
I wrote about how haplogroups and haplotype clusters are formed in these articles:
- Mitochondrial DNA: What is a Haplotype Cluster and How Do I Find and Use Mine?
- Mitotree Q&A for Everyone
- Best Mitochondrial DNA Presentation EVER – You’re Invited to DNA Academy!!
- Cheat Sheet: Mitochondrial Matches, Haplotype Clusters, and Haplogroups
- Mitochondrial DNA: How Do I Know if I’m a Candidate to Receive a New Haplogroup?
Weighting and Confidence Factors
Mitotree formation would have been a lot easier if delineations, meaning inclusions and exclusions, were clear, either yes or no, but they aren’t.
Some were obvious from the get-go, such as insertions at location 309 and elsewhere, but other situations were much less obvious.
For example, sometimes there’s a specific location that seems prone to reversion, mutating back and forth, meaning that it mutates, then returns to its original state, then repeats the process.
Reversions are a natural phenomenon that occurs frequently in mitochondrial DNA, but is rarely, if ever, found in Y-DNA.
Let’s look at an example.

Courtesy Dr. Paul Maier
How many reversions at the same location are too many, especially if they are close in the tree?
In the above example, the mutation from A to G occurs just below the first arrow, forming haplogroup L1, a branch of L. The red areas all carry that mutation, subsequently forming eight new branches.
However, one step downstream from that mutation, just above the second arrow, location 7055 back-mutates, or reverts to A from G, which is indicated by the “!”. That reverse mutation forms haplogroup L1c3.
If location 7055 continues to flip back and forth between A and G, at what point do we have less confidence in that location, and at what point should a location be excluded from the tree and prevented from creating or dividing a branch?
The answer is that “it depends,” sometimes on the branch, sometimes on the “group” of other mutations it’s found with, and other factors. Some locations are stable in some parts of the tree, but unstable in others. We certainly never expected to see that!
This means the team had to design and build a weighting methodology so that relevant mutations, such as reversions, are not summarily excluded from tree building but instead carry different confidence weighting levels, depending on the circumstances.
Some samples, such as ancient DNA, were down-weighted in general due to their propensity to contain artifacts resulting from deterioration. Ancient samples can still influence branching, just not as much as a high-quality modern sample.
Furthermore, especially when utilizing academic samples, results with a high number of heteroplasmies are excluded, along with those with ambiguous reads and missing upstream mutations, which were previously inferred with PhyloTree. Academic samples vary in quality and age, and we have no way of knowing which quality criteria were used by that lab at that time.
These types of variances made constructing and updating the Mitotree more challenging than the Y-DNA tree, which is not subject to weighting, resulting from phylogenetic tug-of-war between mutations.
In some situations, the addition of just one test can make the difference between a new branch, or no branch, in a subsequent run of the tree. Due to this type of scenario, and fine-tuning the algorithm, some people’s new haplogroups have reverted to an earlier haplogroup in subsequent Mitotree updates.
The paper and supplemental materials provide details about the exclusion process, types of exclusions, and a list of excluded marker locations.

You can view the confidence of any haplogroup in the Classic Mitotree view in Discover.
My haplogroup, J1c2f, is formed by the mutation G9055A, and you can see that the confidence rank is 7.5 out of 10.

Mousing over the little up-arrow tree icon beside the star explains changes in nearby branches, which can affect the haplogroup’s confidence ranking.
Branches are not renamed for convenience, and only when phylogenetically warranted. Existing haplogroup names used either on PhyloTree, in academic literature, or previously on the Y-Full tree are either maintained or avoided to eliminate potential confusion. No one wants two different haplogroup names depending on which tree is being viewed.
Previously obsoleted names remain permanently obsoleted and are not reused.
The paper explains further about technical corrections and tie-breaker situations. In some cases, potential branches with equal or near-equal weighting are flagged for team review.
Amazing Discoveries
I encourage everyone to read the section in the paper beginning with “Notable discoveries.” These aren’t people, as in Discover’s Notable Connections, but scientific accomplishments achieved with the new Mitotree.
Our knowledge of human migration within and out of Africa has been greatly refined, as well as the ancestral path into and across Eurasia, Asia, and into the Pacific Rim. If you have unusual mitochondrial haplogroups such as L, M, N, P, Q, R or S, you’ll absolutely want to read this.
Of course, in time these haplogroups branch and become Paleolithic haplogroups, then the Gravettian-Mesolithic followed by the Hunter-Gatherers found throughout Europe that we are familiar with. We’ve learned a great deal from rare ancient DNA samples that anchor more modern haplogroups in a place and time, and inform us of migration patterns as well as how now-extinct ghost populations gave rise to current ones.
The earliest humans, whom Mitotree has more firmly anchored, formed a trickle out of Africa that became a bifurcated stream, eventually flowing across the rest of the world. What recorded and even archaeological history cannot tell us can be and is revealed through the patterns held in our DNA today – and Mitotree is our map to read them. Common ancestors are found where our mutations as haplogroups converge, joining as we travel backward in time, piercing an otherwise impenetrable veil.
For those with Native American ancestry, Mitotree expands the two-wave theory, refining it into five or six probable migration surges, depending on how you count, based on a combination of haplogroup ages and distribution.
Summarizing from the paper:
The first wave of haplogroups A2, B2, C1b, C1c, C1d, D1, and D4h3a arrived from Asia, across Beringia or along the Pacific Corridor, about 17,000 to 18,500 years ago, and expanded along the Pacific coast. D4h3a is found almost exclusively in the Pacific region.
This was followed by haplogroup C4c about 15,800 years ago and X2a about 10,000 years ago, which expanded into the interior through the ice-free corridor east of the Rockies after the ice melted.
Next were the Paleo-Eskimo and Na-Dene speakers in haplogroups A2a, D2a, D2b, D2c/D3, and D4b1a2a1a2, who, between 3000 and 7000 years ago, made their way from Alaska, across the polar regions of Canada, into Greenland.
Na-Dene speakers, Apache and Navajo, in haplogroups A2a and B2a made their way southwest between 1300 and 1500 CE, or between 500 and 700 years ago.
Last, the present-day Inuit-Yupik expanded from Beringia to Greenland about 1000 CE.
For additional information, please see the Native American lineages section of the paper.
Mitotree has also clarified the ancestors of the Ainu/Jomon people from Hokkaido, Japan, and their ancient Paleolithic northwest Asian and Siberian relatives. The ancestors of this group and Native Americans share even earlier Asian ancestors.
The history of the Jewish people has been significantly refined as well, expanding on earlier works, and is found in the Counting the newest Jewish founders section of the paper.
- 43% of Ashkenazi Jewish testers fell into 5 founding lineages where they had no subclades before, but they do now.
- Two clades of haplogroup K have now been split 4000 to 5000 years ago in Romania.
- There’s new information about the crypto-Jewish community in Portugal, Mountain Jews from Persia and the Caucasus, plus Jewish groups in India, Georgia, Azerbaijan, Israel and Libya.
- Additionally, haplogroup M33c9b tells the story of Ashkenazi Silk Road merchants who traveled between China and Europe.
The paper reports the isolation of Sardinian-specific haplogroups and provides substantially greater structural definition for the Saami people, increasing from 22 subclades to more than 300.
The Notable discoveries section is chock full of information.
Genealogy Jump-Start
Today’s tree is ten times larger than the 2016 tree, and will continue to grow as more people take a full sequence mitochondrial DNA test, available at FamilyTreeDNA.
The greatly improved tree alone is not the only facilitator of genealogical success. A dozen reports, including Haplotype Clusters and the Match Time Tree are provided for all full-sequence testers in Discover. I wrote about how to effectively use your matches and Discover to break through genealogy brick walls, here.
There are a couple of things you need to do to increase your opportunities for success and to help Discover and Mitotree.
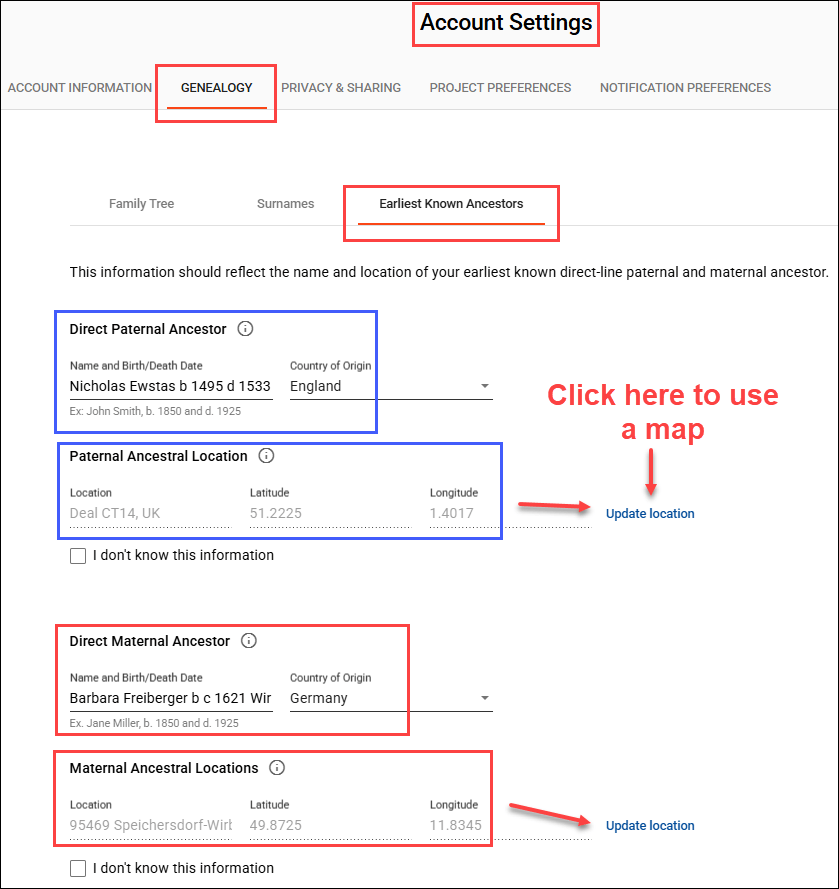
Genealogy is a team sport, and you can increase everyone’s success rate by completing (and updating) your Earliest Known Ancestor (EKA) and location information, found under “Account Settings” beneath your name in the upper right hand corner when signed on, then “Genealogy”, then “Earliest Known Ancestor”, and by providing a family tree or a link to WikiTree.
Identifying common ancestors is what testing is all about, and these are all important success factors. Everyone wants to identify previously unknown ancestors.
Mitotree is More Than Genealogy
Of course, as genealogists, we’re focused on how to use the new Mitotree information, paired with Discover, to identify brick-walled ancestors and learn more about them. I’ve written specifically about how to do that in these two articles:
- New Mitotree Haplogroups and How to Utilize Them for Genealogy
- Mitochondrial DNA A-Z: A Step-by-Step Guide to Matches, Mitotree, and mtDNA Discover
Mitotree isn’t just an explosion for genealogy, though – it’s an incredible scientific achievement. Instead of genealogy benefiting from other specialties, now they can benefit from what genealogy has wrought.
Mitotree presents opportunities to rethink and potentially recalculate dating and information in other fields, such as archaeology, medical genetics, forensics, and history.
We know vastly more than ever before, but this is only the beginning.
With each new tester and every ancient genome added to the growing body of evidence, our understanding becomes more refined, revealing insights about our ancestors, and weaving our thread into the broader tapestry of human history.

_____________________________________________________________
Share the Love!
You’re always welcome to forward articles or links to friends and share on social media.
Subscribe!
If you haven’t already subscribed, it’s free. You’ll receive an e-mail whenever I publish by clicking the “follow” button at the top of the main blog page, here.
Help Keep This Blog Free
I receive a small commission when you click a vendor link in my articles and purchase that item. This does NOT increase your price but helps me keep the lights on and this informational blog free for everyone. Please click on the affiliate links in the articles or to the vendors below if you are purchasing products or DNA testing.
Thank you so much.
DNA Purchases and Free Uploads
- FamilyTreeDNA – Y-DNA, mitochondrial and autosomal DNA testing
- MyHeritage DNA – Autosomal DNA test
- AncestryDNA – Autosomal DNA test
- AncestryDNA Plus Traits
- 23andMe Ancestry – Autosomal DNA only, no Health
- 23andMe Ancestry Plus Health
Genealogy Products and Services
- MyHeritage Subscription with Free Trial
- Legacy Family Tree Webinars – Genealogy and DNA classes, subscription-based, some free
- Legacy Family Tree Software – Genealogy software for your computer
- OldNews – Old Newspapers with links to save to MyHeritage trees
- MyHeritage Omni comprehensive “everything included” subscription plan
- Newspapers.com – Search newspapers for your ancestors
- NewspaperArchive – Search different newspapers for your ancestors
My Books
- DNA for Native American Genealogy – by Roberta Estes, for those ordering the e-book from anyplace, or paperback within the United States
- DNA for Native American Genealogy – for those ordering the paperback outside the US
- The Complete Guide to FamilyTreeDNA – Y-DNA, Mitochondrial, Autosomal and X-DNA – for those ordering the e-book from anyplace, or paperback within the United States
- The Complete Guide to FamilyTreeDNA – Y-DNA, Mitochondrial, Autosomal and X-DNA for those ordering the paperback from outside the US
Genealogy Books
- Genealogical.com – Lots of wonderful genealogy research books
- American Ancestors – Wonderful selection of genealogy books
Genealogy Research
- Legacy Tree Genealogists – Professional genealogy research


