This is the second article in the AI series. The first, Your Wonderful AI Assistant – Sometimes Wrong, Never Unsure, Always Convincing, explains why I’m writing this series and what to expect. I suggest that you read these articles in publication order, as they build on each other.
AI is neither inherently good nor bad. The outcome depends on:
- How it is used
- By whom
- Capabilities of the (ever-changing) tools themselves
- The understanding level of the “requester” and the “consumer”, both
- Safeguards applied or neglected
About AI
Let me start by saying that I don’t love AI, and I don’t hate it. I’m neither an evangelist nor a doomsayer. I’m a realist. AI is a powerful tool, capable of remarkable things and spectacular failures. Understanding the difference and interacting appropriately are the keys to success or failure.
AI is simply a tool, and like all tools, it can be used for good or evil. AI has the potential to, and does, in some cases, make our lives easier. However, the bad guys and miscreants saw that potential early and have perfected it.
AI is all around us, whether you realize it or not, so don’t think you can just avoid it, because you can’t. AI exists in many forms and is here to stay. We need to educate ourselves so we can reap some of the benefits and avoid the pitfalls.
Education and increased vigilance are the only ways to protect yourself, and I mean vigilance incorporated into the very fiber of your being. No more, “that looks interesting” and clicking without thinking. It’s so easy to do.
When I talk about AI safety, I’m referring to two types of safety.
- Using AI tools for reliable results, and how to determine when you’re receiving or consuming something questionable. AI failures occur often and are both irritating and misleading, but not always obvious.
- Literally protecting yourself from danger. This includes recognizing when AI is being used without your knowledge and how to protect yourself in the new threat landscape. I am not overexaggerating.
Unfortunately, AI safety is a sliding scale, progressing from one end of the spectrum to the other. There’s not always a clear delineation between correct and incorrect, safe and unsafe, or between different types of AI. As I am wont to say, “It depends.”
Learning about AI, both in general and in specific contexts, is critical. Not yesterday’s AI – but AI right now, because both the AI tools and AI’s capabilities are changing at lightning speed.
We all need to up our game and retrain ourselves to always stop and think first.
AI and You
There are essentially three ways people encounter or interact with AI.
- You’re actively using AI as a tool, such as ChatGPT, Claude, Gemini, or others. This is generally safe from an actual danger or “threat” perspective, particularly because you are in the driver’s seat. However, there are aspects you need to be aware of – especially if you’re a novice. I’ll explain methodologies to use AI to (hopefully) increase your productivity and save you from following AI into the underbrush of falsehoods, inaccuracies, and misplaced confidence. In other words, so you don’t have to say, “Wow, I was ever an idiot,” too often.
- You’re unknowingly interacting with AI. Sometimes this is fine, but it can open the door to inadvertent reliance on incorrect information and therefore various forms of harm. Sometimes, harm rises to the level of actual danger. Understanding when you’re interacting with AI, understanding its limitations, and recognizing danger signs are important aspects of staying safe.
- The AI threat landscape. AI can be dangerous and used against you. I mean screaming-red-neon-flashing-sign hair-on-fire dangerous, and I’m going to explain this new threat landscape and how to improve your chances of being safe, primarily in the final article of this series.
I Use AI, But There Are Limits
I hold a graduate degree in Computer Science and have years of experience in the technology industry where security is both essential and critical. That background, while preparing me generally, cannot prepare one for the situations and well-hidden threats we now encounter every day. Being overconfident and overreliant on prior experience is foolhardy and a sure way to get burned.
The one thing that’s constant in the computer industry is change. The underlying fundamentals remain the same, but everything else changes – and AI is morphing rapidly.
I’ve been using AI since the beginning in a very restricted, measured way. I use AI regularly, tactically, and cautiously, with huge guardrails. I started out by taking classes from Mark Thompson and Steve Little, AI experts in the genealogy space, to learn how to use AI productively. That was a couple of years ago, and the entire landscape has changed since then. I make it a priority to stay current.
In the next article about using AI safely, I’ll share recommendations for training and education from Mark and Steve.
AI tools are trying to emerge from their terrible toddler stage and morph into early teens, but they relapse a lot! Sometimes AI is very helpful, sometimes wrong, and often frustrating – interspersed with amazing victories where AI helps us immensely.
Unfortunately, often it’s almost impossible to tell which is which.
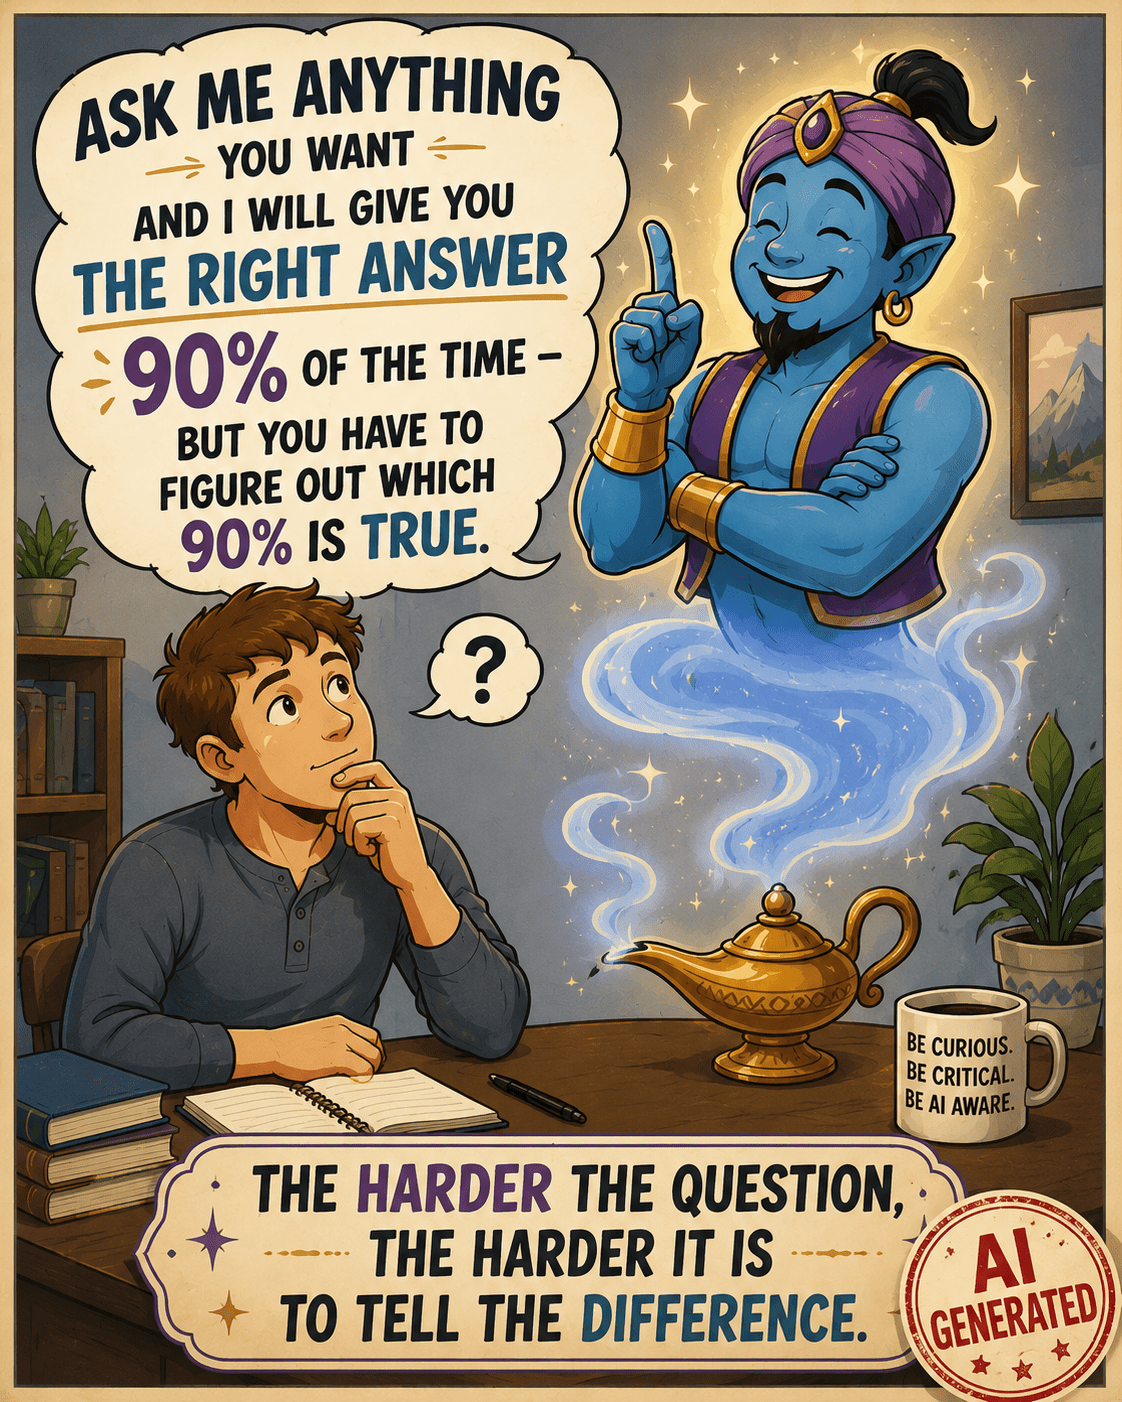
Inspired by a posting in the Facebook group, Genealogy and Artificial Intelligence. Image is AI generated and appropriately labeled as such.
Here’s the caveat – I know I’m using AI. I’m not accidentally interfacing with a Chatbot, thinking it’s a human. I’m not reading something someone else posted and believing I’m reading about an experience that’s true – when it’s AI-created fiction. The question, of course, at that point, is WHY someone created it and posted it in a way that conceals its true origins.
My AI usage is intentional. I know how to be vigilant, generally what AI can and can’t do, and that I absolutely positively MUST fact-check everything. Often, I inadvertently push the limits of AI, thinking it can perform more than it can accurately, which is another reason everything must be checked. As genealogists, verifying sources should be second nature.
If you’re going to use AI, it’s essential that you do the same thing.
So, what, exactly, is AI?
What is Artificial Intelligence?
This is really a difficult question to answer, because AI has been more of a slow evolution, followed by a rapid acceleration of technology – not a specific “thing.” That acceleration occurred when standalone AI tools like ChatGPT, which we know are AI because they are specifically called that, were introduced and made available to the consuming public.
We’ve been using computers for decades now, assisting us on platforms from mainframes to PCs to tablets. Today, our phones are more powerful and useful than early mainframes.
AI is the latest in the cadre of applications, a type of tool that can either stand alone or be embedded in other software tools for specific tasks. Think Chatbots for business websites.
While AI is beginning to be “everywhere,” it’s not a universal scapegoat.
Two years in, AI is being blamed for everything. While AI does make a lot of mistakes, many issues aren’t a result of AI, and it’s not fair to presume they are. Let me give you two examples of what is and is not AI.
- Not AI – Someone tried to enter text, meaning alphabet, in a field meant exclusively for numbers, like a month field that’s supposed to be a number and not the month name. The person was angry because “AI was wrong” and prevented the erroneous entry. First, it wasn’t wrong, and second, it wasn’t AI.
One of the earliest computer uses was to parse date fields and ensure that the “right thing” was being entered in the correct place. In this case, a numerical month, not the month name. That’s not AI. That’s just plain old-fashioned programming error-checking that’s been a part of software for decades. The program was performing exactly as it was intended.
- AI – I submitted a spreadsheet to ChatGPT and instructed it to move all of the data in cells in column A that are entirely numeric to the same row in Column B, and to leave everything that contains any alphabetic characters where it is in column A. That’s AI, both because I’m using a known AI tool, and it’s processing my instructions to produce output that did not exist before.
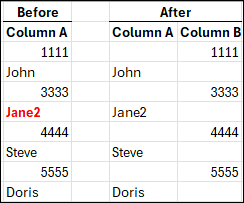
The above image is what I wanted. I completed this by hand to show you what I had in mind. Working by hand is fine with 8 rows of data, but it wouldn’t be fine with 1000 rows, or more. That’s when you need a tool.
What could go wrong? Plenty.
Let’s say that I didn’t provide specific instructions and a cell contained mixed alpha and numeric, like Jane2. Or, if the tool just plain messed up because of some other unknown reason – such as the file being too long, or it misinterpreted an instruction. That’s why you have to verify everything.
With AI, it’s always some variant of the wild west frontier.
Next, I submitted my Before and After spreadsheet, above, and instructed ChatGPT to “Please put this in a chart and make it pretty.”

This is exactly what I received.
I didn’t receive what I wanted, because I didn’t tell the AI tool specifically what I wanted (spacing, color, font, size), and what I didn’t want. This isn’t a problem with the AI tool, it’s a problem with the instructions provided by the “driver.” AI is not a mind-reader, at least not yet.
Hint: When I don’t receive what I wanted, I tell ChatGPT what I wanted and ask it why I didn’t receive that, and what instructions I could provide differently. In this case, I learned that it can’t “discern colored text” (red) and only sometimes can “see” bolding.
This was a very simple comparison of AI versus non-AI. Of course there are endless variations, but in general, AI does something that produces something new or different or in another format – based on conversational instructions.
Examples of what AI can do well:
- Take notes and summarize online meetings
- Organize information into outline format
- Suggest structure
- Proofread and sometimes provide editing suggestions
- Suggest places to look for additional information
- Translate, transcribe and summarize both typewritten and handwritten documents, in multiple languages
Every one of these comes with a caveat. AI can always be wrong. Like any helper or intern, it’s up to us, as the responsible party, to be, well, responsible by monitoring and verifying everything.
Being wrong in places does not mean the tool isn’t useful. AI can transcribe an entire document in seconds, but I need to proofread it against the original. That’s a significant time savings for me. AI can then assist with the logic of how people are related to each other. That doesn’t mean it’s accurate, but it’s a place to start.
We have to learn how to communicate with our intern in a way it can understand to (hopefully) receive the output we want, and we have to confirm that it is.
The more difficult and complex the task, the more difficult the verification.
GIGO
The overarching theme for all computer data is GIGO – garbage in, garbage out. I know everyone can think of hundreds of examples that have absolutely nothing to do with AI. It’s the same now, but on steroids because we add the layers of:
- Our instructions to AI, which may or may not be as thorough as we thought
- AI interpreting what it thought we said, according to its internal rules and limitations that we don’t understand
- AI manipulating data and producing output on our behalf
Additionally, when we ask AI to gather information about something, it can only gather what it can see. For example, some AI tools cannot reliably open weblinks, while others can. Some, like Google have internal routines to rank sites that are more reliable and accurate, and other tools do not.
Asking your AI tool for it’s sources so you can evaluate the GIGO factor is essential too.
Drinking From the Firehose
You might think AI is completely new, but it really isn’t. What’s new is the label of AI and consumer-based products where you get to be the driver.
Think of AI as the big umbrella.
In the past decade or so, artificial intelligence models have been slowly being developed, often for specific use cases. Machine learning models that are self-teaching are good examples. Genetic imputation to equalize autosomal DNA files produced by different vendors before matching is a specific use case.
Traditional programming is very specific and instructs, “If X, then Y.” Imputation, within a limited range of options, says, “Based on X, I think Y is most likely next character.” Machine learning learns by example. AI is the next generation where answers to questions are not hard-coded or self-learned in the same way.
With AI, one could interact and say, “Based on X, what do you think is next, and why?” The answer would be conversational, and would explain how the AI tool got to the result of Y. That doesn’t mean Y is accurate.
Before AI, consumers had never been in the driver’s seat, with the ability to query computers easily about anything with no programming needed – receiving conversational answers in their language of choice. Answers that are hopefully accurate.
Back in 2011, Siri became available, Amazon Alexa in 2014, and Google Assistant in 2016, but these were all command driven with a restricted vocabulary and could only perform limited actions.
In October 2022, ChatGPT introduced us to a new world, triggering the AI boom. By late 2023 and early 2024, suddenly the term AI, artificial intelligence, snowballed and was everywhere. The early versions of AI tools could only do a fraction of what they can in 2026, and could not perform tasks on your behalf.

ChatGPT prompt: “Make me a fun goofy picture with a cat that illustrates the ability of AI to make a fun goofy picture.”
Today that has all changed and it seems like everyone is making goofy pictures for fun.
Artificial Intelligence is NOT Intelligent
Let me say this loudly – artificial intelligence is not intelligent!
AI is a computer – electronic pulses in a data center somewhere. AI is trained to gather massive amounts of data, distill it in specific ways, and then, using various types of skills, interact with humans in a helpful manner. “Helpful” depends on perspective.
This field, as a whole, is really still in its infancy. That’s both the bad news and the good news.
AI tools are “new,” exciting, and frightening all at once. AI has enormous potential, but it also creates opportunities for misuse, deception, and unintended consequences.
I’m not referring to water and electricity consumption and the impact of building thousands of data centers on the environment. I’ll let you decide for yourself on that one.
Risks include:
- Frequent errors
- GIGO
- Results being presented overconfidently by the AI agent
- Faulty results being believed by the consumer (that’s you and me) with the same level of overconfidence, and without verification
- Social engineering – meaning the manipulation and influence of people by bad actors
- Extremely dangerous, highly malicious manipulation and applications in ways not possible before
The entire AI landscape is complicated by a lack of public understanding and made even more challenging by the extraordinary pace of this technology’s evolution.
Multiple Types of AI
There are multiple types of AI, ranging from Machine Learning models to full-blown Generative AI that creates goofy cat images for you. For the most part, today, we’re talking about LLMs and Generative AI.
Large Language Models, called LLMs, are artificial intelligence tools, like ChatGPT or Claude, that are designed to process human-like text or speech and generate output in the same way. AI doesn’t just give you a list of resources that you evaluate yourself, like a search engine; it gives you an “answer” (such as it is), writes text, and has an interactive “conversation” with you.
How does that happen?
The AI tool at the data center aggregates and amalgamates data based on your input and its training, then predicts the words most likely to come next, in what context, and how those words relate to each other.
That’s how AI forms an “answer.”
This is how and why AI, specifically LLMs, can write essays on a topic, create entirely fictitious but highly engaging social media postings and stories that aren’t presented as “stories,” but as someone’s personal experiences, meaning as “truth.”
AI, or the people who generated that AI script, or both, present fictional results with great confidence, often beautifully, and far more convincingly than humans.
This is where it’s important to differentiate between the tool itself, and the “driver,” meaning the human that’s prompting the AI tool.
- The driver needs to prompt AI correctly and verify the output.
- AI, the tool itself, sometimes generates incorrect information, often regardless of the prompts provided by the driver.
- Sometimes the AI tool performs exactly as instructed, but the driver requested something “improper.” By improper, I don’t mean inadvertently or by accident.
- Sometimes the human is unethical.
- AI isn’t a sentient being and doesn’t understand the difference.
The human decides what to do with AI-generated results. Many times, AI-generated text, recognizable by word patterns or other characteristics (today), is posted to social media as “original” or factual, and contains incorrect information.
This is often referred to as “AI slop,” as one of the nicer terms, especially by those of us who increasingly find incorrect but convincing AI slop posted as “helpful information” and positioned as “expert,” even though it contains substantial inaccuracies.
Worse yet, very convincing AI slop can easily be generated to part you and your money.
And do I EVER have an example for you that combines AI slop and ethics.
AI SLOP and Ethics
Just two days after our new paper, on which I’m a co-author, Mitotree: The Universal Human Mitochondrial Reference Phylogeny at 10x the Resolution, was published, a company, whose name I’m not including because I don’t want to give it any oxygen or get it indexed with this article, posted a “beautiful” AI poster based on our paper – without our knowledge.

Looks nice, right?
To begin with, it appears for all the world like the authors provided this infographic, which we ABSOLUTELY DID NOT DO. Our names are right at the top. However, our names, as the paper’s authors, lend this “thing” credibility, thereby leveraging our work BOTH unethically and inaccurately.
This AI-generated infographic, although it’s not labeled as such, was created by a third party shortly after the publication of the Mitotree paper. While visually impressive, it contains several scientific inaccuracies, illustrating how quickly and easily authoritative-looking but incorrect content can be created and disseminated.
That’s one of the issues with AI – the beauty and professional appearance of AI-generated “things” encourages unwarranted confidence in the output, when the information is very wrong.
That’s why humans bear the responsibility of BOTH using AI ethically, AND verifying its accuracy. It’s also why, as consumers, we need to question everything.
My biggest issue with this situation isn’t with AI, other than the fact that it generated incorrect output – the issue is with the humans who intentionally created this, using AI. In other words, the drivers.
The infographic doesn’t say they created this incorrect rubbish, and I assure you, they never asked for permission. Then, they published the infographic on their own blog. In case you’re wondering, the company encourages uploads and charges people to get “new results.”
Now for the AI part.
The information IS WRONG and NOT a synthesis of what we published!!!! This infographic shows that all non-L haplogroups descend from haplogroup L4, which is absolutely FALSE.
Haplogroups M and N descend from haplogroup L3, and haplogroup R descends from a subclade of N. You can trust me because I’m one of the paper’s authors, or better yet, you can look for yourself, here, on Discover, or here, here, and here.
That isn’t the only thing that’s wrong, either, but how would normal air-breathing humans, meaning consumers, ever know?
Doesn’t that infographic look professional and convincing, especially if you, as a consumer, didn’t actually check everything on the document – AND its authenticity?
You’d assume legitimacy, right?
If you didn’t know, wouldn’t you be impressed with the expertise of the company that posted this infographic on their blog? And, as a normal consumer, how would you know?
You’d be impressed because you didn’t realize they hijacked someone else’s work, created this “beautiful” infographic, included the authors’ names on something inaccurate that the authors knew nothing about and didn’t endorse, and then published it. All without saying one word indicating that the infographic isn’t the authors’ work, was AI generated, or by whom.
In the past, before generating AI slop was this easy, consumers often presumed that a business was ethical and accurate. Of course that wasn’t always true, but being convincing at first glance is much easier today. Also, presume is related to assume…and we all know the rest of that story.
This is one of the dangerous sides of AI – illustrating how easy it is to deceive people now. It’s increasingly difficult to distinguish between legitimate expertise and fabricated authority. AI has removed that barrier.
You can no longer accept that anything is what it appears to be unless you’re working directly with known, trustworthy entities. The offending company completed that infographic in the click of a button and the blink of an eye, while I hadn’t even finished writing my own article about the paper’s release.
That company wants you to upload your DNA to them so that they can tell you “things” about your DNA. The intention is clear.
Of course, the consuming public, unless they were extremely vigilant, would never figure out either issue – ethics or accuracy.
I had to delete the next paragraph or two that I wrote on the topics of ethics, trust and confidence because I’m still so furious. Hot under the collar doesn’t even begin to describe how I feel about the ethics of misrepresenting something that we authors just spent six years of our lives on. Trust me when I tell you that my internal monologue was both very salty and rather spicy!😊
However, there’s good news. This infographic provides a perfect illustration of both AI slop, how deceptively great it looks, the ethics surrounding AI usage, and how difficult AI is to discern.
In fact, I couldn’t have come up with a better “bad example.”
A six-fingered hand, misspelled words or three arms in an image are obvious, and are yesterday’s AI tipoffs.
A misrepresented phylogenetic relationship or an incorrect founder-clade example is not obvious. Only subject-matter experts would or could notice if they were focused and paying attention.
That’s the problem in a nutshell.
The infographic wasn’t obviously wrong. It was convincingly wrong.
And convincing wrongness is far more dangerous than ridiculous wrongness, like six fingers, because most readers never realize they’ve been misled. Or why.
This single example demonstrates several AI themes in one fell swoop:
- AI-generated content
- Ease of creating complex and convincing output
- Apparent authority
- Misplaced trust
- Lack of topic expertise
- Overconfidence
- AI slop
- Difficulty of discerning truth
- Yesterday’s “AI clues” are gone now – like misspelled words
- Marketing vs. science
- The necessity of human review
- The fact that human review is only effective when the reviewer actually understands the subject, and cares.
- Ethics
Like with this example, often AI slop is interspersed with accurate information, and it’s impossible to tell the difference unless you actually DO DUE DILIGENCE AND VERIFY ALL OUTPUT.
Yes, all of it.
Don’t shoot the messenger!
Hallucinations
Next, let’s discuss genetic genealogy, particularly haplogroup information. Hallucination or hallucinating is the term used for when AI simply makes things up, which often sound extremely convincing.
There’s nothing AI can tell you about your haplogroup that reputable sources cannot – and AI can’t see behind paywalls or logins, into your matches.
FamilyTreeDNA has an article in their help center titled, Why AI Models Struggle with Haplogroup Analysis.
Unfortunately, I encounter more and more instances where someone uploads their DNA to a third-party site, or “asks AI”. They receive a (sometimes substantially) incorrect haplogroup in a completely different part of the tree, complete with convincing language, posts it publicly, and then decides to argue that the third-party site, (who probably uses AI), or their AI tool, is correct.
Let’s look at an example. The mitochondrial DNA haplogroup for the Native American Anzick-1 burial in Montana that dates from roughly 12,500 years ago is mitochondrial haplogroup D4h3a. There’s no dispute about that.
A tester uploaded their mitochondrial DNA to “AI” and was very confidently told that, based on their mutations, their results belonged to haplogroup A2ex. They don’t.

ChatGPT misinformation about Anzick-1 haplogroup
They were then informed that it was also Anzick’s haplogroup. Wrong again.

FamilyTreeDNA’s Discover tool comparing mitochondrial DNA haplogroups D4h3a and A2ex. Their common ancestor lived about 66,000 years ago.
Not only did AI report Anzick’s haplogroup incorrectly on a grandiose scale, those two haplogroups don’t share a common ancestor for roughly 66,000 years – specifically haplogroup L3 who lived in Africa. AI made a massive mistake.
But it gets worse.

ChatGPT incorrect information about haplogroup A2ex.
The AI “answer” continued for four pages, containing completely erroneous information. To begin with, A2ex is a haplogroup, and “ex” has never meant excluding.
That’s bizarre, and an example of AI making something up that is patently false, but sounds wonderful and very authoritative.
The term for this AI behavior is hallucinating. I’m not publishing the rest of this exchange because I don’t want anyone (or any AI bot), for one minute, to think any of it is accurate. AI even made up mutations, along with four pages of “fairy tale.”
The individual who received this information was so excited and proudly posted it, which in turn provided incorrect information for other consumers, and encouraged them to use a badly flawed tool. Then they proceeded to argue with the experts.
They were absolutely convinced because it “felt” true to them, and because they wanted to believe they had discovered something special, and were related to Anzick. Their comment was, “You’re wrong, because AI told me it was true, and I’ve learned a lot from AI.” I was quite exasperated, but also feel sorry for them and can’t help but wonder how much else of what they “learned” from AI is wrong too, but I digress.
Most AI errors aren’t obviously wrong to the consumer. If AI said that you were descended from Tyrannosaurus Rex, you’d laugh. But if it tells you something more plausible and sounds confident, it’s very easy to be convinced. The reason these errors are so dangerous isn’t because the experts are fooled, it’s because non-experts either can’t, don’t, won’t or don’t think they need to invest the time to discern the difference.
I find it a bit baffling why anyone would use AI, or worse yet, a pay site for haplogroup misinformation, especially since FamilyTreeDNA provides the Discover website with free reports for every haplogroup. They are the unquestioned industry phylogenetic experts for both Y-DNA and mitochondrial DNA, and literally created the reference model for all haplogroups with the Mitotree.
Everyone can use Discover to access both the Y-DNA tree and Mitotree – for free – here. Discover isn’t even behind a paywall, and every customer can click through from their results page.
As far as haplogroups are concerned, there’s really no reason to rely on AI-generated answers without verifying them, because the authoritative resources are freely available and incredibly easy to access.

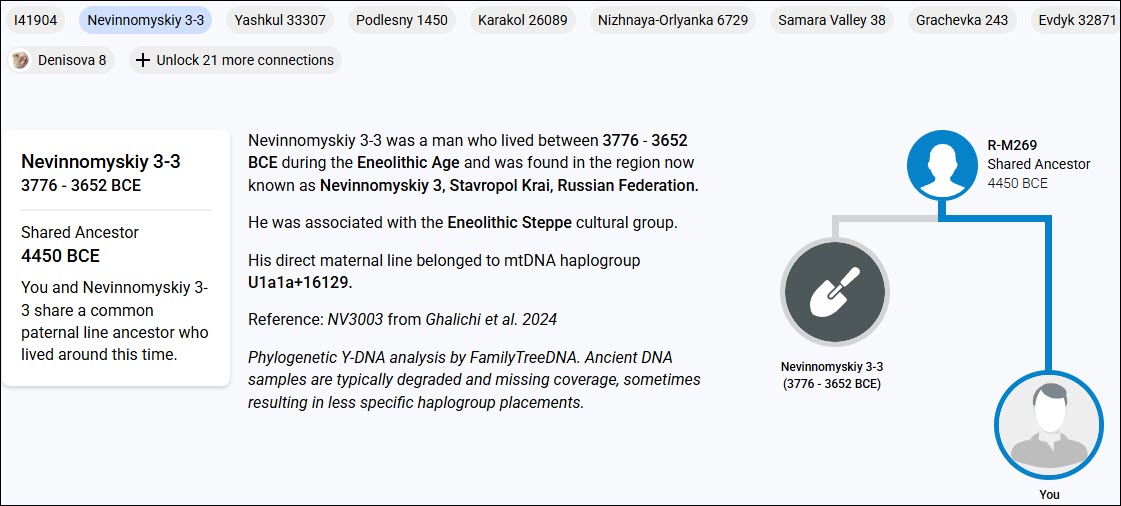
FamilyTreeDNA’s Discover Ancient Connection for Anzick-1.
Regarding Anzick’s haplogroup, all I had to do was enter haplogroup D4h3a in Discover and under Ancient Connections, right there is Anzick’s information.
I may start posting a link to this article on every single post where someone starts out with, “I submitted my DNA (or haplogroup) to AI, and it said…”
Let me be very direct. Don’t believe AI when it has to do with genetic information, especially Y-DNA, mitochondrial DNA, and haplogroups. AI does not have the capability of understanding topology and nuances of phylogenetic trees, and can only parrot back what others have said – correctly or incorrectly.
Incorrect information that’s publicly posted is then fed back into the AI algorithm, further reinforcing incorrect results.
You can find the free Discover tool for both Y and mtDNA, here, and you can join FamilyTreeDNA’s Mitochondrial DNA Group, here, and the Big Y Group, here.
AI Training and AI at Work
AI is trained on massive datasets of mostly unknown origin, including all public postings such as Reddit and Facebook public groups, pages and postings.
In other words, AI is always accruing additional information, including data uploaded by users.
As genealogists, we are already aware of the dangers of unsourced trees and and information that is repeated and copy/pasted without verification.
AI’s training provides more than just data points for you to evaluate, like trees.
AI bots are trained to interact in a humanlike manner. So instead of trees with hints, think hypothetically of an AI bot that reads the trees, then “creates” a wonderful story or infographic about your ancestor – that may or may not be either fully or partially accurate. But it’s beautiful, heartwarming and you love it! Plus, you don’t have to sort through all those trees, hints, and do the work yourself. AI did it for you! Win – win, right? Wrong.
AI knows how to very effectively manipulate language, images, and with them, emotion. Yours, to be specific. That’s both the bad news and the good news.
AI also has the ability to sift through large amounts of data and summarize succinctly – sometimes even correctly. Sometimes it takes several refinements to obtain something that’s both correct and what you want. AI can discern patterns in massive amounts of data that we cannot, at least not readily.
Think of AI as your not-so-trusty but very confident and friendly intern – and I don’t necessarily mean a college intern.
Remember when you see AI published by others, their intern has been at work too.
AI itself is not a sentient being. It’s not inherently ethical or unethical. However, it has been trained to interact with you in a human way. It’s easy after tens of thousands of years of human conditioning for us to interpret AI as human.
Let me give you an example.
I use ChatGPT regularly and was having an interactive conversation after asking it a question. ChatGPT replied that it didn’t know, which is a substantial and startling improvement over earlier versions. I replied, “I’m one of the team members, and even I don’t know.” Really, there was no reason for me to say that, except we interact with our GPTs as human, sometimes even naming them. Then, ChatGPT said, “That made me laugh.”
I was a bit startled.

That made ME laugh, because AI is a machine. It can’t laugh, but it has been trained how to interact with us in a humanlike manner – often sycophantically. Remember how LLMs are trained. It knows what to say next. The smiley face was probably its “humor” clue. Making your interactions both useful and enjoyable keeps you paying your monthly subscription fee.
Remember that AI has no morals, because it’s a machine, and no ethics, for the same reason. That falls to the humans driving. If someone intentionally drives their car into a crowd, it’s not the car’s fault.
AI currently doesn’t have the ability to self-check or self-regulate, though this has improved somewhat in recent months and will, hopefully, continue to improve over time.
People who use AI can use the results for good, for nefarious purposes, or simply as a “time-saving” assistant. There are no guardrails. I could give you very ugly examples, but I’ll simply say that, if prompted, AI will generate the worst things you can imagine, including nonconsensual adult images of people that never happened. These are generally called deepfakes, although deepfakes aren’t always generated in a negative context. I’ll discuss this phenomenon as part of Generative AI in the final article where we’ll cover the dark side of AI.
Conversely, AI can be intended for good by its human “driver” but still be inaccurate and, consequently, unintentionally inflict damage or spread misinformation.
The Bottom Line
Here’s the bottom line.
Your personal threat level warning flag now needs to be permanently set to red.
You need to be increasingly vigilant, meaning actively suspicious, of absolutely everything, even exchanges that used to be safe. In other words, if you receive an email from an organization or government agency that you’ve interacted with in the past – don’t click on an embedded link because you always have in the past and it was safe then.
Hint: Go to the website directly. E-mails are very easy to spoof and your SS account password, for example, is invaluable to a hacker.
The bad guys have gotten really good at being horrible. AI is becoming more difficult to detect every day – even for those of us with a significant amount of experience.
I realize that I sound paranoid, but I just completed security update training, and the threat landscape worse than I ever imagined. I’ll be sharing that information throughout these articles. Better paranoid and safe than trusting and sorry. What I’m striving for is an appropriate amount of alarm and a safe level of balance. I don’t want you to learn the hard way.
Today’s tip-offs that something is AI-generated will be gone tomorrow.
To use AI tools is to learn what AI output looks and feels like, so you can recognize when you encounter AI that you didn’t generate.
Now that we know what AI is, and isn’t, the next article will focus on AI Assistants, using AI successfully, and how to avoid pitfalls. You don’t want to be the president of the AI Fan Club, nor do you want to feel like you’re in an AI Escape Room.
_____________________________________________________________
Share the Love!
You’re always welcome to forward articles or links to friends and share on social media.
Subscribe!
If you haven’t already subscribed, it’s free. You’ll receive an e-mail whenever I publish by clicking the “follow” button at the top of the main blog page, here.
Help Keep This Blog Free
I receive a small commission when you click a vendor link in my articles and purchase that item. This does NOT increase your price but helps me keep the lights on and this informational blog free for everyone. Please click on the affiliate links in the articles or to the vendors below if you are purchasing products or DNA testing.
Thank you so much.
DNA Purchases and Free Uploads
- FamilyTreeDNA – Y-DNA, mitochondrial and autosomal DNA testing
- MyHeritage DNA – Autosomal DNA test
- AncestryDNA – Autosomal DNA test
- AncestryDNA Plus Traits
- 23andMe Ancestry – Autosomal DNA only, no Health
- 23andMe Ancestry Plus Health
Genealogy Products and Services
- MyHeritage Subscription with Free Trial
- Legacy Family Tree Webinars – Genealogy and DNA classes, subscription-based, some free
- Legacy Family Tree Software – Genealogy software for your computer
- OldNews – Old Newspapers with links to save to MyHeritage trees
- MyHeritage Omni comprehensive “everything included” subscription plan
- Newspapers.com – Search newspapers for your ancestors
- NewspaperArchive – Search different newspapers for your ancestors
My Books
- DNA for Native American Genealogy – by Roberta Estes, for those ordering the e-book from anyplace, or paperback within the United States
- DNA for Native American Genealogy – for those ordering the paperback outside the US
- The Complete Guide to FamilyTreeDNA – Y-DNA, Mitochondrial, Autosomal and X-DNA – for those ordering the e-book from anyplace, or paperback within the United States
- The Complete Guide to FamilyTreeDNA – Y-DNA, Mitochondrial, Autosomal and X-DNA for those ordering the paperback from outside the US
Genealogy Books
- Genealogical.com – Lots of wonderful genealogy research books
- American Ancestors – Wonderful selection of genealogy books
Genealogy Research
- Legacy Tree Genealogists – Professional genealogy research