AutoKinship by Genetic Affairs Builds Family Trees from Your Matches at FamilyTreeDNA, and More

Genetic Affairs released a new AutoKinship tool designed for FamilyTreeDNA’s autosomal Family Finder matches, which also incorporates information from other sources. I must have fallen asleep at the wheel, because AutoKinship has been available for more than six months now.

I’ve been testing this tool with my matches, and it’s an immense help to those of us trying to untangle complicated family relationships using DNA evidence. I don’t know about you, but I have a long list of brick well where I could use help!

How to Use This Guide

This article is long and there are many steps involved – but it’s well worth it at the end.

My suggestion for using this article effectively is to read it through, at least once, to see what you’re going to be doing, and why.

Then, after you get things set up at Genetic Affairs, and any files you want to include, come back and use this article as a step-by-step guide to navigate these new tools.

Here’s the bottom line. The Genetic Affairs tools use matches, along with shared and bucketed matches at FamilyTreeDNA, plus their archived trees, in addition to external GEDCOM files and other information that you can provide in order to create customized, focused clusters and potential family trees for your clustered matches.

These tools combine DNA matching with internal and external trees for the composite best of both types of information.

So grab your favorite drink and let’s get started.

FamilyTreeDNA

AutoKinship works in conjunction with FamilyTreeDNA’s tools, such as Shared Matching, the Matrix tool, and Family Matching, also known as bucketing, which assigns parental sides to your matches using linked matches.

Linked matches are your matches whose relationship to you is known. If you haven’t already, link them to their profile card on your tree by clicking on “Link on Family Tree.” This allows FamilyTreeDNA, by using triangulation, to “bucket” your matches either maternally or paternally – meaning if they are related to you on your maternal side, paternal side, or both.

In my cousin Patricia’s case, the little pink icon by her profile picture shows that she has been bucketed maternally. That occurred when I linked my mother’s DNA to my tree because Patricia matches us both, plus other linked maternal cousins, on the same segments. For bucketing to occur, you don’t have to do anything except link known relatives to their proper place in your tree. FamilyTreeDNA does the rest by assigning your matches either maternally or paternally if they match on common segments.

Upload DNA Files to FamilyTreeDNA from Other Vendors

If you have not taken the Family Finder test at FamilyTreeDNA or uploaded your DNA file from 23andMe (Dec 2010 to present), Ancestry (May 2012 to present), or MyHeritage (March 2019 to May 7, 2025) to FamilyTreeDNA, you should do so now to take advantage of their tools, plus AutoKinship at Genetic Affairs.

What is AutoKinship and Why is it Different?

AutoKinship takes traditional clustering and kicks it up several notches. Instead of just showing you which matches cluster together, it actually attempts to build family trees based on the shared DNA amounts between your matches.

AutoKinship looks at how much DNA your matches share with you, and with each other, and uses that information to predict their relationships. Then AutoKinship builds potential family trees showing how everyone might connect. Additionally, you get to provide input in the process.

The timing couldn’t be better, especially since FamilyTreeDNA recently launched their updated Matrix tool, showing how your matches are related to each other. I wrote about that, here.

Two Steps

There are two primary steps in the AutoKinship process that build on each other. However, within these steps, there are many stepping-stones, so I’ve documented each one.

We’re going to use these tools, one at a time, in order.

I suggest that you join the Genetic Affairs User Group on Facebook for additional support and information.

Using AutoKinship with FamilyTreeDNA

The AutoKinship functionality for FamilyTreeDNA provides an automated approach using both AutoCluster and AutoKinship, together, then AutoLineage, where you can refine the information in a number of ways.

🔹 Step 1: Automated AutoKinship via Genetic Affairs

The first step involves running the AutoKinship tool directly from the Genetic Affairs members’ site. This process is fully automated:

  • It starts with the FamilyTreeDNA AutoCluster option, which groups DNA matches into shared clusters based on their connections to each other.
  • AutoKinship is then automatically launched on each cluster, adding the DNA tester and generating relationship hypotheses among the group.
  • Several family tree models are produced, showing how the matches and the tester could be connected based on shared DNA and cluster structure.

This step is ideal for getting quick insights into how groups of matches may relate.

🔹 Step 2: Refined Clustering & Relationship Analysis Using AutoLineage

After the automated run, downloadable files for AutoLineage are generated. These files allow you to re-import the match, shared matches, and tree data into the AutoLineage web application for further analysis.

This second step offers greater control and customization:

  • You can redo the clustering, optionally tweaking parameters to fine-tune how matches are grouped.
  • You can redo the common ancestor analysis, optionally tweaking parameters to fine-tune the discovery of MRCAs
  • The AutoKinship tool within AutoLineage becomes available again, this time with additional functionality:
    • Define known relationships between matches, such as parent-child or cousin relationships
    • Define generational information, for instance, if you know certain matches are not on the same generational level
    • Integrate MRCA (Most Recent Common Ancestor) data from reconstructed trees, e.g., from the Find Common Ancestors module.

This enhanced phase is especially useful for integrating genealogical trees for targeted clusters.

By combining both steps, automated clustering with AutoKinship, and manual refinement with known or tree-derived relationships using AutoLineage – you can leverage your FamilyTreeDNA data for in-depth relationship exploration.

Let’s Take AutoKinship for a Spin

As always, I’ll walk you through this process step by step, using my own DNA results as an example.

Getting Started

First things first – you’ll need to be a member of Genetic Affairs, so sign up for their free membership, here. Genetic Affairs’ customers purchase “credits” to spend on various features and reports, but you receive 200 free to start.

The automated AutoKinship analysis available on the Genetic Affairs website can be run using credits from the free tier – perfect for exploring the tool without any commitment. This allows users to generate relationship trees for FamilyTreeDNA clusters right away.

To access the more advanced features in the AutoLineage desktop application—including refined clustering, manual relationship input, and integration of MRCA data from reconstructed trees – you’ll need an active subscription.

To get started, sign in to the Genetic Affairs member site, here.

Let’s walk through the process step by step.

We’ll begin by registering a FamilyTreeDNA profile at Genetic Affairs. Click on Register a new website to get started.

FamilyTreeDNA account passwords are not stored at Genetic Affairs.

After clicking “Register profile,” you’ll see a message asking you to double-check the credentials for the kit you’re about to use. This is also a good time to log in to your FamilyTreeDNA account directly to make sure there are no pending actions — such as enabling two-factor authentication or accepting updated terms of service.

Once you click “I understand, continue,” you’ll see a list of all registered FamilyTreeDNA profiles at Genetic Affairs.

Locate the kit you want to analyze and click the blue “Start analysis” button.
This opens a guided wizard that walks you through each step of the setup.

First, select AutoKinship and click “Next.”

You’ll then be asked to define several thresholds:

  • Minimum and maximum shared cM
  • Minimum size of the largest segment
  • Minimum cluster size

A quick word of caution here: selecting a very low minimum cM value may actually reduce the number of usable matches. That’s because the system must download shared match data until it either reaches that threshold, or a preset timer expires, which can limit how much data is downloaded. When in doubt, start conservatively. You can always rerun the analysis later and change the parameters. Unfortunately, there’s no way to simoly “get everything” in one run which is, of course, what everyone would do.

Click “Next” to continue.

This section determines which matches will be included in the analysis.
For your first run, I recommend using the top matches within the selected range. This provides a strong foundation and usually produces the clearest results.

Later, once you’re more familiar with the output, you may want to experiment by analyzing only the shared matches of a specific person or group. For now, keep it simple and click “Next.”

Here, you’ll enter your FamilyTreeDNA password (twice) so the system can retrieve the required data.

If you use two-factor authentication, you can enter the 2FA code here, as well. To do that, log in to your FamilyTreeDNA account, retrieve the code from your email, and paste it into the wizard.

Then click “Next.”

You’ll now see a summary of all the settings you’ve chosen. Take a moment to review everything. When you’re ready, click Perform analysis” in the bottom right corner.

At this point, the Genetic Affairs servers take over and begin processing your data.

The Results Arrive

When your report is ready, you’ll receive an email with a download link. You can also access it through the notification panel in the top right corner of the Genetic Affairs site.

Downloading the report will result in a zipped file. Save it in a location on your computer where you can find it.

Critical Step

This step is critical and will save you a great deal of frustration: If you’re using a PC, you MUST extract or unzip the files before you can properly use them. I can’t tell you how many people skip this step and then wonder why they’re receiving error messages. Ask me how I know!

This is your zipped file.

If you try to open the HTML file while it’s still zipped, it might appear to work at first, but when you click on any links within the file, you’ll receive an error.

If this happens to you, close everything, right-click on that yellow zipped folder, select “extract all,” and then try again.

Now you’re set up, so on to the fun part – viewing the results.

Exploring Your Results

Once you have everything properly extracted and open the HTML file, you’ll watch your AutoCluster literally fly into place on your screen. I love this part. It’s like watching my family fly into place. I wish the actual genealogy research was this easy.

The new Genetic Affairs reports include significantly more information than previous versions.

You can change what’s displayed using the dropdown menu.

By default, you’ll see the shared cM amounts between your matches, but you can change this to show paternal or maternal information if you’ve identified those lineages by linking your matches.

In my case, my maternal line has fewer matches because my mother’s ancestry includes both recent Dutch and German immigrants, so the majority of my high cM matches are US-centric on my father’s side. My father’s ancestors have been in this country since colonial times, and a lot of testers in the US are looking back to the old country for their origins.

Therefore, in my first several clusters, I see squares with the symbol P, indicating they are paternal matches – designated as such through linked family matches, aka bucketing.

You can see the faint Ps inside the orange cells.

Here’s a close-up so you can see the “P” for paternal. If you haven’t linked your matches, you won’t have bucketed matches. Your Genetic Affairs results don’t require bucketing – it’s just a really beneficial feature.

You can change your AutoCluster settings in several ways. I tend to start with the defaults and then modify from there.

Genetic Affairs functions based on the amount of server time a particular tool takes, so it’s not possible to just “run everything,” or trust me, I would.

The Common Ancestor Magic

In your report, scroll down several sections, and you’ll find Common Ancestors – my favorite feature.

This section shows you the common ancestors that have been identified between your matches’ trees.

Looking at the Common Ancestors cluster report, you can click on three things for each cluster:

  • FamilyTreeDNA Trees of Cluster #
  • Common Ancestors of Cluster #
  • Common Locations of Cluster #

Let’s examine the reconstructed trees based on the common ancestor analysis. The first cluster shows some of my close DNA matches that are descendants of my Vannoy line.

You can see that there are six testers, in addition to me, who descend from Joel Vannoy.

Next, scroll down to the AutoKinship section of your report.

The AutoKinship Analysis

The real treasure lies in the AutoKinship analysis, which is presented in a small table on the main HTML page. When you click on the AutoKinship results for any cluster, you’ll see reconstructed trees based on the shared DNA amounts between matches, meaning between you and each of them, and between each other.

You can see that I have 10 reports available based on the cluster numbers indicated.

I clicked on Cluster 1, which shows some of my close DNA matches who are Vannoy line descendants. This includes testers both with and without trees.

Since the AutoKinship algorithm doesn’t have access to age information, it sometimes struggles with generational differences – but the relationship predictions are still remarkably useful.

Alternative trees are also provided, giving you multiple hypotheses to investigate.

Some matches may not be integrated because of incompatible relationships.

The Next Step with AutoLineage – Adding Genealogical Trees to the Mix

We’ve seen AutoTree and AutoKinship. The new upgraded AutoLineage adds genealogical tree information to genetic information by allowing the user to:

  • Import other trees
  • Integrate most recent common ancestors (MRCAs) in AutoKinship trees
  • Set known relationships
  • Provide generational information.

AutoLineage, Genetic Affairs’ online clustering and tree-building tool, has been around for several years but was recently upgraded to create trees based on shared DNA and incorporate genealogical evidence.

This is where the proverbial rubber meets the road.

Setting Up AutoLineage

Return to the home page at Genetic Affairs and select AutoLineage.

If you’re new to this tool, you’ll see a simplified workflow on the start page that walks you through the process.

First, create a profile representing the DNA test taker – in my case, that’s me.

After creating the profile, you’ll be redirected to the landing page of the profile. From there, you can register DNA tests linked to the profile. From the home page, you can see the different profiles.

You’ll register a new FamilyTreeDNA test specifically for each user whose kit you manage and who took a test.

FamilyTreeDNA is the only DNA testing company for which Genetic Affairs runs automated analyses on their site.

Additionally, you can:

Importing the Data

After registering a FamilyTreeDNA test, you are redirected to the overview of this DNA page, where matches are imported.

Click on “Import matches” and select the CSV file from Genetic Affairs. Here’s where that AutoKinship report we generated earlier comes in handy. The unzipped report contains match and shared match information that we can import directly into AutoLineage.

Navigate to the gephi folder in your report and select the nodes.csv file to import your matches.

After importing the matches, a short dialog shows how many matches were imported.

After closing the dialog box, the DNA matches pane is opened.

You’ll see your DNA matches that were downloaded.

Next, import the shared match information from the edges.csv file in the same gephi folder.

Once both data sets are imported, you’ll see that the ICW (In Common With) column has populated, showing how many shared matches are available for each DNA match.

Clustering in AutoLineage

Now, with the shared match data loaded, you can perform your own clustering analysis.

The wizard allows you to set parameters for which matches to include based on:

  • The amount of shared cMs
  • Weighted or unweighted clustering
  • How much DNA is shared between shared matches

You can also define the cluster characteristics, from sparse to very dense clusters.

Last, you can select the coloring scheme. After setting the parameters, click on “Start Clustering,” at bottom right.

After clustering is finished, the clustering chart is displayed. It looks fairly similar to the ones obtained automatically from Genetic Affairs, but with some differences.

The first thing I noticed is that the large orange cluster 1 in the automated clustering is now mostly represented by the purple cluster 4.

Let’s zoom in on this cluster. By looking more closely at the numbers contained in each cluster, you can already make an estimated guess about the richness in relationship information for cluster members. This cluster has lots of close relationships. Clusters whose matches only share a small amount of DNA with each other are not the best candidates for an AutoKinship analysis because they most likely share a distant common ancestor. Unless, of course, it’s a distant ancestor you’re searching for. (Hello brick wall.)

Adding and Importing Tree Information

Now that we have the new clusters, we could continue to directly run the tree reconstruction on these clusters using the shared DNA information, but let’s wait  since we want to include the tree information as well to guide this process.

To use common ancestors, we need to import the available trees that are linked to the DNA matches. Luckily, just like (shared) match information, the tree information is provided with the automated analysis as well. Let’s import the data.

First, navigate to the tree management page. As you can see, no trees have been created or imported. Let’s start the wizard by clicking on the “Import Trees” button.

An “Import tree” wizard pops up, providing different ways to import tree information. It’s also possible to import GEDCOM files or tree data from other resources, but for now, I’m only using the archived trees at FamilyTreeDNA.

Click on the last option and select the files.

Navigate to the matches folder and select the HTML files contained in the folder.

Each file represents a DNA match report, some of which have a tree associated with them.

After importing the trees, they are automatically associated with the concerned DNA matches (using the unique identifier present in each file name). The tree overview page shows which tree is linked to a profile or DNA test, and the amount of DNA shared with the linked DNA match.

If you have created trees for your matches based on your own research (like quick and dirty trees), now is the time to import these using the “Import Tree” wizard again. This is a wonderful feature, because it means you’re not entirely dependant on your match having uploaded a tree themselves.

If you don’t import trees from GEDCOMs, you don’t need the linking wizard.

Click on the “Import Tree” wizard and select the GEDCOM option.

Now that we have imported additional trees, we need to associate them with DNA matches.

You can use a wizard to link the unlinked trees to the DNA matches, or link them from each DNA match. The wizard will try to guestimate, based on the content of the tree file name, which DNA match could be associated with the tree. Change the search criteria if it does not provide the correct results.

TIP: Save the GEDCOM files with the name of the linked DNA match as well the shared cM, which speeds up the importing process

Don’t forget to import your own tree. I imported my GEDCOM file from my computer genealogy software and associated it with my profile so it’s included in the common ancestor identification. You can easily upload your GEDCOM from your computer software, or download your tree from either Ancestry or MyHeritage to upload here.

Visit the profile, and select the tree pane. The tree pane only shows a single individual and allows you to add ancestors to it manually. To associate that individual with an existing tree, click on “Link to Existing Tree”.

A wizard will be displayed, which shows all available trees on the left side. Sort by clicking on the “Created” column to display the most recent trees.

Next, you need to select the root person.

I selected my tree.

Next, the right side of the wizard fills with the people in the selected tree. Select the root person, which is me, and click on “Save” in the lower right corner.

Finding Common Ancestors

Now that we have associated a tree with the profile and imported trees for the FamilyTreeDNA matches, it’s time to locate some common ancestors. Fingers crossed!

Go back to the profile and select the profile overview. Scroll down to the “Find common ancestors” section and click on the “Find common ancestors” button.

The “common ancestors” wizard shows trees that are associated with this profile in the table on the left and provides information about the different steps on the right. You can change the settings to make the search more restrictive or more relaxed.

After running the common ancestor identification, a dialog shows the number of trees and tree persons that were used, and the number of common ancestors that were identified.

After the analysis runs, you’ll be able to view all reconstructed trees or filter them based on common ancestors, trees, or linked DNA matches.

Common ancestors, not surprisingly, often align closely with what the automated analysis discovered.

All six testers are now shown descending from our common ancestor, in the approximate location where they will fit in our common tree.

But we aren’t quite finished yet.

The Final AutoKinship Analysis

Finally, we’ve arrived. The earlier steps were necessary to pave the way.

We have the common ancestors and clusters, and it’s time to go back to the clusters to begin the reconstruction of trees using trees combined with DNA.

Click on the profile and go to the clustering results pane. Select the 1x view, which will show the clustering chart.

Now select the matches pane that shows the different matches that are contained in each cluster. Scroll down until you reach your cluster of interest, which is four for me.

After clicking on any cluster, you’ll be redirected to a cluster view with only the information for that particular cluster.

Let’s view purple cluster 4, which looks fairly dense, with only a couple of empty cells, indicating that these shared matches with white cells did not share (enough) DNA with each other to be included in the cluster. Now select the matches pane in the dashboard at the top of this cluster, which displays the matches linked to this specific cluster. As you can see, a button is now available that allows us to run the AutoKinship analysis. Click on the button.

Single cluster matches are displayed.

Now back to the wizard.

The wizard provides several important parameters:

  • Maximum number of generations between DNA matches
  • Number of trees to analyze in each iteration
  • Final number of trees to keep
  • Whether to include known relationships and/or MRCA (Most Recent Common Ancestor) relationships

In this example, MRCA relationships were found because we performed the common ancestor identification that resulted in common ancestors between the matches of this cluster.

If you know specific relationships between matches, you can set those manually. Sometimes you might not know the exact relationship, but if you can estimate that a match is one or more generations older or younger than yourself, you can set that too.

In addition to setting the relationship between the test taker (indicated in green in the table) and the DNA matches, it’s also possible to set the relationship between shared matches, if known.

The Hybrid Results

After the analysis has finished, an overview of the identified trees is presented.

The final result is a blended tree where DNA evidence fills in the blanks for matches who haven’t uploaded trees, or you haven’t provided a tree, and known genealogy supports the structure where it exists. This hybrid approach gives us the best of both worlds – the precision of documented genealogy combined with the discovery power of DNA analysis.

I particularly like this approach, because when I identify how a DNA match is related to me from any vendor, I enter their lineage in my desktop genealogy software. Therefore, using that GEDCOM file is the most complete source of my identified relatives.

Testers 1-6 were shown using the regular AutoTree, without the integrated tree, but an additional 11 matches were placed for consideration using all available tools.

I was using this as an experiment because I know how most people in this cluster are related, and those are all placed accurately. There is one person, located on the branch between 1 and 5, who I had no idea how they fit into this puzzle. Now, at least I know where to look.

I can’t imagine trying to do all of this manually.

Why This Matters

For those of us dealing with unknown parent or grandparent situations, poorly documented lines, non-existent trees, or just plain stubborn brick walls, this combination of tools is nothing short of amazing. You can now explore relationship hypotheses even when traditional documentation is scarce.

The reconstructed trees show how common ancestor information provides the template, while the AutoLineage tool fills gaps using shared DNA information. The updated AutoLineage is the genealogical assistant that never gets tired and can deal with relationship possibilities much more effectively than traditional hand-based methods.

In Summary

If you haven’t explored Genetic Affairs recently, give it a look. The integration between AutoKinship and AutoLineage represents a significant step forward in DNA analysis.

While AutoKinship offers valuable insights on its own, its full potential is truly unlocked when you export the data into AutoLineage. The combination creates a comprehensive analysis that was previously impossible.

For researchers dealing with complex family relationships or challenging genealogical puzzles, this hybrid approach that combines matches at FamilyTreeDNA with DNA evidence and genealogical trees could be the key to breaking through stubborn brick walls that nothing else has budged.

Last but not least, I suggest reading Dr. Patricia Coleman’s blog articles about these tools and her methodologies here and here. Patricia works extensively with these tools, and I often recommend her for private autosomal research consultations. Patricia’s 2026 RootsTech Session, DNA Case Study: Finding an 1877 Birth Father with Genetic Affairs, BanyanDNA, and No Birth Record, details her work solving a long-standing problem for my cousin in the Speaks family.

_____________________________________________________________

Share the Love!

You’re always welcome to forward articles or links to friends and share on social media.

Subscribe!

If you haven’t already subscribed, it’s free. You’ll receive an e-mail whenever I publish by clicking the “follow” button at the top of the main blog page, here.

Help Keep This Blog Free

I receive a small commission when you click a vendor link in my articles and purchase that item. This does NOT increase your price but helps me keep the lights on and this informational blog free for everyone. Please click on the affiliate links in the articles or to the vendors below if you are purchasing products or DNA testing.

Thank you so much.

DNA Purchases and Free Uploads

Genealogy Products and Services

My Books

Genealogy Books

Genealogy Research

2025 Genetic Genealogy Retrospective: Wow – What a Year!

2025 has been quite a year in genetic genealogy. Genetic genealogy, per se, really isn’t a separate “thing” anymore. DNA testing is now an integral part of genealogy, with the potential to answer questions that nothing else can!

The 76 articles I wrote in 2025 fall into multiple categories and focus on different topics based on what was happening in the industry.

From my perspective, here are the most notable announcements and trends in genetic genealogy, and genealogy more broadly.

#1 for 2025 – Mitochondrial DNA: The Million Mito Project Released the New Mitotree, Updates, and mtDNA Discover

The biggest genealogy news items this year, both industry-wide and genealogy-changing are definitely the release of the new Mitotree, plus two tree updates. But that’s not all.

In addition, full sequence mitochondrial DNA testers received new Mitotree haplogroups, if appropriate, and everyone received a haplotype – a new feature. Along with Mitotree, FamilyTreeDNA introduced mtDNA Discover which provides 13 individual reports based on your haplogroup and matches.

It’s no wonder that mitochondrial DNA articles led the pack with the most views based on the eleven articles about that topic. If you haven’t yet tested your mitochondrial DNA at FamilyTreeDNA, there’s no better time! You never know what you’re going to discover and the more testers, the more matches for everyone.

You don’t know what you don’t know, and you’ll never know if you don’t test. Remember, mitochondrial DNA is for both males and females and tests your mother’s direct matrilineal line (mother to mother to mother, etc.) – reaching beyond known surnames.  Click here to order or upgrade.

#2 – MyHeritage Low Pass Whole Genome Sequence Test Charges into the Future

Another big hitter is the new MyHeritage low-pass whole genome test (WGS) test. It’s new and innovative, but we haven’t seen comparative results yet.

My results from the new low-pass whole genome test just came back, and I haven’t had the opportunity to review them yet, as compared to the earlier tests. That said, I do have roughly the same number of matches, but I need to determine if they are the same matches, and how well they track. I’ll be working on that review soon.

The new whole genome test may be more about future proofing and preparedness than additional current benefit – but we will see. I definately wanted to take the whole genome test so I can receive and benefit from whatever new is coming down the pike.

MyHeritage allows you to maintain multiple DNA tests on your account, so the new whole genome won’t “replace” your older or uploaded test. That way, you can easily compare the results of the whole genome against any DNA test that you curently have at MyHeritage.

Click here to order the new test.

#3 – 23andMe Experiences Problems

On a less positive note, but still quite newsworthy is the bankruptcy of 23andMe and subsequent repurchase of 23andMe by the original founder after setting up a new nonprofit. I have real mixed feelings about this topic. However, 23andMe was really never about genealogy, and now, matching segment information is no longer available. Those searching for unknown parents or family may want to test there if they are unsuccessful elsewhere.

Best Genealogy Tool

The FamilySearch full text search continues to have a HUGE impact for genealogists. This tool is not one-and-done, but provides increasing amounts of rich information as more records are added to the “fully scanned” collection. If you haven’t tried it, please do. It’s a game-changer and continues to improve.

A Cautionary Word About AI – Artificial Intelligence

AI is such a hot topic right now that I feel it needs to be included.

The FamilySearch full text search uses a form of AI. However, you’ll quickly notice that it can’t read everything, gets words and names wrong, and if you actually need to fully depend on it for accuracy, you cannot. (That said, it’s still an amazing tool, and I’m not picking on FamilySearch.)

Aside from FamilySearch, AI in its current form is both wonderful and terrible. I’ll be writing about AI in the new year, but for now, don’t ever rely on AI for anything that you can’t verity. It’s your assistant, not an expert, no matter how insistent it is. Never trust and always verify.

This is ESPECIALLY TRUE WHEN RELATED TO GENETICS and genetic related topics. I can’t even begin to tell you how very wrong it has been, and how much people fall in love with inaccurate results. No, just no – at least for now.

You need to know your AI tool, your skill set, your understanding of AI broadly, the tool’s limitations, and yours, and that’s all before verifying the actual AI results. If you want to educate yourself, and everyone should, treat yourself to anything, anyplace by either Mark Thompson or Steve Little, the dynamic AI duo. They offer YouTube videos and classes in a wide variety of places – but keep in mind that AI tools and technology literally change every few weeks.

AI is, indeed, a specialty all unto itself, much like genetic genealogy. And right now, it’s not soup yet, but it is cooking.

Tried and True Genetic Genealogy Staples – DNAPrint and Genetic Affairs

I haven’t written about either one this year, but I use both DNAPainter and Genetic Affairs regularly.

I consistently paint segments from matches at both MyHeritage, FamilyTreeDNA, and GEDmatch that are newly identified to an ancestor or ancestral couple at DNAPainter.

Unfortunately, neither Ancestry nor 23andMe provide matching cM location information for your matches (chromosome browser), but you may find some people who have tested at those companies at both FamilyTreeDNA and GEDmatch if they have uploaded to either of those vendors. Both vendors provide segment information and a Chromosome Browser, enabling you to paint that information to DNAPainter when you can identify your common ancestor.

MyHeritage also provides a Chromosome Browser, but unfortunately, no longer accepts uploads from any other vendor. You can paint segments from MyHeritage, but no longer upload DNA files to MyHeritage.

Thanks to DNAPainter, I have 90% of my segments identified to specific ancestors – which is actually rather remarkable given that my mother’s grandfather was a Dutch immigrant, and her great-grandparents on her other side were German immigrants, meaning we don’t have many matches on either of those lines.

Genetic Affairs continues to develop new, advanced clustering tools, one of which I’ll be reviewing soon.

Major Vendor Releases

Aside from what’s listed above, most of the major vendors released new features.

MyHeritage released a VERY COOL new tool called Cousin Finder that finds your relatives in the MyHeritage database, whether they match you on a DNA test, or not. They may not have even taken a DNA test. Cousin Finder identifies your common ancestor and shows your relationships. It’s a wonderful way to initiate communications, discuss your common ancestors, and ask about DNA testing.

Of my 378 Cousin Finder matches, only 23 (about 6%) are on my DNA match list, so that leaves 355 people to message, several of whom represent Y-DNA and mtDNA lines I don’t have. You can bet I’ll be offering testing scholarships.

Additionally, MyHeritage released a new ethnicity version.

FamilyTreeDNA, in addition to the new Mitotree, Discover, and associated features, released a new match matrix so you can see if and how selected matches are related to each other in a grid format. In other words, you can create your own cluster.

A new built-in “Share” feature blurs private information to make sharing easier both on the website and in Discover.

Discover improvements include thousands of new Y-DNA and mtDNA tree branches, plus thousands of new Ancient DNA samples. Discover is evergreen, so once you’ve taken that Big Y-700 test or the mitochondrial DNA test, your learning never stops as more content is added.

Tree integration with WikiTree is super-easy and means you don’t have to choose between trees. You can choose to retain your archived tree at FamilyTreeDNA, or move your tree to MyHeritage, PLUS link yourself to your family at WikiTree.

Ancestry released match clustering and a new beta pedigree view of ThruLines, but that’s back in the shop for more work. I’d expect to see it rereleased in 2026.

Conferences

RootsTech is the granddaddy of genealogy conferences, and it’s always fun to attend and write about the experience. Many vendors release new tools or products during the conference.

The ECGGC (East Coast Genetic Genealogy Conference), held in the fall, is the only conference that focuses entirely on genetic genealogy, new tools, how to use existing tools, and more. The 2025 conference was virtual and provided a great deal of focused content. Attendees particularly appreciate the deep dive in a particular topic presented in DNA Academy.

I’ll be at RootsTech in 2026, will write about that soon, and hope to see you there.

Concepts, Techniques and Plain Old Genealogy

In the past, my Concepts series and genealogy “how to” articles have been very popular, so, in 2025, I penned a half-dozen articles focusing on frequently asked questions about relationships and DNA.

For example, how does one go about finding DNA testing candidates? The number of options may surprise you and includes both Cousin Finder and Relatives at RootsTech.

By testing ONE PERSON for either Y-DNA or mitochondrial DNA that represents an ancestor, you actually receive information about that entire lineage of ancestors. So, on my Estes line, by locating an Estes male from my line to test, I received relevant information for every Estes male in my line, back to and beyond the progenitor.

Eventually, we hit a brick wall in every line, and those tools are the perfect way to break through those brick walls.

Other articles discuss things like how to use Discover’s Ancient Connections, and the difference between half and full relationships, both in your tree and genetically. Plus, what does a cousin “once removed” mean anyway? And why do I care?

Another question I receive is how far back, based on the shared amount of DNA, should I look in my matches’ trees for our common ancestor? In other words, how many generations back should I click? That article was fun and produced some unexpected results.

Memorial Articles

Because we are part of a community, I write memorial articles when one of our friends passes on. This year, sadly, Schelly Talalay Dardashti, well-known Jewish genealogist, and another very close friend joined the ancestors, so I’ve recognized the best in both of their lives which constitutes their legacy.

Be the Storyteller

Last, but not least, I wrote about my ancestors in the “52 Ancestors” series, which launched several years ago with Amy Johnson Crow’s challenge to write about one ancestor per week. She hosts this every year, and you can join (free) now.

I’m now on ancestor #467, so yes, it’s addictive, but it’s also AMAZING how many wonderful cousins I’ve met who have information that I did not. Not only that, but after publishing about an ancestor, I’ve discovered that I’m related to people I’ve known for years. We were SOOOooo excited!

I’ve been writing about the lives of my ancestors for several years now, and the articles include attempts to identify Y-DNA and mtDNA testers for each ancestor, where appropriate. There’s so much to learn that can’t be revealed any other way.

Plus, people seem to like the “mystery” and “short story” aspect, and I salt each story with the history of the region and relevant historical events of the timeframe. You might find your ancestors here too, or other helpful information.

Find a way to share about your ancestors!

Do You Have Suggestions for 2026 Topics?

Do you have suggestions or requests for article topics in 2026? If so, please comment on this article and let me know.

Check Out the 2025 List

Here’s the list of the 2025 articles. Did you miss something fun? Enjoy!

  Title Category Date Link
1 Welcome to 2025 – Opportunities and New Genetic Genealogy Articles Welcome, general 1-2-2025 https://dna-explained.com/2025/01/02/welcome-to-2025-opportunities-and-new-genetic-genealogy-articles/
2 Anne Doucet (1713-1791), Oceans, Rivers, and Perseverance – 52 Ancestors #438 52 Ancestors 1-4-2025 https://dna-explained.com/2025/01/04/anne-doucet-1713-1791-oceans-rivers-and-perseverance-52-ancestors-438/
3 Register for RootsTech 2025 Now RootsTech 1-16-2025 https://dna-explained.com/2025/01/16/register-for-rootstech-2025-now/
4 What IS the McNeil Family History, by George Franklin McNeil – 52 Ancestors #439 52 Ancestors 1-19-2025 https://dna-explained.com/2025/01/20/what-is-the-mcneil-family-history-by-george-franklin-mcneil-52-ancestors-439/
5 Jean Garceau dit Tranchemontagne (c1785-1711), Soldier from Saint Marseault – 52 Ancestors #440 52 Ancestors 1-29-2025 https://dna-explained.com/2025/01/29/jean-garceau-dit-tranchemontagne-c1785-1711-soldier-from-saint-marseault-52-ancestors-440/
6 Memories Resurface When the Old Family Home Gets a Facelift Genealogy 2-3-2025 https://dna-explained.com/2025/02/03/memories-resurface-when-the-old-family-home-gets-a-facelift/
7 MyHeritage Introduces Ethnicity v2.5 MyHeritage 2-6-2025 https://dna-explained.com/2025/02/06/myheritage-introduces-ethnicity-v2-5/
8 Relatives at RootsTech Reveals Cousins and Provides DNA Candidates RootsTech, techniques 2-8-2025 https://dna-explained.com/2025/02/08/relatives-at-rootstech-reveals-cousins-and-provides-dna-candidates/
9 FamilyTreeDNA’s New Matrix Shows How Your Matches Are Related to Each Other FamilyTreeDNA 2-12-2025 https://dna-explained.com/2025/02/12/familytreednas-new-matrix-shows-how-your-matches-are-related-to-each-other/
10 René Doucet (c1680-c1731), Lifetime of Incessant Upheaval – 52 Ancestors #441 52 Ancestors 2-15-2024 https://dna-explained.com/2025/02/16/rene-doucet-c1680-c1731-lifetime-of-incessant-upheaval-52-ancestors-441/
11 Lineages Versus Ancestors – How to Find and Leverage Yours Techniques 2-23-2025 https://dna-explained.com/2025/02/23/lineages-versus-ancestors-how-to-find-and-leverage-yours/
12 Mitotree is Born Mitochondrial DNA 2-25-2025 https://dna-explained.com/2025/02/25/mitotree-is-born/
13 RootsTech 2025 – The Year of Discover and the New Mitotree RootsTech, Mitochondrial DNA 3-14-2025 https://dna-explained.com/2025/03/15/rootstech-2025-the-year-of-discover-and-the-new-mitotree/
14 Pierre Doucet (c1621-1713), Walking History Book Lived to Nearly 100 – 52 Ancestors #442 3-16-2025 https://dna-explained.com/2025/03/16/pierre-doucet-c1621-1713-walking-history-book-lived-to-nearly-!100-52-ancestors-442/
15 Welcome to the New FamilyTreeDNA mtDNA Group Mitochondrial DNA 3-17-2025 https://dna-explained.com/2025/03/17/welcome-to-the-new-familytreedna-mtdna-group/
16 23andMe Files for Bankruptcy – What You Need to Know! 23andMe 3-24-2025 https://dna-explained.com/2025/03/25/23andme-files-for-bankruptcy-what-you-need-to-know/
17 New “Share” Features at FamilyTreeDNA Blur Match Information and Make Sharing Easy FamilyTreeDNA 4-1-2025 https://dna-explained.com/2025/04/01/new-share-features-at-familytreedna-blur-match-information-and-make-sharing-easy/
18 The Chauvet Cave: Trip Back in Time with Prehistoric European Humans – Are We Related? History, DNA 4-6-2025 https://dna-explained.com/2025/04/06/the-chauvet-cave-trip-back-in-time-with-prehistoric-european-humans-are-we-related/
19 DNA for Native American Genealogy Webinar & Companion Book Native American 4-8-2025 https://dna-explained.com/2025/04/08/dna-for-native-american-genealogy-webinar-companion-book/
20 Marie Levron (c1686-1727), Tragedy from Cradle to Grave – 52 Ancestors #443 52 Ancestors 4-14-2025 https://dna-explained.com/2025/04/14/marie-levron-c1686-1727-tragedy-from-cradle-to-grave-52-ancestors-443/
21 Mitochondrial DNA: What is a Haplotype Cluster and How Do I Find and Use Mine Mitochondrial DNA 4-14-2025 https://dna-explained.com/2025/04/14/mitochondrial-dna-what-is-a-haplotype-cluster-and-how-do-i-find-and-use-mine/
22 New Mitotree Haplogroups and How to Utilize Them for Genealogy Mitochondrial DNA 4-23-2025 https://dna-explained.com/2025/04/23/new-mitotree-haplogroups-and-how-to-utilize-them-for-genealogy/
23 Sir Francois Levron dit Nantois(c1651-1714), and Acadia’s Pirate – 52 Ancestors #444 52 Ancestors 4-26-2025 https://dna-explained.com/2025/04/27/sir-francois-levron-dit-nantois-c1651-1714-and-acadias-pirate-52-ancestors-444/
24 Catherine Savoie (c1661-c1722/25), Whispered Threads Weave a Tapestry of Life – 52 Ancestors #445 52 Ancestors 5-4-2025 https://dna-explained.com/2025/05/04/catherine-savoie-c1661-c1722-5-whispered-threads-weave-a-tapestry-of-life-52-ancestors-445/
25 Discover’s Ancient Connections – How Are You Related? Discover, Ancient DNA 5-8-2025 https://dna-explained.com/2025/05/08/discovers-ancient-connections-how-are-you-related/
26 Mother’s Day and Legacies 52 Ancestors, Genealogy 5-10-2025 https://dna-explained.com/2025/05/11/mothers-day-and-legacies/
27 The Mystery of the Blue Fugates and Smiths: A Study in Blue Genes and Pedigree Collapse Genetics, Genealogy 5-18-1015 https://dna-explained.com/2025/05/19/the-mystery-of-the-blue-fugates-and-smiths-a-study-in-blue-genes-and-pedigree-collapse/
28 Regeneron Wins Bid for Bankrupt 23andMe – Wedding Planned 23andMe 5-19-2023 https://dna-explained.com/2025/05/19/regeneron-wins-bid-for-bankrupt-23andme-wedding-planned/
29 Francois Savoie’s Homestead Rediscovered – 52 Ancestors #446 52 Ancestors 5-24-2025 https://dna-explained.com/2025/05/24/francois-savoies-homestead-rediscovered-52-ancestors-446/
30 Memorial Day – Some Gave All Memorial 5-25-2025 https://dna-explained.com/2025/05/25/memorial-day-some-gave-all/
31 Mitotree Webinar – What It Is, How We Did It, and What Mitotree Means to You Mitochondrial DNA 6-4-2025 https://dna-explained.com/2025/06/04/mitotree-webinar-what-it-is-how-we-did-it-and-what-mitotree-means-to-you/
32 Catherine LeJeune (c1633-1671/1686), Meet Your Grandchildren – 52 Ancestors #447 52 Ancestors 6-7-2025 https://dna-explained.com/2025/06/07/catherine-lejeune-c1633-1671-1686-meet-your-grandchildren-52-ancestors-447/
33 Mitotree Q&A for Everyone Mitochondrial DNA 6-11-2025 https://dna-explained.com/2025/06/11/mitotree-qa-for-everyone/
34 Father’s Day: Bravery and Love 52 Ancestors, Genealogy 6-14-2025 https://dna-explained.com/2025/06/14/fathers-day-bravery-and-love/
35 Francoise Bourgeois (c1659-1693/1697), High Drama in Beaubassin and Terror at Port Royal – 52 Ancestors #448 52 Ancestors 6-16-2025 https://dna-explained.com/2025/06/16/francoise-bourgeois-c1659-1693-97-high-drama-in-beaubassin-and-terror-at-port-royal-52-ancestors-448/
36 Requesting Suggestions for RootsTech 2026 Topics RootsTech 6-18-2025 https://dna-explained.com/2025/06/18/requesting-suggestions-for-rootstech-2026-topics/
37 FamilyTreeDNA and WikiTree Collaboration – In Two Easy Steps!! FamilyTreeDNA, WikiTree 6-25-2025 https://dna-explained.com/2025/06/25/familytreedna-and-wikitree-collaboration-in-two-easy-steps/
38 Jacques Bourgeois (c1620-c1700), Surgeon of Port Royal – 52 Ancestors #449 52 Ancestors 7-1-2025 https://dna-explained.com/2025/07/01/jacques-bourgeois-c1620-c1700-surgeon-of-port-royal-52-ancestors-449/
39 TTAM, a Nonprofit Formed by 23andMe’s Founder Now Plans to Buy 23andMe 23andMe 7-1-2025 https://dna-explained.com/2025/07/01/ttam-a-nonprofit-formed-by-23andmes-founder-now-plans-to-buy-23andme/
40 Jacques Bourgeois: Complex Acadian, Founder of Beaubassin – 52 Ancestors #450 52 Ancestors 7-6-2025 https://dna-explained.com/2025/07/06/jacques-bourgeois-complex-acadian-founder-of-beaubassin-52-ancestors-450/
41 How to Use Ancestry’s New Match Clusters and What They Mean Ancestry 7-10-2025 https://dna-explained.com/2025/07/10/how-to-use-ancestrys-new-match-clusters-and-what-they-mean/
42 Walk with Your Ancestors: Peace, Light and Healing in an Abandoned Medieval Village History 7-21-2025 https://dna-explained.com/2025/07/21/walk-with-your-ancestors-peace-light-and-healing-in-an-abandoned-medieval-village/
43 Jeanne Trahan (c1629-c1699), Life in Chinon, La Heve, Port Royal, and Beaubassin – 52 Ancestors #451 52 Ancestors 8-2-2025 https://dna-explained.com/2025/07/28/jeanne-trahan-c1629-c1699-life-in-chinon-la-heve-port-royal-and-beaubassin-52-ancestors-451/
44 Wherefore Art Thou, Oh Ancestor – New Generation Tree Chart Suggests Where to Look in Your Matches’ Trees Techniques, Genetics, Genealogy 8-2-2025 https://dna-explained.com/2025/08/02/wherefore-art-thou-oh-ancestor-new-generation-tree-chart-suggests-where-to-look-in-your-matches-trees/
45 Guillaume Trahan (c1601-1625), More Than Meets the Eye – 52 Ancestors #452 52 Ancestors 8-13-2025 https://dna-explained.com/2025/08/13/guillaume-trahan-c1601-c1684-more-than-meets-the-eye-52-ancestor-452/ 
46 The East Coast Genetic Genealogy Conference – ECGGC – Register Now for the Best of the Best ECGGC Conference 8-14-2025 https://dna-explained.com/2025/08/14/the-east-coast-genetic-genealogy-conference-ecggc-register-now-for-the-best-of-the-best/
47 Schelly Talalay Dardashti – May Her Memory Be a Blessing Memorial 8-17-2025 https://dna-explained.com/2025/08/17/schelly-talalay-dardashti-may-her-memory-be-a-blessing/
48 Francoise Corbineau (c1609-c1665), Bride in Chinon, Founder of Acadia – 52 Ancestors #453 52 Ancestors 8-25-2025 https://dna-explained.com/2025/08/23/francoise-corbineau-c1609-c1665-bride-in-chinon-founder-of-acadia-52-ancestors-453/
49 Nicolas Trahan (c1570->1632), Life in the Heart of French Wine Country – 52 Ancestors #454 52 Ancestors 8-31-2015 https://dna-explained.com/2025/08/31/nicolas-trahan-c1570-1632-life-in-the-heart-of-french-wine-country-52-ancestors-454/
50 Mitochondrial DNA A-Z: A Step-by-Step Guide to Matches, Mitotree, and mtDNA Discover Mitochondrial DNA, Discover, Genealogy, Techniques 10-2-2025 https://dna-explained.com/2025/09/02/mitochondrial-dna-a-z-a-step-by-step-guide-to-matches-mitotree-and-mtdna-discover/
51 Renée Desloges (c1570-1627/1632), Fragments of Life in Montreuil-Bellay – 52 Ancestors #454 (this is actually 455) 52 Ancestors 9-6-2025 https://dna-explained.com/2025/09/06/renee-desloges-c1570-1627-1632-fragments-of-life-in-montreuil-bellay-52-ancestors-454/
52 Best Mitochondrial DNA Presentation EVER – You’re Invited to DNA Academy!! Mitochondrial DNA 9-9-2025 https://dna-explained.com/2025/09/09/best-mitochondrial-dna-presentation-ever-youre-invited-to-dna-academy/
53 Unfillable Shoes Memorial – Douglas Rhodenbaugh 9-14-2025 https://dna-explained.com/2025/09/14/unfillable-shoes/
54 Concepts: What Does a Cousin “Once Removed” Mean? Concepts, Genealogy 9-24-2025 https://dna-explained.com/2025/09/24/concepts-what-does-a-cousin-once-removed-mean/
55 Daniel Vannoy (1752-after 1820), “Lived in the Boundary of the Cherokee Indians” – Say What??? 52 Ancestors 9-29-2025 https://dna-explained.com/2025/09/29/daniel-vannoy-1752-after-1820-lived-in-the-boundary-of-the-cherokee-indians-say-what/
56 Daniel Vannoy and the Strange Case of the Two Sarahs – 52 Ancestors #457 52 Ancestors 10-5-2025 https://dna-explained.com/2025/10/06/daniel-vannoy-and-the-strange-case-of-the-two-sarahs-52-ancestors-457/
57 Cousin Finder – MyHeritage’s Innovative New Tool Finds Your Relatives MyHeritage 10-9-2025 https://dna-explained.com/2025/10/09/cousin-finder-myheritages-innovative-new-tool-finds-your-relatives/
58 Sarah Hickerson Vannoy (c1761 – after 1826), Threw More than Shade – 52 Ancestors #458 52 Ancestors https://dna-explained.com/2025/10/13/sarah-hickerson-vannoy-c1761-after-1826-threw-more-than-shade-52-ancestors-458/
59 MyHeritage Introduces a Low-Pass Whole Genome Autosomal DNA Test & Why It Matters MyHeritage 10-14-2025 https://dna-explained.com/2025/10/14/myheritage-introduces-a-low-pass-whole-genome-autosomal-dna-test-why-it-matters/
60 Henriette Pelletret (c1640 – before 1694), Life Death in the Shadow of the Fort – 52 Ancestors #459 52 Ancestors 10-21-2025 https://dna-explained.com/2025/10/21/henriette-pelletret-c1640-before-1694-life-and-death-in-the-shadow-of-the-fort-52-ancestor-459/
61 Cheat Sheet: Mitochondrial Matches, Haplotype Clusters, and Haplogroups Mitochondrial DNA 10-22-2025 https://dna-explained.com/2025/10/22/cheat-sheet-mitochondrial-matches-haplotype-clusters-and-haplogroups/
62 Simon Pelletret (1610-1642/1645): A Walk Through Port Royal – 52 Ancestors #460 52 Ancestors 10-27-2025 https://dna-explained.com/2025/10/27/simon-pelletret-c1610-1642-1645-a-walk-through-port-royal-52-ancestors-460/
63 Perrine Bourg (c1626-1693/1698): Phoenix Rising from the Ashes – 52 Ancestors #461 52 Ancestors 11-2-2025 https://dna-explained.com/2025/11/02/perrine-bourg-c1626-1693-1698-phoenix-rising-from-the-ashes-52-ancestors-461/
64 Concepts: What is a Half Relationships, Life Half First Cousins, Anyway? Concepts, Genealogy 11-4-2025 https://dna-explained.com/2025/11/04/concepts-what-is-a-half-relationship-like-half-first-cousins-anyway/
65 Marie Broussard (1686-after 1752), Life Across the River from Port Royal – 52 Ancestors #462 52 Ancestors 11-10-2025 https://dna-explained.com/2025/11/10/marie-broussard-1686-after-1752-life-across-the-river-from-port-royal-52-ancestors-462/
66 Francois Broussard (1653-1716), Intractable Acadian – 52 Ancestors #463 52 Ancestors 11-22-2025 https://dna-explained.com/2025/11/22/francois-broussard-1653-1716-intractable-acadian-52-ancestors-463/
67 Mitotree Sprouts 12,773 New Branches and Includes Ancient DNA Mitochondrial DNA 11-24-2025 https://dna-explained.com/2025/11/24/mitotree-sprouts-12773-new-branches-and-includes-ancient-dna/
68 Catherine Richard (c1663 – after 1714), Mother of Beausoleil, Acadian Freedom Fighters – 52 Ancestors #464 52 Ancestors 11-29-2025 https://dna-explained.com/2025/11/29/catherine-richard-c1663-after-1714-mother-of-beausoleil-acadian-freedom-fighters-52-ancestors-464/
69 Ancestry’s ThruLines Has a New Pedigree View Ancestry 12-2-2025 https://dna-explained.com/2025/12/03/ancestrys-thrulines-has-a-new-pedigree-view/
70 Ancestry Reverts ThruLines to the Original View Ancestry 12-6-2025 https://dna-explained.com/2025/12/06/ancestry-reverts-thrulines-to-the-original-view/
71 Michel Richard (c1630-1686/1689), Carefree Acadian – 52 Ancestors #465 52 Ancestors 12-7-2025 https://dna-explained.com/2025/12/08/michel-richard-dit-sansoucy-c1630-1686-1689-carefree-acadian-52-ancestors-465/ 
72 Mitochondrial DNA: How Do I Know if I’m a Candidate to Receive a New Haplogroup? Mitochondrial DNA 12-9-2025 https://dna-explained.com/2025/12/09/mitochondrial-dna-how-do-i-know-if-im-a-candidate-to-receive-a-new-haplogroup/
73 Heavens Ablaze: the 1833 Leonid Meteor Storm and Your Ancestors History, Genealogy 12-15-2025 https://dna-explained.com/2025/12/15/heavens-ablaze-the-1833-leonid-meteor-storm-and-your-ancestors/
74 Madelaine Blanchard (c1643 – 1678/1683), Gone Too Soon – 52 Ancestors #466 52 Ancestors 12-20-2025 https://dna-explained.com/2025/12/20/madelaine-blanchard-c1643-1678-1683-gone-too-soon-52-ancestors-466/
75 Soar Inspiration 12-24-2025 https://dna-explained.com/2025/12/24/soar/

_____________________________________________________________

Share the Love!

You’re always welcome to forward articles or links to friends and share on social media.

Subscribe!

If you haven’t already subscribed, it’s free. You’ll receive an e-mail whenever I publish by clicking the “follow” button at the top of the main blog page, here.

Help Keep This Blog Free

I receive a small commission when you click a vendor link in my articles and purchase that item. This does NOT increase your price but helps me keep the lights on and this informational blog free for everyone. Please click on the affiliate links in the articles or to the vendors below if you are purchasing products or DNA testing.

Thank you so much.

DNA Purchases and Free Uploads

Genealogy Products and Services

My Books

Genealogy Books

Genealogy Research

Mitochondrial DNA A–Z: A Step-by-Step Guide to Matches, Mitotree, and mtDNA Discover

People have been asking for a step-by-step guide for mitochondrial DNA, and here it is!

This article steps testers through all their results, page by page, including a dozen Discover reports, explaining what the information in each tool means. There’s SO MUCH great content provided, and you’ll want to absorb every tidbit.

This is meant to be a roadmap for you – a recipe card to follow to get the most out of your results.

You can either read through this article once, then sign on to your own account, or sign on now and follow along. Yes, this article is long, but it’s also a one-stop shop when you want information about any page or feature. Refer back to this article as needed, and feel free to forward it to others when they receive their results.

I’ve also provided additional resources for you at each step of the way, along with many tips and suggestions to help you help yourself.

I’m using the LeJeune sisters of Acadia as my example – in part because there were several questions about their heritage – including whether they were actually sisters, whether they were Native American, and if a third woman was also a sister.

Think about why you tested, and what you hope to learn so you know where to focus.

Everyone has their own motivation for testing, and we all want to extract as much information as possible. Some answers are genetic – thanks to mitochondrial, Y-DNA, and autosomal testing. Some answers are historical and genealogical. All of them need to mesh nicely together and confirm each other.

When they don’t, if they don’t, we need to understand how to discern the truth.

Every Ancestor Has a Mitochondrial DNA Story to Tell You

Sometimes it’s not our own results we’re analyzing, but the results of another tester – a cousin whose mitochondrial DNA represents a particular shared ancestor. We aren’t restricted to just our own mitochondrial DNA to decipher our ancestors’ stories.

What messages and secrets do those ancestors have to tell us? Our results read like the very best mystery novel ever – except it’s not a novel – it’s fact. And it’s ours!

Mitochondrial DNA is only passed from mothers to their children, never admixed or combined with the DNA of the father, so your mitochondrial DNA today is either exactly the same as that of your ancestors a few generations ago, or very close if a mutation has occurred between when they lived and today’s tester.

One of mitochondrial DNA’s strengths is that it can reach far back in time, it’s message undiluted and uninterrupted by recombination.

The messages from our ancestors are very clear. We just need to understand how to hear what they are telling us.

Step-by-Step Soup to Nuts

We will analyze the mitochondrial DNA results of multiple testers who descend from the LeJeune sisters, Edmee and Catherine, born in 1624 and 1633, respectively, to see what they have to tell their descendants. For a very long time, rumors abounded that their mother was Native American, so we will keep that in mind as we review all matching, Mitotree and mtDNA Discover tools provided by FamilyTreeDNA.

We will also learn how to evaluate seemingly conflicting information.

Soup to nuts – we will incorporate every sliver of information along the way and extract every morsel that can help you. Think of this article as your recipe and the reports and information as ingredients!

To be clear, you don’t HAVE to read all of this or decipher anything if you don’t want to. You can just glance at the matches and be on your way – but if you do – you’re leaving an incredible amount of useful information on the table, along with MANY hints that you can’t find elsewhere.

If there was an out-of-print book about this ancestral line in a rare book collection someplace, as a genealogist, you would drive half-way across the country to access that information. This is your rare book, that updates itself, and you don’t have to do anything other than take a mitochondrial DNA test, or find a cousin to take one for lines you don’t carry..

Come along and join the fun! Your ancestors are waiting!

The LeJeune Question

Recently, I wrote about my ancestor Catherine LeJeune, who was born about 1633, probably in France before her family settled in Acadia, present-day Nova Scotia.

The identity of her parents has been hotly contested and widely debated for a long time.

I intentionally did not address her DNA results in that article because I wanted to establish the historical facts about her life and address her mitochondrial DNA separately. The process we are following to analyze her DNA results is the same process everyone should follow, which is why we are taking this step-by-step approach, complete with detailed explanations.

Often, when people hit a brick wall with an ancestor, especially during European colonization of the Americas, someone suggests that the person surely “must be” Native American. Lack of records is interpreted to add layers of evidence, when, in fact, absence of evidence is not evidence of absence.

For example, for many of the earliest French Acadians, birth and baptism records have NOT been located in France, where massive record loss has been experienced.

Additionally, not all records that do exist have been indexed, transcribed, or digitized. Many are damaged and/or nearly impossible to read. Lack of records does NOT mean that those settlers weren’t French, or in this case, it does NOT indicate that they were Native American. It simply means we are lacking that piece of evidence.

Enter mitochondrial DNA.

This article is focused on how to use mitochondrial DNA to decode these messages from our ancestors. I’m providing a very short summary of the relevant historical factors about the LeJeune sisters so readers can keep this in mind as we review the 17+ tools waiting for us when mitochondrial DNA results are ready.

The First Acadian Settlers

The Acadians were French settlers in what is today Nova Scotia. The first Acadians arrived in LaHeve (LaHave), on the southern coast of Acadia, in 1632 after Acadia was returned to France from English control. There may or may not have been any French families in the original group, but if so, very few. In 1636, another group of settlers arrived, but no LeJeune is on the roster.

At the end of 1636, the fledgling Acadian colony was moved from LaHeve, on the southern coast, to Port Royal, a more protected environment.

While we don’t know exactly when the family of Catherine and Edmee LeJeune arrived, we can bracket the dates. We know that Catherine’s sister, Edmee LeJeune, born about 1624, married another settler, Francois Gautrot, about 1644 in Port Royal, so they had arrived by that time.

Edmee’s 1624 birth year is important for two reasons. First, there were no French settlers in the part of Acadia that became Nova Scotia in 1624, so that clearly demonstrates that Edmee was born in France.

It’s unlikely that Catherine was born in Acadia in 1633 given that the first known families arrived in 1636, and we have their names from the ship roster. Pierre Martin was on the 1636 ship, and Acadian history tells us that his son, Mathieu Martin, was the first French child born in Acadia, about 1636, based on the 1671 census.

We also know that there was an early Acadian man, Jean LeJeune, who was granted land at BelleIsle, near Port Royal, among other Acadian families, but he was deceased before the first Acadian census in 1671. Acadia was under English control again from 1654 to 1670, so Jean LeJeune’s land grant had to have occurred after 1636 and prior to 1654, and is where Catherine LeJeune is found as an adult.

Another source of confusion is that there is a third LeJeune woman, Jeanne LeJeune dit Briard, born about 1659. Her daughter, Catherine Joseph’s 1720 marriage record in Port Royal refers to her mother, Jeanne, as being “d’un nation sauvagé”, giving her parents’ names as Francois Joseph and Jeanne LeJeune “of the Indian Nation.” Jeanne LeJeune dit Briard lived with her first husband in Port Royal, but had relocated to LaHeve by 1708.

You can see why this led to confusion about LeJeune females.

Another male, Pierre LeJeune was associated with LaHeve, which suggests he may have been awarded land there, possibly before the colony moved to Port Royal. One of the reasons that the rumor that Catherine LeJeune had a Native mother is so persistent is the belief that Pierre came over early, as a laborer or soldier, and married a Native woman because there weren’t any European women available.

Pierre may well have arrived as a single man, but there is no shred of evidence to suggest Pierre is the father of the sisters, Catherine LeJeune and Edmee LeJeune. In fact, given that Jeanne was born about 1659, Pierre, if he was her father, may have been born as late as 1627, which makes it impossible for him to have been Catherine and Edmee’s father.

That speculation was before the advent of DNA testing, and before Stephen White discovered that there was also a Jean LeJeune who was awarded land exactly where Catherine is known to have been living a few years later.

While it would be nice to unravel this entire cat’s cradle of confusion, the questions we are seeking to answer definitively here are:

  • Are Catherine LeJeune (born 1633) and Edmee LeJeune (born 1624) actually sisters?
  • Is the mother of Catherine LeJeune and her sister, Edmee LeJeune, Native American or European?
  • Is Jeanne LeJeune dit Briard, born about 1659, “d’un nation sauvagé” another sister of the LeJeune sisters?
  • What else is revealed about the LeJeune sisters and their ancestors? Is there something else we should know?

I’ll provide a summary of the combined evidence after our step-by-step mitochondrial analysis.

Testing for Sisters

Mitochondrial DNA is passed from mothers to all of their children, but only females pass it on.

Since we have two LeJeune females, believed to be sisters, we need mitochondrial DNA from direct matrilineal testers for each woman. This is particularly important because we know unquestionably that Edmee was born in France in 1624, prior to Acadian settlement in New France, so her DNA should be European. If they match, it means that Catherine was born to the same mother who was not Native. If they don’t match, there’s a different message.

In some cases, a match might mean that they were born to females related on the matrilineal line, like first cousins, for example. But in the early days of Acadia, there were no European females other than the handful, less than a dozen, who arrived on the Saint-Jehan in 1636.

Fortunately, we have multiple testers for each woman in two DNA projects at FamilyTreeDNA, the only DNA testing company that provides mitochondrial DNA testing and matching. Testers can join special interest projects, and both the Mothers of Acadia Project, and the Acadian AmerIndian Project have testers who descend from the LeJeune sisters.

I’ve identified 28 descendants of Catherine, and 25 from Edmee, giving us a total of 53 known matrilineal descendants to work with. Not all are shown publicly, in projects. Catherine has a known total of 14 testers, and Edmee has 17 that are shown publicly. All testers are members of haplogroup U6a7a1a.

The fact that the descendants of these women match each other, often exactly, combined with Catholic parish register dispensations for their descendants, when taken together, prove conclusively that Catherine and Edmee were sisters, not paternal half-sisters.

Let’s look at each piece of evidence.

Mitochondrial DNA Results

When the lab finishes processing the mtFull test, the results are posted to the account of the test taker.

Click on any image to enlarge

You’ll see the Maternal Line Ancestry section which displays your mitochondrial mtDNA Results.

The three tabs we will be primarily working with are:

  • mtDNA Matches
  • Matches Maps
  • Discover Haplogroup Reports, which includes another dozen+ reports and an updated Migration Map
  • Advanced Matching

At the bottom right of your page, you’ll see two haplogroup badges.

The one at right is called the “Legacy” haplogroup, which means the haplogroup you were assigned prior to the release of the new Mitotree.

The Mitotree mtDNA Haplogroup, with the green “Beta” at the bottom, is the new Mitotree haplogroup, which I wrote about in a series of articles:

Your old Legacy haplogroup will never change, because it’s the 2016 version that was not updated by the previous tree-keepers. That’s why the FamilyTreeDNA R&D team, me included, developed and birthed the new Mitotree. There were thousands of new haplogroups that could be defined to kick-start our genealogy, so we did.

The mitochondrial tree went from about 5000 branches to over 40,000 in the new Mitotree, each providing additional information to testers.

Not everyone received a new haplogroup, but about 75% of testers did, and another new Mitotree version will be released soon. In order to receive a new haplogroup, testers needed to:

  • Have at least one qualifying, stable mutation that had not been previously used to define a haplogroup
  • Match at least one other person in the same haplogroup branch with the same mutation(s)

In the case of the LeJeune sisters, there were no mutations that met all of the qualifications, so their known descendants did not receive a new haplogroup. That’s fine, though, because it’s not the name but the messages held by the information that’s important – and there’s a LOT to work with.

Let’s start with matches.

Matches

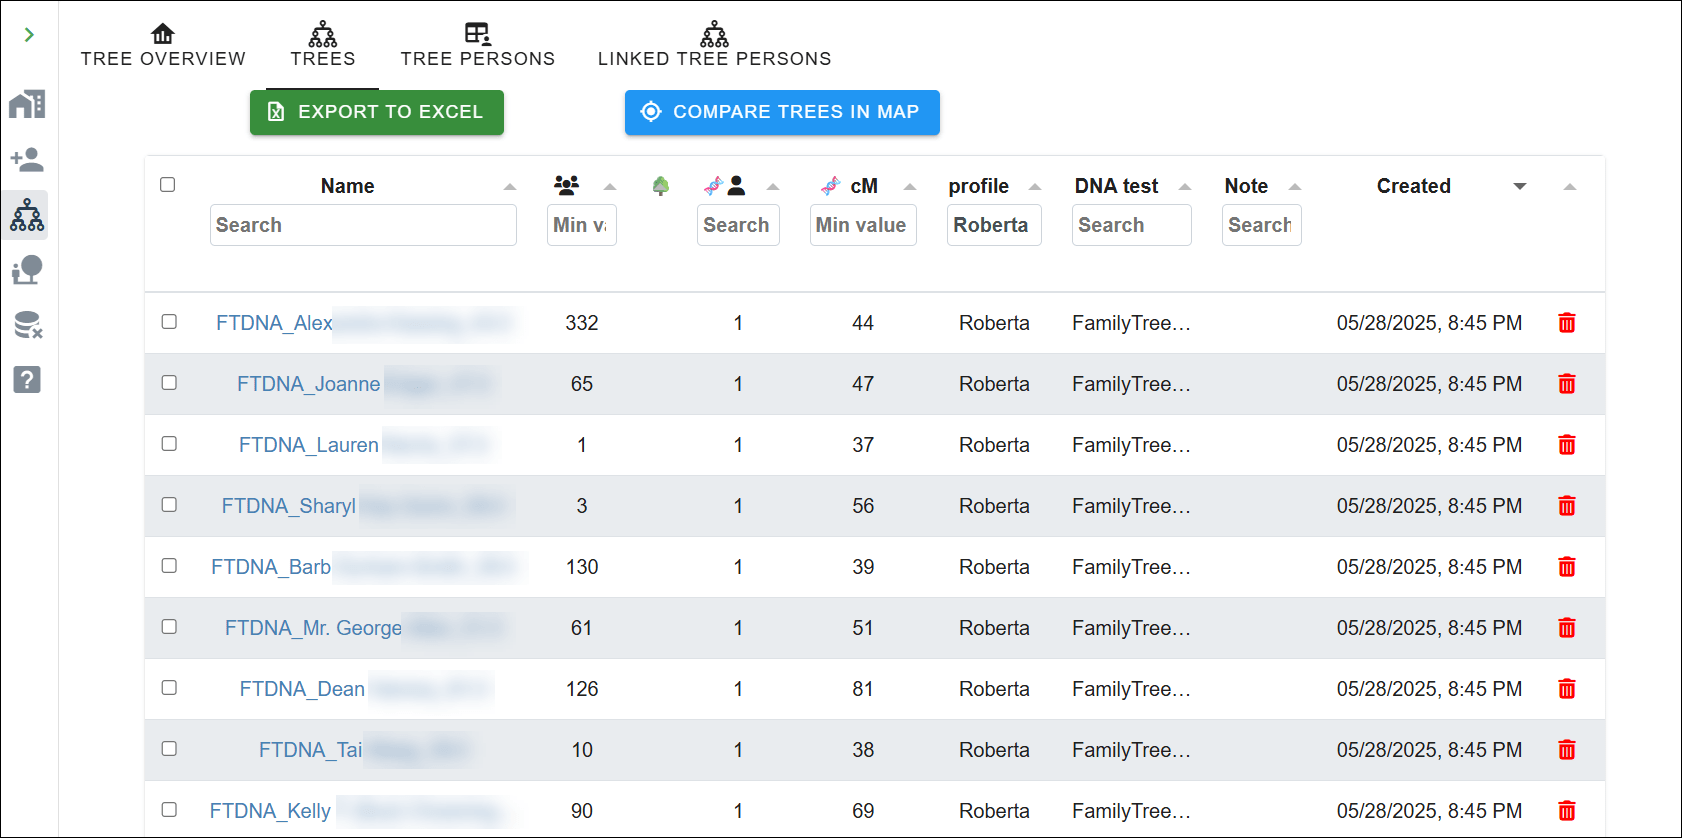
Of course, the first thing everyone does is click to see their matches.

The default is Detail View, but I prefer Table View (top left) because you can see more matches on the same page.

Catherine’s descendant whose matches are shown here has 108 Full Sequence matches, which are labeled as the “Coding Region.” The Coding Regions is the mtFULL test and includes both the HVR1 and HVR2 regions. Viewing Coding Region matches means they have taken the mtFull test, which sequences all 16,569 locations of the mitochondria.

When you click on the “Coding Region”, you are seeing matches to people who took all three test levels, not just the first one or two.

There are three test levels to view:

  1. HVR1
  2. HVR1+HVR2 both
  3. Coding Region, which is in addition to the HVR1+HVR2 regions

You can no longer order three different test levels today, although at one time you could. As costs decreased, it no longer made sense to offer multiple testing levels, and often the HVR1 or HVR1+HVR2 results, which only tested about 500 locations each, would confuse people.

People at the lower HVR1 or HVR1+HVR2 levels, known as mtPlus, can upgrade to the complete mtFull level, and should.

However, because some people only tested at those lower levels, matches are still shown at three levels, with different match thresholds for each level.

Matches at the HVR1 or HVR1+HVR2 levels *might* be entirely irrelevant, reaching back thousands of years. They could also be much more current, and critical to your genealogy, so don’t assume. Just one unstable mutation can cause a mismatch though, and at lower levels, cause you not to match someone with the same ancestor, which is why the full sequence test is so critically important.

For some testers, matches at lower levels sometimes provide the ONLY match to your known ancestor. So don’t skip over them. If you find a critical match there, you can email the tester to see if they will upgrade to the mtFull test.

People who test only at the HVR1 or HVR1+HVR2 level receive a more refined haplogroup after they upgrade, so the haplogroups between the HVR1/HVR2 testers and the full sequence test won’t match exactly. For the LeJeune sisters, the haplogroup for HVR1/HVR2-only testers is U6a and for full sequence testers, it’s U6a7a1a.

While full sequence matches are wonderful, if you’re searching for a particular ancestor and the ONLY place they appear is the HVR1 or HVR1+HVR2 testing levels, you’ll want to pursue the match. You may also want to evaluate lower level matches if their ancestors are from a specific location – like France – even if their earliest known ancestor (EKA) is not your ancestor.

To view your  HVR1 or HVR1+HVR2 matches, just click on either of those links. You’ll see ALL of the results, including everyone who took the full sequence test. In this case, that means that the 217 HVR1 (hypervariable region 1) results will include the 120 coding region (full sequence) tests. I’ve already looked through the full sequence matches, so that’s not what I want.

If you ONLY want to see testers who did NOT take the Full Sequence test, use the Filter option. Select Filter, then the features you seek.

Fortunately, the LeJeune sisters have lots of known descendants at the mtFull level to work with, so we will focus on their full sequence matches.

Your Focus

On the matches page, you’ll be immediately interested in two fields:

  • Maternal Earliest Known Ancestor (EKA) – the direct matrilineal ancestor of your match – unless they got confused and entered someone else
  • Their Tree

Viewing the first several matches only produced one match to someone whose earliest known ancestor (EKA) is listed as Catherine or Edmee LeJeune, but perhaps the next group will be more productive. Note that females’ EKAs, earliest known ancestors, are sometimes challenging, given surname changes. So unfamiliar EKAs could represent generational differences and sometimes offer other hints based on their information.

Shifting to the detail view for a minute, you’ll want to review the genetic distance,  meaning whether you’re an exact match or not.

If you’re not an exact match, a genetic distance of “1 step” means that you match except for one mutation at a specific location.

If you have a genetic distance greater than 3, meaning 4 mutations or more, you won’t be shown as a match on this match list. However, you can still be a haplogroup match, which we’ll discuss in the Discover section.

Essentially, with more than 3 mutations difference, it’s unlikely (but not impossible) that your match is genealogically relevant – meaning you probably won’t be able to identify your most recent common ancestor (MRCA).

However, that doesn’t mean that haplogroup-only matches can’t provide important clues, and we will look under every rock!

A Slight Detour – Confirmation Bias

This is a good place to mention that both ancestors and their location (country) of origin are provided by (some) testers to the best of their ability and understanding.

This tester selected “United States Native American” as the location for their earliest known ancestor. We don’t know why they entered that information. It could be that:

  • The tester did not understand that the maternal country of origin means the direct MATRILINEAL line, not just someplace on the maternal side
  • Selina Sinott was Native on her father’s side, or any line OTHER than her direct matrilineal line.
  • They relied on oral history or made a guess
  • They found the information in someone else’s tree
  • They found all of the LeJeune information confusing (because it is)

The tester has provided no tree, so we can’t do any sleuthing here, but an Ancestry search shows a woman by that name born in 1855 in Starksboro, VT to Louis Senott and Victoria Reya. A further search on Victoria leads me to Marie Lussier who leads me to Marguerite Michel who leads me to Marie Anne Lord (Lore, Laure), who lived in Acadia, whose ancestor is…drum roll…Catherine LeJeune. You get the idea.

Yes, you may need to extend other people’s trees.

The Point

However, and this is the point – if you’re looking for confirmation that the LeJeune sisters were Native American, this ONE tester who entered Native American for an unknown reason is NOT the confirmation you’re looking for. Don’t get sucked into confirmation bias, or into categorically believing what someone else entered without additional information.

You need haplogroup confirmation, but, in this case, you don’t have it. However, if you’re new to genetic genealogy, you don’t know that yet, so hold on. We’re still getting there. This is why we need to review all of the reports.

And trust me, I’m not being critical because there isn’t a single seasoned genealogist who has NOT fallen down the rathole of excited confirmation bias or accepting information without further analysis – me included. We all need to actively guard against it, all the time. Confirm and weigh all of the evidence we do have, and seek missing evidence.

Let’s go back to the match results.

Matches – Haplogroups and Haplotypes

Scrolling down the Table View, the next group of matches shows many more matches to descendants of both Catherine and Edmee LeJeune.

Next, you’ll notice that there’s a Mitotree haplogroup, U6a7a1a, AND an F number. In this case, they are both checked in blue, which means you share the exact same haplogroup with that tester, and the exact same haplotype cluster, which is the F number.

I wrote about haplotype clusters, here.

If NEITHER box is checked, you don’t share either the haplogroup nor the haplotype cluster.

You can match the haplogroup, but not the haplotype cluster, which means the haplogroup box will be checked, but the haplotype cluster will not. If you share the same haplotype cluster, you WILL share the same haplogroup, but the reverse is not true.

What is a Haplotype Cluster, and why do they matter?

Haplotype Clusters

We need to talk about exact matches and what they mean. Yes, I know it seems intuitive, but it isn’t.

There are three types of matches

  • Matching and Genetic Distance on your Match List
  • Haplotype matching
  • Haplogroup matching

Without getting (too much) into the weeds, an Exact Match in the Genetic Distance column on your match list excludes locations 309 and 315 because they are too unstable to be considered reliable for matching. So, 309 and 315 are EXCLUDED from this type of matching. In other words, you may or may not match at either or both of those locations. They are ignored for matching on your match list.

Locations 309 and 315 are also EXCLUDED from haplogroup definitions.

A haplotype F cluster match indicates that everyone in that cluster is an exact match, taking into consideration EVERY mutation, INCLUDING 309 and 315.

309 and 315 Why
Matching and Genetic Distance Excluded Unstable, probably not genealogically relevant and may be deceptive, leading you down a rathole
Haplogroup Definition Excluded Too unstable for tree branching and definition
Haplotype F Clusters Included Might be genealogically useful, so everyone can evaluate the rathole for themselves

Some people think that if they don’t match someone exactly, they can’t have the same ancestor as people who do match exactly, but that’s not true. “Mutations happen” whenever they darned well please. Downstream mutations in stable locations that match between two or more testers will form their own haplogroup branch.

The most distant matches are shown on the last match page, and as you can see below, some descendants of Catherine and Edmee LeJeune have a 1-step difference with our tester, meaning a genetic distance of one, or one mutation (disregarding 309 and 315). One match has a 2-step mutation.

The fact that their F numbers are not the same tells you that their mutations are different from each other, too. If two of those people also matched each other, their F# would be identical.

The mutations that do not (yet) form a haplogroup, and are included in your haplotype cluster, are called Private Variants, and you cannot see the private variants of other people. Clearly, you and anyone in your haplotype cluster share all of the same mutations, including Private Variants.

Evaluating Trees and EKAs

By reviewing the matches, their EKAs, and the trees for the matches of Catherine’s descendants, I was able to create a little mini-tree of sorts. Keep in mind that not everyone with an EKA has a tree, and certainly not everyone who uploaded a tree listed an EKA. So be sure to check both resources. Here’s how to add your EKA, and a one-minute video, here.

The good news is that if your match has a WikiTree link when you click on their tree icon, you know their tree actually reaches back to either Edmee or Catherine if that’s their ancestor, and you’re not dealing with a frustrating, truncated two or three-generation tree, or a private tree. You can add your WikiTree link at FamilyTreeDNA here, in addition to any other tree you’ve linked.

Takeaways from Matches

  • You can identify your common ancestor with other testers. By viewing people’s trees and emailing other testers, you can often reconstruct the trees from the tester back through either Catherine or Edmee LeJeune.
  • Your primary focus should be on the people in your haplotype cluster, but don’t neglect other clusters where you may find descendants of your ancestor.
  • If you see a male EKA name, or something other than a female name in the EKA field, like a location, the tester was confused. Only females pass their mitochondrial DNA to their descendants.
  • If you’re searching for an ancestor whose mitochondrial DNA you don’t carry, use projects and WikiTree to see if you can determine if someone has tested from that line. From viewing the project results, I already knew that the LeJeune sisters had several descendants who had tested.
  • If you’re searching for your ancestor on your match list, and you don’t find them in the full sequence results, use the filter to view people who ONLY took the HVR1 and HVR1+HVR2 tests to see if the results you seek are there. They won’t be on your full sequence match list because they didn’t test at that level. Testers at the lower levels will only have a partial, estimated haplogroup – in this case, U6a.
  • For Edmee and Catherine LeJeune, we have enough testers to ensure that we don’t have just one or two people with the same erroneous genealogy. If you do find someone in a project or at WikiTree claiming descent from the same ancestor, but with a different haplogroup, you’ll need to focus on additional research to verify each step for all testers.

Resources:

Matches Maps

The Matches Map is a great visual resource. That “picture is worth 1000 words” tidbit of wisdom definitely applies here.

Clicking on the Matches Maps displays the locations that your matches entered for their EKA.

In the upper left-hand corner, select “Full Sequence,” and only the full sequence matches will be displayed on the map. All full sequence testers also have HVR1/HVR2 results, so those results will be displayed under that selection, along with people who ONLY took the HVR1 or HVR1/HVR2 tests.

We know that the Acadians originally came from France, and their descendants were forcibly expelled from Nova Scotia in 1755. Families found themselves scattered to various locations along the eastern seaboard, culminating with settlements in Louisiana, Quebec, and in some cases, back in France, so this match distribution makes sense in that context.

Be sure to enlarge the map in case pins are on top of or obscuring each other.

Some people from other locations may be a match, too. Reviewing their information may assist with breaking down the next brick wall. Sometimes, additional analysis reveals that the tester providing the information was confused about what to complete, e.g., male names, and you should disregard that pin.

Takeaways from the Matches Map

  • These results make sense for the LeJeune sisters. I would specifically look for testers with other French EKAs, just in case their information can provide a (desperately needed) clue as to where the LeJeune family was from in France.

  • Reviewing other matches in unexpected locations may provide clues about where ancestors of your ancestor came from, or in this case, where descendants of the LeJeune sisters wound up – such as Marie Josephe Surette in Salem, Massachusetts, Catherine LeJeune’s great-granddaughter.
  • Finding large clusters of pins in an unexpected location suggests a story waiting to be uncovered. My matrilineal ancestor was confirmed in church records in Wirbenz, Germany, in 1647 when she married, but the fact that almost all of my full sequence matches are in Scandinavia, clustered in Sweden and Norway, suggests an untold story, probably involving the 30 Years War in Germany that saw Swedish troop movement in the area where my ancestor lived.
  • For my own mitochondrial DNA test, by viewing trees, EKAs, and other hints, including email addresses, I was able to identify at least a country for 30 of 36 full sequence matches and created my own Google map.
  • You can often add to the locations by creating your own map and including everyone’s results.

Resources:

Mitochondrial DNA Part 4 – Techniques for Doubling Your Useful Matches

Mitochondrial DNA Myth – Mitochondrial DNA is not Useful because the Haplogroups are “Too Old”

Before we move to the Discover Reports, I’m going to dispel a myth about haplogroups, ages, genealogical usefulness, and most recent common ancestors known as MRCAs.

Let me start by saying this out loud. YES, MITOCHONDRIAL DNA IS USEFUL FOR GENEALOGY and NO, OLDER HAPLOGROUPS DO NOT PREVENT MITOCHONDRIAL DNA FROM BEING USEFUL.

Here’s why.

The most recent common ancestor (MRCA) is the person who is the closest common ancestor of any two people.

For example, the mitochondrial DNA MRCA of you and your sibling is your mother.

For your mother and her first cousin, the mitochondrial MRCA is their grandmother on the same side, assuming they both descend from a different daughter. Both daughters carry their mother’s undiluted mitochondrial DNA.

A common complaint about mitochondrial DNA is that “it’s not genealogically useful because the haplogroups are so old” – which is absolutely untrue.

Let’s unravel this a bit more.

The MRCA of a GROUP of people is the first common ancestor of EVERY person in the group with each other.

So, if you’re looking at your tree, the MRCA of you, your sibling, and your mother’s 1C in the example above is also your mother’s grandmother, because your mother’s grandmother is the first person in your tree that ALL of the people in the comparison group descend from.

Taking this even further back in time, your mother’s GGG-grandmother is the MRCA for these five people bolded, and maybe a lot more descendants, too.

At that distance in your tree, you may or may not know the name of the GGG-grandmother and you probably don’t know all of her descendants either.

Eventually, you will hit a genealogical brick wall, but the descendants of that unknown “grandmother” will still match. You have NOT hit a genetic brick wall.

A haplogroup name is assigned to the woman who had a mutation that forms a new haplogroup branch, and she is the MRCA of every person in that haplogroup and all descendant haplogroups.

However, and this is important, the MRCA of any two people, or a group of people may very well be downstream, in your tree, of that haplogroup mother.

As you can clearly see from our example, there are four different MRCAs, depending on who you are comparing with each other.

  • Mom – MRCA of you and your sibling
  • Grandmother – MRCA of you, your sibling, your mom and your mom’s 1C
  • GGG-Grandmother – MRCA of all five bolded descendants
  • Haplogroup formation – MRCA of ALL tested descendants, and all downstream haplogroups, many of whom are not pictured

Many of the testers may, and probably do, form haplotype clusters beneath this haplogroup.

When you are seeking a common ancestor, you really don’t care when everyone in that haplogroup was related, what you seek is the common ancestor between you and another person, or group of people.

If the haplogroup is formed more recently in time, it may define a specific lineage, and in that case, you will care because that haplogroup equates to a woman you can identify genealogically. For example, let’s say that one of Catherine LeJeune’s children formed a specific haplogroup. That would be important because it would be easy to assign testers with that haplogroup to their appropriate lineage. That may well be the case for the two people in haplogroup U6a7a1a2, but lack of a more recent haplogroup for the other testers does not hinder our analysis or reduce mitochondrial DNA’s benefits.

That said, the more people who test, the more possibilities for downstream haplogroup formation. Currently, haplogroup U6a7a1a has 34 unnamed lineages, just waiting for more testers.

Haplogroup ages are useful in a number of ways, but haplogroup usefulness is IN NO WAY DEPRICATED BY THEIR AGE. The haplogroup age is when every single person in that haplogroup shares a common ancestor. That might be useful to know, but it’s not a barrier to genealogy. Unfortunately, hearing that persistent myth causes people to become discouraged, give up and not even bother to test, which is clearly self-defeating behavior. You’ll never know what you don’t know, and you won’t know if you don’t test. That’s my mantra!

The LeJeune sisters provide a clear example.

OK, now on to Discover.

mtDNA Discover

Next, we are going to click through from the mtDNA Results and Tools area on your personal page to Discover Haplogroup Reports. These reports are chapters in your own personal book, handed down from your ancestors.

Discover is also a freely available public tool, but you’ll receive additional and personalized information by clicking through when you are signed into your page at FamilyTreeDNA. Only a subset is available publicly.

mtDNA Discover was released with the new Mitotree and provides fresh information weekly.

Think of Discover as a set of a dozen reports just for your results, with one more, Globetrekker, an interactive haplogroup map, coming soon.

Resources:

When you click through to Discover from your results, Discover defaults to your haplogroup. In this case, that’s U6a7a1a for the LeJeune sisters.

Let’s begin with the first report, Haplogroup Story.

Haplogroup Story

The Haplogroup Story is a landing page that summarizes information about your ancestor’s haplogroup relevant to understanding your ancestor’s history. Please take the time to actually READ the Discover reports, including the information buttons, not just skim them.

Think of Discover as your own personalized book about your ancestors – so you don’t want to miss a word.

You’ll see facts on the left, each one with a little “i” button. Click there or mouse over for more information about how that fact was determined.

When we’re talking about haplogroup U6a7a1a, it sounds impersonal, but we’re really talking about an actual person whose name, in this case, we will never know. We can determine the ancestor of some haplogroups that formed within a genealogical timeframe. The LeJeune ancestor in question is the person in whose generation the final mutation in a long string of mutations created the final “a” in haplogroup U6a7a1a.

Think of these as a long line of breadcrumbs. By following them backwards in time and determining when and where those breadcrumbs were dropped, meaning when and where the mutation occurred, we begin to understand the history of our ancestor – where she was, when, and which cultures and events shaped her life.

U6a7a1a was formed, meaning this ancestor was born, about 50 CE, so about 1950 years ago. This means that the ancestor of ANY ONE PERSON with this haplogroup could have lived anytime between the year 50 CE and the year of their mother’s birth.

This is VERY important, because there is an incredible amount of  misunderstanding about haplogroup ages and what they mean to you.

The year 50 CE is the year that the common ancestor of EVERY PERSON in the haplogroup was born, NOT the year that the common ancestor of any two or more people was born.

By way of illustration, the LeJeune sisters were born in about 1624 and 1633, respectively, not 50 CE, and their most recent common ancestor (MRCA) is their mother, who would have been born between about 1590 and 1608, based on their birth years.

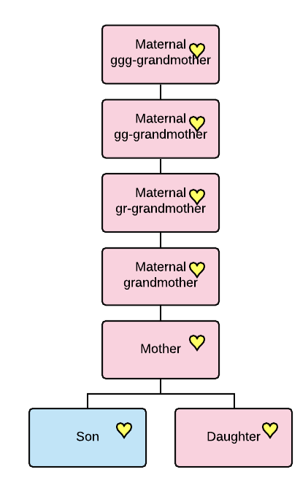
For reference, I’ve created this genealogical tree from individuals who took the mitochondrial DNA test and have identified their mitochondrial lineage on the LeJeune mother’s profile at Wikitree

You can see that both Edmee and Catherine have mitochondrial DNA testers through multiple daughters. I’ve color coded the MRCA individuals within each group, and of course their mother is the MRCA between any two people who each descend from Edmee and Catherine.

Mitochondrial DNA matches to the LeJeune sisters’ descendants could be related to each other anywhere from the current generation (parent/child) to when the haplogroup formed, about 50 CE.

You can easily see that all of these testers, even compared with their most distant relatives in the group, share a common ancestor born between 1590 and about 1608. Other people when compared within the group share MCRAs born about 1717 (blue), 1778 (peach), 1752 (green), 1684 (pink), 1658 (mustard), and 1633 (red).

Soooooo…a haplogroup born in 50 CE does NOT mean that you won’t be able to find any genealogical connection because your common ancestor with another tester was born more than 1900 years ago. It means that the common ancestor of EVERYONE who is a member of haplogroup U6a7a1a (and downstream haplogroups) was born about 50 CE.

The parent haplogroup of U6a7a1a is haplogroup U6a7a1, which was born about 1450 BCE, or about 3450 years ago.

In the graphic, I’ve shown other unknown genealogical lineages from U6a7a1 and also downstream haplogroups.

Haplogroup U6a7a1 is the MRCA, or most recent common ancestor of haplogroup U6a7a1a, and anyone who descends from haplogroup U6a7a1 or any of the 23 downstream lineages from U6a7a1, including 5 descendant haplogroups and 18 unnamed lineages.

The LeJeune haplogroup, U6a7a1a, has 35 descendant lineages. One downstream haplogroup has already been identified – U6a7a1a2 – which means two or more people share at least one common, stable, mutation, in addition to the mutations that form U6a7a1a. Thirty-four other lineages are as yet unnamed.

The fact that there are 34 unnamed lineages means that people with one or more private variants, or unique mutations, are candidates for a new branch to form when someone else tests and matches them, including those variants.

You’re a candidate for a new haplogroup in the future if no one else matches your haplotype cluster number, or, potentially, as the tree splits and branches upstream.

When a second person in a lineage tests, those two people will not only share a common haplotype cluster F#, they will share a new haplogroup too if their common mutation is not excluded because it’s unstable and therefore unreliable.

There are 127 members of haplogroup U6a7a1a today, and their EKAs are noted as being from France, Canada, the US, and other countries that we’ll view on other pages.

Haplogroup U6a7a1a has been assigned two Discover badges:

  • Imperial Age – “an age noted for the formation and global impact of expansive empires in many parts of the world.” In other words, colonization, which is certainly true of the French who battled with the English to colonize New England, Acadia, and New France.
  • mtFull Confirmed (for testers only)

Additionally, the LeJeune sisters have one Rare Notable Connection, and three Rare Ancient Connections, all of which may shed light on their history.

Takeaways from the Haplogroup Story

  • The Haplogroup Story provides an overview of the haplogroup
  • You can easily see how many testers fall into this haplogroup and where they have indicated as the origin of their matrilineal line.
  • The haplogroup may have several new haplogroup seeds – 34 in this case – the number of unnamed lineages
  • You can share this or other Discover pages with others by using the “share page” link in the upper right-hand corner.
  • Don’t be discouraged by the age of the haplogroup, whether it’s recent or older.

Next, let’s look at Country Frequency.

Country Frequency

Country Frequency shows the locations where testers in haplogroup U6a7a1a indicate that their EKA, or earliest known matrilineal ancestor, is found. The Country Frequency information is NOT limited to just your matches, but all testers in haplogroup U6a7a1a, some of whom may not be on your match list. Remember, only people with 3 mutations difference, or fewer, are on your match list.

Haplogroup distribution around the world is very informative as to where your ancestors came from.

There are two tabs under Country Frequency, and I’d like to start with the second one – Table View.

Table View displays all of the user-provided country locations. Note that the Haplogroup Frequency is the percentage of total testers in which this haplogroup is found in this particular country. These frequencies are almost always quite small and are location-based, NOT haplogroup based.

There are now 40,000 haplogroups, and in haplogroup U, the LeJeune sisters are 6 branches down the tree with U6a7a1a.

In total, 127 testers are members of haplogroup U6a7a1a, and 42 of those claim that their ancestor is from France, which comprises 1% of the people who have taken the full sequence mitochondrial DNA test whose ancestor is from that location.

Let’s do the math so you can see how this is calculated and why it’s typically so small. For our example, let’s say that 8000 people in the database have said their matrilineal ancestor is from France. Of the 127 haplogroup U6a7a1a members, 42 say their ancestor is from France. Divide 42 by 8,000, which is 0.00525, and round to the nearest percentage – which is 1%.

The best aspect of this page is that you can see a nice summary of the locations where people indicate that their earliest known U6a7a1a ancestor was found.

Please note that the last entry, “Unknown Origins,” is the bucket that everyone who doesn’t provide a location falls into. That row is not a total but includes everyone who didn’t provide location information.

These location results make sense for the LeJeune sisters – maybe except for Ireland and Belgium. Some people don’t understand the directions, meaning that a matrilineal ancestor or direct maternal ancestor is NOT your literal “oldest” ancestor on your mother’s side of the tree who lived to be 105, but your mother-to-mother-to-mother-to-mother ancestor, so check to see if these people with unusual locations are in your match list and view their tree or reach out to them.

We don’t know why the person who selected Native American made that choice, but I’d bet it has to do with confusion about the “other” LeJeune female, Jeanne LeJeune dit Briard. Based on Catherine and her sister, Edmee LeJeune’s haplogroup through more than 50 testers, U6a7a1a, Native is incorrect.

Of course, that tester wouldn’t have known that if they completed their EKA information before they tested. Perhaps they entered information based on the stories they had heard, or flawed genealogy, and didn’t think to go back and correct it when their results were ready, indicating that Native was mistaken.

On the “Map View” tab, the locations are shown using a heat map, where the highest percentages are the darkest. Here, both France and Canada are the darkest because that’s the most common selection for this haplogroup with 1% each, while the rest of the countries registered with less <1%.

These colors are comparative to each other, meaning that there is no hard and fast line in the sand that says some percentage or greater is always red.

To summarize these two tables, because this is important:

  • The Table View shows you how many people selected a specific country for their ancestor’s location, but the frequency is almost always very low because it’s based on the total number of testers in the entire database, comprised of all haplogroups, with ancestors from that country.
  • The Map View shows you a heat map for how frequently a particular location was selected, as compared to other locations, for this haplogroup.

To view the difference between adjacent haplogroups, I always compare at least one haplogroup upstream. In this case, that’s the parent haplogroup, U6a7a1.

The Parent Haplogroup

If you look at haplogroup U6a7a1, just one haplogroup upstream, you’ll see that for Mauritania, the total number of U6a7a1 descendants tested is only “1”, but the haplogroup frequency in Mauritania is 10% which means that there are only 10 people who have been tested in the database altogether from Mauritania – and one person is haplogroup U6a7a1.

However, due to substantial under-sampling of the Mauritania population, the frequency for Mauritania, 10%, is higher than any other location.

Also, remember, these are user-reported ancestor locations, and we have no idea if or how these people determined that their ancestor is actually from Mauritania.

Please only enter actual known locations. For example, we don’t want haplogroup U6a7a1 members to look at this informatoin, then add Mauritania as their location because now they “know” that their ancestor is from Mauritania.

On the Map View, Mauritania is dark red because the percentage is so high – never mind that there are only 10 testers who report matrilineal ancestors from there, and only one was U6a7a1.

This map illustrates one reason why taking the full sequence test is important. Viewing partial haplogroups can be deceiving.

Catherine and Edmee LeJeune’s matrilineal descendants who only tested at the HVR1 or HVR1+HVR2 level receive a predicted haplogroup of U6a, born about 21,000 years ago. That’s because the full 16,569 locations of the mitochondria need to be tested in order to obtain a full haplogroup, as opposed to about 500 locations in the HVR1 and HVR1/2, each, respectively.

U6a – The Result for HVR1/HVR2-Only Testers

So, let’s look at what haplogroup U6a reveals, given that it’s what early LeJeune descendants who ordered the lower-level tests will see.

In the Table View for U6a, below, you see that the top 5 counties listed by haplogroup frequency are five North African countries.

A total of 801 people are assigned to haplogroup U6a, meaning the majority, 757, report their ancestors to be from someplace else. If two people from the Western Sahara (Sahrawi) comprise 67% of the people who tested, we know there are only three people who have tested and selected that location for their ancestors.

If you didn’t understand how the display works, you’d look at this report and see that the “top 5” countries are North African, and it would be easy to interpret this to mean that’s where Catherine and Edmee’s ancestors are from. That’s exactly how some people have interpreted their results.

Scrolling on down the Table View, 50 testers report France, and 10 report the US, respectively, with France showing a Haplogroup Frequency of 1% and the US <1%.

The balance of U6a testers’ ancestors are from a total of 57 other countries, plus another 366 who did not select a location. Not to mention that U6a was born 21,000 years ago, and a lot has happened between then and the 1620/1630s when Catherine and Edmee were born to a French mother.

The real “problem” of course is that haplogroup U6a is only a partial haplogroup.

The U6a map shows the highest frequency based on the number of testers per country, which is why it’s dark red, but the Table View reports that the actual number of U6a testers reporting any specific country. France has 50. Next is the US, also with 50, which often means people are brick-walled here. You can view the U6a table for yourself, here.

Why is this relevant for Catherine and Edmee LeJeune? It’s very easy to misinterpret the map, and for anyone viewing U6a results instead of U6a7a1a results, it’s potentially genealogically misleading.

Use Country Frequency with discretion and a full understanding of what you’re viewing, especially for partial haplogroups from HVR1/HVR2 results or autosomal results from any vendor.

If someone tells you that the LeJeune sisters are from someplace other than France, ask where they found the information. If they mention Africa, Morocco or Portugal, you’ll know precisely where they derived the information.

This information is also available on your Maternal Line Ancestry page, under “See More,” just beneath the Matches tab. Haplogroup Origins and Ancestral Origins present the same information in a different format.

Discover is a significant improvement over those reports, but you’ll still need to read carefully, understand the message, and digest the information.

Takeaways from Country Frequency

  • Evaluate the results carefully and be sure to understand how the reports work.
  • Use complete, not partial haplogroups when possible.
  • The Haplogroup Frequency is the number of people assigned to this haplogroup divided by the entire number of people in the database who report that country location for their matrilineal ancestor. It is NOT the percentage of people in ONLY haplogroup U6a7a1a from a specific country.
  • Table view shows the number of testers with this haplogroup, with the percentage calculated per the number of people who have tested in that country location.
  • The Map shows the highest frequency based on the number of testers per country.
  • Use the map in conjunction with the haplogroup age to better understand the context of the message.

Globetrekker, which has not yet been released, will help by tracking your ancestors’ paths from their genesis in Africa to where you initially find that lineage.

Before we move on to the Mitotree, let’s take a minute to understand genetic trees.

About Genetic Trees

The Mitotree is a genetic tree, also called a phylogenetic tree, that generally correlates relatively closely with a genealogical tree. The more testers in a particular haplogroup, the more accurate the tree.

FamilyTreeDNA provides this disclaimer information about the genetic tree. The Mitotree you see is a nice and neat published tree. The process of building the tree is somewhat like making sausage – messy. In this case, the more ingredients, the better the result.

The more people that test, the more genetic information is available to build and expand the tree, and the more accurate it becomes.

The recent Mitotree releases have moved the haplogroup “dates” for the LeJeune sisters from about 21,000 years ago for HVR1/HVR2 U6a testers to 50 CE for full sequence testers, and this may well be refined in future tree releases.

Mutations

Mutations and how to interpret them can be tricky – and this short section is meant to be general, not specific.

Sometimes mutations occur, then reverse themselves, forming a “back mutation”, which is usually counted as a branch defining a new haplogroup. If a back mutation happens repeatedly in the same haplogroup, like a drunken sailor staggering back and forth, that mutation is then omitted from haplogroup branch formation, but is still counted as a mismatch between two testers.

A heteroplasmy is the presence of two or more distinct results for a specific location in different mitochondria in our bodies. Heteroplasmy readings often “come and go” in results for different family members, because they are found at varying threshold levels in different family members, causing mismatches. Heteroplasmies are currently counted only if any person has 20% or greater of two different nucleotides. So, if you have a 19% heteroplasmy read for a particular location, and your sister has 21%, you will “not” have a heteroplasmic condition reported, but she will, and the location will be reported as a mismatch.

If you have a heteroplasmy and another family member does not, or vice versa, it’s counted as as a “mismatch,” meaning you and that family member will find yourselves in different haplotype clusters. Hetroplasmies do not presently define new tree branches. I wrote about heteroplasmies, here.

Takeaways from the Genetic Tree Disclaimer

  • DNA is fluid, mutations happen, and all mutations are not created equal.
  • Thankfully, you really don’t need to understand the nitty-gritty underpinnings of this because the scientists at FamilyTreeDNA have translated your results into reports and features that take all of this into consideration.
  • Testing more people helps refine the tree, which fills in the genetic blanks, refining the dates, and expanding branches of the tree.

Resources:

Ok, now let’s look at the Time Tree

Time Tree

The Time Tree displays your haplogroup on the Mitotree timeline. In other words, it shows us how old the haplogroup is in relation to other haplogroups, and testers.

The Time Tree displays the country locations of the ancestors of testers who are members of that and descendant or nearby haplogroups. You can view the haplogroup U6a7a1a Time Tree, here, and follow along if you wish. Of course, keep in mind that the tree is a living, evolving entity and will change and evolve over time as updated tree versions are released.

Mousing over the little black profile image, which is the person in whom this haplogroup was born, pops up information about the haplogroup. Additionally, you’ll see black bars with a hashed line between them. This is the range of the haplogroup formation date. Additional details about the range can be found on the Scientific Details tab, which we’ll visit shortly.

On your Matches tab, remember that each match has both a haplogroup and a haplogroup cluster F# listed.

On the Time Tree, individual testers are shown at right, with their selected country of origin. In this case, you’ll see the person who selected “Native American” at the top, followed by France, Canada, the US, and other flags.

Haplogroup U6a7a1a includes several haplotype clusters, designated by the rounded red brackets. In this view, we can see several people who have haplotype cluster matches. Everyone has a haplotype assignment, but a haplotype cluster is not formed until two people match exactly.

In the Time Tree view, above, you can see two clusters with two members each, and the top of a third cluster at the bottom.

In case you’re wondering why some of the globes are offset a bit, they positionally reflect the birth era of the tester, rounded to the closest 25 years, if the birth year is provided under Account Settings. If not, the current tester position defaults to 1950.

Scrolling down to the next portion of the window shows that the third cluster is VERY large. Inside the cluster, we see Belgium, Canada, and France, but we aren’t even halfway through the cluster yet.

Continuing to scroll, we see the cluster number, F7753329, in the middle of the cluster, along with the French flag, two from Ireland, four from the US, and the beginning of the large unknown group.

In this fourth screenshot, at the bottom of the display, we see the balance of haplotype cluster #F7753329, along with eight more people who are not members of that haplotype cluster, nor any other haplotype cluster.

Finally, at the bottom, we find haplogroup U6a7a1a2, a descendant haplogroup of U6a7a1a. Are they descendants of the LeJeune sisters?

Looking back at our tester’s match list, the two people who belong to the new haplogroup U6a7a1a2 haven’t provided any genealogical information. No EKA or tree, unfortunately. The haplogroup formation date is estimated as about 1483, but the range extends from about 1244-1679 at the 95th percentile. In other words, these two people could be descendants of:

  • Either Catherine or Edmee LeJeune, but not both, since all of their descendants would be in U6a7a1a2.
  • An unknown sister to Catherine and Edmee.
  • A descendant line of an ancestor upstream of Catherine and Edmee.

Takeaways from the Time Tree

  • The visualization of the matches and haplotype clusters illustrates that the majority of the haplogroup members are in the same haplogroup cluster.
  • Given that two women, sisters, are involved, we can infer that all of the mutations in this haplotype cluster were common to their mother as well.
  • Haplotype cluster #F7753329 includes 19 testers from Catherine and 17 from Edmee.
  • Downstream haplogroup U6a7a1a2 was born in a daughter of haplogroup U6a7a1a, as early as 1244 or as late as 1679. Genealogy information from the two testers could potentially tell us who the mutation arose in, and when.
  • As more haplogroup U6a7a1a2 testers provide information, the better the information about the haplogroup will become, and the formation date can be further refined.

Smaller haplotype clusters have a story to tell too, but for those, we’ll move to the Match Time Tree.

Match Time Tree

The Match Time Tree is one of my favorite reports and displays your matches on the Time Tree. This feature is only available for testers, and you must be signed in to view your Match Time Tree.

By selecting “Share Mode”, the system obfuscates first names and photos so you can share without revealing the identity of your matches. I wrote about using “Share Mode” here. I have further blurred surnames for this article.

The Match Time Tree incorporates the tree view, with time, the names of your matches PLUS their EKA name and country, assuming they have entered that information. This is one of the reasons why the EKA information is so important.

This display is slightly different than the Time Tree, because it’s one of the features you only receive if you’ve taken the mtFull test and click through to Discover from your account.

The Time Tree view is the same for everyone, but the Match Time Tree is customized for each tester.

Your result is shown first, along with your haplotype cluster if you are a member of one.

You can easily see the names of the EKAs below the obfuscated testers’ names.

While we immediately know that descendants of both Catherine and Edmee are found in the large cluster #F7753329, we don’t yet know which ancestors are included in other haplotype clusters.

Haplogroup U6a7a1a includes two smaller haplotype clusters with 2 people each.

We know a few things about each of these clusters:

  • The people in each cluster have mutations that separate them from everyone else except the other person in their cluster
  • The results are identical matches to the other person in the cluster, including less reliable locations such as 309 and 315
  • There are other locations that are excluded from haplogroup formation, but are included in matching, unlike 309 and 315.
  • Given that they match only each other exactly, AND they did not form a new haplogroup, we know that their common unique mutation that causes them to match only each other exactly is unreliable or unstable, regardless of whether it’s 309, 315, a heteroplasmy, or another marker on the list of filtered or excluded variants.

Only the tester can see their own mutations. By inference, they know the mutations of the people in their haplotype cluster, because they match exactly.

If you’re a member of a cluster and you’re seeking to determine your common ancestor, you’ll want to analyze each cluster. I’ve provided two examples, below, one each for the red and purple clusters.

Red Haplotype Cluster #F3714849

Only one person in the red cluster has included their EKA, and the tree of the second person only reaches to three generations. Tracking that line backwards was not straightforward due to the 1755 expulsion of the Acadians from Nova Scotia.

The second person listed their EKA as Edmee LeJeune, but they have a private tree at MyHeritage, so their matches can’t see anything. I wonder if they realize that their matches can’t view their tree.

We are left to wonder if both people descend from Edmee LeJeune, and more specifically, a common ancestor more recently – or if the unstable mutation that they share with each other is simply happenstance.

E-mailing these testers would be a good idea.

Purple Haplotype Cluster #F2149611

Evaluating the purple cluster reveals that the common ancestor is Catherine LeJeune. The question is twofold – how are these two people related downstream from Catherine, and how unstable is their common mutation or mutations.

Fortunately, both people have nice trees that track all the way back to Catherine.

Unfortunately, their MRCA is Francoise, the daughter of Catherine. I say unfortunately, because two additional testers also descend from Francoise, and they don’t have the haplotype cluster mutation. This tells us that the cluster mutation is unreliable and probably not genealogically relevant because it occurred in two of Francoise’s children’s lines independently, but not all four.

In other words, that specific mutation just happened to occur in those two people.

This is exactly why some mutations are not relied upon for haplogroup definition.

Takeaways from the Match Time Tree

  • The time tree is a wonderful visualization tool that shows all of your matches, their EKAs and countries, if provided, in haplotype clusters, on the Time Tree. This makes it easy to see how closely people are related and groups them together.
  • On your match page, you can easily click through to view your matches’ trees.
  • You can use both haplotype clusters (sometimes reliable) and downstream haplogroups (reliable) to identify and define lineages on your family tree. For example, if a third person matches the two in haplogroup U6a7a1a2, the child haplogroup of U6a7a1a, and you could determine the common ancestor of any two of the three, you have a good idea of the genealogical placement of the third person as well.
  • You know that if people form a haplotype cluster, but not a new haplogroup, that their common haplotype cluster-defining mutation is less reliable and may not be genealogically relevant.
  • On the other hand, those less reliable mutations may not be reliable enough for haplogroup definition, but may be relevant to your genealogy and could possibly define lineage splits. Notice all my weasel words like “may,” “may not” and “possibly.” Also, remember our purple cluster example where we know that the mutation in question probably formed independently and is simply chance.
  • I can’t unravel the ancestors of the red cluster – and if I were one of those two people, especially if I didn’t know who my ancestor was, I’d care a lot that the other person didn’t provide a useful tree. Don’t forget that you can always reach out via email, offer to collaborate, and ask nicely for information.
  • We need EKAs, so please encourage your matches to enter their EKA, upload a tree or link to a MyHeritage tree, and enter a Wikitree ID in their FamilyTreeDNA profile, all of which help to identify common ancestors.

Resources:

Classic Tree

FamilyTreeDNA invented the Time Tree and Match Time Tree to display your results in a genealogically friendly way, but there is important information to be gleaned from other tree formats as well.

The Classic Tree presents the Mitotree, haplogroup and haplotype information in the more traditional format of viewing phylogenetic trees, combining their beneficial features. There’s a lot packed in here.

In this default view, all of the Display Options are enabled. We are viewing the LeJeune haplogroup, U6a7a1a, with additional information that lots of people miss.

The countries identified as the location of testers’ earliest known ancestors (EKA) are shown.

Listed just beneath the haplogroup name, five people are members of this haplogroup and are NOT in a haplotype cluster with anyone else, meaning they have unique mutations. When someone else tests and matches them, depending on their mutation(s), a new haplogroup may be formed. If they match exactly, then at least a new haplotype cluster will be formed.

Portions of three haplotype clusters are shown in this screenshot, designated by the F numbers in the little boxes.

Additional information is available by mousing over the images to the right of the haplogroup name.

Mousing over the badge explains the era in which the haplogroup was born. Rapid expansion was taking place, meaning that people were moving into new areas.

Mousing over the date explains that the scientists behind the Mitotree are 95% certain about the date range of the birth of this haplogroup, rounded to 50 CE. Remember, your common ancestor with ALL haplogroup members reaches back to this approximate date, but your common ancestor with any one, or a group, of testers is sometime between the haplogroup formation date, 50 CE, and the present day.

Mousing over the year shows the confidence level, and the date range at that level. These dates will probably be refined somewhat in the future.

If haplogroup members have private variants, it’s likely or at least possible that a new branch will split from this one as more people test

Mousing over the star displays the confidence level of the structure of this portion of the Mitotree based on what could be either confusing or conflicting mutations in the tree. For haplogroup U6a7a1a, there’s no question about the topology, because it has a 10 of 10 confidence rating. In other words, this branch is very stable and not going to fall off the tree.

Every haplogroup is defined by at least one mutation that is absent in upstream branches of the tree. Mutations are called variants, because they define how this sample, or branch, varies from the rest of the branches in the Mitotree.

These two mutations, A2672G and T11929C, are the haplogroup-defining mutations for U6a7a1a. Everyone in haplogroup U6a7a1a will have these two mutations in addition to all of the mutations that define directly upstream haplogroups (with extremely rare exceptions). Haplogroup-defining mutations are additive.

There may be more haplogroup-defining mutations than are displayed, so click on the little paper icons to copy to your clipboard.

You can view upstream haplogroups and downstream haplogroups, if there are any, by following the back arrows to upstream haplogroups, and lines to downstream haplogroups.

For example, I clicked on the arrow beside haplogroup U6a7a1a to view its parent haplogroup, U6a7a1, and a second time to view its parent, haplogroup U6a7a. If I click on the back arrow for U6a7a, I’ll continue to climb up the tree.

Beneath U6a7a, you can see the haplogroup branches, U6a7a1a and U6a7a2.

Beneath U6a7a1, you’ll notice:

  • People who don’t share haplotype clusters with anyone
  • Three haplotype clusters
  • Five descendant haplogroups from U6a7a1, including the LeJeune sister’s haplogroup U6a7a1a.

To expand any haplogroup, just click on the “+”.

You may see icons that are unfamiliar. Mouse over the image or click on the “Show Legend” slider at upper right to reveal the decoder ring, I mean, legend.

You can read more about the symbols and how haplogroups are named, here, and see more about types of mutations in the Scientific Details section.

Takeaways from the Classic Tree

  • The Classic Tree provides a quick summary that includes important aspects of a haplogroup, including when it was formed, which mutations caused it’s formation, and each branch’s confidence level.
  • It’s easy to back your way up the tree to see where your ancestor’s founding haplogroups were located, which speaks to your ancestor’s history. Patterns, paths, and consistency are the key.
  • Ancient DNA locations in your tree can provide a very specific location where a haplogroup was found at a given point in time, but that doesn’t necessarily mean that’s where the haplogroup was born, or that they are your ancestor. We will get to that shortly.
  • You can share this page with others using the “Share Page” function at the top right.

Ancestral Path

The Ancestral Path is a stepping-stone chart where you can view essential information about each haplogroup in one row, including:

  • Age and era
  • Number of years between haplogroups
  • Number of subclades
  • Number of modern-day testers who belong to this haplogroup
  • Number of Ancient Connections that belong to this haplogroup, including all downstream haplogroups

This “at a glance” history of your haplogroup is the “at a glance” history of your ancestors.

The number in the column titled “Immediate Descendants”, which is the number of descendant haplogroups, tells a story.

If you see a large, or “larger” number there, that indicates that several “child” haplogroups have been identified. Translated, this means that nothing universally terrible has occurred to wipe most of the line out, like a volcano erupting, or a famine or plague that would constitute a constraining bottleneck event. Your ancestors’ children survived and apparently thrived, creating many descendant downstream haplogroups, known as an expansion event.

If you see a smaller number, such as rows 5, 7, 8, 9, and 13, each of which have only two surviving branches, yours and another, several branches probably didn’t survive to the present day. This may reflect a bottleneck where only a few people survived or the lines became extinct over time, having no descendants today. Either that, or the right people haven’t yet tested. Perhaps they are living in a particularly undersampled region of the world, a tiny village someplace, or there aren’t many left.

The two most recent haplogroups have the most subclades, indicating that your ancestors were successfully reproducing in the not-too-distant past. Mutations occurred because they randomly do, creating new haplogroups, and several haplogroup members have tested today. Hopefully, genealogy can connect us further.

The next column, “Tested Modern Descendants,” tallies the total number of testers as it rolls up the tree. So, each haplogroup includes the testers in its downstream (child) haplogroups. The 127 people in haplogroup U6a7a1a include the two people in haplogroup U6a7a1a2, and the 226 people in haplogroup U6a7a1 include the 127 people in haplogroup U6a7a1a.

Looking at other types of trees and resources for each haplogroup can suggest where our ancestors were at that time, perhaps correlating with world or regional history that pertains to the lives of those ancestors.

In our case, the LeJeune sisters’ ancestors did well between 3450 years ago through the formation of U6a7a1a, about 1950 years ago. 3500 years ago, in Europe, settlements were being fortified, leadership was emerging as complex social patterns formed, and trade networks developed that spanned the continent and beyond.

Between 20,000 and 3,450 years ago, not so much. This correlates to the time when early European farmers were moving from Anatolia, bringing agriculture to Europe en masse. However, they were not the first people in Europe. Early modern humans arrived and lived in small groups about 50,000 years ago.

And they very nearly didn’t survive. Many lines perished.

Takeaways from the Ancestral Path

  • The Ancestral Path shows the stepping stones back to Mitochondrial Eve, dropping hints along the way where expansions occurred, meaning that your ancestors were particularly successful, or conversely, where a bottleneck occurred and the lineage was in jeopardy of extinction.
  • In some cases, where a lot of time has passed between haplogroups, such as 8,000 years between U and U6, we’re seeing the effect of lineages dying out. However, with each new tester, there’s the possibility of a previously undiscovered branch split being discovered. That’s precisely what happened with haplogroup L7.

Migration Map

The Discover Migration Map shows the path that your ancestor took out of Africa, and where your base ancestral haplogroup was formed.

Mousing over the little red circle displays the haplogroup, and the area where it originated. Based on this location where U6 was found some 31,000 years ago, we would expect to find U6 and subgroups scattered across North Africa, the Levant, and of course, parts of Eurasia and Europe.

It’s interesting that, based on what we know using multiple tools, it appears that haplogroup U initially crossed between the Horn of Africa and the Arabian Peninsula, at the present-day Strait of Bab-el-Mandeb. Today, that crossing is about 15 nautical miles, but the sea level was much lower during earlier times in history, including the last glacial maximum. Humans would have seen land across the water, and could potentially have swum, drifted, or perhaps used early boats.

Over the next 10,000+ years, haplogroup U trekked across the Arabian peninsula into what is present-day Iran, probably moving slowly, generation by generation, then turning back westward, likely in a small group of hunter-gatherers, crossing the Nile Delta into North Africa, present-day Egypt.

They probably fished along the Nile. Food would have been plentiful along rivers and the sea.

It’s exciting to know that the ancestors of the LeJeune sisters lived right here, perhaps for millennia.

There’s more, however.

The Migration Map shows the location of the genetically closest Ancient DNA results to your haplogroup, obtained from archaeological excavations. This mapped information essentially anchors haplogroup branches in locations in both space and time.

Ancient DNA samples are represented by tiny brown trowels. Clicking on each trowel provides summary information about the associated sample(s) in that location.

Takeaways from the Migration Map

  • Scientists have estimated the location where your base haplogroup originated. For the LeJeune sisters, that’s haplogroup U6 in North Africa along the Mediterranean Sea.
  • The trowels show the locations of the genetically closest archaeological samples, aka Ancient Connections, in the FamilyTreeDNA data base.
  • These Ancient Connections displayed on the map may change. New samples are added regularly, so your older samples, except for the oldest two, which remain in place for each tester, will roll off your list when genetically closer Ancient Connections become available.
  • There are no Ancient Connections for the LeJeune sisters in France today, but keep in mind that Europe is closely connected. Today’s French border is only about 25 miles as the crow flies from Goyet, Belgium. France, sea to sea, is only about 500 miles across, and at its closest two points, less than 250 miles.
  • Samples found at these locations span a large timeframe.

There’s a LOT more information to be found in the Ancient Connections.

Ancient Connections

Ancient Connections is one of my favorite Discover features. This information would never have been available, nor synthesized into a usable format, prior to the introduction of Mitotree and mtDNA Discover. Ancient Connections unite archaeology with genealogy.

  • The first thing I need to say about Ancient Connections is that it’s unlikely that these individuals are YOUR direct ancestors. Unlikely does not mean impossible, but several factors, such as location and timeframe need to be considered.
  • What is certain is that, based on their mitochondrial haplogroup, you SHARE a common ancestor at some point in time.
  • Ancient samples can be degraded, with missing genetic location coverage. That means that not every mutation or variant may be able to be read.
  • Different labs maintain different quality criteria, and location alignments may vary, at least somewhat, lab to lab. While this is always true, it’s particularly relevant when comparing ancient DNA results which are already degraded.
  • Samples are dated by archaeologists using a variety of methodologies. FamilyTreeDNA relies on the dates and historical eras provided in the academic papers, but those dates may be a range, or contain errors.
  • Obtaining information from ancient DNA samples isn’t as easy or straightforward as testing living people.

However, the resulting information is still VERY useful and incredibly interesting – filling in blanks with data that could never be discerned otherwise.

Many people mistakenly assume that these Ancient Connections are their ancestors, and most of the time, not only is that not the case, it’s also impossible. For example, a woman who lived in 1725 cannot be the ancestor of two sisters who were born in 1624 and 1633, respectively.

When you click on Ancient Connections, you see a maximum of about 30 Ancient Connections. Information about the genetically closest burial is displayed first, with the most distant last on the list.

Please note that the final two are the oldest and will (likely) never change, or “roll off” your list, unless an even older sample is discovered. When new samples become available and are genetically closer, the oldest other samples, other than the oldest two, do roll off to make space for the closer haplogroups and their corresponding samples.

Obviously, you’ll want to read every word about these burials, because nuggets are buried there. I strongly encourage you to read the associated papers, because these publications reveal snippets of the lives of your haplogroup ancestors and their descendants.

The small pedigree at right illustrates the relationship between the ancient sample and the haplogroup of the tester. Three things are listed:

  1. El Agujero 8, the name assigned by the authors of the paper that published the information about this ancient sample
  2. The haplogroup of the LeJeune descendant who tested
  3. The haplogroup of their common ancestor.

If no haplogroup is specifically stated for the ancient sample, the sample is the same haplogroup as the common shared ancestor (MRCA), meaning the tester and the ancient sample share the same haplogroup.

The Time Tree beneath the description shows the tester’s haplogroup, (or the haplogroup being queried), the ancient sample, and their common ancestral haplogroup.

Let’s analyze this first sample, El Agujero 8.

  • The person whose remains were sampled lived about 1375 years ago (I’ve averaged the range), in the Canary Islands, and is part of the Guanche culture.
  • The Guanche are the indigenous people of the Canary Islands, already established there before the arrival of Europeans and the Spanish conquest of the 1400s.
  • The Guanche people are believed to have arrived in the Canaries sometime in the first millennium BCE (2000-3000 years ago) and were related to the Berbers of North Africa.
  • This makes sense if you consider the Migration map and geographic proximity.
  • Haplogroup U6a7a1, the haplogroup of El Agujero 8, is the shared ancestral haplogroup with the LeJeune sisters.
  • That woman, U6a7a1, lived around 1450 BCE, or 3450 years ago, probably someplace in North Africa, the Mediterranean basin, or even in the Nile Delta region, given the correlation between the Canary Islands settlement, the Berbers, and the Migration Map.
  • This does NOT mean that the ancestor of the LeJeune sisters lived in the Canary Islands. It means that a descendant of their MRCA, haplogroup U6a6a1, the shared common ancestor with the LeJeune sisters, lived in the Canary Islands.

Ancient Connections Chart Analysis Methodology

I create an Ancient Connection chart for each haplogroup I’m dealing with. We’re analyzing the LeJeune sisters today, but I track and analyze the haplogroup for every ancestor whose haplogroup I can find, or for whom I can find a descendant to test.

In this chart, YA=years ago and is based on the year 2000. KYA=thousand years ago, so 10 KYA is 10,000 years ago.

Name Person Lived Location & Culture Haplogroup, Date & Age Shared (MRCA) Haplogroup, Date & Age Note
LeJeune Sisters Born 1624 & 1633 French Acadian U6a7a1a,

50 CE,

1950 YA

U6a7a1a,

50 CE,

1950 YA

In Acadia by 1643/44
El Agujero 8 1375 CE Canary Islands, Guanche U6a7a1

1450 BCE, 3450 YA

U6a7a1 1450 BCE, 3450 YA Guanche arrived in Canaries in 1st millennium BCE, related to Berbers
Djebba 20824 6000 BCE Jebba, Bājah, Tunisia, Neolithic U6a3f3’4’5

c 5000 BCE, 7000 YA

U6a1”9

19,000 BCE, 21,000 YA

This archaeology site is on the northernmost point of North Africa
Djebba 20825 5900 BCE Djebba, Bājah, Tunisia, Neolithic U6a1”9

19,000 BCE, 21,000 YA

U6a1”9

19,000 BCE, 21,000 YA

This archaeology site is on the northernmost point of North Africa
Egyptian Mummy 2973 200 BCE Abusir el-Meleq, Giza, Egypt, Ptolemaic Kingdom U6a3h^,

1450 BCE,

3450 YA

U6a1”9

19,000 BCE, 21,000 YA

Nile Delta probably, paper says they share ancestry with near easterners
Egyptian Mummy 2888 100 BCE Abusir el-Meleq, Giza, Egypt, Ptolemaic Kingdom U6a2a’c,

11,000 BCE,

13,000 YA

U6a1”9

19,000 BCE, 21,000 YA

Nile Delta probably, paper says they share ancestry with near easterners
Segorbe Giant (6’3”) 1050 CE Plaza del Almudín, Valencia, Spain, Islamic necropolis burial U6a1a1, 14,000 BCE, 16,000 YA


U6a1”9

19,000 BCE, 21,000 YA

Paper says his genetic makeup is Berber and Islamic Spain, buried in Islamic style on right side facing Mecca.
Sweden Skara 1050 CE Varnhem, Skara, Sweden, Viking Swedish culture U6a1a3a, 7350 BCE, 9350 YA, U6a1”9

19,000 BCE, 21,000 YA

Viking burial


Chapelfield 696 1180 CE Chapelfield, Norwich, England, Ashkenazi Jewish Medieval age U6a1b1b. 400 BCE,

2400 YA


U6a1”9

19,000 BCE, 21,000KYA

Possibly the 1190 antisemitic Norwich massacre
Montana Mina 38 1200 CE Montana Mina, Lanzarote, Spain (Canary Islands), Guanche culture U6a1a1b1 U6a1”9

19,000 BCE, 21,000 YA

Guanche arrived in Canaries in 1st millennium BCE, related to Berbers
Amina 1725 CE Gaillard Center, Charleston, South Carolina, Enslaved African American burials U6a5b’f’g,

9550 BCE, 11,550 YA,

U6a1”9

19,000 BCE, 21,000 YA

Remains of pre-Civil War enslaved Africans unearthed in Charleston, SC
Doukanet el Khoutifa 22577 4400 BCE Doukanet el Khoutifa, Mars, Tunisia, Maghrebi cultural group U6b,

6500 BCE, 8500 YA


U6a’b’d’e, 23,000 BCE, 25,000 YA Late Stone Age, shows some admixture with European Hunter-Gatherers, possibly back and forth from Sicily
Guanche 12 625 CE Tenerife, Spain (Canary Islands), Guanche, Medieval U6b1a1’6’8’9, 1 BCE,

2100 YA

U6a’b’d’e, 23,000 BCE, 25,000 YA Guanche arrived in the Canaries in 1st millennium BCE, related to Berbers
Guanche 14 775 CE Tenerife, Spain (Canary Islands), Guanche, Medieval U6b1a1’6’8’9, 1 BCE,

2100 YA

U6a’b’d’e, 23,000 BCE, 25,000 YA Ditto above
Antocojo 27 875 CE Antocojo, La Gomera, Spain (Canary Islands) U6b1a1’6’8’9, 1 BCE,

2100 YA

U6a’b’d’e, 23,000 BCE, 25,000 YA Ditto above
Guanche 13 900 CE Cave, Tenerife, Spain (Canary Islands), Medieval U6b1a1’6’8’9, 1 BCE,

2100 YA

U6a’b’d’e, 23,000 BCE, 25,000 YA Ditto above
Guanche 1 1090 CE Cave, Tenerife, Spain (Canary Islands), Medieval U6b1a1’6’8’9, 1 BCE,

2100 YA

U6a’b’d’e, 23,000 BCE, 25,000 YA Ditto above
Barranco Majona 30 1325 CE Barranco Majona, La Gomera, Spain (Canary Islands), Guanche late Medieval U6b1a1’6’8’9, 1 BCE,

2100 YA

U6a’b’d’e, 23,000 BCE, 25,000 YA Ditto above
Kostenki 14 36,000 BCE Markina Gora, Kostyonki, Voronezh Oblast, Russia U2,

43,000 BCE, 45,000 YA


U,

43,000 BCE, 45,000 YA

European/Asian steppe earliest hunter-gatherers. Farming didn’t arrive until 10 KYA. Admixture from Asia as well.
Kostenki 12 31,000 BCE Volkovskaya, Voronezh region, Russian Federation. U2c’e,

43,000 BCE, 45,000 YA


U,

43,000 BCE, 45,000 YA

Early hunter-gatherer
Krems 3 29,000 BCE Wachtberg in Krems, Lower Austria, Austria, Gravettian culture U5,

32,000 BCE,

34,000 YA

U,

43,000 BCE, 45,000 YA

Endured the ice age, sophisticated toolmaking, Venus figures, mobile lifestyle, mammoth hunters
Krems Twin 1 28,800 BCE Left bank of the Danube, Krems-Wachtberg, Austria, Gravettian culture U5,

32,000 BCE,

34,000 YA

U,

43,000 BCE, 45,000 YA

Double grave for twins, 1 newborn, one age about 50 days
Krems Twin 2 28,800 BCE Left bank of the Danube, Krems-Wachtberg, Austria, Gravettian culture U5,

32,000 BCE,

34,000 YA

U,

43,000 BCE, 45,000 YA

Ditto above
Vestonice 13 28,900 BCE Pavlovské Hills, South Moravia, Czech Republic, Grevettian culture U8b^,

37,000 BCE, 39,000 YA


U,

43,000 BCE, 45,000 YA

Ice Age Europe, few samples before farming introduced. Believe these Gravettian individuals are from a single founder population before being displaced across a wide European region.
Vestonice 14 28,900 BCE Dolni Vestonice, Brezi, Czech Republic, Gravettian culture U5,

32,000 BCE,

34,000 YA

U,

43,000 BCE, 45,000 YA

Ditto above
Vestonice 16 28,900 BCE Dolni Vestonice, Brezi, Czech Republic, Gravettian culture U5,

32,000 BCE,

34,000 YA

U,

43,000 BCE, 45,000 YA

Ditto above
Grotta delle Mura child 15,100 BCE Grotta delle Mura, Bari, Italy, Paleolithic Italian culture U2”10,

43,000 BCE, 45,000 YA

U,

43,000 BCE, 45,000 YA

This baby, interred in a small shoreline cave, was less than 9 months old and had blue eyes
Goyette Q2 13,100 BCE Troisième Caverne, Goyet, Belgium, Magdaleian culture named after the La Madeleine rock shelter in France U8a,

10,000 BCE,

12,000 YA


U,

43,000 BCE, 45,000 YA

These hunter-gatherer people may have been responsible for the repopulation of Northern Europe. Cave art, such as that at Altamira, in Northern Spain is attributed to the Magdalenian culture.
Villabruna 1 12,000 BCE Villabruna, Italy, Paleolithic culture U5b2b,

9700 BCE,

11,700 YA


U,

43,000 BCE, 45,000 YA

Rock shelter in northern Italy where this man was buried with grave goods typical of a hunter and covered in painted stones with drawings. The walls were painted in red ochre.
Oberkasel 998 12,000 BCE Oberkassel , Bonn, Germany, Western Hunter-Gatherer culture U5b1 U,

43,000 BCE, 45,000 YA

Double burial found in a quarry with 2 domesticated dogs and grave goods. Genis classification was uncertain initially as they were deemed, “close to Neanderthals.”

Creating a chart serves multiple functions.

  1. First, it allows you to track connections methodically. As more become available, older ones fall off the list, but not off your chart.
  2. Second, it allows you to analyze the results more carefully.
  3. Third, it “encourages” you to spend enough time with these ancient humans to understand and absorb information about their lives, travels, and migrations – all of which relate in some way to your ancestors.

When creating this chart, I looked up every shared haplogroup to determine their location and what could be discerned about each one, because their story is the history of the LeJeune sisters, and my history too.

Ok, so I can’t help myself for a minute here. Bear with me while we go on a little Ancient Connections tour. After all, history dovetails with genetics.

How cool is it that the LeJeune sisters’ ancestor, around 20,000 years ago, who lived someplace in the Nile Delta, gave birth to the next 1000 (or so) generations?

Of course, the Great Pyramids weren’t there yet. They were built abotu 4600 years ago.

Those women gave birth to two women about 2200 years ago whose mummified remains were found in the Pyramids at Giza. The associated paper described Egypt in this timeframe as a cultural crossroads which both suffered and benefitted from foreign trade, conquest and immigration from both the Greeks and Romans.

You can read more about burials from this timeframe in The Beautiful Burial in Roman Egypt, here. A crossroads is not exactly what I was expecting, but reading the papers is critically important in understanding the context of the remains. This book is but one of 70 references provided in the paper.

Some burials have already been excavated, and work continues in the expansive pyramid complex.

The Egyptian sun is unforgiving, but Giza eventually gives up her secrets. Will more distant cousins of the LeJeune sisters be discovered as burial chambers continue to be excavated?

We know little about the lives of the women interred at Giza, but the life of another Ancient Connection, Amina, strikes chords much closer to home.

Amina, an enslaved woman, is another descendant of that woman who lived 20,000 years ago. She too is related to the Giza mummies.

Amina was discovered in a previously unknown burial ground in downtown Charleston, SC, that held the remains of enslaved people who had been brought, shackled, from Africa to be sold. Amina’s remains convey her story – that she was kidnapped, forced into the Middle Passage, and miraculously survived. She succumbed around 1725 in Charleston, SC, near the wharf, probably where her prison ship docked.

Charleston was a seaport where more than a quarter million enslaved people disembarked at Gadsden’s Wharf, awaiting their fate on the auction block. The location where Amina’s burial was found is only about 1000 feet from the wharf and is now, appropriately, considered sacred ground. Ohhh, how I’d like to share this information with Amina.

A hundred years earlier, a different ancestor of that women who lived 20,000 years ago gave birth to the mother of the LeJeune sisters, someplace in France.

Moving further back in time, another distant cousin was unearthed at the Kostyonki–Borshchyovo archaeological complex near the Don River in Russia.

Photographed by Andreas Franzkowiak (User:Bullenwächter) – Archäologisches Museum Hamburg und Stadtmuseum Harburg, CC BY-SA 3.0, https://commons.wikimedia.org/w/index.php?curid=58260865

Markina Gora is an incredibly famous location yielding both specimens included here, as well as this famous Venus figurine from the Gravettian culture, dating from about 27,000 years ago.

Bust of Kostenki 14 reconstructed from the burial.

The earliest of these hunter-gatherers in Europe, believed to be a small group of humans, interbred with Neanderthals. Kostenki 14 carried Neanderthal introgression dating back to about 54,000 years ago.

A layer of volcanic ash, thought to be from a volcano near Naples that erupted about 39,000 years ago, is found above the remains, speaking to events that our ancestors survived after this man lived.

I know we’ve traveled far back in history from the LeJeune sisters, but these ancient humans, the MRCA of each upstream haplogroup, are our ancestors, too.

What does all this mean?

At first glance, it’s easy to assume that all of the locations are relevant to our direct ancestors. Not only that, many people assume that all of these people ARE our ancestors. They aren’t.

Creating the Ancient Conenctions Chart should help you gain perspective about how these people are related to you, your ancestors, and each other.

Each individual person is connected to you and your ancestors in various ways – and their stories weave into yours.

Discover provides everyone has a mini-Timeline for each Ancient Connection. It’s easy to see that the tester, who tested in the modern era, since the year 1950, is not descended from El Agujaro 8, who lived in the 1300s and whose common (shared) haplogroup with the tester, U6a7a1, was born between 2100 BCE and 900 BCE, or between 4100 and 2900 years ago. The most probable date is about 3450 years ago.

The Timeline for each ancient sample includes:

  1. Your haplogroup’s mean birth year
  2. Ancient Connection’s birth year
  3. Ancient Connection’s haplogroup mean birth year, if different from the common haplogroup (in the example above, 3 and 4 are the same)
  4. Birth year of your common ancestor (MRCA), which is your common haplogroup

It’s easy to see the relevant information for each sample, but it’s not easy to visualize the trees together, so I’m creating a “rough” tree in Excel to help visualize the “big picture”, meaning all of the Ancient Connections.

How Do I Know Which Ancient Connections Even MIGHT Be My Ancestors and How We Are All Related?

That’s a great question and is exactly why I created this chart in an ancient haplogroup spreadsheet.

Click on any image to enlarge

In this chart, you can see the LeJeune sisters, in red, at the bottom, and their direct line hereditary haplogroups, in purple, descending from haplogroup U at the top.

Branching to the left and right from intersections with their purple hereditary haplogroups are other branches that the LeJeune sisters don’t share directly. However, the ancient remains that carry those haplogroups are “haplocousins” at a distant point in time, with our LeJeune sisters.

There only two burials that carry the same ancestral haplogroup as the LeJeune sisters:

  1. El Agujero 8, haplogroup U6a7a1 who lived in the Canary Islands in the year 1275
  2. Djebba 20825, who lived in Tunisia about 6,100 years ago

Clearly, Djebba, with a common haplogroup that lived about 21,000 years ago cannot be the ancestor of the LeJeune sisters, but they share a common ancestor. If Djebba was an ancestor of the LeJeune sisters, then Djebba would also descend from haplogroup U6a7, born about 20,600 years ago, like the LeJeune sisters do.

A cursory glance might suggest that since the sample, El Agujero 8 lived in the Canary Islands about 1275, haplogroup U6a7a1 was born there. However, if you read the papers associated with all of the samples found in the Canaries, Tunisia, Spain and other locations, you’ll discover that these populations moved back and forth across the Mediterranean. You’ll also discover that the earliest European haplogroup U samples found in Europe are believed to be the founders of haplogroup U in Europe. It’s possible that U6 dispersed into Italy and Spain, regions with significant exchange with North Africa.

It’s extremely unlikely that El Agujero 8, who lived about the year 1275 CE, was the ancestor of the LeJeune sisters, but it’s not entirely impossible. What’s more likely is that they descended from a common population that moved between Spain, the Canaries, and North Africa where other similar burials are found, like Tunisia. We know that Rome largely conquered France during the Gallic Wars (56-50 BCE), so it’s not terribly surprising that we find haplogroup U6a7a1 and descendants scattered throughout Europe, the Iberian peninsula, the Roman empire, and North Africa.

Sometime between the birth of haplogroup U6a7a1, about 3450 years ago, the descendants of that woman found their way both to France before the 1600s and also to the Canaries before 1275.

Takeaways from Ancient Connections

  • I recommend that you read the associated academic papers and publications that provide the Ancient Connections mitochondrial haplogroups. Those publications are chock full of important cultural information.
  • Globetrekker, which won’t be released until some time after the next release of the Mitotree, will help with tracking the path of your ancestors, especially where it’s complex and uncertain.
  • The “haplosisters” and “haplocousins” of the French LeJeune sisters are quite diverse, including Egyptian pyramid burials in Giza, a Muslim necropolis burial in Spain, a Viking in Sweden, indigenous Canary Islanders, a Tunisian site on the Northern-most tip of Africa, a Jewish burial in England, an enslaved woman in South Carolina, the Markina Gora site in Russia, caves in Austria, the Czech Republic, Belgium, Germany and Italy.
  • Ancient Connections are more than just interesting. On another genealogical line, I found a necropolis burial with my ancestor’s haplogroup located about 9 km from where my ancestor is believed to have lived, dating from just a few hundred years earlier.
  • FamilyTreeDNA adds more Ancient Connections weekly.

Resources

Notable Connections

Notable Connections are similar to Ancient Connections, except they are generally based on modern-day or relatively contemporary testers and associated genealogy. Some samples are included in both categories.

Three Notable Connections are included with the public version of Discover, and additional Notable Connections are provided, when available, for testers who click through from their account.

Some Notable Connections may be close enough in time to be useful for genealogy based on their haplogroup, their haplogroup history, and the tester’s history as well.

In this case, the closest two Notable Connections are both included in Ancient Connections, so we know that the rest won’t be closer in time.

The common ancestor, meaning common haplogroup, of Cheddar Man and the rest, reaches all the way back to haplogroup U, born about 45,000 years ago, so these particular Notable Connections can be considered “fun facts.”

However, if the first (closest) notable connection was a famous person who lived in France in the 1600s, and was the same or a close haplogroup, that could be VERY beneficial information.

Takeaways from Notable Connections

  • Mostly, Notable Connections are just for fun – a way to meet your haplocousins.
  • Notable Connections are a nice way to emphasize that we are all connected – it’s only a matter of how far back in time.
  • That said, based on the haplogroup, location and date, you may find Notable Connections that hold hints relevant to your ancestry.

Scientific Details

Scientific Details includes two pages: Age Estimates and Variants.

Scientific Details Age Estimates

Haplogroup ages are calculated using a molecular clock that estimates when the mutation defining a particular haplogroup first arose in a woman.

Since we can’t go back in time, test everyone, and count every single generation between then and now – scientists have to reconstruct the phylogenetic tree.

The more people who test, the more actual samples available to use to construct and refine the Mitotree.

The “mean” is the date calculated as the most likely haplogroup formation date.

The next most likely haplogroup formation range is the 68% band. As you can see, it’s closest to the center.

The 95% and 99% likelihood bands are most distant.

I know that 99% sounds “better” than 68%, but in this case, it isn’t. In fact, it’s just the opposite – 99% takes in the widest range, so it includes nearly all possibile dates, but the center of the range is the location most likely to be accurate.

The full certainty range is the entire 100% range, but is extremely broad. The mean is  the date I normally use, UNLESS WE ARE DEALING WITH CONTEMPORARY DATES.

For example, if the LeJeune sisters’ haplogroup was formed in 1550 CE at the mean, I’d be looking at the entire range. Do their approximate birth years of 1624 and 1633 fall into the 68% range, or the 95% range, and what are the years that define those ranges?

Scientific Details Variants

Next, click on the Variants tab.

To view your haplotype cluster, the F#, and your private variants, slide “Show private variants” at upper right above the black bar to “on.” This feature is only available for testers who sign in and click through to mtDNA Discover from their page.

The Variants tab provides lots of information, beginning with a summary of your:

  • Haplotype cluster F number, which I’ve blurred
  • Private variants, if any
  • End-of-branch haplogroup information

The most granular information is shown first.

Your haplotype cluster number is listed along with any private variants available to form a new haplogroup. In this case, there are no private variants for these haplotype cluster members. Every cluster is different.

Just beneath that, listed individually, are the variants, aka SNPs, aka mutations that identify each haplogroup. The haplogroup with the red square is yours.

Everyone in this haplogroup shares these two mutations: A2672G and T11929C. Because two variants define this haplogroup, it’s possible that one day it will split if future testers have one but not the other variant.

Information in the following columns provides details about each mutation. For example, the first mutation shown for haplogroup U6a7a1a is a transition type SNP mutation in the coding region, meaning it’s only reported in the full sequence test, where the A (Adenine) nucleotide, which is ancestral, mutated to a G (Guanine) nucleotide which is derived. This is essentially before (reference) and after (derived).

If you mouse over the Weight column, you’ll see a brief explanation of how each mutation is ranked. Essentially, rarer mutation types and locations are given more weight than common or less stable mutation types and/or locations.

Mutations with orange and red colors are less stable than green mutations.

Following this list from top to bottom essentially moves you back in time from the most recently born haplogroup, yours, to haplogroup L1”7, the first haplogroup in this line to branch from Mitochondrial Eve, our common ancestor who lived about 143,000 years ago in Africa.

View More

Clicking on the “View More” dropdown exposes additional information about the various types of mutations and Filtered Variants. Filtered Variants, in the current version of the Mitotree, are locations combined with specific mutation types that are excluded from branch formation.

Please note that this list may change from time to time as the tree is updated.

Takeaways from Scientific Details

  • Based on the Age Estimate for haplogroup U6a7a1a, it’s most likely to have formed about the year 29, but could have formed anytime between about 186 BCE and 230 CE. While this range may not be terribly relevant for older haplogroups, ranges are very important for haplogroups formed in a genealogical era.
  • People who are members of this example haplotype cluster do not have any private variants, so they are not candidates to receive a new haplogroup unless the upstream tree structure itself changes, which is always possible.
  • A significant amount of additional scientific information is available on these two tabs.
  • A list of locations currently excluded from haplogroup formation is displayed by clicking on the “View more” dropdown, along with information about various types of mutations. This list will probably change from time to time as the tree is refined.

Compare

Compare is a feature that allows you to compare two haplogroups side by side.

Let’s say we have an additional woman named LeJeune in Acadia, aside from Catherine and Edmee. As it happens, we do, and for a very long time, assumptions were made that these three women were all sisters.

Jeanne LeJeune dit Briard was born about 1659 and died after 1708. She is the daughter of unknown parents, but her father is purported to be Pierre LeJeune born about 1656, but there’s no conclusive evidence about any of that.

Jeanne LeJeune dit Briard married twice, first to Francois Joseph. Their daughter, Catherine Joseph’s marriage record in 1720 lists Jeanne, Catherine’s mother, as “of the Indian Nation.”

Several direct matrilineal descendants of Jeanne LeJeune dit Briard have joined the Acadian AmerIndian DNA Project, revealing her new Mitotree haplogroup as haplogroup A2f1a4+12092, which is Native American.

If Jeanne LeJeune dit Briard born about 1659, and Edmee and Catherine LeJeune, born about 1624 and 1633, respectively, are full or matrilineal half-siblings, their mitochondrial DNA haplogroups would match, or very closely if a new branch had formed in a descendant since they lived.

Let’s use the Compare feature to see if these two haplogroups are even remotely close to each other.

Click on “Compare.”

The first haplogroup is the one you’re searching from, and you’ll choose the one to compare to.

Click on “Search a haplogroup” and either select or type a haplogroup.

The two haplogroups are shown in the little pedigree chart. The origin dates of both haplogroups are shown, with their common shared ancestor (MRCA) positioned at the top. The most recent common, or shared, ancestor between Jeanne LeJeune dit Briard, who was “of the Indian Nation” and Catherine and Edmee LeJeune is haplogroup N+8701, a woman born about 53,000 years ago.

There is absolutely NO QUESTION that these three women DO NOT share the same mother.

Jeanne LeJeune dit Briard is matrilineally Native, and sisters Caterine and Edmee LeJeune are matrilineally European.

Takeaways from Compare

  • The MRCA between Jeanne LeJeune dit Briard and sisters, Edmee and Catherine LeJeune is about 53,000 years ago.
  • Jeanne was clearly not their full or maternal sister.
  • Compare provides an easy way to compare two haplogroups.

Suggested Projects

Projects at FamilyTreeDNA are run by volunteer project administrators. Some projects are publicly viewable, and some are not. Some project results pages are only visible to project members or are completely private, based on settings selected by the administrator.

When testers join projects, they can elect to include or exclude their results from the public project display pages, along with other options.

The “Suggested Projects” report in Discover provides a compilation of projects that others with the haplogroup you’re viewing have joined. Keep in mind that they might NOT have joined due to their mitochondrial DNA. They may have joined because of other genealogical lines.

While these projects aren’t actually “suggested”, per se, for you to join, they may be quite relevant. Viewing projects that other people with this haplogroup have joined can sometimes provide clues about the history of the haplogroup, or their ancestors, and therefore, your ancestors’ journey.

Remember, you (probably) won’t match everyone in your haplogroup on your matches page, or the Match Time Tree, so projects are another avenue to view information about the ancestors and locations of other people in this haplogroup. The projects themselves may provide clues. The haplogroup projects will be relevant to either your haplogroup, or a partial upstream haplogroup.

The haplogroup U6 project includes multiple U6 daughter haplogroups, not just U6a7a1a, and includes testers whose ancestors are from many locations.

The U6 project has labeled one group of 38 members the “Acadian cluster.” Of course, we find many descendants of Catherine and Edmee LeJeune here, along with testers who list their earliest known ancestor (EKA) as a non-Acadian woman from a different location.

The ancestors of Martha Hughes, who lived in Lynn, Massachusetts, and Mary Grant from Bathhurst, New Brunswick may well be descendants of Edmee or Catherine.

Or, perhaps they are a descendant of another person who might be a connection back to France. If you’re the Hughes or Grant tester, you may just have tested your way through a brick wall – and found your way to your LeJeune ancestors. If you’re a LeJeune descendant, you might have found a link through one of those women to France. Clearly, in either case, additional research is warranted.

For descendants of Catherine and Edmee, you’re looking for other testers, probably from France, whose ancestors are unknown or different from Edmee and Catherine. That doesn’t mean their genealogy is accurate, but it does merit investigation.

Check to see if someone with that EKA is on your match list, then check their tree.

For Catherine and Edmee LeJeune, other than Martha and Mary, above, there was only one EKA name of interest – a name of royalty born in 1606. However, research on Marie Bourbon shows that she was not the mother of the LeJeune sisters, so that tester is either incorrect, or confused about what was supposed to be entered in the EKA field – the earliest known direct matrilineal ancestor.

You may also find people in these projects who share your ancestor, but have not upgraded to the full sequence test. They will have a shorter version of the haplogroup – in this case, just U6a. If they are on your match list and their results are important to your research, you can reach out to them and ask if they will upgrade.

If you’re working on an ancestor whose mitochondrial DNA you don’t carry, you can contact the project administrator and ask them to contact that person, offering an upgrade.

Takeaways from Suggested Projects

  • Suggested Projects is a compilation of projects that other people with this haplogroup have joined. Haplogroup-specific projects will be relevant, but others may or may not be.
  • Testers may have joined other projects based on different lineages that are not related to their mitochondrial line.

We’re finished reviewing the 12 Discover reports, but we aren’t finished yet with the LeJeune analysis.

Another wonderful feature offered by FamilyTreeDNA is Advanced Matching, which allows you to search using combinations of tests and criteria. You’ll find Advanced Matching on your dashboard.

Advanced Matching

Advanced Matching, found under “Additional Tests and Tools,” is a matching tool for mitochondrial DNA and other tests that is often overlooked.

You select any combination of tests to view people who match you on ALL of the combined tests or criteria.

Be sure to select “yes” for “show only people I match in all selected tests,” which means BOTH tests. Let’s say you match 10 people on both the mitochondrial DNA and Family Finder tests. By selecting “Yes,” you’ll see only those 10 people. Otherwise you’ll get the list of everyone who matches you on both tests individually. If you have 100 mitochondrial matches, and 2000 autosomal matches, you’ll see all 2100 people – which is not at all what you want. You wanted ONLY the people who match you on both tests – so be sure to select “yes.”

The combination of the FMS, full sequence test, plus Family Finder displays just the people you match on both tests – but keep in mind that it’s certainly possible that you match those people because of different ancestors. This does NOT mean you match on both tests thanks to the LeJeune sisters. You could match another tester because of a different Acadian, or other, ancestor.

This is especially true in endogamous populations, or groups, like the Acadians, with a significant degree of pedigree collapse.

Advanced Matching Tip

You can also select to match within specific projects. This may be especially useful for people who don’t carry the mitochondrial DNA of the LeJeune sisters, but descend from them.

Switching to my own test, I’ve selected Family Finder, and the Acadian AmerIndian Project, which means I’ll see everyone who matches me on the Family Finder test AND is a member of that project.

Given that I’ve already identified the haplogroup of Catherine LeJeune, I can use known haplogroups to filter autosomal matches, especially in focused projects such as the Acadian AmerIndian Project. This helps immensely to identify at least one way you’re related to other testers.

By clicking on the match’s name, I can see their EKA information. By clicking on their trees, I can verify the ancestral line of descent.

Of course, in Acadian genealogy, I’m probably related to these cousins through more than one ancestor, but using Advanced Matching, then sorting by haplogroup is a great way to identify at least one common ancestor!

Takeaways from Advanced Matching

  • Advanced Matching is a wonderful tool, but make sure you’re using it correctly. Click “Yes” to “Show only people I match in all selected tests.” Please note that if you select all three levels of mtDNA test, and you don’t match at the HVR1 level due to a mutation, that person won’t be shown as a match because you don’t match them on all test levels selected. I only select “FMS” and then my second test.
  • You may match someone on either Y-DNA or mitochondrial DNA and the autosomal Family Finder through different ancestral lines.
  • Advanced Matching is a great way to see who you match within a project of specific interest – like the Acadian AmerIndian Project for the LeJeune sisters.
  • You will match people outside of projects, so don’t limit your analysis.

Drum Roll – LeJeune Analysis

It’s finally time to wrap up our analysis.

The original questions we wanted to answer were:

  • Were Edmee and Catherine LeJeune actually sisters?
  • Was their mother Native American?
  • Was the third woman, Jeanne LeJeune dit Briard, also their sister?
  • Are there any other surprises we need to know about?

We now have answers, so let’s review our evidence.

  • Based on the haplogroup of Edmee and Catherine LeJeune both, U6a7a1a, which is clearly NOT of Native American origin, we can conclude that they are NOT Native American through their matrilineal side.
  • Native American haplogroups are subsets of five base haplogroups, and U is not one of them.

There’s other information to be gleaned as well.

  • Based on the haplogroup of Jeanne LeJeune dit Briard, A2f1a4+12092, plus her daughter’s marriage record, we can conclude that (at least) her mother was Native American.
  • Based on Jeanne’s Native American haplogroup alone, we can conclude that she is not the full sister of the Catherine and Edmee LeJeune.
  • Based on Jeanne’s birth date, about 1659, it’s clear that she cannot be the full sibling of Catherine born about 1633, and Edmee LeJeune, born about 1624, and was probably a generation too late to be their paternal half sister. Later lack of dispensations also suggests that they were not half-siblings.
  • Based on the known Acadian history, confirmed by contemporaneous records, we can state conclusively that Edmee LeJeune was born in France and Catherine probably was as well. The first Acadian settlement did not occur until 1632, and the first known families arrived in 1636.
  • Based on the fact that Catherine and Edmee’s haplogroups match, and many of their descendants’ mitochondrial DNA matches exactly, combined with later dispensations, we can conclude that Catherine and Edmee were sisters.
  • We can conclusively determine that Catherine and Edmee were NOT Native on their matrilineal side, and given that they were born in France, their father would have been European as well. However, we cannot determine whether their descendants married someone who was either Native or partially Native.
  • We know that information for partial haplogroup U6a, provided for HVR1 and HVR1+HVR2-only testers is not necessarily relevant for full sequence haplogroup U6a7a1a.
  • The recent Mitotree release has moved the haplogroup “dates” for the LeJeune sisters from about 21,000 years ago for HVR1/HVR2 U6a testers to 50 CE for full sequence testers,. These dates may well be refined in future tree releases.
  • Having multiple testers has provided us with an avenue to garner a massive amount of information about the LeJeune sisters, in spite of the fact that their haplogroup was born about 50 CE.
  • The LeJeune sisters are related to, but not descended from many very interesting Ancient Connections. Using our Ancient Connections spreadsheet, we can rule out all but one Ancient Connection as being a direct ancestor of the LeJeune sisters, but they are all “haplocousins,” and share common ancestors with the sisters.
  • While we cannot rule out the genetically closest Ancient Connection, El Agujero 8, who lived about 1275 CE in the Canary Islands as their direct ancestor, it’s very unlikely. It’s more probable that they share a common ancestor in haplogroup U6a7a1 who lived about 3450 years ago, whose descendants spread both into France by the 1600s and the Canary Islands by the 1200s.

By now, you’re probably thinking to yourself that you know more about my ancestors than your own. The good news is that mitochodnrial DNA testing and mtDNA Discover is available for everyone – so you can learn as much or more about your own ancestors.

Spread Encouragement – Be a Positive Nellie!

Unfortunately, sometimes people are discouraged from mitochondrial DNA testing because they are told that mitochondrial haplogroups are “too old,” and matches “are too distant.” Remember that the MRCA of any two people, or groups of people is sometime between the haplogroup formation date, and the current generation – and that’s the information we seek for genealogy.

Furthermore, it’s those distant matches, beyond the reach of autosomal matching, that we need to break down many brick walls – especially for female ancstors. I offer testing scholarships for ancestors whose mitochondrial DNA is not yet represented. It’s information I can’t obtain any other way, and I’ve broken through many brick walls!

We don’t know what we don’t know, and we’ll never know unless we take the test.

Imagine how much could be gained and how many brick walls would fall if everyone who has tested their autosomal DNA would also take a mitochondrial DNA test.

Which ancestors mitochodrial DNA do you need? The best place to start is with your own, plus your father’s, which gives you both grandmother’s mtDNA and directly up those lines until you hit that brick wall that needs to fall.

Additional Resources

Roberta’s Books:

_____________________________________________________________

Share the Love!

You’re always welcome to forward articles or links to friends and share on social media.

If you haven’t already subscribed (it’s free,) you can receive an e-mail whenever I publish by clicking the “follow” button on the main blog page, here.

You Can Help Keep This Blog Free

I receive a small contribution when you click on some of the links to vendors in my articles. This does NOT increase your price but helps me keep the lights on and this informational blog free for everyone. Please click on the affiliate links in the articles or to the vendors below if you are purchasing products or DNA testing.

Thank you so much.

DNA Purchases and Free Uploads

Genealogy Products and Services

My Books

Genealogy Books

Genealogy Research

Wherefore Art Thou, Oh Ancestor? – New Generation Tree Chart Suggests Where to Look in Your Matches’ Trees

When you see a DNA match, do you wonder how far back in your trees your common ancestors live? How do you know where to search?

I’ve been working through my DNA match list person by person, reviewing the information and trees for each match, searching for common ancestors.

Whether you’re looking at individual matches, shared matches, clusters or triangulation groups, trees are essential for finding common ancestors.

My favorite vendor-provided tree is my MyHeritage tree. They’ve done a great job, so I’m using their tree for my examples today.

Here’s the question I’m trying to answer – based on how much DNA I share with someone, how far up that person’s tree, roughly, do I need to look for our most recent common ancestor? And, is there something else I can tell?

Tree Size Matters aka How Far Up the Tree Do I Need to Look?

So, if you click on your matches’ trees, how far up their tree do you need to look for a common ancestor? How many times will you need to click to expand their tree beyond the 4 (Ancestry) or 5 (MyHeritage) generations initially displayed, assuming your match has a tree that size? How far out, meaning how many generations do you need to hope and pray they have extended their tree?

Conversely, how many generations do YOU need to include for your tree to be useful for:

  • Other testers to find common ancestors with you
  • Theories of Family Relativity provided by MyHeritage, suggesting common ancestors with other testers
  • ThruLines at Ancestry
  • Family Matching (bucketing) at FamilyTreeDNA which assigns your matches either maternally or paternally. (Note – FamilyTreeDNA is transitioning their trees to the MyHeritage platform.)

If you’re thinking that the size of YOUR tree doesn’t matter, think again.

Not only can the vendors not help you effectively without a tree – genealogy is a collaborative sport. Other people NEED the generations in your tree to locate your common ancestors, just like you NEED to see as many generations in their tree as possible. The vendors NEED as complete a tree as you can provide to help you further.

DNA+Trees Bulldoze Brick Walls

But maybe the most important aspect is that you NEED trees to break through brick walls – especially in conjunction with DNA and tools like clustering that show you visual images of genetic commonality.

We all need to be team players when we have that option – meaning we know who are ancestors are. Our brick walls can be solved, and you can be a puzzle piece of solving brick walls for others too.

Some of my closest friends and cousins are a direct result of DNA matches and genealogy collaboration over the years. (You know who you are!) I’ve even discovered that several friends are cousins too – which I would never have happened without DNA and trees.

Guidelines for What’s Reasonable

What is a reasonable number of generations to peruse for common ancestors?

The answer is – it depends! (I’m sorry…)

Let’s sort through this.

Given that, on AVERAGE, inherited autosomal DNA from a particular ancestor is halved in each successive generation during recombination between the parents, we can calculate the expected average. However, in reality – DNA isn’t always halved. Sometimes segments are passed intact, divided but not in half, or not inherited at all. That’s why you may not match some third cousins, but match some 7th cousins. Random recombination is, in fact, random.

Every segment has its own individual history.

That’s part of the reason we use triangulation, to confirm that a specific segment originated with a particular couple or ancestral line.

Here are a few rules of thumb, with links to articles that explain the various terms and concepts:

  • There are no known instances of second cousins or closer NOT matching.
  • Some (but not all) people find their common ancestor in the first 5 or 6 generations.
  • Many people have proven, triangulated matches to the 10th generation, but those are more difficult to prove, often due to incomplete trees (brick walls) at that distance on either your side, your match’s side, or both. I have no brick walls at 5 generations, counting my parents as generation 1, but I have 6 female brick walls in the 6th generation.
  • If you’re lucky, you can spot your common ancestral surname on the first page of your match’s tree – and follow that line back. Note that there may be additional common ancestors, so view each of their lines to the end. The MyHeritage tree makes this super easy!
  • Pedigree collapse, where you, and/or the other person share multiple lines, known or unknown, is a complicating factor. Pedigree collapse often means you share more DNA than would be expected for a specific relationship.
  • Endogamy, which is pedigree collapse on steroids, is real and will cause many smaller matches.
  • Based on the number of distant versus close cousins you have, you will have MANY more smaller matches than larger ones.
  • And last, but not least, some matches, especially smaller ones, are identical by chance (IBC), not identical by descent (IBD).

All of that said, we can estimate the number of generations back in our matches’ trees where we might need to look for that common ancestor.

As I’ve been reviewing all of my matches, I realized that I can look at the match cM size and mentally size up just about where in their tree I will find our common ancestor. In essence, I’ve “bottled that” for you, here.

Using Trees Effectively

One of the reasons I love the MyHeritage tree is that as you need to click further back in trees beyond the generations initially displayed, which occurs often – the next generations open to the right, the earlier generations just shift left and they all remain visible.

I know that might not sound important, but it is – incredibly – especially when you’re evaluating several matches. Otherwise, it’s easy to lose track of where you are in someone’s tree. I have 9 generations open, above, and I can just keep going – with the more recent generations just shifting left.

But there’s more!

When viewing matches’ trees, I can also click on anyone in their tree, and a profile box opens to the left with additional information about that person, leaving the tree open so I don’t lose my place and have to click around to find it again. I can’t even begin to tell you how wonderful this is, and it’s unique to MyHeritage. You can tell the MyHeritage tree was designed by actual genealogists.

This feature is incredibly useful because many, if not most, of the common ancestors with your matches will be beyond the first page displayed.

Thank you, thank you, MyHeritage!!!

Estimating the Number of Generations by the Amount of Shared DNA

How far up the tree you’ll need to look can be estimated by the amount of DNA that you share with a particular match.

Vendors estimate the relationship of DNA matches by either the percentage of shared DNA or the number of shared centimorgans (cMs), but there’s no quick reference to show you, generationally, where to focus in you and your matches’ trees for your common ancestor.

That’s the handy reference Generation Tree Chart that I’ve created here.

In the article, Shared cM Project 2020 Analysis, Comparison and Handy Reference Charts, I compiled information from multiple sources into one chart detailing HOW MUCH DNA can be expected to be shared at various relationship levels. Shared cM Project information is also visualized at DNAPainter

What I need to know now, though, isn’t an estimate of how closely we are related, but how many generations back to look for our common ancestor in my and their trees.

As I’m clicking through my matches, the majority, by far, are smaller than larger. That makes sense, of course, because we have many more distant relatives than close relatives.

At FamilyTreeDNA, I have 8758 matches who are not immediate or close family.

Number of Matches Relationship Range cM Range
10 Half-1C and 1C1R 318-637 cM
4 2C and equivalent 159-318 cM
7 Between 2C-3C, such as half-2C 80-159 cM
79 3C and equivalent 40-80 cM
814 3C-4C and equivalent 20-40 cM
7548 4C and equivalent 9-20 cM
293 Below 4C and equivalent 7-9 cM

I know the people in the first two categories and some of the people in the third category, but the genetic/ancestral scavenger hunt begins there.

All Cousins Are Not Equivalent

You’re probably wondering about the word “equivalent.” Genetically, people of different relationships carry the same amount of expected DNA. We not only have 5th cousins (5C), for example, we have:

  • Half-fifth-cousins
  • Fifth-cousins-once-removed (5C1R)
  • Fifth-cousins-twice-removed (5C2R)
  • And so forth

I wrote about determining cousin relationships, meaning halves and removed,here.

Genetically speaking, a 5C2R carries the same expected amount of shared DNA as a 6C, so they are functional equivalents. How do we resolve this and where do we look in our trees for our common ancestors?

I’m so glad you asked!

Where Do Various Cousin Levels Fall in My Tree?

We know that first cousins share grandparents, but as we get further back in our tree, it’s difficult to remember or calculate how many generations back a 6th cousin is in our tree.

I’ve used my MyHeritage tree to display 1st through 10th cousins, labeled in red, and the generation number they represent, in black. So, my common ancestors with my second cousins are found 3 generations out in my tree.

Making things more challenging, however, is that unless we know the match already, we’re trying to figure out how closely the match is actually related to us based on their DNA. Not all cousins of any level share the same amount of DNA, so the best vendors can do is provide an estimate or relationship range.

To determine our actual relationship, we need to find our most recent common ancestor.

Where, approximately, in my tree would I look for each category of match, especially that huge group of 7548 people?

Good question!

The Generation Tree Chart is Born

I needed a quick reference for approximately how many generations back in time our common ancestors existed by how much DNA we share, so I know how far back in someone’s tree I need to look.

I’ve reorganized the data from my earlier articles and created a new resource.

The Generation Tree Chart

The Generation Tree Chart:

  • Is not meant to identify parents or close relatives.
  • Does not include parents or grandparents.
  • Counts your parents as generation 1. Some people count themselves as generation 1. If you’re discussing this table, keep in mind that you may be one generation “off” in your discussions with someone who counts differently.
  • This chart clusters the relationships according to color, based on how much DNA people of that relationship are expected to share. For example, a first-cousin-twice-removed (1C2R) shares the same expected amount of DNA with you as a second-cousin (2C).
  • All cousin relationships that are expected to share the same amount of DNA are in the same color band.
  • If you’re using this chart with Ancestry’s numbers, use the unweighted (pre-Timber) amount of DNA.

The colored bands correlate to shared DNA, but the shared ancestor isn’t necessarily the same generation back in time.

This is my “show your work” chart. You’ll notice a few things.

  • The “Avg % Shared” column is the amount of shared DNA expected based on a 50% division (recombination) in each generation, which almost never happens exactly.
  • The “Expected cM” column is the expected cM amount based a 50% division in each generation.
  • I’ve incorporated the DNAPainter mean, low and high range for each relationship.
  • The expected number of shared cMs, in the “Expected cM” column is almost always smaller than the “cM Mean” from DNAPainter. The mean is the midpoint reported in the Shared cM Project for all respondents of that relationship who reported their shared DNA – minus the outliers.

This fact that reported is often significantly higher than expected is particularly interesting. In the closer generations, it doesn’t really matter, but beginning about the 6th blue band and the 7th red band in the chart, the mean is often twice the expected amount.

Remember that DNAPainter numbers are based on the Shared cM Project which relies on user-reported relationships and their associated cM match amounts. You can view Blaine Bettinger’s paper about the most recent Shared cM Project version (2020) and his methodologies here.

My theory is that the more distantly people match, the less likely they are to report the relationship accurately. They may be reporting the relationship they believe to be accurate, life a full versus a half cousin, but that’s not actually the case. It’s also possible that there are multiple unknown relationships or pedigree collapse, or both.

Furthermore, from the red band to the end of the chart, the reported amounts are significantly higher than expected, which is probably a function, in part, of “all or nothing” segment transmission. In other words, if someone’s parent carries a 10 cM segment, you’re probably going to inherit all of it or none of it. If it’s actually divided to 5 and 5 cM, you’re not going to see it on any match list.

In my case, I have several 8 cM triangulated matches who descend from common Dodson ancestors whose descendants intermarried a couple of generations later. Therefore, these matches are, respectively, both my 6C2R and 7C3R from the same line (20 cM total match), two matches at 6C1R (66 cM and 19 cM), and one 6C (51 cM). These people also triangulate on multiple segments. Given the high amount of shared DNA for this relationship level, I suspect additional pedigree collapse someplace. At least one person also matches on an unrelated line that I never realized before doing this match-by-match analysis, which opens up new possibilities.

Next, the meat of this chart.

  • The “Generations Back in Tree” column shows where your common ancestor with someone in that cousin generation would be expected. For example, in the first three bands, all of the first cousin variants are found two generations back, and your grandparents are your common ancestors.

All of the 2C variants descend through great-grandparents, which are 3 generations back in your tree.

Plase note that you can easily find the amount of DNA that you share with a match in the “Expected cM” and “Mean” Columns, and look to the right to see the Generations Back in Tree. 

For example, if I have a match where I share 20 cM of DNA, I’m going to be looking between the red band and the second white band. The generations back in tree range from 4-6, or the common ancestor could potentially be further back. In other words, if I’m lucky, I’ll spot common ancestors on the first tree page displayed, but I may well need to display additional generations.

  • The “Common Ancestors” column displays the common ancestor with anyone in that cousin generation. So, anyone in any variation of 3C shares great-great-grandparents with you.
  • “How Many” shows how many great-great-grandparents you have – 8.

Color Bands and Generations

Color bands represent the same amount of expected DNA, but the various relationships that are included in those bands represent at least two different “Generations Back in Tree.”

For example, looking at the green band, the half 1C3R will be found in the grandparents generation, or generation 2, the 2C2R and half 2C1R are in the great-grandparents, or generation 3, and the 3C is found in the great-great-grandparents, or generation 4.

Where I really needed this chart, though, was in the more distant generations. While we are clearly dealing with a range, if I see a match with 11 or 12 cM, our common ancestor is nearly always at least 6 generations out, and often more.

The Net-Net of This Exercise

The majority of my matches, 7548, fall into the red band of 9-20 cM, which should be the 4th or 5th generation, either great-great or GGG-grandparents, but in reality, common ancestors will often be found more distantly in matches’ trees.

Most of your matches will be 20 cM or below, meaning they are at least 4/5 generations distant, or further – which translates to NOT the first tree page displayed. This why using the MyHeritage tree is so convenient, because when you click to the next generations, they just open and it’s VERY easy to quickly click and expand every generation with no back-clicking needed. Tip – when viewing profile cards for their ancestors, be sure to note locations which are important hints too. You can also click to “research this person.”

If your match doesn’t have a tree developed to at least 5 generations, it’s unlikely that you will be able to find a common ancestor for someone with less than a 20 cM match. However, all is not lost because you may recognize a surname, and if you build out the tree for your match, you may find your common ancestor. I build out my matches’ trees often! (Yes, it’s painful and irritating, but just do it! After all, we’re genealogists. We got this.)

For people with smaller cM matches, you may be looking even further out. I have some solid triangulated matches with multiple people at 6 and 7 generations..

The further out in time, the more triangulated people you need to be confident that your common ancestor who contributed that segment is identified correctly. At that distance, most people will have dead end lines and brick walls, probably yourself included.

However, my research methodology has the potential to break through brick walls.

Brick Walls Breakers

When I’m working on match and triangulation clusters, not only am I looking for MY known ancestors, I’m also looking for common surnames, or more specifically, common ancestors between my matches trees.

In some cases, common ancestors only mean that I’m viewing first cousins to each other, but in other cases, those common ancestors between my matches, but not me, MAY POINT DIRECTLY TO A MISSING BRICK WALL ancestor of mine.

Another hint that this might be the case is when the shared cMs seem high relative to how far back your common identified ancestor is in your tree – which is the case with my Dodson cluster. There may be a second relationship obscured there, especially if they match each other more “normally” and it’s only my matches that are higher than expected with multiple people in this cluster.

Research Methodology

If you’re wondering how I approach this process, I use a spreadsheet organized by triangulation cluster because everyone in a triangulation cluster matches each other on a particular segment. This means that the triangulated segment comes from a common ancestor (or is idencal by chance.) Each match has it’s own row in the cluster on my spreadsheet.

This spreadsheet could also be organized by shared match or matrix cluster, but I prefer smaller triangulation clusters where everyone matches each other and me on the same segment – because it points to ONE shared souce of the DNA – meaning one ancestor or ancestral couple.

I downloaded my match list at FamilyTreeDNA where I can see which matches are assigned either maternally or paternally based on identified, linked relationships, and who matches on the same segments. I used that spreadsheet as the foundation of this spreadsheet, but I could also add people who match on that segment and triangulate from other vendors who provide matching segment information, such as MyHeritage.

Using my Dodson example group, this group of people above, on my father’s side, hence the blue color, also triangulates on other segments. Other clusters are significantly larger, with around 50 cluster members.

One person, JA, descends from Dodson cousins who intermarried, which is pedigree collapse, so they may carry more Dodson/Durham DNA than they would otherwise.

If someone has a small tree, I often use traditional genealogy resources to expand their tree if I recognize a surname.

I track my other ancestors’ surnames that I notice in their trees, which provides a clue for additional ancestors. Of course, common surnames sometimes aren’t useful. However, one match, JC, found in this group is a proven Crumley line cousin who has colonial Virginia ancestors, but no prior knowledge of a Dodson/Durham line – so this could be a HUGE hint for one of JC’s brick walls.

This example cluster from my mother’s side includes my mother, who I haven’t listed, and also RM, a known second cousin who I tested. Based on his known common ancestors with me, I know immediately that these segment matches all track to John David Miller and Margaret Elizabeth Lentz, or beyond. Sure enough DW has a tree where our common ancestor is David Miller, father of John David Miller, and TK is related to DW based on an obituary. So far, we know this segment originated with David Miller and his wife, Catherine Schaeffer, but we don’t know if the segment originated with the Miller or Schaeffer parent.

One additional cluster member shows a Cyrus Miller out of Pennsylvania and my initial attempt at extending their tree using WikiTree, MyHeritage and Ancestry to find a common ancestor was not fruitful, but a deep dive might well produce more, or the common ancestor could reach back into Europe.

As new people test and match, I can add them to the spreadsheet in the clusters where they fit.

Summary Generation Tree Chart

Here’s a summary version of the Generation Tree Chart for you to use, without the cM high and low ranges, and without the red boxes. This is the one I use the most.

Here’s the full chart, including the ranges, but with no red boxes.

The Bottom Line

To derive the most benefit, we all need to develop our trees as far as possible, and share with others. A rising tide lifts all ships!

It’s impossible to identify common ancestors without trees, which means it’s also impossible to use genetic genealogy to break through brick walls.

Please check your trees at the various vendors, if you have multiple trees, and at WikiTree, to be sure you’ve added your most distant known ancestor in each line.

Link your known relatives to their position in your tree at FamilyTreeDNA, which allows them to triangulate behind the scenes and assign (bucket) your matches either maternally or paternally on your match list.

What new information is waiting for you in your matches? Do you have brick walls that need to fall?

_____________________________________________________________

Share the Love!

You’re always welcome to forward articles or links to friends and share on social media.

If you haven’t already subscribed (it’s free,) you can receive an e-mail whenever I publish by clicking the “follow” button on the main blog page, here.

You Can Help Keep This Blog Free

I receive a small contribution when you click on some of the links to vendors in my articles. This does NOT increase your price but helps me keep the lights on and this informational blog free for everyone. Please click on the affiliate links in the articles or to the vendors below if you are purchasing products or DNA testing.

Thank you so much.

DNA Purchases and Free Uploads

Genealogy Products and Services

My Books

Genealogy Books

Genealogy Research

How to Use Ancestry’s New Match Clusters and What They Mean

Ancestry recently introduced matches by cluster a new ProTools feature that clusters your matches together. And no, before you ask, this is not the long-awaited triangulation.

Ancestry’s new match clusters are a grid-based visualization of your shared matches.

Manual clustering was introduced by Dana Leeds in September of 2018, and, appropriately, named the Leeds Method.

You’ve probably seen similar automated clustering features at Genetic AffairsMyHeritage, and GEDmatch. Now Ancestry has climbed on the bandwagon, too.

The purpose of clustering is to group your matches that also match each other together. Clustered matches don’t necessarily match on the same segments, which is what defines triangulation.

Cluster members who match each other share common ancestors. Grouping them together in clusters helps you figure out the ancestor for the entire group.

Note that clustering requires a ProTools subscription, in addition to either an Ancestry family history membership or AncestryDNA Plus. Ancestry’s subscription model can be viewed here.

Let’s take a look at Ancestry’s clusters, discuss how clusters work conceptually, and then how clusters can help us with our genealogy.

Viewing Your Clusters

Sign on, select DNA, Matches, and then “By cluster.”

Everyone in a cluster matches you, and many of your matches match each other too.

Ancestry, in their Clustering introduction and support article, explains that:

  • Clustering looks at matches on each side of your family between 65 cM and 1300 cM.
  • They exclude close family members, such as parents, children, siblings, half-siblings, aunts, uncles and their children. Many of the people designated as “Close Family” on my match list are included in clusters, so “Close Family” on your match list is not the same as “close family” who is excluded from clusters.
  • While cousins are very useful to separate matches, close relatives like parents and siblings would be in just about every cluster, so they aren’t useful.
  • Ancestry compares your qualifying matches to see who shares 20 cM or more of DNA with each other
  • People who all match you above 65 cM, AND each other at 20 cM or greater, after Timber, are candidates to form a cluster. Not everyone in a cluster matches everyone else, but everyone matches some other cluster members.

To be clear, Ancestry includes SOME qualifying people in clusters, but not all people who qualify. We don’t know how or why that decision is made, but not everyone who meets these qualifications is included in a cluster.

While that’s frustrating and confusing, the clusters we do have are valuable for determining where those people fit in the puzzle, plus, I’ve developed an easy workaround for those unclustered shared matches.

Let’s view your clusters.

Viewing Your Cluster Members

I have two separate Ancestry DNA tests because I tested on two different chip versions. I have intentionally used all of the tools on one kit, and have not on the other, so that I can see a test “in the raw” compared to one that has utilized all of Ancestry’s available tools.

I refer to the first test as my V1 “tricked out” version, and the second test, V2 is “less developed”.

My cluster results are somewhat different between the two.

Also, every time you sign in or click on “By cluster,” Ancestry recalculates your clusters, so they may be slightly different from one time to the next, or one day to the next. This could be a function of Clusters being in Beta, or maybe not. New matches may also force reclustering, of course, but I haven’t had new qualifying matches since clusters was released. Basically, Ancestry uses between first and third cousins to define clusters.

Roberta’s V2 “Less Developed” Test

I’m starting with the less developed V2 test, because I did NOT use SideView to designate which parent is which by assigning either identifiable unique ethnicity or known matches to a specific parent. Everyone who can should utilize SideView.

Ancestry does their best to assign clusters to one parent or the other, even if you don’t (or can’t) designate parental “sides,” meaning which parent is which.

At the top of the cluster page, you’ll see tabs for “All”, “Parent 1”, and “Parent 2.”

The default view is “All,” so clusters from both parental sides are included in this display, if you have clusters on both sides.

Even though I did NOT use sideview to designate which parent certain matches or ethnicity are from, Ancestry was able to identify some clusters from Parent 1 and some from Parent 2. In total, I have 9 clusters with a total of 92 different people in those clusters.

In this test, you can see the clusters at the top of the page, but my V1 “tricked out” test is different.

Roberta’s V1 “Tricked Out” Test

I have used SideView to indicate parental “sides” using my ethnicity and/or known close matches for this test.

If you have used Sideview to indicate which side is which, then your cluster selections will say “All,” “Maternal,” and “Paternal.”

Notice, though, that this test does NOT show any of my clusters at the top like the V2 test did, just the dropdown description boxes where you can view each individual cluster.

This is because I have more than 100 cluster members, but it’s anything but intuitive and is apparently what the message, “Chart view is available for clusters of 100 matches or fewer,” is trying to tell me. However, I had no idea what “chart view” was, or, without adding the totals from each cluster, that I have more than 100 cluster members. In other words, no one who sees this will know what is missing, or why. Now you know!

Fortunately, I have other tests available from other testers that I could check.

For example, I manage my Acadian cousin’s test. He is heavily endogamous and has more than 700 people in his clusters. His clusters don’t show at the top of his page either. The tests I manage with less than 100 cluster members all show their clusters when they first open their cluster page.

This restriction also pertains to the number of matches within any individual cluster. Essentially, a cluster or combined clusters of 100 people is just about all that can be displayed on a computer screen, left to right.

Regardless, either way, your entire group of clusters is shown together initially, either in the grid format, which they’ve named “chart format” if 100 or fewer, and in a list accessible via dropdowns for everyone.

My Clusters

I’m using my V1 “tricked out” test for the rest of this article because it’s the one where I’ve used all the available tools. Therefore, my best result should be obtained using this test.

Ancestry has created eight clusters for me with a total of 102 members, which is why I don’t see the nice little grid view at the top of my list, but my V2 test with only 92 cluster members displays the chart/grid view.

To view any individual cluster, click on the dropdown box. If the clusters are displayed at the top, scroll down to the dropdown boxes beneath the colorful cluster view.

After clicking the down arrow, here’s a view of my first cluster.

  • All of these people match me at a qualifying level meaning 65-1300 cM and are not a close relative.
  • Not everyone included in a cluster will match each other.
  • The colored cells indicate matches, meaning those people also match each other at 20 cM or greater.
  • The non-colored or “blank” cells indicate that those two intersecting people don’t match each other at 20 cM or more. It does NOT mean they don’t match each other at all, just not above 20 cM which is the lowest amount of shared DNA between your matches that you can see using ProTools.

The first person in this cluster, meaning “DP”, the person in the top row (also the first column), matches everyone else in the cluster. The second person, “ER”, matches everyone except five people in the cluster, and so forth.

Hovering over any colored cell tells you how closely these two individuals are related to each other.

Scrolling down below the cluster displays your match information to each cluster member, including whether they have a tree and their estimated relationship to you.

I label my matches by MRCA, or most recent common ancestor, in the notes field. If Ancestry can identify a common ancestor based on both of your trees, they will note that there is a “Common ancestor,” which is ThruLines. To view additional information, click on that link.

Each cluster can be traced back to an ancestral couple.

My first cluster has 27 members, and I had previously figured out how most of them are related to me, meaning our common ancestor. I had already labeled them accordingly in the Notes field, and also by creating “group labels” for each ancestral couple, which we’ll discuss in a minute.

Of these 27 cluster members:

  • 13 track back to Lazarus Estes and Elizabeth Vannoy
  • 3 track back to John Y. Estes and Martha Ruthy Dodson
  • 4 have private trees
  • 2 have no trees
  • 2 have very tiny trees
  • 2 people share multiple ancestors with me, so they may be in other clusters too
  • The common ancestor of 3 cluster members remains a mystery, but I know this is “how” they are related because they are a member of this cluster

Clusters may contain people with generational differences. For example, it’s very likely that this entire cluster descends from John Y. Estes and Martha Ruth Dodson, but 13 people can only be tracked to Lazarus Estes and Elizabeth Vannoy based on their trees alone. No one in this cluster can be traced to Elizabeth Vannoy’s parents. Since 3 cluster members can be traced to Lazarus Estes’s parents, the entire cluster probably originated with John Y. Estes and Martha Rutha Dodson.

However, for now, I’m assigning this cluster to Lazarus and Elizabeth.

Viewing Maternal and Paternal Groups of Clusters

By clicking on either Maternal or Paternal at the top, you see a view of multiple maternal or paternal clusters, so long as the total number of members isn’t over 100.

I have three clusters on my mother’s side: two fairly large ones, plus the small green third cluster.

I can tell by the matches, some of whom I know, that the purple cluster is my mother’s paternal side, and the blue cluster is my mother’s maternal side.

The green cluster also includes my mother’s paternal line. How do I know this? The grey cells indicate people who are members of both clusters. Grey cells are intersections between two different clusters.

Follow the first person, “DZ”, or any purple person, through the purple cells, across the blue cells to their first grey cell, then directly down to the green cell, and those two people are members of the green cluster too.

So, for any one person, to see how many clusters they are a member of, and who they match in every cluster, just follow their row straight across, left to right. Or straight down, if you prefer top to bottom.

If you’re wondering how someone could be in BOTH my mother’s maternal and paternal clusters, the answer is first cousins and their descendants who descend from both of my grandparents.

Cluster Members in Multiple Clusters

Please note that when viewing cluster members in the cluster dropdown boxes, that:

  • When someone is a member of BOTH the purple and green cluster, they are only listed as a member of ONE cluster, not both.
  • Therefore, any individual person is only listed once, not in each cluster of which they are a member.
  • This also means they are only counted once, not twice.

For example, the person in the first row, “DZ”, is a member of both the purple and the green cluster, but in the cluster dropdown, DZ is only listed as a member of the purple cluster, NOT the green cluster. It’s exactly the opposite for “MF” who is a member of both, but is listed only in the green cluster but not the purple cluster.

Looking back at the image, you can see that everyone in the green cluster is also a member of either the purple cluster, the blue cluster, or all three.

Someone that is a member of two clusters, but only listed in one cluster, was very confusing until I realized what was going on. This makes it unnecessarily difficult to identify clusters and associate them with ancestors.

However, I created an easy workaround.

While listing someone who is a member of multiple clusters in only one cluster makes it difficult to identify ancestors with whom clusters are associated, you can overcome this by creating a separate spreadsheet or chart and manually add the people associated with two or more clusters. Just follow each person’s row across left to right and use the grey squares in the cluster image. Of course, your analysis will reveal WHY they are members of multiple clusters.

This approach works as long as you don’t have more than 100 people on either your maternal or paternal side, respectively. If the page of clusters is larger than 100, you can’t see the multiple cluster image, so you’re out of luck tracking matches in multiple clusters because you need to see those grey cells.

One person who is a member of two clusters means that they are in a cluster for each of two different ancestral couples. For example, let’s say Cousin John is in a cluster for Joe Smith and Jane Johnson. He’s also in a second cluster for Jane Johnson’s parents. Cousin John could be in a third cluster too, for Joe Smith’s parents, or a different ancestral couple on his other parent’s side.

Every cluster has their own unique history and it’s your job to figure out which ancestral couple each cluster represents. .

For example, I’ve scrolled down on my Paternal Clusters to the bottom. I have five clusters, and you can see that many people are members of multiple clusters. Some people are in four clusters, counting the marks in the spaces for the various clusters for each match.

One person is a member of all five clusters, but I happen to know some of my matches descend separately from both sides of my father’s family – so we have pedigree collapse. These people could also be descendants of my aunts and uncles, for example, so we do share all of our ancestors on my father’s side.

It’s easiest to work with clusters if we create cluster groups.

Creating and Using Cluster Groups

Groups allow you to tag someone with various colored group labels that you define for your genealogy.

I created a new group for each of my 8 clusters. You can easily create the new group and tag everyone at the same time by clicking on “Add All” at the top, which opens your defined groups, at right. You can either select an existing group, or create a new one. You can assign this group identifier to everyone in this cluster, or just some people by checking their box (at far left), or not. Remember, your matches are only listed in ONE cluster, so you’ll need to add people into multiple cluster groups manually.

I’m using the grouping feature to track who is in which cluster or clusters, and who is not. Please note that I found assigning a group to everyone in the cluster using the “Add all” feature to be a bit buggy, so check closely to be sure the clusters are recorded correctly and everyone who should be labeled with a group cluster tag actually is. Also, be sure to click on “Save changes” at the bottom.

Returning to my primary DNA match list, now it’s easy to see who is and is not included in a cluster, or multiple clusters based on my group tags.

Of my first four matches, two are maternal and two are paternal, and they are assigned to a purple or a yellow cluster accordingly.

Who’s Missing?

To quote another genetic genealogist, many qualifying matches who clearly meet the cluster criteria “have been left on the cutting room floor.”

I noticed that several of my cousins are missing from my clusters. Known cousins are used to identify matches. While these people clearly don’t fall in the ecluded “Close Family” category, they are certainly close enough to be very useful, first to third cousins, and meet the cluster criteria.

Adding to the confusion, many who match me more distantly, AND match these people, ARE included in clusters.

So, if you think you’re imagining things, no, you’re probably not!

Let’s take a look.

The first person NOT included in a cluster is only my 10th match, “MB” a suggested second cousin with whom I share 238 cM.

You can see that the people both above and below her on the list are included in clusters. Even more confusing is that a ThruLine has been formed, which is what the “Common Ancestor” designation means.

That makes it even easier for me to identify the cluster, so one would think that matches with ThruLines would be a priority to include in clusters.

The second cluster criterion is that the match also matches other people in the cluster with 20 cM or more. Looking at our shared matches, that’s clearly the case. All of our closest common matches are also clustered, but “MB” is not.

I’m baffled.

We have 20 pages of common matches. Of the first 25 matches, 22 are clustered and 3 are not, which is also a bit baffling. All meet the criteria.

One reason that someone might not be clustered is that two matches are too closely related to each other, like parent and child, and the other person is already clustered. But that’s not the situation here. In fact, MBs adult child, my third cousin, is also on my match list and is also not clustered, although people on both sides of MB’s child are in clusters too.

As I work down my match list, by the 5th page or so, there’s little consistency between who is and is not a cluster member. Each match page displays 20 matches. On the 7th page, there are only 5 matches who are clustered, sprinkled between the rest who are not. All of those matches meet the criteria and so do our shared matches.

At the point on my match list where clustering ends, and no one else further down my match list is a cluster member, that person shares 67 cM with me, and they share 20 cM or more with all of our 31 shared matches. Of our shared matches, five share more than 65 cM with me, so no matter how you slice it, we all qualify to be in a cluster, several of us together. In fact, four of the other five are members of cluster 4, but the other two are not.

There are a total of 35 people who match me at 66 cM to 238 cM who clearly qualify to be in a cluster, but who are not. If the threshold is actually 65 cM, instead of “above 65 cM,” there are six more.

Easy Workaround

While having clusters formed with all of the qualifying members would be extremely useful, I’ve found a way to work around it, using my spreadsheet.We are going to use these clusters as seeds to grow into something better.

I’ve identified the ancestral couple associated with cluster members and labeled each cluster with their name. The omitted shared matches between me and cluster members should be in the same or a related cluster, barring issues like pedigree collapse and endogamy.

In this example, Omitted person #1 matches with both DZ and SL in cluster 1, so should be in Cluster 1. Omitted person #2 matches MF and LS in Cluster 2, so they should be a member of Cluster 2. Of course, I’ll be reviewing everyone’s trees and sometimes doing their genealogy for them to uncover our common ancestor.

So, while Ancestry’s clusters may not cluster everyone that they logically should, you can:

  1. Use the clusters that have formed
  2. Combined with shared matches to other cluster members
  3. To further identify, or at least find hints pointing to common ancestors

Now, let’s analyze the clusters.

My Cluster Results

So, what have I been able to do with Ancestry’s clusters?

Ancestors defined by clusters can be identified in multiple ways:

  • Because the tester is known
  • A match has a common ancestor in their tree
  • You extended their tree to find your common ancestor
  • A ThruLine has been formed

I’ve placed cluster numbers on ancestor couples identified as common ancestors with cluster members.

  • 1 cluster descends from my paternal great-grandparents (cluster 1)
  • 3 clusters descend from my paternal great-great-grandparents (clusters 2, 3 and 4)
  • 1 cluster descends from my maternal great-great-grandparents (cluster 6)
  • 1 cluster descends from my maternal great-great-great-grandparents (cluster 5)
  • 2 of the smallest clusters can be identified only to grandparents, meaning just the maternal or paternal side (clusters 7 and 8)

Conversely, that means clusters didn’t develop for:

  • My father’s grandfather, Joseph B. Bolton’s line
  • My mother’s grandfather’s line, Hiram Bauke Ferverda
  • My mother’s grandmother’s father’s line, John David Miller
  • My mother’s grandmother’s line, Ellenora Kirsch

How Can Clusters Kick-Start Your Genealogy?

The answer to how clusters can help you depends, in part, on your goals.

If you’re searching for unknown parents, grandparents, or even great-grandparents, and assuming enough other people have tested, clusters should work well for you.

  • Of my 8 clusters, all can be identified maternally or paternally, meaning those sets of grandparents.
  • Keep in mind, though, that I identified my maternal and paternal “side” through Sideview for my V1 “tricked out” test, so your mileage without having indicated parental “sides” may vary a bit. My V2 test where I did not select sides, still had about 90% of the clustered matches of my V1 test with Sideview. Clusters are essential for people seeking unknown, relatively closely related family members.
  • If you’re searching for unknown parents or grandparents, smaller clusters that include members from several larger clusters, especially all clusters on one of your parent’s sides, may be pointing to grandparents.
  • Please note that clusters always identify a couple, not an individual. As soon as you can identify which one of the couple by matching with someone who descends from one of that ancestors’ siblings, then you’re automatically bumped back another generation to their parents.
  • You may only be able to identify a cluster match to a generation closer in time.
  • Remember that Ancestry’s clustering is not triangulation, so your matches may not match on the same segment. You could match person A due to one set of ancestors, person B due to another set of ancestors, and A and B could match each other due to a third set of ancestors.
  • This, in part, is why clustering is useful, as it reduces, not eliminates, the possibility of that happening because you’re dealing with groups of people, not just 3, multiple match criteria, and larger size segments.
  • When pedigree collapse or endogamy is involved, the three (or multiple) people may match due to different ancestors that they can’t identify because the group of matches shares multiple or many ancestors. Think of either first cousins marrying each other a couple of generations ago, which is pedigree collapse, or endogamous groups like Acadians or Jewish people, isolated cultural groups who intermarried for generations.
  • Triangulation, which clusters are NOT, further reduces ambiguity because the same segment of DNA is being measured and compared. Ancestry does not offer triangulation, but both FamilyTreeDNA and MyHeritage do in various ways.

If you’re looking to collaborate with genealogists who descend from ancestors in the past three generations, contact matches in formed clusters.

If you’re looking to break through a recent brick wall, you may be able to do that. In part, it’s a roll of the dice depending on who has tested, the size of the testing pool where your ancestors are from, combined with the unknown internal Ancestry algorithm. For example, if you descend from ancestors in an under-tested part of the world, you may have fewer or even no clusters. To aid in breaking down brick walls, utilize clusters that do form as seeds to group additional people using your cheat sheet.

If you’re an experienced genealogist trying to break through a distant brick wall, Ancestry’s clusters, as they are today, probably aren’t going to help you much, but never say never. You don’t know where that desperately needed next hint might come from. If you’re hunting for the identify of a 4th great-grandparent, pay close attention to the common ancestors of the people in your closest cluster to that unknown ancestor in your tree.

Work on each cluster. If you find a cluster you can’t attribute to one of your ancestors, compare the ancestors in the trees of each cluster member, looking for commonality. Ancestors shared between them and not you may point to your brick wall..

Use the clusters as a starting point, and continue working down your match list. Use shared matches with cluster members to continue to associate your matches with clusters, even if Ancestry doesn’t assign them. Your cheat sheet spreadsheet is your friend, and so are notes and grouping tags.

Beta

If things aren’t working quite right, remember that Ancestry’s clusters are in Beta. Just try again later.

Ancestry has also noted that they are rolling this feature out in stages, and some members won’t be able to access Clusters until December 2025.

Ancestry has announced that soon you’ll be able to create custom clusters with specific matches and cM ranges.

Try Additional Cluster Resources

Each vendor has a different pool of people who have tested there.

Other vendors and third-party tools provide cluster resources and various types of automated tree-building. I have between 18 and 40 clusters using these various tools at different places.

Take a look and see how many clusters you have, and what you can do with them at:

_____________________________________________________________

Share the Love!

You’re always welcome to forward articles or links to friends and share on social media.

If you haven’t already subscribed (it’s free,) you can receive an e-mail whenever I publish by clicking the “follow” button on the main blog page, here.

You Can Help Keep This Blog Free

I receive a small contribution when you click on some of the links to vendors in my articles. This does NOT increase your price but helps me keep the lights on and this informational blog free for everyone. Please click on the links in the articles or to the vendors below if you are purchasing products or DNA testing.

Thank you so much.

DNA Purchases and Free Uploads

Genealogy Products and Services

My Books

Genealogy Books

Genealogy Research

Mitotree Q&A for Everyone

I recently presented Mitotree Webinar – What It Is, How We Did It, and What Mitotree Means to You at Legacy Family Tree Webinars. It’s still free to view through June 13th, and after that, it’s available in the webinar library with a subscription. The 31-page syllabus is also a subscription feature.

Thank you to all 1000+ of you who attended and everyone else who has since watched the webinar – or will now.

We had a limited amount of time for Q&A at the end, so Geoff, our host, was kind enough to send me the list of questions from the Chat, and I’m doing the Q&A here. But keep in mind, please, that I’m assuming when I answer that you’ve watched the webinar or are familiar with how the new Mitotree and tools work.

That said, I think this Q&A can help everyone who is interested in mitochondrial DNA. Your genealogy gift from your mother and her female lineage.

Just a quick reminder that the mitochondrial DNA test tracks your direct matrilineal line only, meaning your mother’s mother’s mother’s line on up your tree until you run out of mothers. Of course, our goal is always to break through that brick wall.

This is a wonderful opportunity, because, unlike autosomal DNA, mitochondrial DNA is not admixed with the DNA of the other parent, so it’s a straight line look back directly up your mother’s female line.

Aha Moment!

Geoff said at the end that he had an aha moment during the webinar. Both males and females have mitochondrial DNA inherited from their mother, so we think of testing our own – but forget to obtain the mitochondrial DNA of our father. Testing your father’s mitochondrial DNA means obtaining your paternal grandmother’s mitochondrial DNA, so test your father to learn about his mother’s maternal line.

And it’s Father’s Day shortly.

Q&A

I’ve combined and summarized similar questions to make this short and sweet. Well, as short and sweet as I can make anything!

  • Can I benefit from Discover even if I don’t have a full sequence test?

You can benefit from the free FamilyTreeDNA Discover tool with any haplogroup, even a partial haplogroup. Be sure to click the down arrow and select mtDNA before entering the haplogroup if you’re using the public version.

However, to gain the most advantage from your test results and Discover, and to receive your closest matches, you need the full sequence test, called the mtFull, which you can purchase here. If you took one of the lower-level “Plus” tests, years ago, click here to sign in and upgrade or check your account to see if you have the full sequence test.

  • What benefits do I receive if I click through to Discover from my account versus using the public version of Discover?

Click any image to enlarge

If you click through to Discover directly from your FamilyTreeDNA account, you will receive features and additional information that are not available in the free, public version of Discover.

You’ll receive additional Notable Connections and up to 30 Ancient Connections based on how many are available and relevant for you.

You’ll also be able to view the Match Time tree, showing your matches, their earliest known ancestors, and where they fit in your haplogroup and haplotype cluster. In this example, two EKAs hinted at a common lineage, which turned out to be accurate after I did some digging.

I think the Match Time Tree is indispensable – the best thing since sliced bread!

The Scientific Details report is also customized for you with your Haplotype Cluster and your private variants.

  • Will a child and their mother always have the same haplogroup?

Yes, but if one of them has a mutation that the other doesn’t, or a heteroplasmy, they may be in a different haplotype cluster.

Also, they both need to have taken the full sequence test. Otherwise, the one who did not take the full sequence test will only have a partial haplogroup until they upgrade.

We will talk more about edge cases in Q&A on down the list.

Great question. Sign in to your account.

In the Maternal Line Ancestry section, which is mitochondrial DNA, check to see if both the Plus and Full boxes are pink. If so, you have taken both and you’ll have a new Mitotree haplogroup and haplotype cluster.

If the “Full” box is grey, you can either click there or at the top where it says “Add Ons and Upgrades” to upgrade to the full sequence test.

  • Why is it called the Million Mito Project? What were you counting?

When we first launched the project, we hoped for a million full sequence samples to build the initial tree. After removing duplicates, such as parent/child, partial sequence samples such as HVR1/2, unreliable samples from PhyloTree, and including FamilyTreeDNA  testers and academic samples, we had between one-third and half a million samples when we launched. The Mitotree and Discover are growing with new testers and groups of samples from archaeological studies, academic samples, and other publicly available resources, following quality analysis, of course.

  • Is there a way to confirm that I submitted an mtDNA to the Mito Tree project? I think I submitted my mom’s when you first started, but my husband recently tested, and I don’t remember if we opted him in at that time.

The science team at FamilyTreeDNA  is using all of the full sequence tests in the construction of the Mitotree, so you don’t need to do anything special.

  • Do or can haplotype F numbers (haplotype clusters) ever become haplogroups?

The answer is maybe. (I know – I’m sorry!)

If you have private variants in addition to your haplotype cluster, then yes, those are haplogroup seeds.

This is my result and I have no additional private variants left to use.

If you don’t have any private variants, or mutations, left over, then no, you won’t receive a new haplogroup for this reason. However, if for some reason the haplogroup splits upstream, you might receive a new haplogroup in the future due to that split.

In addition to the webinar, I wrote about haplotype clusters in the article, Mitochondrial DNA: What is a Haplotype Cluster and How Do I Find and Use Mine?

  • How can mitochondrial DNA and the Mitotree be useful for breaking down genealogy in various parts of the world?

There are two aspects to mitochondrial DNA testing.

The first is to connect genealogically, if possible. To do that, you’ll be paying attention to your matches EKAs (earliest known ancestors), their trees, and their locations. You may well need to do some genealogy digging and build out some trees for others.

The second aspect is to learn more about that lineage before you can connect genealogically. Where did they come from? Do they share a haplogroup with any Ancient Connections, and what cultures do they share? Where did they come from most recently in the world, and where do the breadcrumbs back in time lead?

I wrote about this in the article, New Mitotree Haplogroups and How to Utilize Them for Genealogy.

Sometimes, DNA testing of any type is simply a waiting game until the right person tests and matches you. That’s one reason it bothers me so much to see people “not recommend” mitochondrial DNA testing. We all need more testers so we can have more matches.

  • When will Globetrekker for mtDNA be available?

I don’t know and neither does the team. The Mitotree is still being refined. For example, we are adding thousands of samples to the tree right now from multiple locations around the world. I probably wouldn’t expect Globetrekker until the tree is officially out of Beta, and no, I don’t know when that will happen either. It’s difficult to know when you’re going to be “finished” with something that has never been done before.

While it’s not Globetrekker, you do have the Matches Map to work with, and the Migration Map in Discover, which also shows the locations of your Ancient Connections.

  • During the webinar, Roberta mentioned that her ancestor is German, but she discovered her ancestors were Scandinavian. Can you expand about the “event” that explained this unexpected discovery.

In my case, the church records for the tiny village where my ancestor lived in Germany begin right after the 30 Years’ War, which was incredibly destructive. Looking at Swedish troop movements in Germany, the army of Gustavus Adolphus of Sweden marched through the region with more than 18,000 soldiers. Women accompanied the baggage trains, providing essential, supportive roles and services to the soldiers and military campaign. I’ll never know positively, of course, but given that the majority of my full sequence matches are in Scandinavia, mostly Sweden, and not in Germany, it’s a reasonable hypothesis.

People often receive surprises in their results, and the history of the region plays a big role in the stories of our ancestors.

You don’t know what you don’t know, until you test and follow the paths ahd hints revealed.

  • Why do I have fewer matches in the HVR2 region than the HVR1 region?

Think of the mitochondria as a clock face.

The older (now obsolete) HVR1 test tested about 1000 locations, from about 11-noon and the HVR2/3 region tested another 1000 locations, from about noon-1 PM. The full sequence test tests the full 16,569 locations of the entire mitochondria.

Each level has its own match threshold. So, if you have one mutation at either the HVR1 or HVR2/3 level, combined, you are not considered a match. For example, you can match 10 people at the HVR1 level, and have a mutation in the HVR2 level that 4 people don’t share, so you’ll only match 6 people at the HVR2 level.

If you have one mutation in the HVR1 region, you won’t match anyone in either the HVR1 or HVR1/HVR2 regions.

At the full sequence level, you can have three mutation differences (GD 3) and still be considered a match.

So, the short answer is that you probably have a mutation that some of your matches at the HVR2 level don’t have.

In addition to matches on your Matches page, you will (probably) have haplogroup matches that aren’t on your match list, so check Discover for those.

  • I have HVR1/HVR2 matches, but none at the full sequence level. Why?

It’s possible that none of your matches have tested at that level.

You have no mutations in the HVR1/2 region, or you would not be a match. If your HVR1/2 matches have tested at the full sequence level, then you have more than 3 mutations difference in the coding region.

  • Why do I match people at the full sequence level but not HVR1/2?

The match threshold at the HVR1/2 level is 1, so if you have one mismatch, you’re not listed as a match. However, at the full sequence level, the GD (genetic distance) is 3 mismatches. This tells me you have a mismatch in the HVR1 region, which also precludes HVR2 matching, but less than 4 mutations total. Click on the little “i” button above each match level on the matches page.

  • Why don’t all of my matches show on the Match Time Tree?

Only full sequence matches can show on the Match Time Tree, because they are the only testers who can receive a full haplogroup.

  • How does a heteroplasmy interfere with mtDNA research?

Heteroplasmies, where someone carries two different nucleotides at the same location in different mitochondrial in their body, are both extremely fascinating and equally as frustrating.

Heteroplasmies can interfere with your matching because you might have a T nucleotide in a specific location, which matches the reference model, so no mutation – like 16362T. Your mother might have a C in that location, so T16362C, which is a mutation from T to C. Your aunt or sister might have both a T and a C, which means she is shown with letter Y, so 16362Y, which means she has more than 20% of both. All three of you probably have some of each, but it’s not “counted” as a heteroplasmy unless it’s over 20%.

The challenge is how to match these people with these different values accurately, and how heteroplasmies should “count” for matching.

I wrote about this in the article What is a Heteroplasmy and Why Do I Care?

Bottom line is this – if you are “by yourself” and have no matches, or you don’t match known relatives exactly, suspect a heteroplasmy. If you ask yourself, “What the heck is going on?” – rule out a heteroplasmy. Check out my article and this heteroplasmy article in the FamilyTreeDNA help center.

  • Someone asked about the X chromosome and may have been confusing it with mitochondrial DNA. The X chromosome is not the same as mitochondrial DNA.

The confusion stems from the fact that both are associated with inheritance from the maternal line. Everyone inherits their mitochondrial DNA from their mother. Men inherit their X chromosome ONLY from their mother, because their father gives them a Y chromosome, which makes them a male. Females inherit an X chromosome from both parents. And yes, there are medical exceptions, but those are unusual.

I wrote about this in the article, X Matching and Mitochondrial DNA is Not the Same Thing.

  • How do you determine the location of the last mutation? A tester and their aunt are from one country, and another man in the same haplogroup is from another country, but he has tested only the HVR1/HVR2 level.

There are really two answers here.

First, you can’t really compare your full sequence new Mitotree haplogroup with a partial haplogroup based on only the HVR1/2 test. Chances are very good that if he upgraded to a full sequence test, he would receive a more complete haplogroup, and one that might be near the tester’s haplogroup, but perhaps not the same.

For example, my full sequence haplogroup is J1c2f. I have matches with people who only tested at the HVR1/HVR2 level, but they can only be predicted to haplogroup J, with no subgroup, because they are missing about 14,000 locations that are included in the full sequence test.

Using the Discover Compare feature, comparing haplogroup J to J1c2f clearly shows that the mutations that define haplogroup J1c2f happened long after the mutation(s) that define haplogroup J.

You can use other Discover tools such as the Match Time Tree (if you click through from your account), the Time Tree, the Ancestral Path and the Classic Tree to see when the various haplogroups were born.

  • My mother took the full sequence test in 2016, so should I look for an upgrade now? She is deceased so can’t retest.

First, I’m sorry for your loss, but so glad you have her DNA tests.

The good news is that you ordered the full sequence right away, so you don’t need to worry about an upgrade failing later. In this case, there is no upgrade because the full sequence tests all 16,569 locations.

Additionally, had you needed an upgrade, or wanted to do a Family Finder test, for example, FamilyTreeDNA stores the DNA vials for future testing, so you could potentially run additional tests.

And lastly, since we’re talking mitochondrial DNA, which you inherit from your mother with no admixture from your father, your mtDNA should match hers exactly, so you could test in proxy for her, had she not already tested.

  • Has anything changed in Native American haplogroups?

Absolutely. About 75% of testers received a new haplogroup and that includes people with Native American matrilineal ancestors.

For example, my Native ancestor was haplogroup A2f1a, formed about 50 CE and is now A2f1a4-12092, formed about 1600 CE, so has moved 2 branches down the tree and about 1500 years closer. My ancestor was born about 1683. Her descendant has 58 full sequence matches, 22 in the same haplogroup, and 16 people in their haplotype cluster.

I’m so excited about this, because it helps provide clarity about her ancestors and where they were before she entered my genealogy by marrying a French settler.

  • Are mtDNA mutations the same or similar to autosomal SNPs?

A SNP is a single nucleotide polymorphism, which means a single variation in a specific location. So yes, a mutation is a change in a nucleotide at a genetic location in Y-DNA, autosomal DNA, or mitochondrial DNA.

  • Can we filter or sort our matches by haplotype on our match page?

Not yet. Generally, your closest matches appear at or near the top of your match list. Of course, you can use the Discover Match Time Tree and you can download your matches in a CSV file. (Instructions are further down in Q&A.)

  • Is there a way to make it more obvious that the EKA should be in their matrilineal line? There are so many men as EKAs!

So frustrating. The verbiage has been changed and maybe needs to be revised again, but of course, that doesn’t help with the people who have already entered males. We know males aren’t the source of mitochondrial DNA.

When I see males listed as an EKA, I send the match a pleasant note. I’m not sure they make the connection between what they entered and what is being displayed to their matches. If they have included or linked to a tree, I tell them who, in their tree, is their mtDNA EKA.

I’ve written about how to correctly add an Earliest Known Ancestor. I’ll update that article and publish again so that you can forward those instructions to people with no EKA, or male EKAs.

  • I love learning about my ancient connections. I have a new match due to the updates, who is from a neighboring area to my great-great-great-grandmother.

I love, love, LOVE Ancient Connections. They tell me who my ancestors were before I have any prayer of identifying them individually. Then I can read up on the culture from which they sprang.

I’ve also had two situations where Ancient Connections have been exceptionally useful.

One is an exact haplogroup match to my ancestor, and the burial was in a necropolis along the Roman road about 3-4 km outside the medieval “city” where my ancestor lived.

In a second case, there were two villages in different parts of the same country, hundreds of miles apart, and one burial from about 200 years before my ancestor lived was found about 10 km from one of those villages. While this isn’t conclusive, it’s certainly evidence.

  • What does the dashed line on the Time Tree mean?

Dashed lines on the time tree can mean two things.

The red dashed line, red arrow above, is the haplogroup formation date range and correlates to the dates at the top of Time Tree, not show in this screen shot. You can also read about those dates and how they are calculated on the Scientific Details tab in Discover.

The brown dashed lines, green arrow above, connect an ancient sample to its haplogroup, but the sample date is earlier than the estimated haplogroup.

At first this doesn’t make sense, until you realize that ancient samples are sometimes carbon dated, sometimes dated by proximity to something else, and sometimes dated based on the dates of the cemetery or cultural dig location.

Archaeological samples can also be contaminated, or have poor or low coverage. In other words, at this point in time, the samples are listed, but would need to be individually reviewed before shifting the haplogroup formation date. Haplogroup formation dates are based on present day testers.

  • A cousin and I have been mtDNA tested. What might be gained by testing our other six female cousins/10 or so male cousins?

Probably not much, so here’s how I would approach this.

I would test one cousin who descends from another daughter of the EKA, if possible. This helps to sift out if a haplogroup-defining mutation has occurred.

If you or that cousin has private variants left over after their haplotype cluster is formed,  testing a second person from that line may well results in a new haplogroup formation for that branch.

I absolutely would ask every single one of those cousins to take an autosomal test, however, because you never know what tools the future will bring, and we want to leverage every single segment of DNA that our ancestors carried. Testing cousins in the only way to find those.

  • In the Mitotree, I am grouped in a haplogroup that, according to the Mitotree Match Time Tree, branched off only about 200 years ago and has four mtDNA testers in it, including me. In fact, my earliest known maternal line ancestor I found using pen-and-paper genealogy was indeed born around 230 years ago and is also the known maternal ancestor for one of these three testers – confirming the Mitotree grouping is correct. But the other two matches in this haplogroup are completely unknown to me. Unfortunately, they do not have a tree online, and they did not respond to several messages. Is there any way to find out more about them using the new Mitotree tools?

First of all, this is great news. Having said that, I share your frustration. However, you’re a genealogist. Think of yourself as a sleuth.

I’d start by emailing them, but in this case, you already have. Tell them what you know from your line and ask if their line is from the same area? End with a question for them to answer. Share tidbits from Discover – like Ancient Connections maybe. Something to peak their interest.

Next, put on your sleiuh hat. I’d google their name and email address, and check Facebook and other social media sites. I’d check to see if they match me, or any cousins who have tested, on an autosomal test. If they do match autosomally, use shared matching and the matrix tool. If they are an autosomal match, I’d also check other testing sites to see if they have a tree there.

  • One webinar attendee is haplogroup H1bb7a+151 and is frustrated because they only have eight matches and don’t understand how to leverage this.

Of course, without knowing more, I can’t speak to what they have and have not done, and I certainly understand their frustration. However, in mitochondrial and Y-DNA, you really don’t want thousands of matches. It’s not autosomal. You want close, good matches, and that’s what the Mitotree plus haplotype clusters provide.

Your personal goals also make a lot of difference.

For me, I wanted to verify what I think I know – and received a surprise. I also want to go further back if possible. Then, I want to know the culture my ancestors came from.

First, step through every single one of Discover’s 13 tools and READ EVERY PAGE – not skim. These are chapters in your free book about your ancestor.

Their haplogroup was formed about 1200, so all of those matches will be since that time. The Ancient Connections tell me it’s probably British, maybe Irish – but they will see more from their account than I can see on the public version of Discover.

The Time Tree shows me one haplotype cluster, which is where the tester’s closest matches will probably be, barring a mutation or heteroplasmy.

Looking at the matches, e-mail people, look for common locations in their trees, and see if any of them are also autosomal matches using the Advanced Matching tool.

Looking at the 10 success story examples I used, one man was able to connect 19 of his matches into three groups by doing their genealogy for them. This doesn’t work for everyone, but it will never work if we don’t make the attempt.

  • An attendee would like to search on the Earliest Known Ancestor’s (EKA’s) name field.

I would like that too. You can search on surnames, but that’s often not terribly useful for mitochondrial DNA. The Match Time Tree shows the EKA for all full sequence testers.

In the upper right hand corner of your Matches page, there’s an “Export CSV” file link. Click there to download in a spreadsheet format. The EKA is a column in that file, along with both the new Mitotree haplogroup and haplotype F number, and it’s very easy to do a sort or text search from there.

  • Several questions about why people have so many more autosomal matches than either Y-DNA or mitochondrial.

There are several considerations.

First, autosomal testing became very popular, often based on ethnicity. There are many times more autosomal testers than there are either Y or mitochondrial.

Second, if you look back just six generations, you have 64 lineages. Y-DNA and mtDNA tests one line each and you don’t have to figure out which line. It also reaches back much further in time because it’s not admixed, so nothing washes out or rolls off in each generation like with autosomal.

Third, the Y-DNA and mitochondrial DNA tests are very specific and granular.

More is not necessarily better. You’re looking for refinement – and mitochondrial is just one line. No confusion. Think how happy you’d be if your autosomal matches weren’t all jumbled together and could be placed into 64 neat little baskets. Think how much time we spend sorting them out by shared matches and other criteria. Both Y-DNA and mitochondrial is already sorted out.

I’ve broken through several brick walls with unrecombined Y-DNA and mitochondrial DNA that could never be touched with autosomal – especially older lines where autosomal DNA is either gone or negligible.

  • You mentioned a Facebook group where I can ask questions about mitochondrial DNA?

The mitochondrial DNA Facebook group is the FamilyTreeDNA mtDNA Group, here.

  • To the webinar attendee who came to see me more than 20 years ago at Farmington Hills, Michigan, at one of my first, if not the first, genetic genealogy presentation – thank you!

Thank you for attending then when I really had no idea if ANYONE would come to hear about this new DNA “thing” for genealogy. I remember how nervous I was. And thank you for sticking around, continuing to research, and saying hello now!

Closing Comment

Mitochondrial DNA testing is different than autosomal, of course. It’s often the key to those females’ lines with seemingly insurmountable brick walls.

I attempt to collect the mitochondrial DNA of every ancestor. I trace “up the tree” to find people to test who descend from those ancestors through all women to the current generation, which can be males.

To find testers, I shop:

  • Autosomal matches at FamilyTreeDNA
  • Projects at FamilyTreeDNA
  • WikiTree
  • FamilySearch
  • Ancestry DNA matches
  • Ancestry Thrulines
  • Ancestry trees
  • MyHeritage DNA matches, where ther are a lot more European testers
  • MyHeritage Theories of Family Relativity
  • MyHeritage Cousin Finder
  • Relatives at RootsTech during the month before and after RootsTech when it’s available
  • Facebook Genealogy and family groups that appear relevant

When I find an appropriately descended person, I ask if they have already taken either the Y-DNA or mitochondrial DNA test, whichever one I’m searching for at that moment. If yes, hurray and I ask if they will share at least their haplogroup. If they haven’t tested, I tell them I’m offering a testing scholarship.

I will gladly explain the results if they will share them with me. Collaboration is key and a rising tide lifts all ships.

My mantra in all of this is, “You don’t know what you don’t know, and if you don’t test, you’ll never know.” I’ve missed testing opportunities that I desperately wish I hadn’t, so test your DNA and find testers to represent your ancestors.

I hope you enjoyed the webinar. It’s not too late to watch.

_____________________________________________________________

Share the Love!

You’re always welcome to forward articles or links to friends and share on social media.

If you haven’t already subscribed (it’s free,) you can receive an e-mail whenever I publish by clicking the “follow” button on the main blog page, here.

You Can Help Keep This Blog Free

I receive a small contribution when you click on some of the links to vendors in my articles. This does NOT increase your price but helps me keep the lights on and this informational blog free for everyone. Please click on the links in the articles or to the vendors below if you are purchasing products or DNA testing.

Thank you so much.

DNA Purchases and Free Uploads

Genealogy Products and Services

My Books

Genealogy Books

Genealogy Research

The Mystery of the Blue Fugates and Smiths: A Study in Blue Genes and Pedigree Collapse

The story of the Blue Fugates, an Appalachian family, is quite interesting, from a genetic perspective, a genealogical perspective, and a genetic genealogy perspective.

Who Are the Blue Fugates?

Martin Fugate, supposedly an orphan from France, and his bride, Elizabeth Smith, who had married by 1840, have long been attributed as the progenitors of the Blue Fugate Family of Troublesome Creek, in and around Perry County, Kentucky.

Their descendants were known as “The Blue Fugates” and also “The Blue People of Kentucky” because some of their children and descendants carried a recessive autosomal genetic trait, Methemoglobinemia.

Methemoglobinemia causes the skin to appear blue due to an oxygen deficiency in the red blood cells. Some people only exhibit this characteristic, or even just blue tinges in their fingernails and lips, when they are cold or agitated, such as when infants cry. Yet others are very, very blue.

Inheritance

In order for someone to exhibit the autosomal recessive trait of blueness due to Methemoglobinemia, they must inherit a copy of the gene from BOTH PARENTS. That’s why this trait is so rare.

  • If the parents have only one copy each, they are carriers and will not have the condition themselves.
  • If one parent carries either one or two copies, and the other parent does NOT carry a copy, their offspring CANNOT carry two copies of the mutation and will not be blue.
  • If both parents carry a copy, and both parents pass their copy on to their offspring, the offspring will probably exhibit some level of blueness – from just a tinge when they are cold, ill or or upset, to very, very blue.

I’m not a physician, so I’m not delving into the medical specifics of Methemoglobinemia, but suffice it to say that levels of 10-20% of methemoglobin in the blood produce blue skin, higher levels can produce more severe medical conditions, and levels beneath that may not be visually detectible.

What’s important for the genealogy aspect of this story is that both parents must carry a copy AND pass their copy on for the condition to express in their offspring.

We’ve learned a lot since the 1800s when this was first observed in various members of the Fugate family in Perry County, KY, and since the 1960s when this phenomenon was first studied in the Fugate family and their descendants. To be clear, there are also references to the blue Combs and blue Ritchies in and around Perry County – but the common factor is that they have ancestors that descend from the Fugate family AND the Smith family ancestors, both.

During my research, I’ve proven some of what was initially accepted as fact was incorrect – and I’d like to correct the record. Bonus points too, because it’s just such a great genealogy story!

My Interest

I’ve been inordinately interested in the Fugate family for a long time – but not because of their famous blueness.

The Fugate family has been found for more than 225 years alongside my Cook, Claxton, Campbell, and Dobkins families. First, in Russell County, VA, where Josiah Fugate was granted land along Sword’s Creek in 1801 that adjoined Harry Smith, Richard Smith, and others, including my brick-wall ancestor, Joel Cook. Keep in mind that we have never discovered the birth surname of Joel’s wife or Joel’s parents.

Joel’s daughter, Sarah, married James Claxton about 1799 or 1800 in Russell County, and in February of 1802, James Claxton and Zachariah Fugate, among others, were ordered to view and lay out a new road. They were clearly neighbors, living on the same road, and knew each other well. We don’t know who James’ parents were either.

The Fugates first lived adjacent to the Cook, Riley, Stephens, and Claxton families on Mockason Creek in Russell County, then later migrated with the same group of families to Claiborne County where they lived along the Powell River near the Lee County, VA line, and are very closely associated with the Dobkins and Campbell lines.

Sometime between 1802 and 1805, several Russell County families moved 110 miles down the mountain range and settled together on the Powell River in Claiborne County, TN.  About the same time, others from the same cluster moved to what would eventually become Perry County, KY.

In 1805, the Fugates were ordered as road hands on the north side of Wallen’s Ridge in Claiborne County, the part that would become Hancock County in the 1840s, along with James Claxton and several Smiths.

In 1808, James Claxton witnessed a deed to Henley Fugate and John Riley.

The unsubstantiated family rumor, repeated as fact but with no source, has always been that William Fugate married the sister of my John Campbell. If that were true, tracking the Fugates would help me track my Campbells – yet another brick wall. Hence, my early interest in the Fugate family. Until now, I’ve never solved any part of that puzzle.

In 1827, in Claiborne County, Henry Cook, road overseer, is assigned John Riley, Henly Fugate, William Fugate, Fairwick Claxton (son of James who had died in 1815), and others. These families continued to be allied, living close to each other.

In 1842, William Fugate (1799-1855), born to William Fugate and Sarah Jane Stephens in Russell County, is involved in the estate of John Campbell, born about 1772, who had died in 1838. John Campbell was the husband of Jane “Jenny” Dobkins, daughter of Jacob Dobkins (1751-1835).

William Fugate of Claiborne County signed a deposition in 1851 saying he came to Claiborne County, TN, in 1826. Claiborne County is rugged terrain, located on the south side of the Cumberland Gap, where Virginia, Tennessee, and Kentucky intersect.

In 1853, both William Fugate and Jehiel Fugate are neck-deep in lawsuits surrounding the estate of Jacob Dobkins, who died in 1835, lived on Powell River, and whose daughters married John Campbell and his brother George Campbell

I recently discovered that this William Fugate was born about 1799 in Russell County, VA, and according to his son’s death certificate, William’s wife was Nancy Riley, which makes a lot of sense, given the proximity of these families. I must admit, I’m glad to solve this, but I’m also disappointed that he wasn’t married to John Campbell’s sister.

So, why does any of this matter in the Blue Fugate story?

In part, because I knew decades ago that Martin Fugate, of the Kentucky Blue Fugates, was not an orphan from France who had somehow made his way to the eastern shores of Maryland, then to Perry County, KY by 1820 when he supposedly received a land grant. That land grant date doesn’t square with Martin’s birth year of 1820 either, nor his marriage about 1840, both of which are substantiated by the census.

You can see from the information gleaned from Russell County that the Fugate family was there well before 1800. In fact, a Martin Fugate is shown on the 1789 tax list and other Fugates were there earlier, as early as 1771, according to extracted Russell County records in the book “The Fugate Family of Russell County, Virginia” by David Faris. The Fugate descendants continued to press on westward from there. Fugate, unlike Smith, Cook, and even Campbell, is not a common surname.

“Orphan” stories are often early ways that people said “I don’t know”, without saying, “I don’t know where he came from”, so they speculated and said “maybe he was an orphan.” Then that speculation was eventually passed on as fact.

That might have been happening in Perry County in the 1960s, but in Claiborne County in the 1980s, family members were telling me, “Martin waren’t no orphan,” and would roll their eyes and sigh with great exasperation. You could tell this was far from the first time they had had to combat that story. To be clear, the Fugate family lived down along Little Sycamore Creek with my Estes, Campbell and other ancestral families. In the 1980s, I was finding the oldest people possible and talking to them.

Some records in Russell County, where the Fugates of Perry County, KY, and the Fugates of Claiborne County, TN, originated, did and do exist, so could have been researched in the 1960s, but you would have had to know where to look. No one back then knew that the Perry County Fugates originated in Russell County, so they wouldn’t have known to look there. Research wasn’t easy. If they had known to look in Russell County, they would have had to travel there in person to review records. Early records exist in Perry County, too, but in the 1960s, not even the census was available, and people simply didn’t remember back to the early to mid-1800s.

Truthfully, no one would ever have doubted those early stories that had been handed down. They were revered, in all families, and treated as gospel. Those stories were the only connection they had to their ancestors – and the generations inbetween who passed them on. Nope, no one was going to question what Grandpa or Uncle Joe said.

So, in the 1960s, when the Blue Fugates in Perry and adjacent Breathitt County, KY were first studied by Dr. Cawein and his nurse, Ruth Pendergrass, they gathered oral family history and constructed a family pedigree from that information. They documented who was blue from first-hand eye-witness accounts – which would only have stretched back into the late 1800s, best case.

It probably never occurred to anyone to validate or verify earlier information that was provided. Plus, it would have been considered rude. After all, they weren’t genealogists, and they were trying to solve a medical mystery. The information they collected did not conflict with what was known about the disease and how it was transmitted, so they had no reason to doubt its historical accuracy.

The Mystery of the Blue Fugates?

The Blue Fugates were a family renowned for their blue skin – at least some of them had blue skin. That’s part of what makes this story so interesting.

Originally, it was believed that only one progenitor couple was involved, Martin Fugate and his wife, Elizabeth Smith, but now we know there were two. Maybe I should say “at least two.”

Martin Fugate and his bride, Elizabeth Smith, whose first known child was born in 1841, according to the 1850 census, are progenitors of the Blue Fugate Family of Troublesome Creek, but they aren’t the only progenitors.

Martin was not shown in the Perry County, KY 1840 census, but two Zachariah Fugates are present, 8 Fugate families are found in neighboring Breathitt County, more than a dozen in Russell County and surrounding counties in Virginia, and four, including two William Fugates, in Claiborne County, TN. The younger of the two lived next door to John Dobkins, son of deceased Jacob Dobkins.

Martin Fugate (c1820-1899) of Perry County and his second cousin, Zachariah Fugate (1816-1864), who each married a Smith sister, are both progenitors of the Blue Fugates through their common ancestor, their great-grandfather, Martin Fugate, who was born in 1725 and died in 1803 in Russell County, VA.

Obviously, if Martin (c1820-1899) had a Fugate second cousin who also lived in Perry County, Martin wasn’t an orphan. That knowledge is due to more recently available information, like census and other data – and that’s part of what I want to correct.

In 1948, Luke Combs, from Perry County, KY, took his sick wife to the hospital, but Luke’s blueness caused the medical staff to focus on him instead, thinking he was experiencing a medical emergency. He wasn’t. His skin was just blue. In 1974, Dr Charles H. Behlen II said, ‘Luke was just as blue as Lake Louise on a cool summer day.’ The Blue Fugates were “discovered” by the rest of the world, thanks to Luke, but they were nothing new to local people, many of whom did not welcome the notoriety.

In the 1960s, hematologist Madison Cawein III, with the assistance of Ruth Pendergrass, studied 189 members of the extended Fugate family, treated their symptoms, and published his findings. He included a pedigree chart, but not everyone was keen on cooperating with Dr. Cawein’s research project.

The Fugate family history collected for the study was based on two things:

  • Personal knowledge of who respondents knew was blue
  • Remembered oral history beyond the reach of personal knowledge.

That remembered oral history reported that Martin Fugate and Elizabeth Smith’s youngest son, Zachariah Fugate (born in 1871), married his mother’s (older) sister, Mary Smith, (born about 1820), and had a family. I’ve added the dates and information in parentheses, or they would have immediately known that marriage was impossible. Or, more directly, even if they married when Zachariah was 14, Mary would have been 70 years old, and they were certainly not going to produce offspring. This is the second piece of information I want to correct. That marriage never happened, although people were accurate that:

  • Martin Fugate and his wife, Elizabeth Smith, did have a son named Zachariah Fugate
  • One Zachariah Fugate did marry Mary Smith, sister of Elizabeth Smith

It’s just that they were two different Zachariah Fugates, born 75 years apart. Same name confusion strikes again.

I constructed this census table of Martin Fugate with Elizabeth Smith, and Zachariah Fugate with Mary Smith. They lived next door to each other in Perry County – and it seemed that every family reused the same “honoring” names for their children – and had been doing such for generations.

In the 1960s, when the information was being compiled for Dr. Cawein, the census and other documents that genealogists rely on today were not readily available.

Furthermore, genetically, for the mystery Dr. Cawein was attempting to solve, it didn’t really matter, because it was still a Smith female marrying a Fugate male. I know that it made no difference today, but he wouldn’t have known that then. To track down the source of the blueness, he needed to identify who was blue and as much about their ancestors as possible.

The Zachariah Fugate (1816-1864) who married Elizabeth Smith’s sister, Mary Smith, was Martin Fugate’s second cousin by the same name, Zachariah. Both Martin (c1820-1899) and his second cousin, Zachariah (c1816-1864), married to Smith sisters, had blue children, which helps cement the fact that the responsible genes were passed down through BOTH the Fugate and Smith lines, and weren’t just random mutations or caused by environmental or other factors.

Proof

In case you’re wondering exactly how I confirmed that Martin and Zachariah did indeed marry Elizabeth and Mary Smith – their children’s birth and death records confirmed it. These records correlate with the census.

Unlike most states, Kentucky has some pre-1900 birth and death records.

Wilson Fugate’s birth in February, 1855 was recorded, naming both of his parents, Martin Fugate and Elizabeth Smith.

Martin Fugate and Elizabeth Smith’s son, Henley or Hendley, died in 1920, and his death certificate gave the names of both parents. Betty is a nickname for Elizabeth.

On the same page with Wilson Fugate’s birth, we find a birth for Zachariah Fugate and Mary Smith, too.

Hannah Fugate was born in December 1855.

Zachariah Fugate and Mary Smith’s son, Zachariah died in 1921, and his death certificate gives his parents as Zach Fugate and Polly Smith, a nickname for Mary.

There are more death records for children of both sets of parents.

Both couples, Martin Fugate and Elizabeth Smith, and Zachariah Fugate and Mary Smith, are progenitors of the Blue Fugate family.

Of Martin’s 10 known children, 4 were noticeably “blue” and lived long, healthy lives. At least two of Zachariah’s children were blue as well.

Some people reported that Martin, himself, had deep blue skin. If so, then both of his parents would have carried that genetic mutation and passed it to him.

Unfortunately, color photography didn’t exist when Martin (c1820-1899), lived, so we don’t know for sure. For Martin’s children to exhibit blue skin, they would have had to inherit a copy of the gene from both parents, so we know that Martin’s wife, Elizabeth, also inherited the mutation from one of her parents. Ditto for Zachariah Fugate and Mary Smith. The chances of two families who both carry such a rare mutation meeting AND having two of their family members marry are infinitesimally small.

Dr. Cawein’s Paper

In 1964, Dr. Cawein published his findings, but only with a pedigree chart with no names. What was included was an explanation about how remote and deep the hills and hollows were, and that out-migration was almost impossible, explaining the propensity to marry cousins.

Legend:

  • Measured – Found to have elevated methemoglobin
  • Measured – Found to have decreased methemoglobin
  • Not measured – Reported to be “blue”
  • Measured – Found to be normal

Cawein further stated that data was collected by interviewing family members who personally knew the individual in question and could say if they were actually blue.

Cawein erroneously reported that “Martin Fugate was an orphan born about 1800, landed in Maryland, obtained a land grant in Perry County, KY in 1820, and married a local gal. From 1820 to about 1930, the population consisted of small, isolated groups living in creek valleys and intermarriage was quite common.” Bless his heart.

Later, geneticist Ricky Lewis wrote about the Blue Fugates, sharing, among other things, the provenance of that “blue” family photo that circulates on the internet, revealing that it is a composite that was assembled and colorized back in 1982. She also erroneously stated that, “after extensive inbreeding in the isolated community—their son married his aunt, for example—a large pedigree of “blue people” of both sexes arose.” Bless her heart too.

Dr. Lewis is incorrect that their son married his aunt – but she’s right that intermarriage between the families is responsible for the blue descendants. In colonial America, and elsewhere, cousin marriages were fairly common – everyplace. You married who you saw and knew. You saw your family and neighbors, who were generally your extended family. No left-handed apology needed.

Pedigree collapse, sharing the same ancestors in multiple places in your tree, is quite common in genealogy, as is endogamy among isolated populations.

Today, things have changed somewhat. People move into and out of an area. The younger generation moves away a lot more and has for the past 100+ years. Most people know their first cousins, but you could easily meet a second or third cousin and never know you were related.

While early stories reported that Martin Fugate (c1820-1899) was an orphan from France, mysteriously appearing in Kentucky around 1820, later genealogical evidence as well as genetic research proves that Martin Fugate was actually born about 1820, in Russell County, VA and his ancestors, over several generations, had followed the typical migration path across Virginia into Kentucky.

We’ve also proven that Martin’s son, Zachariah (born 1871) was not the Zachariah who married Elizabeth Smith’s sister, Mary, who was 50 years old when Zachariah was born.

What else do we know about these families?

The Back Story

Compared to the Smith story, the Fugate story was “easy.”

Don’t laugh, but I spent several days compiling information and charting this in a way I could see and understand in one view.

I hesitate to share this, but I’m going to because it’s how I think. I also put together a very basic Fugate tree at Ancestry, here. Many children and siblings are missing. I was just trying to get this straight in my mind.

Click to enlarge any image

This spreadsheet is color-coded:

  • The text of each lineage has a specific color. For example, Fugates are blue.
  • Some people (or couples) are found in multiple descendants’ lines and are duplicated in the tree. Duplicated people also have a cell background color. For example, Mahala Richey (Ritchey, Ritchie) is highlighted yellow. James and Alexander Richey have green text and apricot background because they are duplicated.
  • The generation of parents who had blue children is marked with black boxes and the label “Blue Kids.”
  • Only the blue kids for this discussion are listed below those couples.
  • The bluest person was Luna Fugate (1886-1964).
  • While Luna’s husband, John Stacey, also descended from the Smith/Combs line, only one of their children expressed the blue trait. That child’s lips turned blue when they cried. John and Luna were actually related in three ways. Yes, my head hurts.
  • The last known “blue” person was Luna Fugate’s great-grandchild, whose name I’ve obfuscated.

Ok, let’s start with the blue Fugates on our spreadsheet. You’ll probably want to follow along on the chart.

Martin Fugate (1725-1803) and wife Sarah, had several children, but only two, the ones whose grandchildren married Smith sisters are known to have had blue children.

On our chart, you can see that Martin (1725-1803) is blue, and so is Son 1, William Fugate and Sarah Stephens, along with Son 2, Benjamin Fugate and Hannah Devers. Both William and Benjamin are mentioned in Martin’s estate in 1803 in Russell County, VA.

Two generations later, Martin Fugate (c1820-1899) and Elizabeth Smith had four blue children, and Zachariah Fugate (c1816-1864) and Mary Smith had at least two blue children. Furthermore, Zachariah Fugate’s sister, Hannah (1811-1877), married James Monroe Richie.

The Richey’s are green, and you can see them on both the left and right of the chart. Hannah’s husband descended from the same Richey line that Elizabeth Smith did. It was no surprise when their child, Mahala Ritchie (1854-1922), married Levi Fugate, to whom she was related three ways, they became the parents of a blue child. Their daughter, Luna Fugate, was known as “the Bluest of the Blue Fugates.”

Mahala Ritchie (1854-1922) could have inherited her blue gene (or genes) from either her mother Hannah Fugate, or her father, James Monroe Ritchie, or both. We don’t know if Hannah was blue or not.

We do know that Mahala married Levi Fugate, her third cousin through the Fugate line, and her third and fourth cousin also through the Richie and Grigsby lines, respectively. This is the perfect example of pedigree collapse.

You can see the purple Grigsby lines in the center and to the right of the pedigree chart too, with Benjamin Grigsby, highlighted in blue, being common to both lineages.

Zachariah Fugate (1816-1864) and Mary Smith had at least two blue sons, but I am not tracking them further. Suffice it to say that Blue John married Letha Smith, his first cousin, the granddaughter of Richard Smith and Nancy Elitia Combs. Lorenzo, “Blue Anze”, married a Fugate cousin, so it’s no surprise that Zachariah and Mary were also progenitor couples of the Blue Fugates.

Martin’s son, Levi Fugate, married Mahala Ritchie, mentioned above, and had Luna Fugate who would have been personally known to Dr. Cawein. Luna, pictured above, at left, was known as the bluest of the Blue Fugates.

Luna married John Stacey who some thought wasn’t related to Luna, so it was confusing why they had one child that was slightly blue. However, John turns out to be Luna’s second cousin, third cousin once removed and first cousin once removed through three different lines. His great-grandparents were Richard Smith and Nancy Combes. Since one of their children had a slight blue tinge, John, while not visibly blue himself, clearly carried the blue gene.

Where Did the Blue Gene Come From?

The parents of Elizabeth Smith and Mary Smith were Richard Smith and Nancy (Eletia) Combs. His Smith ancestors include both the Richeys and Caldwells.

James Richey (1724-1888) married Margaret Caldwell (1729-1802) and his father, Alexander Richey (1690-1749) married Jeanne Caldwell (1689-1785). While the Caldwell females weren’t closely related, Jeanne was the daughter of Joseph Alexander Caldwell (1657-1730) and Jane McGhie, and Margaret Caldwell (1729-1802) was the great-granddaughter of that couple. The Caldwells are shown in magenta, with both Richey/Caldwell couples shown as duplicates. The Richey are highlighted in apricot, and the Caldwell’s with a light grey background. It was difficult to show how these lines connect, so that’s at the very top of the pedigree chart.

When just viewing the Smith-Combs line, it’s easier to view in the Ancestry pedigree.

The Smith, Richey, Combs, Grigsby, and Caldwell lines are all repeated in different locations in the trees, such as with Hannah Fugate’s husband. These repeated ancestors make it almost impossible for us to determine where in the Smith ancestral tree that blue gene originated.

We don’t know which of these ancestral lines actually contributed the blue gene.

Can We Figure Out Where the Blue Gene Came From?

How could we potentially unravel this mystery?

We know for sure that the blue gene in the Fugate side actually descends from Martin Fugate who was born in 1725, or his wife, Sarah, whose surname is unknown, because their two great-grandchildren, Martin (c1820-1899) and Zachariah (1816-1864) who both married Smith sisters had blue children. For those two intervening generations between Martin Fugate (1725-1803) and those two great-grandsons, that blue gene was quietly being passed along, just waiting for a blue Fugate gene carrier to meet another blue gene carrier. They found them in the Smith sisters.

None of Martin (1725-1803) and Sarah’s other children were known to have had any blue children or descendants. So either they didn’t carry the blue gene, or they didn’t marry someone else who did – that we know of.

We can’t tell on the Smith side if the blue gene descends from the Smith, Richey, Grigsby or Caldwell ancestors, or maybe even an unknown ancestor.

How can we narrow this down?

If a Fugate in another geographic location married someone from one of these lineages, say Grigsby, for example, and they had blue offspring, and neither of them shared any of the other lineages, then we could narrow the blue gene in the Smith line to the Grigsby ancestor.

Unfortunately, in Perry and surrounding counties in Kentucky, that would be almost impossible due to intermarriage and pedigree collapse. Even if you “think you know” that there’s no connection through a third line, given the deep history and close proximity of the families, the possibility of unknown ancestry or an unexpected parent is always a possibility.

Discover

While the blue gene is not connected to either Y-DNA or mitochondrial DNA, we do have the Fugate’s Y-DNA haplogroup and the Smith sisters’ mitochondrial DNA.

Y-DNA

The Big Y-700 haplogroup for the Martin Fugate (c1820-1899) line is R-FTA50432, which you can see, here..

You can see the Blue Fugate Family by clicking on Notable Connections.

If you’re a male Fugate descendant who descends from anyone other than Martin Fugate (c1820-c1899), and you take a Big Y test, you may well discover a new haplogroup upstream of Martin (c1820-1899) that represents your common Fugate ancestor.

If you descend from Martin, you may find youself in either of the two haplogroups shown for Martin’s descendants, or you could split the line to form a new haplogroup.

We don’t have the mitochondrial DNA of Martin Fugate (c1820-1899), which would be the mitochondrial DNA of his mother, Nancy Noble. We also don’t have the the mtDNA of Mary (Polly) Wells, the mother of Zachariah Fugate (c1816-1864). If you descend from either of these women in a direct matrilineal line, through all women, please take a mitochondrial DNA test and reach out. FamilyTreeDNA will add it as a Notable Connection.

We do, however, have the mitochondrial DNA of Elizabeth and Mary Smith

Mitochondrial DNA of Elizabeth and Mary Smith

The mitochondrial DNA of both Elizabeth and Mary Smith follows their mother’s line – Nancy Combs through Nancy (Eletia?) Grigsby. Nancy’s mother is unknown, other than the possible first name of Margaret.

Nancy Grigsby’s descendant is haplogroup K1a61a1, which you can see here.

The Blue Fugates show under Notable Connections.

The Smith sisters’ haplogroup, K1a61a1, tells us immediately that their ancestor is European, eliminating other possibilities.

The time tree on Discover is quite interesting

Haplogroup K1a61a1 was formed about the year 1400. Descendants of this haplogroup are found in the UK, Scotland, England, several unknown locations, and one person who selected Native American, which is clearly in error. Haplogroup K is not Native American.

By focusing on the haplotype clusters, identified by the F numbers in the elongated ovals, our tester may be able to identify the mother of Nancy Grigsby, or upstream lineages that they can work back downstream to find someone who married Thomas Grigsby.

This story is far from over. In fact, a new chapter may just be beginning.

If you’re a Fugate, or a Fugate descendant, there’s still lots to learn, even if autosomal DNA is “challenging,” to say the least, thanks to pedigree collapse. Testing known females lineages can help us sort which lines are which, and reveal their hidden stories.

Other resources if you want to read more about the Fugates: The Blue People of Troublesome Creek, Fugates of Kentucky: Skin Bluer than Lake Louise, Those Old Kentucky Blues: An Interrupted Case Study, and Finding the Famous Paintings of the Blue People of Kentucky.

_____________________________________________________________

Share the Love!

You’re always welcome to forward articles or links to friends and share on social media.

If you haven’t already subscribed (it’s free,) you can receive an e-mail whenever I publish by clicking the “follow” button on the main blog page, here.

You Can Help Keep This Blog Free

I receive a small contribution when you click on some of the links to vendors in my articles. This does NOT increase your price but helps me keep the lights on and this informational blog free for everyone. Please click on the links in the articles or to the vendors below if you are purchasing products or DNA testing.

Thank you so much.

DNA Purchases and Free Uploads

Genealogy Products and Services

My Books

Genealogy Books

Genealogy Research

FamilyTreeDNA’s New Matrix Shows How Your Matches Are Related to Each Other

Click on any image to enlarge

FamilyTreeDNA’s new reworked Matrix includes relationships, in other words, how your matches are related to each other. But there’s more. It also includes the number of shared segments and the number of cMs shared between your matches.

You can then push those matches through to the chromosome browser to see exactly which segments overlap between you and your matches.

This is a game-changer!!

Why Are These Features Important?

For genealogists, knowing how your matches are related to each other, or not, is a HUGE clue about your common ancestor. Clusters of people who match each other are an important road sign directing you to a specific ancestor who contributed the same DNA segment or segments to all of you.

FamilyTreeDNA just released several VERY cool updates for their Matrix comparison tool. Plus, you get to select a group of 10 people to compare.

The purpose of the Matrix tool is to select Family Finder autosomal matches who are then displayed in a grid matrix for comparison, showing if and how those matches match each other.

Specifically:

  • Do your matches match each other?
  • What is their estimated relationship to each other?
  • How many segments of DNA do they share with each other?
  • How many cMs (centiMorgans) of DNA do they share with each other?

You can then push 7 matches through to the chromosome browser to see if they match on any of the same segments.

Automated Triangulation

If you are comparing bucketed (maternal or paternal) matches, or matches known to belong to the same side of your tree, the shared segments are automatically triangulated.

How cool is this?!!!

Keep in mind, though, that you may be related to someone through multiple ancestors, and they could be from both parent’s sides, so pay attention to the ancestral segment history.

Remember, every segment has its own unique history.

Let’s step through the new Matrix features and see how they work.

Select the Matrix

Navigate to the Matrix tool under “See More” under Autosomal DNA Results and Tools.

Under “Select Matches” you can select “All Matches” to choose from all of your matches, or you can select a grouping of matches to be displayed in the menu, below.

These groupings are shortcuts for you so you don’t have to pick everyone individually. You can also search for a name.

Click on the individuals you want to compare in the Matrix. The people you’ve selected from the group, at left, will appear in the box, at right. That’s who will be compared to each other.

Next, select which type of data will be compared.

I’m selecting “Close Relatives” for this example and “Relationship range.” First, I added my mother so I could see who matches with her.

Then I added the rest of the people I want to compare. In this case, I’ve added my closest matches, even though they are from both sides of my tree.

Relationship Range

I’ve selected “Relationship range,” which will show me how my matches estimated relationships to each other.

Based on the identity of these matches, and how they match each other, I can now determine their ancestral connection.

If I didn’t know who was related maternally and paternally, this grid would remove all doubt became I’m comparing to one of my parents.

If you don’t have a parent, adding close, known relatives on one or both sides will help immensely.

Be sure to make notes about what you’ve discovered on your matches page, and paint to DNAPainter if that’s how you’re tracking your segments to ancestors.

Number of Segments Shared

Now, I’ve selected “Number of segments shared” to compare the same group of people.

You can see the number of shared segments between Mom’s matches. Donald and Cheryl are full siblings.

The display shows how these people match Mom, and each other.

Melissa is Mom’s paternal second cousin. I was able to piece this together with the help of how she matches Mom and Mom’s known paternal first cousins, Cheryl and Donald.

Total cMs Shared

Next, I’m selecting “Total cMs shared” for comparison.

Looking at the number of shared cMs, even if I didn’t know that Donald and Cheryl were full siblings, I would now.

You can also push these through to the chromosome browser. I’ll illustrate in a minute.

Bucketed or Parental Side Matching

My favorite groupings for the new Matrix are the bucketed, meaning parental or maternal “side” matching.”

When your matches are already bucketed, thanks to having linked known matches to their profile card in your tree, the system does a lot of the “side” work for you behind the scenes.

When you select “Maternal, “Paternal” or “Paternal and Maternal” matches, the people who have been bucket to either side, or those related to you on both sides, are listed in the selection box.

I’m selecting 7 of my maternal bucketed matches because I’m going to push them through to the chromosome browser for additional evaluation. I’m not including my mother because I already know these people are related to both me and her, because they are bucketed maternally.

They’re compared in the various matrix configurations.

From the Shared cM comparison table, I can easily click to display matches in the chromosome browser.

If you’re comparing more than 7 people, you’ll need to reduce it to 7. I excluded my Mom because I already know she matches all of them.

Click on the Compare Chromosome Browser at the bottom for the 7 people selected.

I know that cousin Charles descends from Mom’s paternal Lentz line, and has no other connection, so I know that these other cousins who also match me on that same segment are also from Mom’s Lentz line.

I can also tell that the shared segments on chromosome 1 are from Mom’s maternal Lore line.

Shown here are the common ancestors in Mom’s pedigree chart. They are 4 and 5 generations back in time for me.

Look how easy that was!

I love this new Matrix tool.

Triangulation

Because three or more people, including me, match on the same segments, this means they also triangulate.

In the example above, we have two distinct triangulation groups. I’m only showing chromosomes 1-3 for illustration purposes, but there are also more triangulation groups on the other chromosomes. If I add other people, new triangulation groups will form!

Of course, these are my maternal bucketed matches, so I’m safe to reach that conclusion. If my father’s matches were also loaded here, I would have to check the matrix and see if these people also matched each other before I could determine that they triangulate.

Check Your Matches and Upload

Be sure to upload any tests to FamilyTreeDNA that you manage at other vendors, and encourage your cousins to upload too.

This combination of features is unique to FamilyTreeDNA. The more relatives you have available to match, especially when you already know the common ancestor, the better. Be sure to link your matches to their placard in your tree so that FamilyTreeDNA can do the bucketing for you.

Even if you don’t link people, you can still benefit greatly from the new matrix tool by just having your DNA available for matching. The matrix will help you sort out matches and identify who is related to whom, and how.

Take a look! What are you discovering?

_____________________________________________________________

Share the Love!

You’re always welcome to forward articles or links to friends and share on social media.

If you haven’t already subscribed (it’s free,) you can receive an e-mail whenever I publish by clicking the “follow” button on the main blog page, here.

You Can Help Keep This Blog Free

I receive a small contribution when you click on some of the links to vendors in my articles. This does NOT increase your price but helps me keep the lights on and this informational blog free for everyone. Please click on the links in the articles or to the vendors below if you are purchasing products or DNA testing.

Thank you so much.

DNA Purchases and Free Uploads

Genealogy Products and Services

My Books

Genealogy Books

Genealogy Research

Six Ways to Figure Out How We’re Related

In my latest Webinar, Six Ways to Figure Out How We’re Related, I discuss the various tools from Ancestry, FamilyTreeDNA, MyHeritage, and 23andMe – plus clusters from Genetic Affairs and the amazing DNAPainter.

This webinar lives in the Legacy Family Tree Webinar library, but as part of the “webtember” lineup, you can view it for free through the end of September.

It’s always exciting to discover a new match at one of the DNA testing companies, which, of course, begs the question of how you’re related.

So, what are the six ways to figure out how you’re related, and how do you use them?

Come along for a step-by-step guide!

Shared Matches

We begin with how each vendor handles shared matches, what that feature is called, where to find the information, and how to interpret what they are telling you.

23andMe goes a step further and creates a genetic tree, of sorts, although that functionality has changed since their breach last October.

Bucketing and Sides

Two vendors go a step further and provide unique tools to divide your matches maternally and paternally.

FamilyTreeDNA buckets your matches maternally and paternally (or both) based on matches you link to their profile cards in your tree. FamilyTreeDNA then uses your linked matches to triangulate with other matches and assign your matches accordingly, providing a maternal and paternal match list. Bucketing, also known as Family Matching, is one of my favorite tools.

Note that linking matches at FamilyTreeDNA requires that you have transferred your tree to MyHeritage. I wrote about that and provided instructions here and here, and produced a complimentary webinar, too.

Ancestry also divides your matches by parent, but they use a different technique based on their Sideview technology and either ethnicity or shared matches.

Surnames and Locations

Surnames and locations, either separately or together, provide HUGE hints!

MyHeritage provides a nice summary for each of your matches that includes ancestral surnames, a map of locations in common, and “Smart Matches” which shows you people in common in both of your trees. There are several ways to use these tools.

FamilyTreeDNA also provides a list of surnames. You can view either the surnames in common with a match, or all of their ancestral surnames, with locations if provided. The tester enters these surnames, and we review how to complete that step.

Ancestry also provides shared surnames, with clickable links to the number of people in your matches tree with that surname, plus common locations.

X-DNA

X-DNA is probably the most underutilized DNA matching tool. While each of the vendors actually test the X chromosome, only one, FamilyTreeDNA, provides X-matching. You can obtain X-matching results by uploading your DNA file to FamilyTreeDNA. I’ve provided upload/download instructions for all companies, here.

X-DNA has a very unique inheritance pattern because males only inherit an X chromosome from their mother which limits the number of potential common ancestors for any two testers. In other words, X-DNA matching does half your work for you!

Clustering Technology – AutoClusters, the Matrix and DNAPainter

In the past few years, match clustering has become a very useful tool. Clustering shows which of your matches match you and each other.

Genetic Affairs offers several flavors of these clusters, and both MyHeritage and GEDmatch have incorporated Genetic Affairs clusters into their product offerings.

If you haven’t used AutoClusters yet, by all means, try them out.

FamilyTreeDNA offers the Matrix, a slightly different version of clustering. You can select 10 people from your match list to see if they also match each other. Shared matches don’t automatically mean triangulation between you and those two people, or even that all three people descend from the same line. However, if the people are bucketed to your same side (parent) and they share common segments with you in the chromosome browser, they triangulate.

You’ll want to paint those matches to DNAPainter to determine which ancestor you share, especially if they haven’t provided a tree.

DNAPainter provides your chromosomes as the “canvas” upon which to paint your matches in order to correlate segments with ancestors and identify common ancestral lines with mystery matches.

Three vendors, FamilyTreeDNA, MyHeritage, and GEDmatch provide segment information with matches for you to paint. I illustrate how I walk segments back in time, identifying our most distant common ancestor possible.

Theories of Family Relativity and ThruLines

Both MyHeritage and Ancestry provide a combination of DNA matching and tree triangulation, where they search the trees of your DNA matches to find common ancestors with you – although their implementation is different.

MyHeritage’s Theories of Family Relativity provides varying theories about common ancestors for you and a specific match using both trees and historical documents. You can review the various pathways and confirm or reject theories. I love this tool.

Ancestry’s Thrulines functions a bit differently, showing you all of your matches that descend from a common ancestor in all your matches’ trees. Sometimes, the trees are incorrect, but Theories of Family Relativity and ThruLines should still be used as hints.

I showed how ThruLines helped me discover what happened to one of my ancestor’s grandchildren who was lost to the family at his mother’s death – and to all of us since. Not anymore.

Bonus – Y-DNA and Mitochondrial DNA at FamilyTreeDNA

Only FamilyTreeDNA offers both Y-DNA and Mitochondrial DNA testing and matching. All of the tools above pertain to autosomal DNA testing, which is named Family Finder at FamilyTreeDNA. Illustrated by the green arrow below, autosomal DNA testing measures and compares the DNA you inherited from each ancestral line, but that’s not the only game in town.

Y-DNA, in blue, for males, tracks the direct paternal line, which is the surname line in Western cultures. Mitochondrial DNA, in red, is passed from mothers to all of their children. Therefore, everyone can test, revealing matches and information about their mother’s direct matrilineal lineage.

Y-DNA testing includes the amazing Discover tool with a baker’s dozen different reports, including ancient DNA. Mitochondrial DNA will soon have its own MitoDiscover after the rollout of the new Mitotree.

Both tests include “Matches Maps” to help you determine how you are related to your matches, as well as where your ancestors came from before the advent of surnames.

The Advanced Matching feature allows you to select multiple tests to see if your matches match you on combined types of tests.

Tune In

Now that you know what we cover in the webinar, please tune in to see how to use these awesome tools. Be sure to fish in all four “ponds” plus GEDmatch, where you may find people who didn’t test at a company that provides a chromosome browser or matching segment information.

Tools provided by the DNA testing vendors facilitate multiple ways to determine how we match and which ancestor(s) we have in common.

You can watch the webinar, here.

Additionally, subscribers to Legacy Family Tree Webinars have access to the 25-page syllabus with even more information!

A Legacy Family Tree Webinar subscription normally costs $49.95 per year, but through the end of September, there’s a coupon code good for 20% off. Just click here, then enter webtember24 at the checkout.

Enjoy!

_____________________________________________________________

Follow DNAexplain on Facebook, here.

Share the Love!

You’re always welcome to forward articles or links to friends and share on social media.

If you haven’t already subscribed (it’s free,) you can receive an e-mail whenever I publish by clicking the “follow” button on the main blog page, here.

You Can Help Keep This Blog Free

I receive a small contribution when you click on some of the links to vendors in my articles. This does NOT increase your price but helps me keep the lights on and this informational blog free for everyone. Please click on the links in the articles or to the vendors below if you are purchasing products or DNA testing.

Thank you so much.

DNA Purchases and Free Uploads

Genealogy Products and Services

My Books

Genealogy Books

Genealogy Research

Great News – Both e-Pub and Print Version of “The Complete Guide to FamilyTreeDNA” Now Available Worldwide  

  • Anyone, anyplace, can order the full-color, searchable, e-pub version of The Complete Guide to FamilyTreeDNA – Y-DNA, Mitochondrial, Autosomal and X-DNA from the publisher, Genealogical.com, here.
  • Customers within the US can order the black and white print book from the publisher, here.
  • Customers outside the US can order the print book from their country’s Amazon website. The publisher does not ship print books outside the US due to customs, shipping costs, and associated delays. They arranged to have the book printed by an international printer so that it can be shipped directly to Amazon for order fulfillment without international customers incurring additional expenses and delays. If you ordered the book previously from Amazon and a long delivery time was projected, that should be resolved now and your book should be arriving soon.

Comprehensive

This book is truly comprehensive and includes:

  • 247 pages
  • More than 267 images
  • 288 footnotes
  • 12 charts
  • 68 tips
  • Plus, an 18-page glossary

To view the table of contents, click here. To order, click here.

Thank you, everyone, for your patience and your support.

_____________________________________________________________

Follow DNAexplain on Facebook, here.

Share the Love!

You’re always welcome to forward articles or links to friends and share on social media.

If you haven’t already subscribed (it’s free,) you can receive an e-mail whenever I publish by clicking the “follow” button on the main blog page, here.

You Can Help Keep This Blog Free

I receive a small contribution when you click on some of the links to vendors in my articles. This does NOT increase your price but helps me keep the lights on and this informational blog free for everyone. Please click on the links in the articles or to the vendors below if you are purchasing products or DNA testing.

Thank you so much.

DNA Purchases and Free Uploads

Genealogy Products and Services

My Books

Genealogy Books

Genealogy Research