Click on any image to enlarge
Recently, in a press release, FamilyTreeDNA announced a new version of their Family Finder autosomal test that increases coverage from about .02% to about 9% of the human genome. Increasing coverage to this level using precision genomics holds great promise for the future.
Everyone who has purchased a Family Finder test since the beginning of March is automatically tested using the new technology – and it doesn’t cost any more than the earlier test.

As shown in this slide presented by Dave Vance, Senior VP and General Manager at FamilyTreeDNA, the new test covers 400 times more DNA locations than the industry-standard microarray chip-based test.
The typical vendor microarray autosomal DNA test covers somewhere between 400,000 and 750,000 locations.
Utilizing this new technology is an investment in the future.
You Don’t Know What You Don’t Know
To quote Dave:
Two numbers I want you to remember.
0.02 is the percent of your whole genome reported by standard autosomal tests today. All of your ancestry estimates, shared segments, and autosomal matches come from that small fraction.
9 is the percent of your genome that our new Family Finder test reports at high quality coverage. Starting right now — that’s over 400 times more data, from the very same test.
And the real point isn’t the number. It’s what that data makes possible. This gives us the foundation to unlock deeper, more meaningful insights — not just today, but for years to come. And when it becomes possible to go even further, I want FamilyTreeDNA to lead the way.
But what does that 9% mean for your genealogy research?
It means fewer unexplained matches, a clearer understanding of how people are related, and more confidence in the conclusions you draw from your autosomal DNA. Moving from connections to explanations, and from data to answers.
And until we can start rolling out those deeper insights, for now you’ll still get the same trusted Family Finder experience you’re used to — but you’ll also have the benefit of data that’s ready to unlock even more as new insights become possible.
In fact, you can watch Dave for yourself, at RootsTech, on the mainstage, here, having the unenviable position of following the Irish-step-dancing Gardiner Brothers. Yea, Dave, I didn’t get that gene either!
What makes NGS sequencing so special?
Sequencing Types
NGS is the abbreviation for Next Generation Sequencing, also called massive parallel sequencing. Rather than using individual probes, NGS is a high-throughput technology that simultaneously sequences millions of DNA fragments while still allowing targeting of specific regions.
Dave wrote about the differences between different types of sequencing, here.
All vendors select or target locations in the human genome that are most relevant for their product set, purpose or goals.
The older microarray sequencing machines have been in use for many years. They use probes to read specific targeted addresses, one by one, identifying which of four nucleotides is present at each location on your two copies of each chromosome.
The four nucleotides, adenine (A), thymine (T), cytosine (C), and guanine (G) are the building blocks of DNA, and you receive one from each parent at every location on chromosomes 1-22. Chromosome 23, the sex selection chromosome is a little bit different due to X-DNA and Y-DNA, but the locations are still read the same way using NGS technology.

The results of DNA testing are essentially a downloadable output file with the following information for each read:
- The RSID SNP cluster ID chromosome
- The chromosome number
- The position (think street address) on the chromosome
- The results, which are the abbreviations for the nucleotide found on the first and second strands of your DNA at that location
In autosomal DNA testing, positions on strands cannot inherently be identified as maternal or paternal without additional techniques such as parental comparison or phasing.
This data file is not meant for you to analyze, but for computers to compare to other DNA testers. Needless to say, the power of the data lies in the information it holds, such as ethnicity, haplogroup-identifying mutations, and matching with other testers.
The output files must be compatible with each other, or the vendors must make accommodations for any incompatibility.
Regardless of the sequencing type, currently, all genetic genealogy vendors’ download files use this same pattern.
The difference between the files and file types from each vendor is:
- The technology used for the test
- How much DNA is tested
- How many rows of data are provided in the download file
- The quality of the results
Sequencing Type Differences
Let’s put this in terms that we all understand.
With microarray sequencing, a utility worker is sent to each address to read the two nucleotides.
With both NGS and whole-genome sequencing, many addresses are read at the same time. Think of a fleet of drones flying over a neighborhood and reading what is written on the rooftops of each house address.
The difference between the type of NGS sequencing utilized by FamilyTreeDNA, and whole-genome sequencing is threefold:
- NGS targets specific addresses and neighborhoods in a controlled manner, because we know they are useful and are specifically interested in the data at those locations. In other words, it omits oceans, deserts, and other places that we know aren’t useful for genealogy.
- Whole-genome sequencing covers the majority of the genome, even though more than 90% of the genome is identical in all humans. In other words, the fleet of whole-genome sequencing drones flies over everything, including oceans and deserts, reading and storing everything.
- The number of times the drones fly over each address.
For example, a low-pass whole-genome test would fly over the entire world (your genome), scanning it once or twice, but there will be cloud cover and weather in some locations. Typically, you want at least two complete reads from each address to compare to ensure a minimum level of quality. The missed areas need to be estimated with tools like imputation to fill in the blanks.
The breadth of DNA covered is known as “coverage”, or “pass coverage”. So, whole-genome testing covers all or most of the genome, including more than 90% that is not genealogically relevant because it’s identical in all humans.
With NGS sequencing, you specify which locations or neighborhoods you want the drones to read, and you instruct them to fly over just those regions, say, 5 or 10 times. Even if there’s weather or another issue, chances are that at least some of those passes will be able to read both nucleotides.
How many times a particular location, or base, is read is known as “read depth” or “sequencing depth”. The greater the depth, the higher the quality and accuracy of the targeted locations, which means less imputation or “fixing” is needed.
Within the industry, confidence to coverage correlation is about 93% confidence of accuracy for both alleles at a given location at a depth of 5X, which rises to about 99% accuracy at a depth of 10X.
Using our examples, whole-genome sequencing covers about 98% of the genome, at a depth specified by the vendor. Low-pass whole-genome testing is typically performed at a depth of 2X, meaning each location is scanned twice.
NGS combines the best aspects of both “drone style” and “targeted” reads, providing the highest accuracy for the areas that are most important for genetic genealogy at an affordable price, while also targeting enough of the human genome to allow for new discoveries that may be important to either population genetics for ethnicity identification, or to identify your own family lineage mutations.
Yes, you can get both high coverage and very deep reads. That’s called medical-grade whole-genome sequencing, where your entire genome is sequenced to a depth of at least 30X, but it’s both expensive and not useful for genealogy. None of the genealogy vendors are prepared to, or need to, process the massive amount of data generated by a medical-grade whole-genome test, so there is no benefit to taking that type of test for genealogical purposes.
Why is NGS Sequencing Important?
FamilyTreeDNA has moved from the 700,000+ SNPs previously read on their microarray chip, to more than 280 million base pairs. So, from about .02% to about 9% of the 3.1 billion base pairs of the human genome.
Technology has improved to the point where NGS sequencing is no more expensive than microarray sequencing and provides substantially more results.
In other words, there’s no reason NOT to implement this technology now. The new Family Finder test is fully compatible with their earlier Family Finder tests, so everything is painless.
Plus, NGS allows FamilyTreeDNA to target specific locations that benefit their customers, such as both Y-DNA and mitochondrial DNA SNPs. Of course, you’ll still need to take the Big Y-700 or the full sequence mitochondrial DNA (mtDNA) test for full results and matching – but males will receive a confirmed Y-DNA mid-level haplogroup now, with midrange mtDNA haplogroups coming in the future for Family Finder testers. This is a feature that other vendors don’t target or provide at the same level.
I’m very hopeful that these foundation haplogroups will serve as an “appetizer” and will encourage more people to take both the Big Y-700 (males only) and the mtFull test (for everyone), as applicable, to receive those types of specific matches and learn more about their ancestors.
Speaking of the future, how do you future-proof your DNA?
Future-Proofing Your DNA
If you’ve already tested, should you purchase a new Family Finder test for yourself now?
No.
I know you didn’t expect that answer, but here’s why.
Everyone who purchases a Family Finder test, which uses NGS technology, receives the same matching and features as the legacy test.
FamilyTreeDNA doesn’t yet know the benefits and discoveries that will eventually be available, and they won’t know until after they have results of customers to work with.
Having said that, you will definitely want to future-proof your DNA and the results of anyone whose results you count on to help sort through your own.
So, let’s make a plan!
Assuring Future Compatibility
Plan 1 – Test Your Relatives:
Your closest relatives are your best assets. They help you determine how you match others, who you share ancestors with, and the identities of those ancestors. You absolutely need to test the following relatives if they are available:
- Parents
- Grandparents
- Siblings, both full and half – test all of them if both parents aren’t available for testing.
- If your sibling(s) are deceased or not available, their children carry half of their DNA, but not the same half, so test everyone available. You don’t need to test your siblings’ children if that sibling is available to test.
- Aunts and uncles, or their descendants if they are not available
- Great-aunts and uncles, or their descendants if they are not available
- First and second cousins
Plan 2 – Person Has Never Tested:
- If you or they have never taken the Family Finder test at FamilyTreeDNA, order a Family Finder test now. Depending on the circumstances and how you relate to them, also consider adding a Y-DNA or mitochondrial DNA test as well.
- If you have taken a Y-DNA or mitochondrial DNA test at FamilyTreeDNA, upgrade to a Family Finder test now.
Plan 3 – Already Tested at FamilyTreeDNA:
- If they or you have already taken a Family Finder test at FamilyTreeDNA, an upgrade offer will be forthcoming soon. You don’t need to do anything now.
- If the person is critical for your research, elderly, or there is some other reason for concern, the tester or kit manager can contact FamilyTreeDNA customer support now and inquire whether or not there is an unopened vial of DNA.
- To assure that there is enough DNA left for the future, or that the DNA sample is not too old, you can request that a “C/D vial” set be sent to you/them just in case. Be sure the current address is valid.
- This is also a good time to be sure that your/their Beneficiary Information and/or Kit Manager information is current as well. You’ll find both under Account Settings beside the name in the upper right corner of the page.
Plan 4 – Uploaded From Another Vendor:
- If you uploaded your DNA file to FamilyTreeDNA from another vendor instead of testing there, hold your horses for now. You’ll clearly have to swab, because when you do an upload, only the data file is uploaded. No DNA is actually transferred or uploaded. I’m not sure what process will be put in place for transfer/uploaded testers, but FamilyTreeDNA will let you know when something is available.
What NOT to Do
I contacted FamilyTreeDNA and this is what they ask customers NOT to do:
- Don’t request that your current test be deleted so you can order a new one. This removes everything – linkages, trees, family matching, permissions, project membership, other tests, and notes. Not just for you, but for your matches who have done work on their match with you as well.
- Don’t order a second kit, which causes “twins” in the system. I don’t have inside knowledge, but I’ll bet there will be special upgrade pricing if you just wait a bit!
I’m Excited
I don’t know what the future holds, but I’m hoping for:
- More granular ethnicity (we always want that, right?)
- More confident matching
- Improved relationship identification
- Additional tools to identify descendants of specific ancestors
- Tools to identify missing ancestors
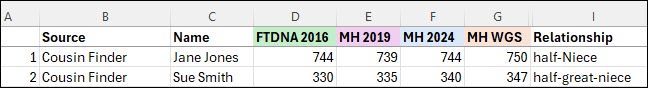
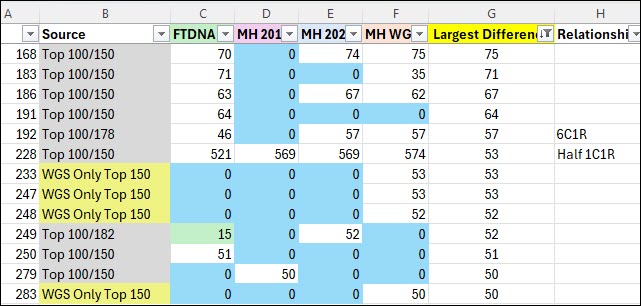
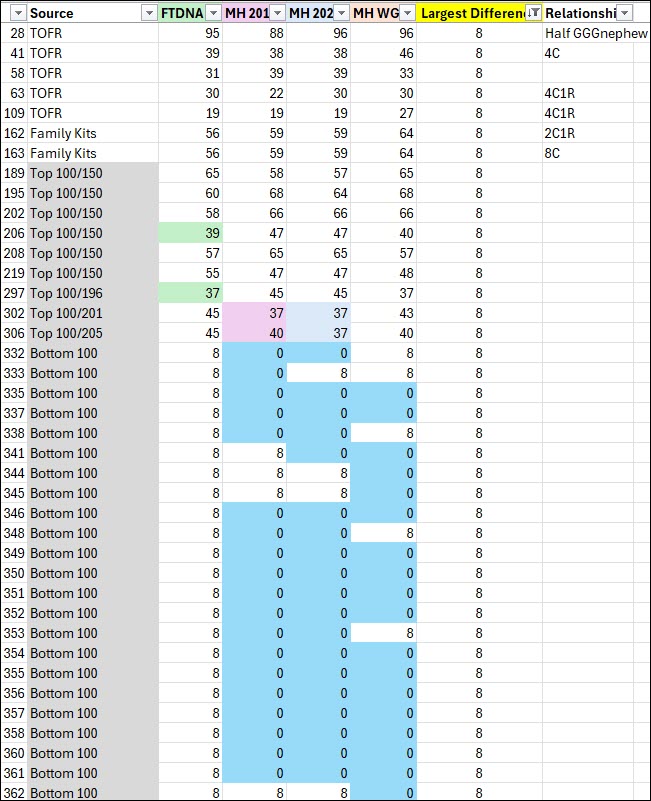
As a contract member of the R&D team, I’ll let you know when my NGS results are back and how they compare to my matches on the current chip. You know I’m building that spreadsheet already!!
_____________________________________________________________
Share the Love!
You’re always welcome to forward articles or links to friends and share on social media.
Subscribe!
If you haven’t already subscribed, it’s free. You’ll receive an e-mail whenever I publish by clicking the “follow” button at the top of the main blog page, here.
Help Keep This Blog Free
I receive a small commission when you click a vendor link in my articles and purchase that item. This does NOT increase your price but helps me keep the lights on and this informational blog free for everyone. Please click on the affiliate links in the articles or to the vendors below if you are purchasing products or DNA testing.
Thank you so much.
DNA Purchases and Free Uploads
- FamilyTreeDNA – Y-DNA, mitochondrial and autosomal DNA testing
- MyHeritage DNA – Autosomal DNA test
- AncestryDNA – Autosomal DNA test
- AncestryDNA Plus Traits
- 23andMe Ancestry – Autosomal DNA only, no Health
- 23andMe Ancestry Plus Health
Genealogy Products and Services
- MyHeritage Subscription with Free Trial
- Legacy Family Tree Webinars – Genealogy and DNA classes, subscription-based, some free
- Legacy Family Tree Software – Genealogy software for your computer
- OldNews – Old Newspapers with links to save to MyHeritage trees
- MyHeritage Omni comprehensive “everything included” subscription plan
- Newspapers.com – Search newspapers for your ancestors
- NewspaperArchive – Search different newspapers for your ancestors
My Books
- DNA for Native American Genealogy – by Roberta Estes, for those ordering the e-book from anyplace, or paperback within the United States
- DNA for Native American Genealogy – for those ordering the paperback outside the US
- The Complete Guide to FamilyTreeDNA – Y-DNA, Mitochondrial, Autosomal and X-DNA – for those ordering the e-book from anyplace, or paperback within the United States
- The Complete Guide to FamilyTreeDNA – Y-DNA, Mitochondrial, Autosomal and X-DNA for those ordering the paperback from outside the US
Genealogy Books
- Genealogical.com – Lots of wonderful genealogy research books
- American Ancestors – Wonderful selection of genealogy books
Genealogy Research
- Legacy Tree Genealogists – Professional genealogy research