DNA Black Friday is Here

Yes, I know it’s not Friday yet, but the DNA Black Friday sales have started, and sale dates are limited, so here we go.

These are the best prices I’ve ever seen at both FamilyTreeDNA and MyHeritage. If you’ve been waiting to purchase a DNA test for that special someone, there’s never been a better time.

Remember, to jump-start your genetic genealogy, test close or targeted relatives in addition to yourself:

  • Parents, or if both parents are not available, full and half-siblings
  • If neither parents nor siblings are available, your siblings’ descendants
  • Grandparents or descendants of your grandparents – aunts, uncles, or their descendants
  • Cousins descended from great-grandparents or other known ancestors
  • Y and mitochondrial DNA descendants of specific, targeted ancestors

For yourself, you’ll want to fish in all the ponds by taking an autosomal test or uploading a DNA file to each of the four vendors. Upload/download instructions are available here.

Everyone can test their own mitochondrial DNA to learn about your mother’s direct matrilineal line, and males can test their Y-DNA to unveil information about their patrilineal or surname line. Women, you can test your father’s, brother’s, or paternal uncle’s Y-DNA.

I’ve written a DNA explainer article, 4 Kinds of DNA for Genetic Genealogy, which you might find helpful. Please feel free to pass it on.

Vendor Offerings

FamilyTreeDNA

Free shipping within the US for orders of $79 or more

FamilyTreeDNA is the only major testing company that offers multiple types of tests, meaning Y-DNA, mitochondrial and autosomal. You can also get your toes wet with introductory level tests for Y DNA (37 and 111 marker tests), or you can go for the big gun right away with the Big Y-700.

This means that if you’ve purchased tests in the past, you can upgrade now. Upgrade pricing is shown below. Click here to sign on to your account to purchase an upgrade or additional product.

At FamilyTreeDNA, by taking advantage of autosomal plus Y-DNA and mitochondrial DNA, you will get to know your ancestors in ways not possible elsewhere. You can even identify or track them using your myOrigins painted ethnicity segments.

FamilyTreeDNA divides your Family Finder matches maternal and paternally for you if you create or upload a tree and link known testers. How cool is this?!!!

MyHeritage

The MyHeritage DNA test is on sale for $36, the best autosomal test price I’ve ever seen anyplace.

MyHeritage has a significant European presence and I find European matches at MyHeritage that aren’t anyplace else. MyHeritage utilizes user trees and DNA matches to construct Theories of Family Relativity that shows how you and your matches may be related.

Remember, you can upload the raw data file from the MyHeritage DNA test to both FamilyTreeDNA and GEDmatch for free.

Free shipping on 2 kits or more.

This sale ends at the end-of-day on Black Friday.

You can combine your DNA test with a MyHeritage records subscription with a free trial, here.

Ancestry

The AncestryDNA test is $59, here. With Ancestry’s super-size DNA database, you’re sure to get lots of matches and hints via ThruLines.

You can get free shipping if you’re an Amazon Prime member.

If you order an AncestryDNA test, you can upload the raw DNA file to FamilyTreeDNA, MyHeritage and GEDmatch for free. Unfortunately, Ancestry does not accept uploads from other vendors.

23andMe

The 23andMe Ancestry + Traits DNA test is $79, here. 23andMe is well known for its Ancestry Composition (ethnicity) results and one-of-a-kind genetic tree.

The 23andMe Ancestry + Traits + Health test is now $99, here.

You can get free shipping if you’re an Amazon Prime member.

If you order either of the 23andMe tests, you can upload the raw data file to FamilyTreeDNA, MyHeritage, and GEDmatch for free. Unfortunately, 23andMe does not accept uploads from other vendors.

Can’t Wait!!

This is always my favorite time of the year because I know that beginning soon, we will all be receiving lots of new matches from people who purchased or received DNA tests during the holiday season.

  • What can you do to enhance your genealogy?
  • Have you ordered Y and mitochondrial DNA tests for yourself and people who carry the Y and mitochondrial DNA of your ancestors?
  • Are you in all of the autosomal databases?
  • Who are you ordering tests for?

_____________________________________________________________

Follow DNAexplain on Facebook, here or follow me on Twitter, here.

Share the Love!

You’re always welcome to forward articles or links to friends and share on social media.

If you haven’t already subscribed (it’s free,) you can receive an email whenever I publish by clicking the “follow” button on the main blog page, here.

You Can Help Keep This Blog Free

I receive a small contribution when you click on some of the links to vendors in my articles. This does NOT increase the price you pay but helps me to keep the lights on and this informational blog free for everyone. Please click on the links in the articles or to the vendors below if you are purchasing products or DNA testing.

Thank you so much.

DNA Purchases and Free Uploads

Genealogy Products and Services

My Book

Genealogy Books

Genealogy Research

Y DNA Genealogy Case Study: SNPs, STRs & Autosomal – Why the Big Y-700 Rocks!

An expanded version of this article, including the genealogical aspects written for the Speak family, is available here. There is significantly more DNA information and analysis in this article, including STR values and autosomal analysis which can sometimes augment Y DNA results.

In 2004, 18 years ago, I founded the Speak(e)(s) Family DNA Project at FamilyTreeDNA in collaboration with the Speaks Family Association (SFA).

The goal of the Association broadly was to share research and to determine if, and how, the various Speak lines in America were related. The “rumor” was that the family was from England, but no one knew for sure. We didn’t even know who was actually “in” the family, or how many different families there might be.

The good news is that to answer these types of questions, you don’t need a huge study, and with today’s tools, you certainly don’t need 18 years. Don’t let that part scare you. In fact, any Speak(e)(s) man who takes a Y-DNA test today will have the answer plopped into his lap thanks to earlier testers.

When I established the Speaks DNA Project, our goal was stated, in part, as follows:

This project was begun to determine the various Speak(e)(s) lines around the world. According to family legend, the original ancestor came to England with William the Conqueror and his last name then was L’Espec. It was later spelled Speke and then the derivatives of Speake, Speak, Speakes, and Speaks carried by descendants today.

We knew there was a Thomas Speak (c1634-1681) who settled in St. Mary’s County, MD by 1661 and had two sons, John the InnKeeper or InnHolder (1665-1731) and Bowling (c1674-1755), named after his mother’s birth surname.

Fast forwarding two or three generations, my ancestor, Nicholas Speak or Speaks was born about 1782 and was first found in Washington County, Virginia in 1804 when he married Sarah Faires. That’s a long way from Maryland. Who was Nicholas? Who were his parents? How did Nicholas get to Washington County, Virginia? There aren’t any other Speaks men, or women, in Washington County. Was he dropped fully grown by the stork?

In 2005, I attended my first Speaks Family Association Convention and gave an introductory talk about Y-DNA. Speaks males volunteered to test.

By the 2006 Convention, we had 8 Y-DNA testers.

At first, everything was fine. Two testers each from Thomas the Immigrant through sons John and Bowling.

  • Thomas, Bowling and then two different sons. They matched.
  • Thomas, John, and his son Richard. They matched too.
  • All four men above match each other.

Everything’s good, right?

Not so fast…

Then, a father/son pair tested who were also supposed to descend from the Thomas, Bowling, and Thomas line. Thankfully, they matched each other, but they did NOT match the other descendants of Thomas the Immigrant.

Because we had multiple men through both of Thomas the Immigrant’s sons, we had confirmed the Y-DNA STR marker signature of Thomas – which means that the father/son pair had experienced a genetic disconnect, or, they were actually descended from a different Speak line.

That wasn’t all though. Two more men tested who believed they descended from Thomas the Immigrant through John and then Richard. They didn’t match each other, nor any of the other men either.

This was a difficult, painful situation, and not what was anticipated. Of course, I reviewed the results privately with the men involved before presenting them at the convention, and only did so with their permission.

In an effort to identify their genealogical lines, we discovered seven other mentions of early colonial Speak immigrants, including one named Thomas.

Over time, we would discover additional Y-DNA genetic Speak lines.

Bonus Cousin

Y-DNA also revealed an amazing new cousin, Henry, who didn’t know who his father was, but thanks to DNA, discovered he is a genetic Speaks AND identified his father.

In 2006, our Y-DNA haplogroup was known only as I1b1. We knew it was fairly rare and found in the rough Dinaric Alps border region between Bosnia and Croatia.

We weren’t wrong. We were just early. Our ancestors didn’t stop in the Alps.

Haplogroups have come a long way since that time.

Today, using the new maps in the Discover tool, the migration path into Europe-proper looks like this.

By the 2009 Convention, more Speaks men were taking Y-DNA tests, but we still had no idea where the Speaks line originated overseas.

The Holy Grail

The Holy Grail of Y-DNA testing is often a match with a man either from the “old country,” wherever that is, or someone who unquestionably knows where their ancestor is from. Through a match with them, other testers get to jump the pond too.

In early 2010, a man in New Zealand was interested in taking a Y-DNA test and knew where, in England, his ancestors originated.

A few weeks later, the New Zealand tester matched our Thomas Speaks, the Immigrant, line, which meant our ancestors might be from where his ancestors were from. Where was that?

Gisburn.

Gisburn? Where the heck was Gisburn?

Gisburn

Gisburn is a tiny, ancient village in Lancashire, England located in the Ribble Valley on the old Roman road. It appears in the Domesday Book of 1086 as Ghiseburne and is believed to have been established in the 9th century.

This was no longer speculation or unsourced oral history, but actual genetic evidence.

We knew that Thomas Speake, the Immigrant, was Catholic. Maryland was a safe haven for Catholics hoping to escape persecution in England.

Thomas was rumored to have been born to a John, but we had no idea where that rumor arose.

Was our Thomas born in Gisburn too?

Shortly, we discovered that St. Mary’s Church in Gisburn held 50 marked Speaks burials in addition to many unmarked graves.

Next, we discovered that the records of St. Mary’s and All Saints Church in Whalley, eleven miles from Gisburn, held pages and pages of Speak family records. The earliest Speak burial there was in 1540.

In 2011, the SFA Convention was held near Thomas and Bowlng Speak’s land in Charles County, Maryland. My Convention presentation contained a surprise – the information about our Gisburn match, and what we had found. A Y-DNA match, plus church records, and graves. How could that get better?

I showed this cemetery map from St. Mary’s Church in Gisburn, where our New Zealand cousin’s family was buried.

It felt like we were so excruciatingly close, but still so far away.

We knew unquestionably that we were in the neighborhood, but where was our Thomas born?

Who was his family?

I closed with this photo of St. Mary’s in Gisburn and famously said, “I don’t know about you, but I want to stand there.”

It was a throw-away comment, or so I thought, but as it turned out, it wasn’t.

2013 – The Trip Home

Gisburn

Two years later, our Convention was held in Lancashire, and indeed, I got to stand there.

So did our Speak cousin from New Zealand whose Y-DNA test bulldozed this brick wall for us. To be clear, had this ONE PERSON not tested, we would NOT have known where to dig for records, or where to visit.

St. Mary’s Church was surrounded by the cemetery, with many Speak stones. The church itself was built as a defensive structure sometime before 1135 with built-in arrowslits for archers in many locations, including the tower. Our family history was thick and rich here.

St. Mary’s Church in Whalley

Our next stop was St. Mary’s Church in Whalley, where Henry Speke was granted a lease in 1540.

This church is ancient, built in the 1200s, replacing an earlier church in the same location, and stunningly beautiful.

The little green men carved into the wooden choir seats are a wink and a nod to an earlier pagan era. Our ancestors would have known that era too.

In addition to the churches in Gisburn and Whalley, we visited St. Leonard’s Church in Downham which is a chapelry of the church in Whalley.

Downham

This church, in the shadow of Pendle Hill, proved to be quite important to our hunt for family.

Downham, on the north side of Pendle Hill was small then, and remains a crossroad village today with a population of about 150 people, including Twiston.

Twiston is located less than 3 miles away, yet it’s extremely remote, at the foot or perhaps on the side of Pendle Hill.

During our visit, Lord Clitheroe provided us with a transcription of the Downham church records wherein one Thomas Speak was baptized on January 1, 1633/34, born to Joannis, the Latin form of John, in nearby Twiston.

Is this Thomas our Thomas the Immigrant who was born about that same time? We still don’t know. There are clues but they are inconclusive and some conflict with each other.

Records in this area are incomplete. A substantial battle was fought in Whalley in 1643. Churches were often used for quartering soldiers and horses. Minister’s notes could well have been displaced, or books destroyed entirely. There could easily have been more than one Thomas born about this time.

Probate files show that in 1615, “John Speake of Twiston, husbandman” mentions his son William and William’s children, including John who was the administrator of his will. For John to be an administrator, he had to be age 21 or over, so born in 1594 or earlier. Some John Speak married Elizabeth Biesley at Whalley in 1622 and is believed to be the John Speak Sr. recorded in Downham Parish Registers.

The Whalley, Gisburn, and Twiston Speake families are closely connected. The difference may well be that our Thomas’s line remained secretly Catholic, so preferred the “uninhabited” areas of the remote Twiston countryside. Even today, Gisburn is described as being “rural, surrounded by hilly and relatively unpopulated areas.” And that’s Gisburn, with more than 500 residents. Downham is much smaller, about 20% of the size of Gisburn.

What do we know about Twiston?

Twiston

Twiston is too small to even be called a hamlet. The original farm and corn mill was owned originally by Whalley Abbey at least since the 1300s and stands near an old lime kiln, probably in use since Roman times.

This is where you know the earth holds the DNA of your ancestors, and their blood watered the landscape.

When the Speak family lived here, it was considered a “wild and lawless region” by local authorities, probably due in part to its remoteness – not to mention the (ahem) rebellious nature of the inhabitants.

If you were a Catholic, living in a hotbed of “recussants,” and trying to be invisible, Twiston, nestled at the base of Pendle Hill would be a location where you might be able to successfully disappear among those of like mind.

Yes, of course, you’d show up, hold your nose, and baptize your baby in the Anglican church because you needed to, but then you would retreat into the deep hillside woodlands until another mandatory church appearance was required.

The road to Twiston was twisty, rock-lined, and extremely narrow, with rock walls on both sides. If only these ancient buildings and stone walls could speak, share their stories, and reveal their secrets.

Old documents, however, do provide some insight.

This document, originally penned in Latin, was provided by the Lancashire archives.

John Speak, in 1609, was a farmer, with a house (messauge), garden, orchard, 10 acres of farmland, 5 of meadow, and 10 acres of pasture.

Indeed, Twiston is where John Speak lived. If the Thomas born in Twiston to Joannis, Latin for John, in 1633 and baptized on January 1, 1633/34 in old St. Leonard’s Church in Downham is our Thomas, this is his birth location.

For our family, this is, indeed, hallowed ground.

Local Testers

Prior to our visit, we published small ads in local newspapers and contacted historical societies. We found several Speak(e)(s) families and invited them to dinner where the after-dinner speaker explained all about DNA testing. You probably can’t see them clearly, but there are numerous DNA kits lying on the table, just waiting for people to have a swab party.

Our guests brought their family histories, and one of those families traced their line to…you guessed it…Twiston.

Five men from separate Speak families tested. None of them knew of any connection between their families, and all presumed they were not related.

I carried those men’s DNA tests back in my hand luggage like the gold that they were.

They were wrong. All five men matched each other’s Y-DNA and our Thomas Speake line. We got busy connecting the dots genealogically, as best we could given the paucity of extant records.

  • Two of our men descended from Henry Speak born in 1650 who married Alice Hill and lived in Downham/Twiston.
  • Two of our men descended from John Speak born about 1540 who married Elina Singleton and lived in Whalley.
  • Two of our men, including our New Zealand tester, descend from John born sometime around 1700, probably in Gisburn where his son, James, was born about 1745.

We indeed confirmed that we had found our way “home” and that our Speake family has lived there a long time. But how long?

2022 DNA Analysis

Today, the Speaks family DNA Project has 146 members comprised of:

  • 105 autosomal testers
  • 32 Speak Y-DNA testers
  • 24 of whom are Thomas the Immigrant descendants
  • 8 Big Y testers

Over the years, we’ve added another goal. We need to determine HOW a man named Aaron Lucky Speaks is related to the rest of us.

Autosomal DNA confirms that Aaron Luckey is related, but we need more information.

Aaron Lucky is first found in 1787 purchasing land and on the 1790 Iredell County, NC census. We finally located a Y-DNA tester and confirmed that his paternal line is indeed the Lancashire Speaks line, but how?

After discovering that all 5 Lancashire Speaks men descend from the same family as Thomas the Immigrant, we spent a great deal of time trying to both sort them out, and tie the family lines together using STR 25-111 markers, with very limited success.

Can Y-DNA make that connection for us, even though the records can’t?

Yes, but we needed to upgrade several testers, preferably multiple people from each line to the Big Y-700 test.

The Y-DNA Block Tree

When men take or upgrade to a Big Y-700 DNA test, they receive the most detailed information possible, including all available (700+) STR markers plus the most refined haplogroup, including newly discovered mutations in their own test, placing them as a leaf on the very tip of their branch of the tree of mankind.

The only other men “in that branch neighborhood” are their closest relatives. Sometimes they match exactly and are sometimes separated by a single or few mutations. Testers with 30 or fewer mutations difference are shown on the Block Tree by name. Eight Speaks men have taken or upgraded to the Big Y test, providing information via matching that we desperately needed.

This Big Y block tree view shown below is from the perspective of a descendant of Nicholas Speaks (b1782) and includes the various mutations that define branches, shown as building blocks. Each person shown on the Block Tree is a match to the tester with 30 or fewer mutations difference.

Think of haplogroups as umbrellas. Each umbrella shelters and includes everything beneath it.

At the top of this block tree, we have one solid blue block that forms an umbrella over all three branches beneath it. The top mutation name is I-BY14004, which is the haplogroup name associated with that block.

We have determined that all of the Speak men descended from the Lancashire line are members of haplogroup I-BY14004 and therefore, fall under that umbrella. The other haplogroup names in the same block mean that as other men test, a new branch may split off beneath the I-BY14004 branch.

Next, let’s look at the blue block at far left.

The Lancashire men, meaning those who live there, plus our New Zealand tester, also carry additional mutations that define haplogroup I-BY14009, which means that our Thomas the Immigrant line split off from theirs before that mutation was formed.

They all have that mutation, and Thomas didn’t, but he has a mutation that they don’t. This is how the tree forms branches.

Thomas the Immigrant’s line has the mutation defining haplogroup I-FTA21638, forming an umbrella over both of Thomas the Immigrant’s sons – meaning descendants of both sons carry this mutation.

Bowling’s line is defined by haplogroup I-BY215064, but John’s line does not carry this mutation, so John’s descendants are NOT members of this haplogroup, which turns out to be quite important.

We are very fortunate that one of Thomas’s sons, Bowling, developed a mutation, because it allows us to differentiate between Bowling and his brother, John’s, descendants easily if testers take the Big Y test.

Those teal Private Variants are haplogroups-in-waiting, meaning that when someone else tests, and matches that variant, it will be named and become a haplogroup, splitting the tree in that location by forming a new branch.

Aaron Luckey Speak

As you can see, the descendants of Aaron Lucky Speak, bracketed in blue above, carry the Bowling line mutation, so Aaron Luckey descends from one of Bowling’s sons. That makes sense, especially since two of Bowling’s grandsons are also found in Iredell County during the same timeframe and are candidates to be Aaron Luckey’s father.

Here’s a different view of the Big Y testers along with STR Y-DNA testers in a spreadsheet that I maintain.

Thomas the Immigrant (tan band top row) is shown with son, Bowling, who carries haplogroup BY215064. Bowling’s descendants are tan too, near the bottom.

Thomas’s son, John the InnKeeper, shown in the blue bar does NOT have the BY215064 mutation that defines Bowling’s group.

However, the bright green Aaron Lucky line, disconnected at far right, does have the Bowling mutation, BY215064, so this places Aaron Luckey someplace beneath Bowling, meaning his descendant. We just don’t know where he fits yet. The key word is yet.

Can STR Markers Be Utilized for Lineage Grouping?

Sometimes we can utilize STR marker mutations for subgrouping within haplogroups, but in this case, we cannot because STR mutations in this family have:

  • Occurred independently in different lines
  • Potentially back mutated

Between both of these issues, STR mutations are inconsistent and, therefore, in this case, entirely unreliable. I have found this phenomenon repeatedly in DNA projects that I manage where the genealogy line of descent is known and documented.

Let’s analyze the STR mutations.

I’ve created a table based on our 26 Y-DNA testers. However, not everyone tested at 111 markers, so there is a mix.

You can view the Speak DNA Project results, here.

I’ve divided the testers into the same groupings indicated by genealogy combined with the Big Y SNP mutations, which do agree with each other. Those groups are:

  • The Lancaster men that never left, except for the New Zealand tester whose ancestor left just two generations ago. They all share a defining SNP which provides them with an identifying haplogroup that the American line does not have.
  • The Thomas the Immigrant line through son Bowling.
    • The Aaron Luckey line who descends, somehow, from Bowling.
  • The Thomas the Immigrant line through son John the InnKeeper.
  • Two men who have provided no genealogy

We already know that Aaron Luckey descends from Bowling, somehow, but I’m keeping them separate just in case STR values can be helpful.

Let’s look at a total of five STR markers where multiple descendants have experienced mutations and see if we can discern any message. The mutations in the bright yellow Lancashire groups on the project page are summarized and analyzed in the chart, below.

You read the chart below, as follows:

  • For marker DYS-19, the testers who have a value of 16 – then the numbers indicated the number of testers in that group with that value. The Lancaster group has 5, the Bowling group has 7, the Aaron Luckey group has 4, and so forth.
  • The next row, colored the same, shows the value of 17 for marker DYS19.
  • Rows for values of the same marker are colored the same.

This chart does not include several markers where there are one-offs, meaning one mutation in the entire group, or one in each of two different groups that are different from each other. This chart includes markers with mutations that occur in multiple descendants only.

If these mutations were predictive and could be used for lineage assignment, we would expect to see the same mutation only within one of the lines, descended from a common ancestor, consistently, and not scattered across multiple lines.

Let’s start our analysis with the only marker that may be consistently predictive in this group. Marker DYS389ii has an ancestral value of 28, We know this because that value is consistently found in all of the Speaks descendants. A value of 29 is ONLY found in the 4 descendants of Aaron Luckey, and the value of 29 is consistently found in all of his known descendants who have tested. Therefore, it could be predictive.

However, given the nature of STR mutations, it’s difficult to place a lot of confidence in STR-based lineage predictions. Let’s look at the other four markers.

  • Marker DYS19 has a value of 16 in every line, which would be the ancestral value. However, we also find a mutation of 17 in 1 of Bowling’s children, and in 2 of John the InnKeeper’s descendants. That can’t be lineage-defining.
  • Looking at the CDY a/b marker, we find one instance of 35/36, which is a one-off. I wouldn’t have included it if I wasn’t using the other two combinations as examples. The values of 36/36 are found in every line except for the one with no genealogy and only one person has tested at 111 markers. A value of 36/37 is found in only the Bowling line, but not the Aaron Luckey line. The MRCA, or most recent common ancestor between the Bowling descendants is his son, Thomas of Zachia. The best candidates for Aaron Luckey’s father are two of Thomas of Zachia’s sons, but his descendants have a hodgepodge mixture of the two values, so this, again, cannot be a lineage-defining marker.
  • Looking at DYS534, we see a 15 in one of Bowling’s descendants and in 4 of John the InnKeeper’s descendants. Obviously not lineage-specific. There’s a value of 16 in every line which would be ancestral.
  • A value of 33 at DYS710 is found in every lineage, so would be the ancestral value. The value of 34 is found once in each line except for Bowling, which precludes it from being lineage-defining.

Inconsistent lineage results is one of the best reasons to purchase or upgrade to the Big Y-700 test.

Unfortunately, STR placement and lineage determination can be very deceptive and lead genealogists astray. At one time, we didn’t have advanced tools like the Big Y, but today we do.

STR Tests Are Useful When…

To be clear, STR marker tests, meaning the 37 and 111 marker tests available for purchase today, ARE very useful for:

  • Matching other testers
  • Identifying surnames of interest
  • Ruling out a connection, meaning determining that you don’t match a particular line
  • Introductory testing with limited funds that provides matching, a high-level haplogroup, and additional tools. You can always upgrade to the Big Y-700 test.

However, the Big Y-700 is necessary to place groups of people reliably into lineages and determine relationships accurately.

In some cases, autosomal DNA is useful, but in this case, autosomal doesn’t augment Y-DNA due, in part, to record loss and incomplete genealogy in the generations following Thomas of Zachia.

Family Finder Autosomal Analysis

In total, we have the following total Family Finder testers whose genealogy is confirmed:

  • 8 Aaron Luckey
  • 6 Lancashire testers
  • 15 John the InnKeeper testers
  • 33 Bowling testers

An autosomal analysis shows that Aaron Luckey Speak’s descendants match each other (green to green) most closely than they match either of Thomas the Immigrant’s sons, Bowling (tan) or John’s (blue) descendants. We would expect Aaron Luckey’s descendants to match each other the most closely, of course.

The numbers in the cells are total matching centiMorgans/longest segment cM match.

Click on any image to enlarge

Aaron Luckey’s descendants don’t collectively match John or Bowling’s descendants more closely than the other group using centiMorgans as the comparison. Although they match more of Bowling’s descendants (21%) than John’s (13%). This too would be expected since we know Aaron Luckey descends from Bowling’s line, not John’s.

At best, Aaron Luckey’s descendants are 8 or 9 generations removed from a common ancestor with other descendants of Thomas of Zachia, making them 6th or 7th cousins, plus another couple of generations back to Thomas the Immigrant. We can’t differentiate genetically between sibling ancestors or cousin lines at this distance.

Furthermore, we have a large gap in known descendants beneath Thomas of Zachia, other than Charles Beckworth Speak’s son Nicholas’s line. We have at least that many other testers in the project who don’t can’t confirm their Speaks ancestral lineage.

Combining genetic and genealogy information, we know that both Charles Beckworth Speak and Thomas Bowling Speak, in yellow, are found in Iredell County, NC. The children of Thomas of Zachia, shown in purple, are born in the 1730s and any one of them could potentially be the father of Aaron Luckey.

The men in green, including William, Bowling’s other son, are also candidates to be Aaron Luckey’s ancestor, although the two yellow men are more likely due to geographic proximity. They are both found in Iredell County.

We don’t know anything about William’s children, if any, nor much about Edward. John settled in Kentucky. Nicholas (green) stayed in Maryland.

There may be an additional generation between Charles Beckworth Speak (yellow) and Nicholas (born 1782), also named Charles. There’s a lot of uncertainty in this part of the tree.

It seems that Aaron’s middle name of Lucky is likely to be very significant. Aaron Luckey’s descendants may be able to search their autosomal matches for a Luckey family, found in both Iredell County AND Maryland, which may assist with further identification and may help identify Aaron’s father.

If all of the Speak men who took STR tests would upgrade to the Big Y, it’s probable that more branches would be discovered through those Private Variants, and it’s very likely that Aaron Luckey could be much more accurately placed on the tree. Another Aaron Luckey Speak Big Y-700 DNA tester would be useful too.

Connecting the Genetic Dots in England

What can we discern about the Speak family in the US and in Lancashire?

Reaching back in time, before Thomas the Immigrant was born about 1633, what can we tell about the Speak family, how they are connected, and when?

The recently introduced Discover tool allows us to view Y-DNA haplogroups and when they were born, meaning when the haplogroup-defining mutation occurred.

The Time Tree shows the haplogroups, in black above the profile dots. The scientifically calculated approximate dates of when those haplogroups were “born,” meaning when those mutations occurred, are found across the top.

I’ve added genealogical information, in red, at right.

  • Reading from the bottom red dot, Bowling’s haplogroup was born about the year 1660. Bowling was indeed born in 1674, so that’s VERY close
  • Moving back in time, Thomas’s haplogroup was born about 1617, and Thomas himself was born about 1633, but his birth certainly could have been a few years earlier.
  • The Lancashire testers’ common haplogroup was born about 1636, and the earliest known ancestor of those men is Henry, born in Twiston in 1650.
  • The common Speak ancestor of BOTH the Lancashire line and the Thomas the Immigrant line was born about 1334. The earliest record of any Speak was Henry Speke, of Whalley, born before 1520.

The lines of Thomas the Immigrant and the Lancashire men diverged sometime between about 1334, when the umbrella mutation for all Speaks lines was born, and about 1617 when we know the mutation defining the Thomas the Immigrant line formed and split off from the Lancashire line.

But that’s not all.

Surprise!

As I panned out and viewed the block tree more broadly, I noticed something.

This is quite small and difficult to read, so let me explain. At far left is the branch for our Speaks men. The common ancestor of that group was born about 1334 CE, meaning “current era,” as we’ve discussed.

Continuing up the tree, we see that the next haplogroup umbrella occurs about 1009 CE, then the year 850 at the top is the next umbrella, encompassing everything beneath.

Looking to the right, the farthest right blocks date to 1109 CE, then 1318 CE, then progressing on down the tree branch to the bottom, I see one surname in three separate blocks.

What is that name?

Here, let me enlarge the chart for you!

Standish.

The name is Standish, as in Myles Standish, the Pilgrim.

Miles is our relative, and even though he has a different surname, we share a common ancestor, probably before surnames were adopted. Our genetic branches divided about the year 1000.

The Discover tool also provides Notable Connections for each haplogroup, so I entered one of the Speaks haplogroups, and sure enough, the closest Speak Notable Connection is Myles Standish 1584-1656.

And look, there’s the Standish Pew in Chorley, another church that we visited during our Lancashire trip because family members of Thomas Speake’s Catholic wife, Elizabeth Bowling, are found in the Chorley church records.

Our common ancestor with the Standish line was born in about the year 850. Our line split off, as did the Standish line about the year 1000. That’s about 1000 years ago, or 30-40 generations.

Our family names are still found in the Chorley church records

Ancient Connections

The Discover tool also provides Ancient Connections from archaeological digs, by haplogroup.

Sure enough, there’s an ancient sample on the Time Tree named Heslerton 20641.

Checking the Discover Ancient Connections, the man named Heslerton 20641 is found in West Heslerton, Yorkshire, and lived about the year 450-650, based on carbon dating.

The mutation identifying the common ancestor between the Speak/Standish men and Heslerton occurred about 2450 BCE, or 4500 years ago. Twiston and West Heslerton are only 83 miles apart.

Where Are We?

What have we learned from the information discovered through genealogy combined with Big Y testing?

  • We found a Speek family in Whalley in 1385.
  • One of our Lancashire testers descends from a John born about 1540 in Whalley.
  • One of our Lancashire testers descends from Henry born about 1650 in Downham/Twiston
  • Thomas Speake was baptized in Downham and born in Twiston in 1733.
  • Our New Zealand tester’s ancestor was found in Gisburn, born about 1745.

All of these locations are within 15 miles of each other.

  • Chorley, where the Standish family is found in the 1500s is located 17 miles South of Whalley. Thomas Speake’s wife, Elizabeth Bowlings’ family is found in the Chorley church records.

What about the L’Espec origin myth?

  • The Speak family clearly did not arrive in 1066 with the Normans.
  • We have no Scandinavian DNA matches.
  • No place is the surname spelled L’Espec in any Lancashire regional records.
  • The Speak family is in the Whalley/Chorley area by 1000 when the Speak/Standish lines diverged
  • The common ancestor with the Standish family lived about the year 850, although that could have occurred elsewhere. Clearly, their common ancestor was in the Chorley/Whalley area by 1000 when their lines diverged.

The cemetery at Whalley includes Anglo-Saxon burials, circa 800-900. The Speak men, with no surname back then, greeted William the Conqueror and lived to tell the tale, along with their Standish cousins, of course. This, in essence, tells us that they were useful peasants, working the land and performing other labor tasks, and not landed gentry.

Little is known of Lancashire during this time, but we do know more generally that the Anglo-Saxons, a Germanic people, arrived in the 5th century when there was little else in this region.

Are our ancestors buried in these and other early Anglo-Saxon graves? I’d wager that the answer is yes. We are likely related one way or another to every family who lived in this region over many centuries.

Y-DNA connected the dots between recent cousins, connected them to their primary line in America, provided a lifeline back to Twiston, Whalley, and Gisburn, and then to the Anglo-Saxons – long before surnames.

Aaron Luckey Speak’s descendants now know that he descends, somehow, from Bowling, likely through one of two sons of Thomas of Zachia. They don’t have the entire answer yet, but they are within two generations, a lot closer than they were before.

And this, all of this, was a result of Big-Y DNA tests. We could not have accomplished any of this without Y-DNA testing.

Our ancestors are indeed speaking across the ages.

We found the road home, that path revealed by the DNA of our ancestors. You can find your road home too.

_____________________________________________________________

Follow DNAexplain on Facebook, here or follow me on Twitter, here.

Share the Love!

You’re always welcome to forward articles or links to friends and share on social media.

If you haven’t already subscribed (it’s free,) you can receive an email whenever I publish by clicking the “follow” button on the main blog page, here.

You Can Help Keep This Blog Free

I receive a small contribution when you click on some of the links to vendors in my articles. This does NOT increase the price you pay but helps me to keep the lights on and this informational blog free for everyone. Please click on the links in the articles or to the vendors below if you are purchasing products or DNA testing.

Thank you so much.

DNA Purchases and Free Uploads

Genealogy Products and Services

My Book

Genealogy Books

Genealogy Research

Native American: Is She or Isn’t She?

Many people have an oral history that a specific female ancestor is Native American.

Autosomal DNA results may or may not show some percentage of Native American ancestry. If your results DO include a percentage of Native American, you still need to figure out which ancestors were Native. Where did that piece of your genetic heritage come from?

If your results don’t include Native ancestry, that doesn’t necessarily mean you don’t have a Native Ancestor. Sometimes you just didn’t inherit a discernable segment of DNA from that ancestor, or maybe the vendor you tested with didn’t pick that up.

Be sure to upload your raw DNA file to both FamilyTreeDNA and MyHeritage for free to gain another perspective. Here’s my free step-by-step guide for downloading and uploading your DNA files from and to all the major vendors.

FamilyTreeDNA provides painted segment information as well that shows you which segments are Native American.

One of my challenges is that I do have Native American autosomal DNA segments. Determining where they came from has been challenging, although the ethnicity chromosome painting at FamilyTreeDNA has been very useful in confirming the source of those segments.

Is there a way to augment autosomal results and be more specific and directed in my search? Can I focus on an individual ancestor? Especially females who are particularly difficult to research, given name changes in each generation?

Yes, you can.

Chasing the Truth

Sometimes, especially historically, when a female ancestor’s genealogy wasn’t known, people presumed that they must have been Native American. I’ve come across this several times now.

The good news is that using mitochondrial DNA, you can find out conclusively if you test someone who descends from that woman through all females to the current generation, which can be male.

I had Native American oral history connected to two ancestors, both of whom I was able to confirm or refute by finding a cousin who inherited that ancestor’s mitochondrial DNA and agreed to test. Women give their mitochondrial DNA to both sexes of their children, but only daughters pass it on. In the current generation, males or females can test.

I also found an unexpected ancestor who was Native. I had no oral history about her – so you just never know what you’ll discover.

Sarah Faires

Oral history in some descendant families indicated that Sarah Faires’s was Native American, possibly because her ancestors were unknown. There was a supposition that “she must have been Native.”

We were able to obtain the mitochondrial DNA of Sarah whose haplogroup turned out to be H49a1, so clearly not Native.

If Sarah’s direct maternal line (her mother, her mother, her mother, on up her tree) had been Native American, she would have fallen into subclades of haplogroup A, B, C, D or X, although not all of those subclades are Native.

You can view the entire list of Native American mitochondrial DNA haplogroups, here and you can view H49a1 on the public mitochondrial haplotree, here.

H49a1 is most frequently found in Germany, followed by Sweden, England and Denmark.

Elizabeth Vannoy

My father’s grandmother, Elizabeth Vannoy, was reported to be Cherokee, both orally and in several letters between family members.

One of my first genealogy goals was to prove that history, but I wound up eventually doing just the opposite.

Elizabeth Vannoy’s mitochondrial DNA haplogroup is J1c2c, not Native.

Haplogroup J1c2c is found most often in England, France, Sweden and Hungary.

I was able to connect Elizabeth to her parents. Then, eventually, thanks to mitochondrial DNA, working with a cousin, we connected another four maternal generations conclusively, and I’m still working on the fifth generation.

Anne Marie Rimbault

My cousin had no idea that her ancestor, Anne Marie, born about 1631, in Acadia, wife of Rene Rimbault, was Native American when she tested her mitochondrial DNA.

Mitochondrial DNA results explained why Anne Marie’s parents had never been identified in the French records. She was Native American – a member of the Mi’kmaq tribe that intermarried with the French men in the Acadian settlement, proven by her A2f1a haplogroup.

Haplogroup A2f1a is shown on the mitochondrial haplotree as First Nations in Canada and Native American in the US, plus one French flag reflecting a tester who only knew that her ancestor was French-Canadian and believed she had come from France.

Her mitochondrial DNA matches are scattered across the Northern US and Canada, but her closest matches are found in the Acadian and French-Canadian communities.

Is She, or Isn’t She?

Testing your own mitochondrial DNA if you think your direct maternal ancestor may be Native will unquestionably answer that question. Finding a mitochondrial DNA candidate for each of your ancestral lines will reveal which ancestor is Native, or you can target test to see if any specific ancestor is Native.

Unlike autosomal DNA, mitochondrial DNA never loses its potency and doesn’t mix with the DNA of the father. The segments aren’t divided in each generation and don’t wash out over time.

Do you have oral history about female Native American ancestors? Do you have ancestors whose parents are unknown? Mitochondrial DNA testing will resolve that question, plus provide matching with other testers. You don’t know what you don’t know.

If you’re interested in learning more about how to find your Native American ancestors, you might enjoy my book, DNA for Native American Genealogy. There’s lots of information there, including search tips, ancient DNA, maps and known tribes by haplogroup.

Do you have female ancestors who might be Native American?

____________________________________________________________

Follow DNAexplain on Facebook, here or follow me on Twitter, here.

Share the Love!

You’re always welcome to forward articles or links to friends and share on social media.

If you haven’t already subscribed (it’s free,) you can receive an email whenever I publish by clicking the “follow” button on the main blog page, here.

You Can Help Keep This Blog Free

I receive a small contribution when you click on some of the links to vendors in my articles. This does NOT increase the price you pay but helps me to keep the lights on and this informational blog free for everyone. Please click on the links in the articles or to the vendors below if you are purchasing products or DNA testing.

Thank you so much.

DNA Purchases and Free Uploads

Genealogy Products and Services

My Book

Genealogy Books

Genealogy Research

The Ancestors are SPEAKing: An 18-Year Y-DNA Study That Led Us Home – 52 Ancestors #381

In 2004, 18 years ago, I founded the Speak(e)(s) Family DNA Project at FamilyTreeDNA. I descend from Nicholas Speaks through his son, Charles Speaks.

Some two decades before, I had met my wonderful cousin, Dolores Ham, by snail mail. We were introduced by Mary Parkey (1927-2000), a genealogist in the Cumberland Gap region who seemed to know something, if not everything, about the early settler families.

Mary wasn’t my cousin through the Speaks line, but she knew who was researching each line, and put me in touch with Dolores.

I met other researchers and discovered that a Speaks Family Association (SFA) had been formed in 1979.

I had a young family at the time, so I joined, but never attended any of the annual meetings, known as conventions, until 2005. I did enjoy the newsletters, however. It was always a good day when a newsletter or a letter from a cousin was waiting in the mailbox.

The goal of the Association was to share research and to determine if, and how, the various Speak lines in America were related. The “rumor” was that the family was from England, but no one knew for sure. We didn’t even know who was actually “in” the family, or how many different families there might be.

In 2004, when I established the Speaks DNA Project in collaboration with the SFA, our goal was stated, in part, as follows:

This project was begun to determine the various Speak(e)(s) lines around the world. According to family legend, the original ancestor came to England with William the Conqueror and his last name then was L’Espec. It was later spelled Speke and then the derivatives of Speake, Speakes, and Speaks carried by descendants today.

We knew that there was a Speak family in St. Mary’s County, Maryland.

Did our ”Nicholas” line descend from Maryland, or not?

We knew there was a Thomas Speak (c1634-1681) who settled there by 1661 and had two sons, John the InnKeeper or InnHolder (1665-1731) and Bowling (c1674-1755), named after his mother’s birth surname.

Fast forwarding two or three generations, our Nicholas Speak or Speaks was born about 1782 and was first found in Washington County, Virginia in 1804 when he married Sarah Faires. That’s a long way from Maryland. Who was Nicholas? Who were his parents? How did Nicholas get to Washington County, Virginia? There aren’t any other Speaks men, or women, in Washington County. Was he dropped fully grown by the stork?

In 2005, I attended my first Speaks Family Association Convention, held in Grand Rapids, Michigan, and met my lovely cousins who I’m quite close to. I gave an introductory talk about Y-DNA, and several Speaks males volunteered to test, including a descendant of Nicholas.

I was ecstatic, but within a year, we had a, well, “problem.”

In 2006, the Convention was held in Alabama, in the heat of summer. Not only did we have technology issues and lose power during the presentation, part of me hoped it wouldn’t come back on.

At that point, we had 8 Y-DNA testers.

At first, everything was fine. Two testers each from Thomas the immigrant through sons John and Bowling.

  • Thomas, Bowling and then two different sons. They matched.
  • Thomas, John, and his son Richard. They matched too.
  • All four men above, match each other.

Everything’s good, right?

Not so fast…

Then, a father/son pair tested who were also supposed to descend from the Thomas, Bowling, and Thomas line. Thankfully, they matched each other, but they did NOT match the other descendants of Thomas the immigrant.

Because we had multiple men through both of Thomas the immigrant’s sons, we had confirmed the Y-DNA STR marker signature of Thomas – which means that the father/son pair had experienced a genetic disconnect, or, they were actually descended from a different Speak line.

That wasn’t all though. Two more men tested who believed they descended from Thomas the immigrant through John and then Richard. They didn’t match each other, nor any of the other men either.

This was a difficult, painful situation, and not what was anticipated. Of course, I reviewed the results privately with the men involved before presenting them at the convention, and only did so with their permission.

In an effort to identify their genealogical lines, we discovered seven other mentions of early colonial Speak immigrants, including one named Thomas.

Over time, we would discover additional Y-DNA genetic Speak lines.

Bonus Cousin

Y-DNA also revealed an amazing new cousin, Henry, who didn’t know who his father was, but thanks to DNA, discovered he is a genetic Speaks AND identified his father.

Unfortunately, his father had recently passed away, but Henry contacted his uncle and was welcomed into his immediate family, as well as our broader Speaks family. Talk about life-changing! I will never, ever forget Henry’s emotional journey, or the small role I was privileged to play. For a long time, I couldn’t even tell his story without tearing up.

I met Henry in person for the first time at the convention last week. Lots of hugs all around!

In 2006, our Y-DNA haplogroup was known only as I1b1. We knew it was fairly rare and found in the rough Dinaric Alps border region between Bosnia and Croatia.

By User:Doron – Own work, CC BY-SA 3.0, https://commons.wikimedia.org/w/index.php?curid=1551217

We weren’t wrong. We were just early. Our ancestors didn’t stop in the Alps.

Today, the migration path into Europe-proper looks like this.

In 2009, the convention was held in the Speaks Chapel United Methodist Church founded by the Reverend Nicholas Speaks, in Lee County, Virginia.

My dear cousin, Lola Margaret Speak Hall descends from Nicholas through two of his children and visited us as Nicholas’s wife, Sarah Faires, describing their lives together.

I can’t even begin to describe how moving it was to hear “Sarah” read from her Bible and recall her life with Nicholas and each of their children, especially those she buried across the road in the cemetery.

The cemetery was visible through the door as Sarah was speaking, describing Nicholas preaching their children’s funerals, and the sound of the clods of dirt hitting their coffins.

That reunion in Nicholas’s church was memorable for another reason, too. I was baptized, surrounded by my family, in my ancestor’s church.

Progress

More Speaks men were taking Y-DNA tests, but we still had no idea where the Speaks line originated overseas.

The Association had been working with John Speake in Cambridge, England, above, who had been assisting the American Speak family by obtaining British records. We had hoped that we would match his Y-DNA, because that would mean that we shared a common ancestor, probably from Priestweston, Shropshire in the 1500s. Plus, we really liked John and wanted to be related.

Sadly, that wasn’t the case, so we knew one English family we did NOT descend from, but we still didn’t know where our family line was from. We are, however, eternally grateful to John for his amazing research and the critical role he would play.

The Holy Grail

The Holy Grail of Y-DNA testing is often a match with a man either from the “old country,” wherever that is, or someone who unquestionably knows where their ancestor is from. Through a match with them, it allows other testers to jump the pond too.

In early 2010, John Speake in Cambridge reached out to me and said that he had found an anonymous man in New Zealand who was agreeable to taking a DNA test.

By this time, I wasn’t terribly hopeful, but John sweetened those waters by telling me that this man’s family had only been in New Zealand for two generations – and he knew where his ancestors “back home” were from.

I ordered a test for our anonymous tester.

I had nearly forgotten about this man a few weeks later when I suddenly received what seemed like a slot machine jackpot clanging when an entire series of emails arrived, one for each of our Y-DNA testers, saying they had a new match. Yep, our anonymous NZ tester.

Suddenly, I cared a whole lot about his genealogy.

Where was his paternal ancestral line from?

Gisburn.

Gisburn? Where the heck was Gisburn?

Gisburn

Gisburn is a tiny village in Lancashire, England.

This antiquarian map shows “Gisborn” located along the Ribble River. Gisburn is ancient, located on the old Roman road, appears in the Domesday Book of 1086 as Ghiseburne, and is believed to have been established in the 9th century.

This was beginning to get serious. This is no longer speculation or unsourced oral history, but actual evidence.

Another cousin, Susan Speake Sills, a DAR Chapter Regent, started digging immediately. Nothing motivates genealogists like the imminent hope of breaking down a brick wall.

Susan and I shot emails back and forth, night and day, for three or four days, and confirmed that our New Zealand cousin’s ancestor, James Speak, had been born in Gisburn between 1735-1749.

We knew, or though we knew, that Thomas Speake, the immigrant, was Catholic. Maryland was a safe haven for Catholics hoping to escape persecution in England.

Thomas was rumored to have been born to a John, but we had no idea where that rumor arose.

Was our Thomas born in Gisburn too?

Susan discovered that St. Mary’s Church in Gisburn held 50 marked Speaks burials.

In 1602/03, William in Gisburn had a son named John.

We found men named Richard, Stephen, John, William, Thomas and more.

And, there were many unmarked graves and unreadable stones.

Susan was just getting started.

Next, Susan discovered that the records of St. Mary’s and All Saints Church in Whalley held pages and pages of Speak family records.

The earliest Speak burial there was in 1540.

During this timeframe, people did not have the right to come and go freely. They were vassals, tied to the land.

Whalley is 11 miles from Gisburn.

Susan and I were fairly quiet as we worked, because we did NOT want to start any unfounded rumors by speaking too soon in the heat of our excitement. We were desperately trying to connect elusive dots.

In 2011, the Convention was held near Thomas and Bowlng Speak’s land in St. Mary’s County, Maryland, our ancestral homeland in America.

Thomas the immigrant settled in Port Tobacco sometime before 1661 and would have attended St. Ignatius Church at St. Thomas Manor where he was probably buried after his death in 1681, in what is now an unmarked grave.

I wonder if Thomas stood in the churchyard, perhaps during funerals, and gazed out over the Port Tobacco River which of course empties into the Chesapeake Bay, and wondered about the family members he had left behind, across the expansive ocean.

Thomas willed his land to his eldest son, John, who was an InnKeeper in Port Tobacco.

His younger son, Bowling Speak had to secure land on his own. He obtained land generally known as Zachia Manor.

This portion of the grant was specifically called “The Mistake,” although we have no idea why, which is owned in part today by St. Peter’s Catholic Church.

The land where the church actually stands was not owned by Bowling, just the attached land beginning about where the bus is parked and extending into the woods beside Jordan’s Run.

The old St. Peter’s cemetery, where the original church stood, is located nearby, just outside the boundary of Bowling and his son, Thomas of Zachia’s land.

It’s likely that our ancestors, Bowling and his son, Thomas, who died in 1755, within days of each other, and their wives, are buried here.

We gathered on Bowling’s land called Speaks Enlargement, adjacent The Mistake. It felt like Nirvana to have located his land and obtained permission to visit both parcels.

Me, Susan Speake Sills, Lola-Margaret Speak Hall and Joyce Candland, a descendant of John the InnKeeper, standing on Bowling’s land. We laughed so much that day as we explored Bowling and Thomas’s land, cherishing our time together.

Lola-Margaret’s heart-felt kiss of gratitude for this discovery says it all – for all of us. The only difference is that she actually had the hutzpah to do this!

Cousins on the prowl. What would we discover?

Susan found old, unmarked graves in the woods.

Lola-Margaret and I found rocks that had once been owned by Thomas and Bowling.

In 2011, my Convention presentation contained a surprise – the information about our Gisburn match, and what we had found. Church records, and graves.

I showed this cemetery map from St. Mary’s in Gisburn, where our New Zealand cousin’s family was buried.

It felt like we were so excruciatingly close, but still so far away.

We knew unquestionably that we were in the neighborhood, but where was our Thomas born?

Who was his family?

I closed with this photo of St. Mary’s in Gisburn and famously said, “I don’t know about you, but I want to stand there.”

It was a throw-away comment, or so I thought, but as it turned out, it wasn’t.

2013 – The Trip Home

Gisburn

Cousins Susan and Mary Speaks Hentschel left no stone unturned. Two years later, our Convention was held in Lancashire, and indeed, I got to stand there.

So did our Speak cousin from New Zealand whose Y-DNA test bulldozed this brick wall for us.

We were then, and remain, incredibly grateful for this amazing opportunity.

Of course, I couldn’t resist the St. Mary’s cemetery, nor the cemeteries at the other churches we would visit. It must be something about being a genealogist. There are still Speak family members being buried here.

There are many ancient and unmarked graves as well.

With abundant rainfall, cemeteries overgrow quickly.

It’s common for stones to be moved to the side, or even built into a wall, in order to facilitate maintenance of the grounds.

St. Mary’s church itself was built as a defensive structure sometime before 1135 with these arrowslits for archers in many locations, including the tower.

The Stirk House

During our visit, we stayed at the beautiful Stirk House in the Ribble Valley, a 17th century manor house and the only local lodging available for a group.

We discovered after we checked in that the Speak family had owned this property in the 1930s and had converted it into a hotel. How lucky could we be? Talk about synchronicity!

The Stirk House was originally built in 1635 using stone from the dismantled Sawley Abbey during Henry VIII’s reign and the resulting dissolution of the monasteries. Our Catholic ancestors would have witnessed this devastation, and probably grieved the destruction deeply.

For some reason, I was incredibly moved as we passed the remains of Sawley Abbey during our visit, and grabbed a shot through the rain-speckled window. At this point, I had no inkling of the historical connection that would emerge.

Whalley Abbey

Whalley Abbey, above, was destroyed as well in the Protestant attempt to eradicate Catholicism. Instead, they succeeded in driving it underground.

As our ancestors’ lives revolved around churches and religion, so did our visit as we retraced their steps through time.

While the stones of Sawley Abbey were repurposed to build local structures after its destruction, the Whalley Abbey and cloister walls, above, still stand, albeit in ruins.

The Abbey, formed in 1178, is shown in ruins here in this 1787 drawing. The village of Whalley is visible in the background, at right, with the church tower evident.

The Abbey spring, believed by some to be sacred, is fenced for protection today.

This trip was truly the opportunity of a lifetime and we tried to take advantage of every minute, absorbing everything our ancestors would have experienced, walking in their footsteps.

I didn’t fully grasp at that time that we weren’t hunting for “the” location or locations where our ancestors trod, but that they trod everyplace here. Wherever we walked, it was in their footsteps.

St. Mary’s Church in Whalley

Our next stop was St. Mary’s Church in Whalley, not far from the Abbey, where Henry Speke was granted a lease in 1540.

This church is ancient, build in the 1200s, replacing an earlier church, and stunningly beautiful.

Our trip group photo was taken inside St. Mary’s.

As we sat in the choir, our guide explained the history of the church, which is our history too.

The little green men carved into the wooden choir seats are a wink and a nod to an earlier pagan era. Our ancestors would have known that era too.

We sat in the pews where earlier generations of Speaks families sat. The boxed, enclosed pews were for the wealthy manor owners. Our family wouldn’t have been sitting there.

The original St. Mary’s church, shown in this painting, looked different than today. The church in the painting would have felt quite familiar to the early Speak families who sat in the pews here each Sunday.

In addition to the churches in Gisburn and Whalley, we visited St. Leonard’s Church in Downham which is a chapelry of the church in Whalley.

Downham

The tower is original to the 1400s, but the rest of the church was rebuilt in 1909-10. Lord Clitheroe graciously brought a drawing of the old church as it looked when the Speak family attended.

This church, in the shadow of Pendle Hill, proved to be quite important to the family.

Pendle Hill from the cemetery outside St. Leonard’s church, where Thomas was baptized.

Pendle Hill can be seen across the roofs of the village houses.

Downham, on the north side of Pendle Hill was small then, and remains a crossroad village today with a population of about 150 people, including Twiston.

Twiston is located less than 3 miles away, yet it’s extremely remote, at the foot or perhaps on the side of Pendle Hill.

What’s left of the stocks at Downham, beside the church cemetery, just waiting for those who needed to be punished, like those reviled Catholics hiding out in the wilds over by Pendle Hill.

During our visit, Lord Clitheroe provided us with a transcription of the Downham church records wherein one Thomas Speak was baptized on January 1, 1633/34, born to Joannis, the Latin form of John, in nearby Twiston.

Is this Thomas our Thomas the immigrant who was born about that same time? We still don’t know, but there are clues.

The problem is that there is a marriage record for a Thomas Speak to Grace Shakelford in 1656, and a burial record in 1666 for Grace recorded as “the wife of Thomas Speak of Twiston.” But there is no burial record for Thomas, and no children recorded either during that time, which is very strange.

So, is that our Thomas, or a different Thomas? Those records don’t align well. It’s certainly a Thomas of the right age, in the right place, and born to a John as well.

However, our Thomas was in Maryland by at least 1661 and probably earlier. Would he have left a wife behind? Would she still have been noted as his wife and him recorded as “of Twiston” if he was in America?

Records in this area are incomplete. A substantial battle was fought in Whalley in 1643. Churches were often used for quartering soldiers. Minister’s notes could well have been displaced, or books destroyed entirely.

In Downham, the years of 1608-1619 are missing, along with 1638-1657, inclusive which would hold records vital to our family for nearly two critical decades.

We know, according to probate records, that the Downham families originated in Whalley based on research by John D. Speake, of Cambridge, contained in the recently published book, The Speak/e/s Family of Southern Maryland

Probate files show that in 1615, “John Speake of Twiston, husbandman” mentions his son William and William’s children, including John who was the administrator of his will. For John to be an administrator, he had to be age 21 or over, so born in 1594 or earlier. Some John Speak married Elizabeth Biesley at Whalley in 1622 and is believed to be the John Speak Sr. recorded in Downham Parish Registers.

However, John seemed to be the Speak given name of choice.

The existing Hearth Tax returns for 1666-1671 that recorded, and taxed, the number of hearths observed in each home during an inspection shows the following Speak households, none of which were too impoverished to have a hearth:

  • 3 in Twiston
  • 2 in Gisburn (Remington)
  • 1 in Stansfield, near Halifax

Of the above entries, 5 were named John, and one was Ann.

There were two additional Speak families in Newchurch, near Pendle, which is more distant, as is Stansfield, maybe a total of 30 miles end-to-end.

There were no Thomas Speaks listed.

One final hint may be that there are three tailors mentioned in the Gisburn church registers over time, one of whom was Thomas, a tailor, who died in 1662. Did our Thomas the immigrant come from a long line of tailors? If so, how could he have supported himself as a tailor in the remote Lancashire countryside? Is that, perhaps, part of why he immigrated, in addition to being Catholic?

Or, maybe our Thomas apprenticed as a tailor in Maryland as an indentured servant and tailors in Gisburn are simply a red herring.

The Whalley, Gisburn and Twiston families are closely connected. The difference may well be that our Thomas’s line remained secretly Catholic, so preferred the “uninhabited” areas of the remote Twiston countryside. Even today, Gisburn is described as being “rural, surrounded by hilly and relatively unpopulated areas.” And that’s Gisburn, with more than 500 residents. Downham is much smaller, about 20% of the size of Gisburn.

What do we know about Twiston?

Twiston

Twiston is too small to even be called a hamlet. These ghostly buildings are what’s left of the former Twiston Mill, built after an earlier mill burned in 1882. The original farm and corn mill was owned originally by Whalley Abbey at least since the 1300s. Twiston is near an old lime kiln, probably in use since Roman times, and the Witches Quarry, a steep, vertical rocky outcrop popular with hikers and rock climbers.

The ancient homesteads were clustered along the bubbling Twiston Brook, a branch of Pendle Brook that originates on Pendle Hill, watering the farm and powering the original corn mill. It was actually a smart place to settle, because the stream was fresh, given that there were no upstream homesteads to pollute the water.

These buildings stood, huddled together, probably for safety, in a field carved out of the wilderness, surrounded today by hundreds of sheep grazing on the hillsides and high moors.

Stone walls divide pastures and line the steep hillsides, with gates allowing shepherds and now, farmers to pass through. Eventually, the sheep venture high enough to graze and shelter on the moorland.

At the higher levels of Pendle Hill, the forest gives way to moors and the sheep roam freely.

The sheep also have the right-of-way, so vehicles travel slowly. The heathered moor is quite stark and incredibly beautiful.

The fields along the Ribble River with its feeder brooks and settlements, running through the valley beneath Pendle Hill are lush, green, and timeless. The land surrounding the River is relatively flat, beckoning settlers and encouraging farming.

This is one of those places where the ancient voices call out and pluck the strings of your heart.

And your heart answers in recognition.

Where you know the earth holds the DNA of your ancestors, and their blood watered the landscape in the Ribble Valley.

By Beacon Hill overlooking the Ribble valley by Bill Boaden, CC BY-SA 2.0, https://commons.wikimedia.org/w/index.php?curid=106624444

Beacon Hill overlooks the Ribble Valley, with Pendle Hill in the background.

Our ancestors lived, and loved here and because of that, we live now.

Their descendants are scattered across the world, on many continents, yet we reunited here in our homeland – like birds following their sacred compass, guiding them across the oceans home again.

When the Speak family lived here, it was considered a “wild and lawless region” by local authorities, probably due in part to its remoteness – and also the rebellious nature of the inhabitants. We have never submitted easily to pressure.

Twiston is nestled at the base of Pendle Hill.

If you were a Catholic, living in a hotbed of “recussants,” and trying to be invisible, Twiston would be a location where you might be able to successfully disappear among those of like mind.

The road to Twiston was too twisty, rock-lined and narrow for our bus to navigate, causing us to have to back up down a one lane road with rock walls on both sides for some distance.

These ancient moss and fern-covered walls have stood for centuries, some with gateway passages to neighboring houses in small hamlets.

Others stand sentry along the old cartways where they’ve been for centuries.

The stone walls keep sheep and cattle in, and today, wayward vehicles out.

The walls have been tended and repaired by generations of stewards. Generations of our Speaks men probably placed some of these very stones, having removed them from their fields.

The footpaths, now roads, pass within inches of old stone homes and barns, dissecting farms in many places. That’s exactly how the old cart road traveled, and how you got to your neighbor’s farm. In fact, that old road took you right to their door.

Pendle Hill always serves as your guidepost.

If you’re lost and don’t know which way to turn, just find the hill and reorient yourself.

Its stark beauty is ever-present. Pendle Hill always looms someplace in the distance.

Since the bus couldn’t get to Twiston, a few adventurous cousins somehow found a taxi to rent and a brave driver willing to take them to Twiston, after he finally figured out where Twiston actually was.

I’m still REALLY mad at myself because I took a hike in the forest instead, although I enjoyed connecting with the land.

It had been a very long day and I didn’t really realize the significance of Twiston at that time. Plus, space in the taxi was limited and I suffer from motion sickness. I should have taken Dramamine, sat on the roof, and gone anyway.

The road to Twiston, now called a lane, grows increasingly narrow. Who knew there was such a remote region in the hill country of Lancashire?

Finally, Twiston appears where the forest ends and the road widens a tiny bit.

If only these ancient buildings and rock walls could speak, share their stories and reveal their secrets. Old documents, however, do provide some insight.

This document, originally penned in Latin, was provided by the Lancashire archives.

John Speak, in 1609, was a farmer, with a house (messauge), garden, orchard, 10 acres of farmland, 5 of meadow, and 10 acres of pasture.

Even orchards were walled to prevent unwanted visitors.

Indeed, Twiston is where John Speak lived. If the Thomas born in Twiston to Joannis, Latin for John, in 1633 and baptized on January 1, 1634 in old St. Leonard’s Church in Downham is our Thomas, this is his birth location.

For our family, this is, indeed, hallowed ground.

Catholics weren’t the only people sheltering in the shadow of Pendle Hill.

The accused Pendle Witches, probably women who were traditional healers, lived here too, persecuted and executed in 1612, as did Quakers, all vilified along with Catholics.

No wonder Thomas, along with the Catholic Bowling family, found a way to make his way to the safety of Maryland.

It’s ironic that in 1670, after being persecuted themselves for their Catholic beliefs, in this same valley, the Speake men were reporting Quakers.

Records of Speak men in Twiston persist into the 1800s, and one of our local testers descends from Henry Speake, born about 1650 in Twiston.

Local Testers

Prior to our visit, we published small ads in local newspapers and contacted historical societies. We found several Speak(e)(s) families and invited them to dinner at the Stirk House where the after-dinner speaker explained all about DNA testing. You probably can’t see them clearly, but there are numerous DNA kits laying on the table, just waiting for people to have a swab party.

Our guests brought their family information and photos and we had an absolutely lovely evening.

One of those families traced their line to Twiston. Be still my heart.

Five men from separate Speak families tested. None of them knew of any connection between their families, and all presumed they were not related.

I carried those men’s DNA tests back in my hand luggage like the gold that they were.

They were wrong. All five men matched each other, AND our Thomas Speake line. Susan and I got busy connecting the dots genealogically, as much as possible

  • Two of our men descended from Henry born in 1650, married Alice Hill and lived in Downham/Twiston.
  • Two of our men descended from John Speak born about 1540, married Elina Singleton, and lived in Whalley.
  • Two of our men, including our New Zealand tester, descend from John born sometime around 1700, probably in Gisburn where his son, James, was born about 1745.

We knew indeed that we had found our way “home.”

2022

Today, the Speaks family DNA Project has 146 members comprised of:

  • 105 autosomal testers
  • 31 Speak Y-DNA testers
  • 24 of whom are Thomas the immigrant descendants
  • 8 Big Y tests

Over the years, we’ve added another goal. We need to determine how a man named Aaron Lucky Speaks is related to the rest of us. Autosomal DNA confirms that he is related, but we need more information.

Aaron Lucky is first found in 1787 purchasing land and on the 1790 Iredell County, NC census. We finally located a Y-DNA tester and confirmed that his paternal line is indeed the Lancashire Speaks line, but how?

After discovering that all 5 Lancashire Speaks men descend from the same family as Thomas the immigrant, we have spent a great deal of time trying to both sort them out, and tie the family lines together, with very limited success.

Can Y-DNA do that for us?

The Y-DNA Block Tree

When men take a Big Y-700 DNA test, they receive the most detailed information possible, including all available STR markers plus the most refined haplogroup possible, placing them as a leaf on the very tip of their branch of the tree of mankind. The only other men there are their closest relatives, divided sometimes by a single mutation. Eight Speaks men have taken or upgraded to the Big Y test, providing information via matching that we desperately needed.

This Big Y block tree is from the perspective of a descendant of Nicholas Speaks and shows the various mutations that define branches, shown as building blocks. Each person shown on the Block Tree is a match to the tester.

Think of haplogroups as umbrellas. Each umbrella shelters and includes everything beneath it.

At the top of this block tree, we have one solid blue block that forms an umbrella over all three branches beneath it. The top mutation name is I-BY14004, which is the haplogroup name associated with that block.

We have determined that all of the Speak men descended from the Lancashire line are members of haplogroup I-BY14004 and therefore, fall under that umbrella. The other haplogroup names in the same block mean that as other men test, a new branch may split off beneath the branch.

Next, let’s look at the blue block at far left.

The Lancashire men, meaning those who live there, plus our New Zealand tester, also carry additional mutations that define haplogroup I-BY14009, which means that our Thomas the Immigrant line split off from theirs before that mutation was formed.

Thomas the immigrant’s line has the mutation defining haplogroup I-FTA21638, forming an umbrella over both of Thomas the immigrant’s sons – meaning descendants of both sons carry this mutation.

Bowling’s line is defined by haplogroup I-BY215064, but John’s line does not carry this mutation, so John’s descendants are NOT members of this haplogroup, which turns out to be quite important.

We are very fortunate that one of Thomas’s sons, Bowling, received a mutation, because it allows us to differentiate between Bowling and his brother, John’s, descendants easily if testers take the Big Y test.

Aaron Luckey Speak

As you can see, the descendants of Aaron Lucky Speak, bracketed in blue above, carry the Bowling line mutation, so Aaron Luckey descends from one of Bowling’s sons. That makes sense, especially since Charles, the father of Nicholas, my ancestor born in 1782, is also found in Iredell County during the same timeframe.

Here’s a different view of the Big Y testers along with STR Y-DNA testers in a spreadsheet that I maintain.

Thomas the immigrant (tan band top row) is shown with son, Bowling who carries haplogroup BY215064.

Thomas’s son John, the InnKeeper, shown in the blue bar does NOT have the BY215064 mutation that defines Bowling’s group.

However, the bright green Aaron Lucky line, disconnected at far right, does have the mutation BY215064, so this places Aaron Luckey someplace beneath, meaning a descendant of, Bowling. We just don’t know where yet.

Sometimes we can utilize STR marker mutations for subgrouping within haplogroups, but in this case, we cannot because STR mutations in this family have:

  • Occurred independently in different lines
  • Back mutated

Between both of these issues, STR mutations are inconsistent and entirely unreliable.

In some cases, autosomal DNA is useful, but in this case, autosomal doesn’t get us any closer than Y-DNA due to record loss and incomplete genealogy above Nicholas. An analysis shows that Aaron Luckey Speak’s descendants match each other closer than they match either John or Bowling’s descendants.

We have a large gap in known descendants beneath Thomas of Zachia, other than Nicholas’s line.

Combining genetic and genealogy information, we know that both Charles Beckworth Speak and Thomas Bowling Speak, in yellow, are found in Iredell County. The children of Thomas of Zachia, shown in purple, are born in the 1730s and any one of them could potentially be the father of Aaron Luckey.

The men in green, including William, Bowling’s other son, are also candidates to be Aaron Luckey’s ancestor, although the two yellow men are more likely due to geographic proximity. They are both found in Iredell County.

We don’t know anything about William’s children, if any, nor much about Edward. John settled in Kentucky. Nicholas (green) stayed in Maryland.

There may be an additional generation between Charles Beckworth Speak (yellow) and Nicholas (born 1782), also named Charles. There’s a lot of uncertainty in this part of the tree.

Aaron Luckey’s descendants may be able to search their matches for a Luckey family, found in both Iredell County AND Maryland, which may assist with further identification.

It seems that Aaron’s middle name of Lucky is likely to be very significant.

Connecting the Genetic Dots in England

What can we discern about the Speak family in the US and in Lancashire?

Reaching back in time, before Thomas was born about 1633, what can we tell about the Speak family and how they are connected, and when?

The recently introduced Discover tool allows us to view the Y-DNA haplogroups and when they were born, meaning when the haplogroup-defining mutation occurred.

The Time Tree shows the haplogroups, in black above the profile dots. The scientifically calculated approximate dates of when those haplogroups were “born,” meaning when those mutations occurred, are found across the top.

I’ve added genealogical information, in red, at right.

  • Reading from the bottom red dot, Bowling’s haplogroup was born about the year 1660. Bowling was indeed born in 1674, so that’s VERY close
  • Moving back in time, Thomas’s haplogroup was born about 1617 and Thomas himself was born about 1634, but it certainly could have been earlier.
  • The Lancashire testers’ common haplogroup was born about 1636, and the earliest known ancestor of those men is Henry, born in Twiston in 1650.
  • The common Speak ancestor of BOTH the Lancashire line and the Thomas the immigrant line was born about 1334. The earliest record of any Speak was Henry Speke, of Whalley, born before 1520.

The lines of Thomas the Immigrant and the Lancashire men diverged sometime between about 1334, when the umbrella mutation for all Speaks lines was born, and about 1617 when we know the mutation defining the Thomas the Immigrant line formed and split off from the Lancashire line.

But that’s not all.

Surprise!

As I panned out and viewed the block tree more broadly, I noticed something.

This is quite small and difficult to read, so let me explain. At far left is the branch for our Speaks men. The common ancestor of that group was born about 1334 CE, meaning current era, as we’ve discussed.

Continuing up the tree, we see the next haplogroup umbrella occurs about 1009 CE, then the year 850 at the top is the next umbrella, encompassing everything beneath.

Looking to the right, the farthest right blocks date to 1109 CE, then 1318 CE, then progressing on down the tree branch to the bottom, I see one name in three blocks.

What is that name?

I’m squinting!!!

Here, let me enlarge this for you!

Standish.

The name is Standish, as in Myles Standish, the Pilgrim.

Miles is our relative, and even though he has a different surname, we share a common ancestor, probably before surnames were adopted. Our genetic branches divided about the year 1000.

The Discover tool also provides Notable Connections for each haplogroup, so I entered one of the Speaks haplogroups, and sure enough, the closest Speak Notable Connection is Myles Standish 1584-1656.

And look, there’s the Standish Pew in Chorley, another church that we visited during our Lancashire trip because family members of Thomas Speake’s wife, Elizabeth Bowling, are found in the church records here.

Our common ancestor with the Standish line lived in about the year 850. Our line split off, as did theirs about the year 1000, or about 1000 years, or 30-40 generations ago.

Our family names are still found in the Chorley Church records

Ancient Connections

The Discover tool also provides Ancient Connections from archaeological digs, by haplogroup.

Sure enough, there’s an ancient sample on the Time Tree named Heslerton 20641.

Checking the Discover Ancient Connections, the man named Heslerton 20641 is found in West Heslerton, Yorkshire and lived about the year 450-650, based on carbon dating.

The mutation identifying the common ancestor between the Speak men and Heslerton occurred about 2450 BCE, or 4500 years ago. Those two locations are only 83 miles apart.

Where Are We?

What have we learned from the information discovered through genealogy combined with Big Y testing?

  • We found a Speek in Whalley in 1385.
  • Thomas Speake was baptized in Downham and born in Twiston in 1733.
  • Our New Zealand tester’s ancestor was found in Gisburn about 1745.
  • All of these locations are within 15 miles of each other.

  • Chorley, where the Standish family is found in the 1500s is located 17 miles South of Whalley. Thomas Speak’s wife, Elizabeth Bowlings’ family is found in the Chorley church records.

What about the L’Espec origin myth?

  • The Speak family clearly did not arrive in 1066 with the Normans.
  • We have no Scandinavian DNA matches.
  • No place is the surname spelled L’Espec in any Lancashire regional records.
  • The Speak family is in Whalley/Chorley area by 1000 when the Speak/Standish lines diverged
  • The common ancestor with the Standish family occurred about the year 850, although that could have occurred elsewhere. Clearly, their common ancestor was in the Chorley/Whalley area by 1000 when their lines diverged.

The cemetery at Whalley includes Anglo-Saxon burials, circa 800-900.

The Speak men, with no surname back then, greeted William the Conqueror.

And lived to tell the tale, along with their Standish cousins, of course.

Are our ancestors buried in these early Anglo-Saxon graves? I’d wager that the answer is yes. We are likely related to every family who lived in this region over many millennia. Little is known of Lancashire during this time, but we do know more generally that the Anglo-Saxons, a Germanic people, arrived in the 5th century and integrated, eventually, with the Native Britons, the Celts. These carvings certainly do have a Celtic feel.

This family photo, standing in the church in Whalley where it all began, is now imbued with a much deeper significance.

Little did we know.

And this, all of this, was a result of Big-Y DNA tests. We could not have accomplished any of this without Y-DNA testing.

Our ancestors are indeed speaking across the ages.

We really have found the road home, the path revealed by the DNA of our ancestors.

_____________________________________________________________

Follow DNAexplain on Facebook, here or follow me on Twitter, here.

Share the Love!

You’re always welcome to forward articles or links to friends and share on social media.

If you haven’t already subscribed (it’s free,) you can receive an email whenever I publish by clicking the “follow” button on the main blog page, here.

You Can Help Keep This Blog Free

I receive a small contribution when you click on some of the links to vendors in my articles. This does NOT increase the price you pay but helps me to keep the lights on and this informational blog free for everyone. Please click on the links in the articles or to the vendors below if you are purchasing products or DNA testing.

Thank you so much.

DNA Purchases and Free Uploads

Genealogy Products and Services

My Book

Genealogy Books

Genealogy Research

FamilyTreeDNA to Surpass 60,000 Y DNA Haplogroups and Introduces New Time Tree

The public Y DNA tree at FamilyTreeDNA is on the brink of crossing the 60,000 branch threshold.

When do you think it will sprout enough leaves to get there? I’m betting on tomorrow, or maybe the next day?

You can check here to see when it happens!

Discover Tool Grows Too

The new Discover tool launched almost exactly three months ago, and people are purchasing or upgrading to the Big Y test to learn about their matches and discover their place in the history of mankind. Of course, every test boosts genealogy and helps the tree of mankind grow. You can read about how to use the Discover tool, here.

The Discover Tool continues to add features for Y DNA testers too.

Introducing the Time Tree

A couple of weeks ago, FamilyTreeDNA introduced the time tree.

The time tree shows your haplogroup age and placement on the tree, plus age estimates for nearby haplogroups too. You can click up and down the tree by haplogroup.

My Estes haplogroups are shown above with incredible accuracy based on my proven genealogy. I’m still amazed that science, alone, without the benefit of genealogy, can get within half a century many times.

Looking at another example, you can see that haplogroup Q-FTC17883 has two testers and a notable connection, Kevin Segura.

The genetically calculated age estimate of this branch is about 1950.

Using the back arrow to click back one haplogroup shows the current testers, the Lovelock4 ancient sample, and additional haplogroups.

Note that while the Lovelock sample is shown to be the same haplogroup as today’s testers, recovery of ancient DNA is not always complete. In other words, that sample might have SNPs that the contemporary testers don’t have, or the sample may be incomplete, or no-calls may not be reported. Sample ages may not be included either, so FamilyTreeDNA has to work with what’s available.

What I’m saying is that Lovelock 4 is “at least,” reliably, haplogroup Q-FTC17883 and shares that SNP with present-day testers.

But Wait, There’s More

This past week, FamilyTreeDNA made another big update.

Included are the ancient samples published in the recent paper about the Southern Arc, the bridge between western Asia and Europe and samples from western Europe and England that help tell the story of Anglo-Saxon migration.

These ancient peoples helped form the gene pool in Europe, then pushed on into the British Isles.

Additionally, this past week’s updates include:

  • 345 new haplogroup reports (Haplotree changes up until September 23rd)
  • In total, almost 2,600 ancient DNA samples, including all the samples from the Southern Arc and Anglo-Saxon migration papers, two large new studies with a total of 590 samples!
  • In total, over 4,300 academic modern DNA samples from different parts of the world, including 1,200 new from Sardinia
  • New flags added: Druze, Italy (Sardinia), Western Sahara (Sahrawi)

Fun

I’ve spent quite a bit of time trying to find my ancestral lines in appropriate surname and regional projects, upgrading cousins, and finding new people to test.

I enter their Y DNA haplogroup into Discover and share my new-found information with my cousins who agreed to test. Everyone loves Discover because it’s so relatable.

For example, you can enter haplogroup:

  • I-A1843 to view Wild Bill Hickok
  • Q-M3 for Shawnee Chief Blue Jacket
  • R-FT62777 to learn about Johnny Cash

By entering your own, or your ancestor’s Y DNA haplogroups, you can discover where they came from, which lines they share with notable people, and identify their ancient cousins. The more refined your haplogroup, the more relevant the information will be, which is why I recommend the Big Y test. My Estes line estimated haplogroup from STR testing is R-M269

There are 23 haplogroups between R-M269 and my ancestor, Moses Estes’s haplogroup, R-ZS3700 in 1711. R-M269 is interesting, but R-ZS3700 is VERY relevant.

Even if you can’t “jump the pond” with genealogy records, you certainly can with Y DNA and mitochondrial DNA testing.

Can you find the Y DNA haplogroups of your male ancestors? Check surname projects and your autosomal matches for cousins who may have or would be willing to Y DNA test. I wish I had just tested all those earlier cousins at the Big Y level, because several have gone on to meet their ancestors and I can’t upgrade their sample now.

Test yourself and your cousins to reveal information about your common ancestors, and have fun with your new discoveries!!

_____________________________________________________________

Follow DNAexplain on Facebook, here or follow me on Twitter, here.

Share the Love!

You’re always welcome to forward articles or links to friends and share on social media.

If you haven’t already subscribed (it’s free,) you can receive an email whenever I publish by clicking the “follow” button on the main blog page, here.

You Can Help Keep This Blog Free

I receive a small contribution when you click on some of the links to vendors in my articles. This does NOT increase the price you pay but helps me to keep the lights on and this informational blog free for everyone. Please click on the links in the articles or to the vendors below if you are purchasing products or DNA testing.

Thank you so much.

DNA Purchases and Free Uploads

Genealogy Products and Services

My Book

Genealogy Books

Genealogy Research

Connect Your DNA Test, and Others, to Your Tree

To optimize your DNA tests, each tester needs to take advantage of the features offered by each vendor.

In order to do that, we need to perform the following tasks.

  1. Upload or create a tree (except at 23andMe who does not support trees)
  2. Connect our own test to our own profile card on our tree
  3. Connect other tests we manage to their (or our) tree, depending on the vendor
  4. Connect matches who are known relatives to their profiles on our tree

Each vendor handles these situations differently, so we’ll look at each one of the vendors with step-by-step instructions for handling those situations. We all want to get the most out of the tests we’ve taken!

Plant a Tree

If you have not created or uploaded a tree at each one of the vendors (except 23andMe who does not support genealogy trees), please do so. However, 23andMe does provide for links to your tree elsewhere, so we will review that function.

I manage my “master tree” on my own computer, but I also maintain trees at both Ancestry and MyHeritage where I attach documents and research found at that vendor. I also update my ancestors at WikiTree to be sure other researchers benefit from new discoveries.

I have not uploaded my full tree from my computer anyplace because I have many private notes that are not appropriate for disclosure, not to mention speculative and unproven relationships. I created a pared-down tree at one time to upload to both Ancestry and MyHeritage, and build those trees out from there.

I’m often asked about replacing your tree at the various vendors with an updated tree. If you do that, be aware that you will lose your DNA connections and document links. I do NOT recommend that. I simply maintain multiple trees. I wrote about this in the article, “Genealogy Tree Replacement – Should I or Shouldn’t I?” If you are considering that option, PLEASE read that article first.

RootsMagic, Family Tree Maker, and Legacy Family Tree Software all provide a syncing option with various vendors and FamilySearch, although not every vendor allows access to each of those software companies. I probably should experiment with the syncing option, but given a family member’s terrible experience some years back, I’ve been unwilling to do that. My biggest fear is that I will corrupt the file and not notice it until it’s far too late to revert to a backup.

When you upload or create a tree, make sure deceased and living people are marked as such, and you’ve opted to share your tree. If you don’t, you accidentally have a private tree. Worse yet, you might not realize it. I wrote about that in Quick Tip: Trees, Death Dates and Unintentionally Private Ancestors.

Now, let’s take a look at each vendor.

23andMe

23andMe does not support traditional genealogy trees, but they do provide a location for you to link your tree at another vendor or source.

Under your name at the right side, you’ll see “View Your Profile” under the dropdown.

I’ve not been able to find a generic Ancestry tree link that will allow non-Ancestry subscribers to view my tree, but it’s easy to do at MyHeritage. Simply open your tree at  MyHeritage and just copy the link at the top. Don’t worry, people won’t see anyone living.

If you want to use “one world” types of trees, you can also link to other trees such as FamilySearch or WikiTree, but just remember that you don’t control that content.

You don’t need to connect yourself to your tree at 23andMe, because there is no genealogy tree. However, 23andMe constructs a “genetic tree” for you using your closest matches, based on how you match other people, and how they match each other.

You can view your tree under “Family and Friends,” then “Family Tree.”

I added my ancestors’ names so it’s easy to keep straight. You can do that by simply clicking on the colored circle representing the ancestor, starting with your parents.

If you know that one of your matching relatives is not in exactly the correct tree location, you can click on their circle, and then click on Edit to make modifications.

You may want to add a relative that you can identify but who isn’t connected on the tree that 23andMe constructed.

Looking on the far-right side of the tree, in the lower corner, you’ll see “Add a Relative.” Click there and follow the instructions.

Ancestry

At Ancestry, you need to link your test to “you” in a tree. Your test can only be linked to one person in one tree at a time. You can change this, but you will lose any ThruLines you currently have. They will be regenerated based on the new tree you connect your test to, but based on the tree and other factors, they may not be the same. My recommendation is if you’re going to disconnect yourself and reconnect yourself elsewhere, record everything first.

Alternatively, you can take a second DNA test and simply link that second test to another tree. IMHO, that’s a better alternative. You can leave one in place as your research tree and use the second test to experiment with.

To link your test to your tree, select the “DNA” tab. At far right, you’ll see “Settings.”

You need to tell Ancestry who you are in your tree. Click on “Settings,” then scroll to “Tree Link.”

You can also link other tests you directly manage to their placards in your tree as well.

These links allow Ancestry to form ThruLines using both DNA matches and common ancestors in trees for 7 generations.

On your DNA Match page, Ancestry will ask you if you recognize a match.

If you click on “Yes,” you’ll be asked which side the match is on.

Then you’ll be given a long list of possible relationships in most-likely to least-likely order. Literally, Erik is the last option offered.

Select and confirm.

I’m not positive exactly HOW this helps Ancestry help you, but I suspect it confirms and helps Ancestry perfect ThruLines, relationship predictions, and perhaps even “sides” of ethnicity.

I wrote about Optimizing Your Tree at Ancestry for More Hints and DNA ThruLines.

FamilyTreeDNA

At FamilyTreeDNA, every DNA test kit has its own kit number and associated tree, so you don’t need to tell FamilyTreeDNA who you are if you create a tree from scratch on their site.

FamilyTreeDNA offers a unique family matching feature that sorts your matches into maternal and paternal sides.

In order to take advantage of this, you will need a tree. You can upload a GEDCOM file, although the upload at FamilyTreeDNA does not seem to do well with very large files.

If you don’t have a GEDCOM file on your computer, you can download a tree from either Ancestry or MyHeritage and upload to FamilyTreeDNA.

I wrote about this in the article Download Your Ancestry Tree and Upload it Elsewhere for Added Benefit.

If you upload a tree, you’ll be asked to select the person in the tree that is “you,” meaning the person who tested their DNA.

You’ll want to link known matches to your tree to enable Family Matching, aka bucketing, so that FamilyTreeDNA can divide and assign your matches maternally and paternally.

If you are building your tree at FamilyTreeDNA from scratch, simply click to begin and complete the information on the placards to add your information, then your parents, building out from there. You’ll want to add the ancestral lines to connect with your closest matches on your match list.

Family matching, or bucketing, is enabled by linking known matches to their proper place on your tree. FamilyTreeDNA then evaluates each match, determining if they match a common segment with you and someone you’ve linked. If that match does share a segment with both of you, meaning they triangulate, then that person is assigned either maternally, paternally, or both. I wrote about Triangulation in Action at FamilyTreeDNA, here.

The best people to link are your parents and grandparents, of course, but that’s not always an option. You’ll want to link as many matches as you can.

To link people, either click on the Family Tree tab at the top of the page, or on the “Link on Family Tree” under Relationship Range for individual matches.

Simply click on “Link Matches,” then drag and drop your match to their placard.

Here’s an example of linking parents.

Once someone is linked, the green dot will appear signifying that they are linked, and which type of test. Green is a Family Finder autosomal test, blue means they’ve taken a Y DNA test, and pink is a mitochondrial DNA test.

If your parents aren’t available to test, link every upstream relative that you can identify. By this, I mean that your children and full siblings will match you on both sides, so aren’t helpful for parental-side assignment.

People who have DNA tests from both parents can expect around 80% of their matches to be assigned maternally, paternally, or both.

If you have relatives who have tested at other vendors, you can ask them to upload to FamilyTreeDNA for free matching.

MyHeritage

At MyHeritage, you will connect yourself and any relatives whose tests you manage to your tree.

Under “DNA,” select “Manage DNA kits.”

At the right, you’ll click on the three dots, also known as a hamburger menu (who knew.)

Select Assign (if this is a new test or a transfer) or Re-assign a kit.

Be sure to do this for every kit you manage. I made that mistake and wrote about how I discovered and fixed the problem, here. Kit assignment enables Theories of Family Relativity and other super-helpful features.

I wrote about several things you can do to optimize your chances of receiving Theories of Family Relativity, here.

You can upload DNA kits to MyHeritage from tests taken at other vendors, here.

Fish in All the Ponds

I have provided step-by-step download/upload instructors for all vendors, here. It’s important to fish in all available ponds by making sure you have DNA tests at all four vendors. Then, upload or create trees and complete this bit of housekeeping to increase your chances of catching fish!

_____________________________________________________________

Follow DNAexplain on Facebook, here or follow me on Twitter, here.

Share the Love!

You’re always welcome to forward articles or links to friends and share on social media.

If you haven’t already subscribed (it’s free,) you can receive an email whenever I publish by clicking the “follow” button on the main blog page, here.

You Can Help Keep This Blog Free

I receive a small contribution when you click on some of the links to vendors in my articles. This does NOT increase the price you pay but helps me to keep the lights on and this informational blog free for everyone. Please click on the links in the articles or to the vendors below if you are purchasing products or DNA testing.

Thank you so much.

DNA Purchases and Free Uploads

Genealogy Products and Services

My Book

Genealogy Books

Genealogy Research

DNA: In Search of…Full and Half-Siblings

This is the fifth article in our series of articles about searching for unknown close family members, specifically; parents, grandparents, or siblings. However, these same techniques can be applied by genealogists to identify ancestors further back in time as well.

Please note that if a family member has tested and you do NOT see their results, ask them to verify that they have chosen to allow matching and for other people to view them in their match list. That process varies at different vendors.

You can also ask if they can see you in their results.

All Parties Need to Test

Searching for unknown siblings isn’t exactly searching, because to find them, they, themselves, or their descendant(s) must have taken a DNA test at the same vendor where you tested or uploaded a DNA file.

You may know through any variety of methods that they exist, or might exist, but if they don’t take a DNA test, you can’t find them using DNA. This might sound obvious, but I see people commenting and not realizing that the other sibling(s) must test too – and they may not have.

My first questions when someone comments in this vein are:

  1. Whether or not they are positive their sibling actually tested, meaning actually sent the test in to the vendor, and it was received by the testing company. You’d be surprised how many tests are living in permanent residence on someone’s countertop until it gets pushed into the drawer and forgotten about.
  2. If the person has confirmed that their sibling has results posted. They may have returned their test, but the results aren’t ready yet or there was a problem.
  3. AND that both people have authorized matching and sharing of results. Don’t hesitate to reach out to your vendor’s customer care if you need help with this.

Sibling Scenarios

The most common sibling scenarios are when one of two things happens:

  • A known sibling tests, only to discover that they don’t match you in the full sibling range, or not at all, when you expected they would
  • You discover a surprise match in the full or half-sibling range

Let’s talk about these scenarios and how to determine:

  • If someone is a sibling
  • If they are a full or half-sibling
  • If a half-sibling, if they descend from your mother or father

As with everything else genetic, we’ll be gathering and analyzing different pieces of evidence along the way.

Full and Half-Siblings

Just to make sure we are all on the same page:

  • A full sibling is someone who shares both parents with you.
  • A half-sibling is someone who shares one parent with you, but not the other parent.
  • A step-sibling is someone who shares no biological parents with you. This situation occurs when your parent marries their parent, after you are both born, and their parent becomes your step-parent. You share neither of your biological parents with a step-sibling, so you share no DNA and will not show up on each other’s match lists.
  • A three-quarters sibling is someone with whom you share one parent, but two siblings are the other parent. For example, you share the same mother, but one brother fathered you, and your father’s brother fathered your sibling. Yes, this can get very messy and is almost impossible for a non-professional to sort through, if even then. (This is not a solicitation. I do not take private clients.) We will not be addressing this situation specifically.

Caution

With any search for unknown relatives, you have no way of knowing what you will find.

In one’s mind, there are happy reunions, but you may experience something entirely different. Humans are human. Their stories are not always happy or rosy. They may have made mistakes they regret. Or they may have no regrets about anything.

Your sibling may not know about you or the situation under which you, or they, were born. Some women were victims of assault and violence, which is both humiliating and embarrassing. I wrote about difficult situations, here.

Your sibling or close family member may not be receptive to either you, your message, or even your existence. Just be prepared, because the seeking journey may not be pain-free for you or others, and may not culminate with or include happy reunions.

On the other hand, it may.

Please step back and ponder a bit about the journey you are about to undertake and the possible people that may be affected, and how. This box, once opened, cannot be closed again. Be sure you are prepared.

On the other hand, sometimes that box lid pops off, and the information simply falls in your lap one day when you open your match list, and you find yourself sitting there, in shock, staring at a match, trying to figure out what it all means.

Congratulations, You Have a Sibling!

This might not be exactly what runs through your mind when you see that you have a very close match that you weren’t expecting.

The first two things I recommend when making this sort of discovery, after a few deep breaths, a walk, and a cup of tea, are:

  • Viewing what the vendor says
  • Using the DNAPainter Shared cM Relationship Chart

Let’s start with DNAPainter.

DNAPainter

DNAPainter provides a relationship chart, here, based on the values from the Shared cM Project.

You can either enter a cM amount or a percentage of shared DNA. I prefer the cM amount, but it doesn’t really matter.

I’ll enter 2241 cM from a known half-sibling match. To enter a percent, click on the green “enter %.”

As you can see, statistically speaking, this person is slightly more likely to be a half-sibling than they are to be a full sibling. In reality, they could be either.

Looking at the chart below, DNAPainter highlights the possible relationships from the perspective of “Self.”

The average of all the self-reported relationships is shown, on top, so 2613 for a full sibling. The range is shown below, so 1613-3488 for a full sibling.

In this case, there are several possibilities for two people who share 2241 cM of DNA.

I happen to know that these two people are half-siblings, but if I didn’t, it would be impossible to tell from this information alone.

The cM range for full siblings is 1613-3488, and the cM range for half-siblings is 1160-2436.

  • The lower part of the matching range, from 1160-1613 cM is only found in half-siblings.
  • The portion of the range from 1613-2436 cM can be either half or full siblings.
  • The upper part of the range, from 2436-3488 cM is only found in full siblings.

If your results fall into the center portion of the range, you’re going to need to utilize other tools. Fortunately, we have several.

If you’ve discovered something unexpected, you’ll want to verify using these tools, regardless. Use every tool available. Ranges are not foolproof, and the upper and lower 10% of the responses were removed as outliers. You can read more about the shared cM Project, here and here.

Furthermore, people may be reporting some half-sibling relationships as full sibling relationships, because they don’t expect to be half-siblings, so the ranges may be somewhat “off.”

Relationship Probability Calculator

Third-party matching database, GEDmatch, provides a Relationship Probability Calculator tool that is based on statistical probability methods without compiled user input. Both tools are free, and while I haven’t compared every value, both seem to be reasonably accurate, although they do vary somewhat, especially at the outer ends of the ranges.

When dealing with sibling matches, if you are in all four databases, GEDmatch is a secondary resource, but I will include GEDmatch when they have a unique tool as well as in the summary table. Some of your matches may be willing to upload to GEDmatch if the vendor where you match doesn’t provide everything you need and GEDmatch has a supplemental offering.

Next, let’s look at what the vendors say about sibling matches.

Vendors

Each of the major vendors reports sibling relationships in a slightly different way.

Sibling Matches at Ancestry

Ancestry reports sibling relationships as Sister or Brother, but they don’t say half or full.

If you click on the cM portion of the link, you’ll see additional detail, below

Ancestry tells you that the possible relationships are 100% “Sibling.” The only way to discern the difference between full and half is by what’s next.

If the ONLY relationship shown is Sibling at 100%, that can be interpreted to mean this person is a full sibling, and that a half-sibling or other relationship is NOT a possibility.

Ancestry never stipulates full or half.

The following relationship is a half-sibling at Ancestry.

Ancestry identifies that possible range of relationships as “Close Family to First Cousin” because of the overlaps we saw in the DNAPainter chart.

Clicking through shows that there is a range of possible relationships, and Ancestry is 100% sure the relationship is one of those.

DNAPainter agrees with Ancestry except includes the full-sibling relationship as a possibility for 1826 cM.

Sibling Matches at 23andMe

23andMe does identify full versus half-siblings.

DNAPainter disagrees with 23andMe and claims that anyone who shares 46.2% of their DNA is a parent/child.

However, look at the fine print. 23andMe counts differently than any of the other vendors, and DNAPainter relies on the Shared cM Project, which relies on testers entering known relationship matching information. Therefore, at any other vendor, DNAPainter is probably exactly right.

Before we understand how 23andMe counts, we need to understand about half versus fully identical segments.

To determine half or full siblings, 23andMe compares two things:

  1. The amount of shared matching DNA between two people
  2. Fully Identical Regions (FIR) of DNA compared to Half Identical Regions (HIR) of DNA to determine if any of your DNA is fully identical, meaning some pieces of you and your sibling’s DNA is exactly the same on both your maternal and paternal chromosomes.

Here’s an example on any chromosome – I’ve randomly selected chromosome 12. Which chromosome doesn’t matter, except for the X, which is different.

Your match isn’t broken out by maternal and paternal sides. You would simply see, on the chromosome browser, that you and your sibling match at these locations, above.

In reality, though, you have two copies of each chromosome, one from Mom and one from Dad, and so does your sibling.

In this example, Mom’s chromosome is visualized on top, and Dad’s is on the bottom, below, but as a tester, you don’t know that. All you know is that you match your sibling on all of those blue areas, above.

However, what’s actually happening in this example is that you are matching your sibling on parts of your mother’s chromosome and parts of your father’s chromosome, shown above as green areas

23andMe looks at both copies of your chromosome, the one you inherited from Mom, on top, and Dad, on the bottom, to see if you match your sibling on BOTH your mother’s and your father’s chromosomes in that location.

I’ve boxed the green matching areas in purple where you match your sibling fully, on both parents’ chromosomes.

If you and your sibling share both parents, you will share significant amounts of the same DNA on both copies of the same chromosomes, meaning maternal and paternal. In other words, full siblings share some purple fully identical regions (FIR) of DNA with each other, while half-siblings do not (unless they are also otherwise related) because half-siblings only share one parent with each other. Their DNA can’t be fully identical because they have a different parent that contributed the other copy of their chromosome.

Total Shared DNA Fully Identical DNA from Both Parents
Full Siblings ~50% ~25%
Half Siblings ~25% 0
  • Full siblings are expected to share about 50% of the same DNA. In other words, their DNA will match at that location. That’s all the green boxed locations, above.
  • Full siblings are expected to share about 25% of the same DNA from BOTH parents at the same location on BOTH copies of their chromosomes. These are fully identical regions and are boxed in purple, above.

You’ll find fully identical segments about 25% of the time in full siblings, but you won’t find fully identical segments in half-siblings. Please note that there are exceptions for ¾ siblings and endogamous populations.

You can view each match at 23andMe to see if you have any completely identical regions, shown in dark purple in the top comparison of full siblings. Half siblings are shown in the second example, with less total matching DNA and no FIR or completely identical regions.

Please note that your matching amount of DNA will probably be higher at 23andMe than at other companies because:

  • 23andMe includes the X chromosome in the match totals
  • 23andMe counts fully identical matching regions twice. For full siblings, that’s an additional 25%

Therefore, a full sibling with an X match will have a higher total cM at 23andMe than the same siblings elsewhere because not only is the X added into the total, the FIR match region is added a second time too.

Fully Identical Regions (FIR) and Half Identical Regions (HIR) at GEDmatch

At GEDMatch, you can compare two people to each other, with an option to display the matching information and a painted graphic for each chromosome that includes FIR and HIR.

If you need to know if you and a match share fully identical regions and you haven’t tested at 23andMe, you can both upload your DNA data file to GEDmatch and use their One to One Autosomal DNA Comparison.

On the following page, simply enter both kit numbers and accept the defaults, making sure you have selected one of the graphics options.

While GEDmatch doesn’t specifically tell you whether someone is a full or half sibling, you can garner additional information about the relationship based on the graphic at GEDmatch.

GEDMatch shows both half and fully identical regions.

The above match is between two full siblings using a 7 cM threshold. The blue on the bottom bar indicates a match of 7 cM or larger. Black means no match.

The green regions in the top bar indicate places where these two people carry the same DNA on both copies of their chromosome 1. This means that both people inherited the same DNA from BOTH parents on the green segments.

In the yellow regions, the siblings inherited the same DNA from ONE parent, but different DNA in that region from the other parent. They do match each other, just on one of their chromosomes, not both.

Without a tool like this to differentiate between HIR and FIR, you can’t tell if you’re matching someone on one copy of your chromosome, or on both copies.

In the areas marked with red on top, which corresponds to the black on the bottom band, these two siblings don’t match each other because they inherited different DNA from both parents in that region. The yellow in that region is too scattered to be significant.

Full siblings generally share a significant amount of FIR, or fully identical regions of DNA – about 25%.

Half siblings will share NO significant amount of FIR, although some will be FIR on very small, scattered green segments simply by chance, as you can see in the example, below.

This half-sibling match shares no segments large enough to be a match (7 cM) in the black section. In the blue matching section, only a few small green fragments of DNA match fully, which, based on the rest of that matching segment, must be identical by chance or misreads. There are no significant contiguous segments of fully identical DNA.

When dealing with full or half-siblings, you’re not interested in small, scattered segments of fully identical regions, like those green snippets on chromosome 6, but in large contiguous sections of matching DNA like the chromosome 1 example.

GEDmatch can help when you match when a vendor does not provide FIR/HIR information, and you need additional assistance.

Next, let’s look at full and half-siblings at FamilyTreeDNA

Sibling Matches at FamilyTreeDNA

FamilyTreeDNA does identify full siblings.

Relationships other than full siblings are indicated by a range. The two individuals below are both half-sibling matches to the tester.

The full range when mousing over the relationship ranges is shown below.

DNAPainter agrees except also gives full siblings as an option for the two half-siblings.

FamilyTreeDNA also tells you if you have an X match and the size of your X match.

We will talk about X matching in a minute, which, when dealing with sibling identification, can turn out to be very important.

Sibling Matches at MyHeritage

MyHeritage indicates brother or sister for full siblings

MyHeritage provides other “Estimated relationships” for matches too small to be full siblings.

DNAPainter’s chart agrees with this classification, except adds additional relationship possibilities.

Be sure to review all of the information provided by each vendor for close relationships.

View Close Known Relationships

The next easiest step to take is to compare your full or half-sibling match to known close family members from your maternal and paternal sides, respectively. The closer the family members, the better.

It’s often not possible to determine if someone is a half sibling or a full sibling by centiMorgans (cMs) alone, especially if you’re searching for unknown family members.

Let’s start with the simplest situation first.

Let’s say both of your parents have tested, and of course, you match both of them as parents.

Your new “very close match” is in the sibling range.

The first thing to do at each vendor is to utilize that vendor’s shared matches tool and see whether your new match matches one parent, or both.

Here’s an example.

Close Relationships at FamilyTreeDNA

This person has a full sibling match, but let’s say they don’t know who this is and wants to see if their new sibling matches one or both of their parents.

Select the match by checking the box to the left of the match name, then click on the little two-person icon at far right, which shows “In Common” matches

You can see on the resulting shared match list that both of the tester’s parents are shown on the shared match list.

Now let’s make this a little more difficult.

No Parents, No Problem

Let’s say neither of your parents has tested.

If you know who your family is and can identify your matches, you can see if the sibling you match matches other close relatives on both or either side of your family.

You’ll want to view shared matches with your closest known match on both sides of your tree, beginning with the closest first. Aunts, uncles, first cousins, etc.

You will match all of your family members through second cousins, and 90% of your third cousins. You can view additional relationship percentages in the article, How Much of Them is in You?.

I recommend, for this matching purpose, to utilize 2nd cousins and closer. That way you know for sure if you don’t share them as a match with your sibling, it’s because the sibling is not related on that side of the family, not because they simply don’t share any DNA due to their distance.

In this example, you have three sibling matches. Based on your and their matches to the same known first and second cousins, you can see that:

  • Sibling 1 is your full sibling, because you both match the same maternal and paternal first and second cousins
  • Sibling 2 is your paternal half-sibling because you both match paternal second cousins and closer, but not maternal cousins.
  • Sibling 3 is your maternal half-sibling because you both match maternal second cousins and closer, but not paternal cousins.

Close Relationships at Ancestry

Neither of my parents have tested, but my first cousin on my mother’s side has. Let’s say I have a suspected sibling or half-sibling match, so I click on the match’s name, then on Shared Matches.

Sure enough, my new match also matches my first cousin that I’ve labeled as “on my mother’s side.”

If my new match in the sibling range also matches my second cousins or closer on my father’s side, the new match is a full sibling, not a half-sibling.

Close Relationships at MyHeritage

Comparing my closest match provided a real surprise. I wonder if I’ve found a half-sibling to my mother.

Now, THIS is interesting.

Hmmm. More research is needed, beginning with the age of my match. MyHeritage provides ages if the MyHeritage member authorizes that information to be shared.

Close Relationships at 23andMe

Under DNA Relatives, click on your suspected sibling match, then scroll down and select “Find Relatives in Common.”

The Relatives in Common list shows people that match both of you.

The first common match is very close and a similar relationship to my closest match on my father’s side. This would be expected of a sibling. I have no common matches with this match to anyone on my mother’s side, so they are only related on my father’s side. Therefore they are a paternal half-sibling, not a full sibling.

More Tools Are Available

Hopefully, by now, you’ve been able to determine if your mystery match is a sibling, and if so, if they are a half or full sibling, and through which parent.

We have some additional tools that are relevant and can be very informative in some circumstances. I suggest utilizing these tools, even if you think you know the answer.

In this type of situation, there’s no such thing as too much information.

X Matching

X matching, or lack thereof, may help you determine how you are related to someone.

There are two types of autosomal DNA. The X chromosome versus chromosomes 1-22. The X chromosome (number 23) has a unique inheritance path that distinguishes it from your other chromosomes.

The X chromosome inheritance path also differs between men and women.

Here’s my pedigree chart in fan form, highlighting the ancestors who may have contributed a portion of their X chromosome to me. In the closest generation, this shows that I inherited an X chromosome from both of my parents, and who in each of their lines could have contributed an X to them.

The white or uncolored positions, meaning ancestors, cannot contribute any portion of an X chromosome to me based on how the X chromosome is inherited.

You’ll notice that my father inherited none of his X chromosome from any of his paternal ancestors, so of course, I can’t inherit what he didn’t inherit. There are a very limited number of ancestors on my father’s side whom I can inherit any portion of an X chromosome from.

Men receive their Y chromosome from their fathers, so men ONLY receive an X chromosome from their mother.

Therefore, men MUST pass their mother’s X chromosome on to their female offspring because they don’t have any other copy of the X chromosome to pass on.

Men pass no X chromosome to sons.

We don’t need to worry about a full fan chart when dealing with siblings and half-siblings.

We only need to be concerned with the testers plus one generation (parents) when utilizing the X chromosome in sibling situations.

These two female Disney Princesses, above, are full siblings, and both inherited an X chromosome from BOTH their mother and father. However, their father only has one X (red) chromosome to give them, so the two females MUST match on the entire red X chromosome from their father.

Their mother has two X chromosomes, green and black, to contribute – one from each of her parents.

The full siblings, Melody, and Cinderella:

  • May have inherited some portion of the same green and black X chromosomes from their mother, so they are partial matches on their mother’s X chromosome.
  • May have inherited the exact same full X chromosome from their mother (both inherited the entire green or both inherited the entire black), so they match fully on their mother’s X chromosome.
  • May have inherited the opposite X from different maternal grandparents. One inherited the entire green X and one inherited the entire black X, so they don’t match on their mother’s X chromosome.

Now, let’s look at Cinderella, who matches Henry.

This female and male full sibling match can’t share an X chromosome on the father’s side, because the male’s father doesn’t contribute an X chromosome to him. The son, Henry, inherited a Y chromosome instead from his father, which is what made them males.

Therefore, if a male and female match on the X chromosome, it MUST be through HIS mother, but could be through either of her parents. In a sibling situation, an X match between a male and female always indicates the mother.

In the example above, the two people share both of their mother’s X chromosomes, so are definitely (at least) maternally related. They could be full siblings, but we can’t determine that by the X chromosome in this situation, with males.

However, if the male matches the female on HER father’s X chromosome, there a different message, example below.

You can see that the male is related to the female on her father’s side, where she inherited the entire magenta X chromosome. The male inherited a portion of the magenta X chromosome from his mother, so these two people do have an X match. However, he matches on his mother’s side, and she matches on her father’s side, so that’s clearly not the same parent.

  • These people CAN NOT be full siblings because they don’t match on HER mother’s side too, which would also be his mother’s side if they were full siblings.
  • They cannot be maternal half-siblings because their X DNA only matches on her father’s side, but they wouldn’t know that unless she knew which side was which based on share matches.
  • They cannot be paternal half-siblings because he does not have an X chromosome from his father.

They could, however, be uncle/aunt-niece/nephew or first cousins on his mother’s side and her father’s side. (Yes, you’re definitely going to have to read this again if you ever need male-female X matching.)

Now, let’s look at X chromosome matching between two males. It’s a lot less complicated and much more succinct.

Neither male has inherited an X chromosome from their father, so if two males DO match on the X, it MUST be through their mother. In terms of siblings, this would mean they share the same mother.

However, there is one slight twist. In the above example, you can see that the men inherited a different proportion of the green and black X chromosomes from their common mother. However, it is possible that the mother could contribute her entire green X chromosome to one son, Justin in this example, and her entire black X chromosome to Henry.

Therefore, even though Henry and Justin DO share a mother, their X chromosome would NOT match in this scenario. This is rare but does occasionally happen.

Based on the above examples, the X chromosome may be relevant in the identification of full or half siblings based on the sexes of the two people who otherwise match at a level indicating a full or half-sibling relationship.

Here’s a summary chart for sibling X matching.

X Match Female Male
Female Will match on shared father’s full X chromosome, mother’s X is the same rules as chromosomes 1-22 Match through male’s mother, but either of female’s parents. If the X match is not through the female’s mother, they are not full siblings nor maternal half-siblings. They cannot have an X match through the male’s father. They are either full or half-siblings through their mother if they match on both of their mother’s side. If they match on his mother’s side, and her father’s side, they are not siblings but could be otherwise closely related.
Male Match through male’s mother, but either of female’s parents. If the X match is not through the female’s mother, they are not full siblings nor maternal half-siblings. They cannot have an X match through the male’s father. They are either full or half-siblings through their mother if they match on both or their mother’s side. If they match on his mother’s side, and her father’s side, they are not siblings but could be otherwise closely related. Both males are related on their mother’s side – either full or half-siblings.

Here’s the information presented in a different way.

DOES match X summary:

  • If a male DOES match a female on the X, he IS related to her through HIS mother’s side, but could match her on her mother or father’s side. If their match is not through her mother, then they are not full siblings nor maternal half-siblings. They cannot match through his father, so they cannot be paternal half-siblings.
  • If a female DOES match a female on the X, they could be related on either side and could be full or half-siblings.
  • If a male DOES match a male on the X, they ARE both related through their mother. They may also be related on their father’s side, but the X does not inform us of that.

Does NOT match X summary:

  • If a male does NOT match a female on the X, they are NOT related through HIS mother and are neither full siblings nor maternal half-siblings. Since a male does not have an X chromosome from his father, they cannot be paternal half-siblings based on an X match.
  • If a male does NOT match a male, they do NOT share a mother.
  • If a female does NOT match another female on the X, they are NOT full siblings and are NOT half-siblings on their paternal side. Their father only has one X chromosome, and he would have given the same X to both daughters.

Of the four autosomal vendors, only 23andMe and FamilyTreeDNA report X chromosome results and matching, although the other two vendors, MyHeritage and Ancestry, include the X in their DNA download file so you can find X matches with those files at either FamilyTreeDNA or GEDMatch if your match has or will upload their file to either of those vendors. I wrote step-by-step detailed download/upload instructions, here.

X Matching at FamilyTreeDNA

In this example from FamilyTreeDNA, the female tester has discovered two half-sibling matches, both through her father. In the first scenario, she matches a female on the full X chromosome (181 cM). She and her half-sibling MUST share their father’s entire X chromosome because he only had one X, from his mother, to contribute to both of his daughters.

In the second match to a male half-sibling, our female tester shares NO X match because her father did not contribute an X chromosome to his son.

If we didn’t know which parents these half-sibling matches were through, we can infer from the X matching alone that the male is probably NOT through the mother.

Then by comparing shared matches with each sibling, Advanced Matches, or viewing the match Matrix, we can determine if the siblings match each other and are from the same or different sides of the family.

Under Additional Tests and Tools, Advanced Matching, FamilyTreeDNA provides an additional tool that can show only X matches combined with relationships.

Of course, you’ll need to view shared matches to see which people match the mother and/or match the father.

To see who matches each other, you’ll need to use the Matrix tool.

At FamilyTreeDNA, the Matrix, located under Autosomal DNA Results and Tools, allows you to select your matches to see if they also match each other. If you have known half-siblings, or close relatives, this is another way to view relationships.

Here’s an example using my father and two paternal half-siblings. We can see that the half-siblings also match each other, so they are (at least) half-siblings on the paternal side too.

If they also matched my mother, we would be full siblings, of course.

Next, let’s use Y DNA and mitochondrial DNA.

Y DNA and Mitochondrial DNA

In addition to autosomal DNA, we can utilize Y DNA and mitochondrial DNA (mtDNA) in some cases to identify siblings or to narrow or eliminate relationship possibilities.

Given that Y DNA and mitochondrial DNA both have distinctive inheritance paths, full and half-siblings will, or will not, match under various circumstances.

Y DNA

Y DNA is passed intact from father to son, meaning it’s not admixed with any of the mother’s DNA. Daughters do not inherit Y DNA from their father, so Y DNA is only useful for male-to-male comparisons.

Two types of Y DNA are used for genealogy, STR markers for matching, and haplogroups, and both are equally powerful in slightly different ways.

Y DNA at FamilyTreeDNA

Men can order either 37 or 111 STR marker tests, or the BIg Y which provides more than 700 markers and more. FamilyTreeDNA is the only one of the vendors to offer Y DNA testing that includes STR markers and matching between men.

Men who order these tests will be compared for matching on either 37, 111 or 700 STR markers in addition to SNP markers used for haplogroup identification and assignment.

Fathers will certainly match their sons, and paternal line brothers will match each other, but they will also match people more distantly related.

However, if two men are NOT either full or half siblings on the paternal side, they won’t match at 111 markers.

If two men DON’T match, especially at high marker levels, they likely aren’t siblings. The word “likely” is in there because, very occasionally, a large deletion occurs that prevents STR matching, especially at lower levels.

Additionally, men who take the 37 or 111 marker test also receive an estimated haplogroup at a high level for free, without any additional testing.

However, if men take the Big Y-700 test, they not only will (or won’t) match on up to 700 STR markers, they will also receive a VERY refined haplogroup via SNP marker testing that is often even more sensitive in terms of matching than STR markers. Between these two types of markers, Y DNA testing can place men very granularly in relation to other men.

Men can match in two ways on Y DNA, and the results are very enlightening.

If two men match on BOTH their most refined haplogroup (Big Y test) AND STR markers, they could certainly be siblings or father/son. They could also be related on the same line for another reason, such as known or unknown cousins or closer relationships like uncle/nephew. Of course, Y DNA, in addition to autosomal matching, is a powerful combination.

Conversely, if two men don’t have a similar or close haplogroup, they are not a father and son or paternal line siblings.

FamilyTreeDNA offers both inexpensive entry-level testing (37 and 111 markers) and highly refined advanced testing of most of the Y chromosome (Big Y-700), so haplogroup assignments can vary widely based on the test you take. This makes haplogroup matching and interpretation a bit more complex.

For example, haplogroups R-M269 and I-BY14000 are not related in thousands of years. One is haplogroup R, and one is haplogroup I – completely different branches of the Y DNA tree. These two men won’t match on STR markers or their haplogroup.

However, because FamilyTreeDNA provides over 50,000 different haplogroups, or tree branches, for Big Y testers, and they provide VERY granular matching, two father/son or sibling males who have BOTH tested at the Big Y-700 level will have either the exact same haplogroup, or at most, one branch difference on the tree if a mutation occurred between father and son.

If both men have NOT tested at the Big Y-700 level, their haplogroups will be on the same branch. For example, a man who has only taken a 37/111 marker STR test may be estimated at R-M269, which is certainly accurate as far as it goes.

His sibling who has taken a Big Y test will be many branches further downstream on the tree – but on the same large haplogroup R-M269 branch. It’s essential to pay attention to which tests a Y DNA match has taken when analyzing the match.

The beauty of the two kinds of tests is that even if one haplogroup is very general due to no Big Y test, their STR markers should still match. It’s just that sometimes this means that one hand is tied behind your back.

Y DNA matching alone can eliminate the possibility of a direct paternal line connection, but it cannot prove siblingship or paternity alone – not without additional information.

The Advanced Matching tool will provide a list of matches in all categories selected – in this case, both the 111 markers and the Family Finder test. You can see that one of these men is the father of the tester, and one is the full sibling.

You can view haplogroup assignments on the public Y DNA tree, here. I wrote about using the public tree, here.

In addition, recently, FamilyTreeDNA launched the new Y DNA Discover tool, which explains more about haplogroups, including their ages and other fun facts like migration paths along with notable and ancient connections. I wrote about using the Discover tool, here.

Y DNA at 23andMe

Testers receive a base haplogroup with their autosomal test. 23andMe tests a limited number of Y DNA SNP locations, but they don’t test many, and they don’t test STR markers, so there is no Y DNA matching and no refined haplogroups.

You can view the haplogroups of your matches. If your male sibling match does NOT share the same haplogroup, the two men are not paternal line siblings. If two men DO share the same haplogroup, they MIGHT be paternal siblings. They also might not.

Again, autosomal close matching plus haplogroup comparisons include or exclude paternal side siblings for males.

Paternal side siblings at 23andMe share the same haplogroup, but so do many other people. These two men could be siblings. The haplogroups don’t exclude that possibility. If the haplogroups were different, that would exclude being either full or paternal half-siblings.

Men can also compare their mitochondrial DNA to eliminate a maternal relationship.

These men are not full siblings or maternal half-siblings. We know, unquestionably, because their mitochondrial haplogroups don’t match.

23andMe also constructs a genetic tree, but often struggles with close relative placement, especially when half-relationships are involved. I do not recommend relying on the genetic tree in this circumstance.

Mitochondrial DNA

Mitochondrial DNA is passed from mothers to all of their children, but only females pass it on. If two people, males or females, don’t match on their mitochondrial DNA test, with a couple of possible exceptions, they are NOT full siblings, and they are NOT maternal half-siblings.

Mitochondrial DNA at 23andMe

23andMe provides limited, base mitochondrial haplogroups, but no matching. If two people don’t have the same haplogroup at 23andMe, they aren’t full or maternal siblings, as illustrated above.

Mitochondrial DNA at FamilyTreeDNA

FamilyTreeDNA provides both mitochondrial matching AND a much more refined haplogroup. The full sequence test (mtFull), the only version sold today, is essential for reliable comparisons.

Full siblings or maternal half-siblings will always share the same haplogroup, regardless of their sex.

Generally, a full sibling or maternal half-sibling match will match exactly at the full mitochondrial sequence (FMS) level with a genetic distance of zero, meaning fully matching and no mismatching mutations.

There are rare instances where maternal siblings or even mothers and children do not match exactly, meaning they have a genetic distance of greater than 0, because of a mutation called a heteroplasmy.

I wrote about heteroplasmies, here.

Like Y DNA, mitochondrial DNA cannot identify a sibling or parental relationship without additional evidence, but it can exclude one, and it can also provide much-needed evidence in conjunction with autosomal matching. The great news is that unlike Y DNA, everyone has mitochondrial DNA and it comes directly from their mother.

Once again, FamilyTreeDNA’s Advanced Matching tool provides a list of people who match you on both your mitochondrial DNA test and the Family Finder autosomal test, including transfers/uploads, and provides a relationship.

You can see that our tester matches both a full sibling and their mother. Of course, a parent/child match could mean that our tester is a female and one of her children, of either sex, has tested.

Below is an example of a parent-child match that has experienced a heteroplasmy.

Based on the comparison of both the mitochondrial DNA test, plus the autosomal Family Finder test, you can verify that this is a close family relationship.

You can also eliminate potential relationships based on the mitochondrial DNA inheritance path. The mitochondrial DNA of full siblings and maternal half-siblings will always match at the full sequence and haplogroup level, and paternal half-siblings will never match. If paternal half-siblings do match, it’s happenstance or because of a different reason.

Sibling Summary and Checklist

I’ve created a quick reference checklist for you to use when attempting to determine whether or not a match is a sibling, and, if so, whether they are half or full siblings. Of course, these tools are in addition to the DNAPainter Shared cM Tool and GEDmatch’s Relationship Predictor Calculator.

FamilyTreeDNA Ancestry 23andMe MyHeritage GEDmatch
Matching Yes Yes Yes Yes Yes
Shared Matches Yes – In Common With Yes – Shared Matches Yes – Relatives in Common Yes – Review DNA Match Yes – People who match both or 1 of 2 kits
Relationship Between Shared Matches No No No Yes, under shared match No
Matches Match Each Other* Yes, Matrix No Yes, under “View DNA details,” then, “compare with more relatives” Partly, through triangulation Yes, can match any kits
Full Siblings Yes Sibling, implies full Yes Brother, Sister, means full No
Half Siblings Sibling, Uncle/Aunt-Niece/Nephew, Grandparent-Grandchild Close Family – 1C Yes Half sibling, aunt/uncle-niece-nephew No
Fully Identical Regions (FIR) No No Yes No Yes
Half Identical Regions (HIR) No No Yes No Yes
X matching Yes No Yes No Yes
Unusual Reporting or Anomalies No No, Timber is not used on close relationships X match added into total, FIR added twice No Matching amount can vary from vendors
Y DNA Yes, STRs, refined haplogroups, matching No High-level haplogroup only, no matching No No, only if tester enters haplogroup manually
Mitochondrial DNA Yes, full sequence, matching, refined haplogroup No High-level haplogroup only, no matching No No, only if tester enters haplogroup manually
Combined Tools (Autosomal, X, Y, mtDNA) Yes No No No No

*Autoclusters through Genetic Affairs show cluster relationships of matches to the tester and to each other, but not all matches are included, including close matches. While this is a great tool, it’s not relevant for determining close and sibling relationships. See the article, AutoClustering by Genetic Affairs, here.

Additional Resources

Some of you may be wondering how endogamy affects sibling numbers.

Endogamy makes almost everything a little more complex. I wrote about endogamy and various ways to determine if you have an endogamous heritage, here.

Please note that half-siblings with high cM matches also fall into the range of full siblings (1613-3488), with or without endogamy. This may be, but is not always, especially pronounced in endogamous groups.

As another resource, I wrote an earlier article, Full or Half Siblings, here, that includes some different examples.

Strategy

You have a lot of quills in your quiver now, and I wish you the best if you’re trying to unravel a siblingship mystery.

You may not know who your biological family is, or maybe your sibling doesn’t know who their family is, but perhaps your close relatives know who their family is and can help. Remember, the situation that has revealed itself may be a shock to everyone involved.

Above all, be kind and take things slow. If your unexpected sibling match becomes frightened or overwhelmed, they may simply check out and either delete their DNA results altogether or block you. They may have that reaction before you have a chance to do anything.

Because of that possibility, I recommend performing your analysis quickly, along with taking relevant screenshots before reaching out so you will at least have that much information to work with, just in case things go belly up.

When you’re ready to make contact, I suggest beginning by sending a friendly, short, message saying that you’ve noticed that you have a close match (don’t say sibling) and asking what they know about their family genealogy – maybe ask who their grandparents are or if they have family living in the area where you live. I recommend including a little bit of information about yourself, such as where you were born and are from.

I also refrain from using the word adoption (or similar) in the beginning or giving too much detailed information, because it sometimes frightens people, especially if they know or discover that there’s a painful or embarrassing family situation.

And, please, never, ever assume the worst of anyone or their motives. They may be sitting at their keyboard with the same shocked look on their face as you – especially if they have, or had, no idea. They may need space and time to reach a place of acceptance. There’s just nothing more emotionally boat-capsizing in your life than discovering intimate and personal details about your parents, one or both, especially if that discovery is disappointing and image-altering.

Or, conversely, your sibling may have been hoping and waiting just for you!

Take a deep breath and let me know how it goes!

Please feel free to share this article with anyone who could benefit.

_____________________________________________________________

Follow DNAexplain on Facebook, here or follow me on Twitter, here.

Share the Love!

You’re always welcome to forward articles or links to friends and share on social media.

If you haven’t already subscribed (it’s free,) you can receive an email whenever I publish by clicking the “follow” button on the main blog page, here.

You Can Help Keep This Blog Free

I receive a small contribution when you click on some of the links to vendors in my articles. This does NOT increase the price you pay but helps me to keep the lights on and this informational blog free for everyone. Please click on the links in the articles or to the vendors below if you are purchasing products or DNA testing.

Thank you so much.

DNA Purchases and Free Uploads

Genealogy Products and Services

My Book

Genealogy Books

Genealogy Research

How Many Matches at Each DNA Testing Vendor?

We know that it’s important to test at, or upload to, each DNA testing vendor. Every vendor has some people that aren’t in any other database.

If you don’t assure that your DNA, and that of your close relatives, is in each database, you’re cheating yourself out of information. Potentially very valuable information. Puzzle pieces you need.

It’s like searching for that lost item. It’s ALWAYS in the last place you look!

I’m sometimes asked how many matches I have in each database, so let’s take a look.

Vendor Number of Matches Closest match*
LivingDNA 567 Predicted Second/Third Cousin
23andMe 1,803** First Cousin Once Removed
FamilyTreeDNA 7,750 First Cousin
MyHeritage 15,038 First Cousin
Ancestry V2*** 57,812 Half First Cousin
Ancestry V1*** 103,516*** Same as above
GEDmatch**** 3,000 and 200,000 Second Cousin

*This is the closest match whose test I did not arrange. For example, I tested my mother and several close cousins. In other words, these are matches I would have found had I not tested family members.

** 23andMe restricts matches to 1500 without a yearly membership, which allows 5000ish matches. Memberships are only available for people who have taken the V5 health+ancestry version test. The match limits are 1500/5000+any person you have communicated with that would have otherwise rolled off your match list.

***I’ve included both of my Ancestry V1 and V2 test numbers because I tagged each one of the 6-8 cM segment matches on my Ancestry V1 test in order to prevent those people from being removed from my match list back in the summer of 2020. The Ancestry V2 test is the test without any special “preservation” tagging, so that is the number of matches I would have without having preserved those smaller matches.

****GEDmatch is not a testing vendor, but provides matching tools not available at all vendors. The matches found there have tested someplace else and may be included in the matches at the original vendor. The number of matches displayed at GEDmatch is 3,000 using the free version, and up to 200,000 in the subscription version, although the match list at the highest levels sometimes doesn’t load on some computers.

The Right Match

The right match is far more important than the total number of matches. Fishing in all the ponds is your best bet to find the matches you specifically need to achieve your genealogy goal or goals. You never know where the match you need has tested – and is waiting for you – so fish in all of the ponds.

You must test directly at both Ancestry and 23andMe, respectively, but you can upload your raw data file from either of those vendors to the other databases – all of whom accept free transfers. I wrote step-by-step DNA file download and upload instructions, here.

Happy fishing!!

_____________________________________________________________

Follow DNAexplain on Facebook, here or follow me on Twitter, here.

Share the Love!

You’re always welcome to forward articles or links to friends and share on social media.

If you haven’t already subscribed (it’s free,) you can receive an email whenever I publish by clicking the “follow” button on the main blog page, here.

You Can Help Keep This Blog Free

I receive a small contribution when you click on some of the links to vendors in my articles. This does NOT increase the price you pay but helps me to keep the lights on and this informational blog free for everyone. Please click on the links in the articles or to the vendors below if you are purchasing products or DNA testing.

Thank you so much.

DNA Purchases and Free Uploads

Genealogy Products and Services

My Book

Genealogy Books

Genealogy Research

DNA: In Search of…Signs of Endogamy

This is the fourth in our series of articles about searching for unknown close family members, specifically; parents, grandparents, or siblings. However, these same techniques can be applied by genealogists to ancestors further back in time as well.

In this article, we discuss endogamy – how to determine if you have it, from what population, and how to follow the road signs.

After introductions, we will be covering the following topics:

  • Pedigree collapse and endogamy
  • Endogamous groups
  • The challenge(s) of endogamy
  • Endogamy and unknown close relatives (parents, grandparents)
  • Ethnicity and Populations
  • Matches
  • AutoClusters
  • Endogamous Relationships
  • Endogamous DNA Segments
  • “Are Your Parents Related?” Tool
  • Surnames
  • Projects
  • Locations
  • Y DNA, Mitochondrial DNA, and Endogamy
  • Endogamy Tools Summary Tables
    • Summary of Endogamy Tools by Vendor
    • Summary of Endogamous Populations Identified by Each Tool
    • Summary of Tools to Assist People Seeking Unknown Parents and Grandparents

What Is Endogamy and Why Does It Matter?

Endogamy occurs when a group or population of people intermarry among themselves for an extended period of time, without the introduction of many or any people from outside of that population.

The effect of this continual intermarriage is that the founders’ DNA simply gets passed around and around, eventually in small segments.

That happens because there is no “other” DNA to draw from within the population. Knowing or determining that you have endogamy helps make sense of DNA matching patterns, and those patterns can lead you to unknown relatives, both close and distant.

This Article

This article serves two purposes.

  • This article is educational and relevant for all researchers. We discuss endogamy using multiple tools and examples from known endogamous people and populations.
  • In order to be able to discern endogamy when we don’t know who our parents or grandparents are, we need to know what signs and signals to look for, and why, which is based on what endogamy looks like in people who know their heritage.

There’s no crystal ball – no definitive “one-way” arrow, but there are a series of indications that suggest endogamy.

Depending on the endogamous population you’re dealing with, those signs aren’t always the same.

If you’re sighing now, I understand – but that’s exactly WHY I wrote this article.

We’re covering a lot of ground, but these road markers are invaluable diagnostic tools.

I’ve previously written about endogamy in the articles:

Let’s start with definitions.

Pedigree Collapse and Endogamy

Pedigree collapse isn’t the same as endogamy. Pedigree collapse is when you have ancestors that repeat in your tree.

In this example, the parents of our DNA tester are first cousins, which means the tester shares great-grandparents on both sides and, of course, the same ancestors from there on back in their tree.

This also means they share more of those ancestors’ DNA than they would normally share.

John Smith and Mary Johnson are both in the tree twice, in the same position as great-grandparents. Normally, Tester Smith would carry approximately 12.5% of each of his great-grandparents’ DNA, assuming for illustration purposes that exactly 50% of each ancestor’s DNA is passed in each generation. In this case, due to pedigree collapse, 25% of Tester Smith’s DNA descends from John Smith, and another 25% descends from Mary Johnson, double what it would normally be. 25% is the amount of DNA contribution normally inherited from grandparents, not great-grandparents.

While we may find first cousin marriages a bit eyebrow-raising today, they were quite common in the past. Both laws and customs varied with the country, time, social norms, and religion.

Pedigree Collapse and Endogamy is NOT the Same

You might think that pedigree collapse and endogamy is one and the same, but there’s a difference. Pedigree collapse can lead to endogamy, but it takes more than one instance of pedigree collapse to morph into endogamy within a population. Population is the key word for endogamy.

The main difference is that pedigree collapse occurs with known ancestors in more recent generations for one person, while endogamy is longer-term and systemic in a group of people.

Picture a group of people, all descended from Tester Smith’s great-grandparents intermarrying. Now you have the beginnings of endogamy. A couple hundred or a few hundred years later, you have true endogamy.

In other words, endogamy is pedigree collapse on a larger scale – think of a village or a church.

My ancestors’ village of Schnait, in Germany, is shown above in 1685. One church and maybe 30 or 40 homes. According to church and other records, the same families had inhabited this village, and region, for generations. It’s a sure bet that both pedigree collapse and endogamy existed in this small community.

If pedigree collapse happens over and over again because there are no other people within the community to marry, then you have endogamy. In other words, with endogamy, you assuredly DO have historical pedigree collapse, generally back in time, often before you can identify those specific ancestors – because everyone descends from the same set of founders.

Endogamy Doesn’t Necessarily Indicate Recent Pedigree Collapse

With deep, historic endogamy, you don’t necessarily have recent pedigree collapse, and in fact, many people do not. Jewish people are a good example of this phenomenon. They shared ancestors for hundreds or thousands of years, depending on which group we are referring to, but in recent, known, generations, many Jewish people aren’t related. Still, their DNA often matches each other.

The good news is that there are telltale signs and signals of endogamy.

The bad news is that not all of these are obvious, meaning as an aid to people seeking clues about unknown close relatives, and other “signs” aren’t what they are believed to be.

Let’s step through each endogamy identifier, or “hint,” and then we will review how we can best utilize this information.

First, let’s take a look at groups that are considered to be endogamous.

Endogamous Groups

Jewish PeopleSpecifically groups that were isolated from other groups of Jewish (and other) people; Ashkenazi (Germany, Northern France, and diaspora), Sephardic (Spanish, Iberia, and diaspora), Mizrahi (Israel, Middle Eastern, and diaspora,) Ethiopian Jews, and possibly Jews from other locations such as Mountain Jews from Kazakhstan and the Caucasus.

AcadiansDescendants of about 60 French families who settled in “Acadia” beginning about 1604, primarily on the island of Nova Scotia, and intermarried among themselves and with the Mi’kmaq people. Expelled by the English in 1755, they were scattered in groups to various diasporic regions where they continued to intermarry and where their descendants are found today. Some Acadians became the Cajuns of Louisiana.

Anabaptist Protestant FaithsAmish, Mennonite, and Brethren (Dunkards) and their offshoots are Protestant religious sects founded in Europe in the 14th, 15th, and 16th centuries on the principle of baptizing only adults or people who are old enough to choose to follow the faith, or rebaptizing people who had been previously baptized as children. These Anabaptist faiths tend to marry within their own group or church and often expel those who marry outside of the faith. Many emigrated to the American colonies and elsewhere, seeking religious freedom. Occasionally those groups would locate in close proximity and intermarry, but not marry outside of other Anabaptist denominations.

Native American (Indigenous) People – all indigenous peoples found in North and South America before European colonization descended from a small number of original founders who probably arrived at multiple times.

Indigenous Pacific Islanders – Including indigenous peoples of Australia, New Zealand, and Hawaii prior to colonization. They are probably equally as endogamous as Native American people, but I don’t have specific examples to share.

Villages – European or other villages with little inflow or whose residents were restricted from leaving over hundreds of years.

Other groups may have significant multiple lines of pedigree collapse and therefore become endogamous over time. Some people from Newfoundland, French Canadians, and Mormons (Church of Jesus Christ of Latter-Day Saints) come to mind.

Endogamy is a process that occurs over time.

Endogamy and Unknown Relatives

If you know who your relatives are, you may already know you’re from an endogamous population, but if you’re searching for close relatives, it’s helpful to be able to determine if you have endogamous heritage, at least in recent generations.

If you know nothing about either parent, some of these tools won’t help you, at least not initially, but others will. However, as you add to your knowledge base, the other tools will become more useful.

If you know the identity of one parent, this process becomes at least somewhat easier.

In future articles, we will search specifically for parents and each of your four grandparents. In this article, I’ll review each of the diagnostic tools and techniques you can use to determine if you have endogamy, and perhaps pinpoint the source.

The Challenge

People with endogamous heritage are related in multiple, unknown ways, over many generations. They may also be related in known ways in recent generations.

If both of your parents share the SAME endogamous culture or group of relatives:

  • You may have significantly more autosomal DNA matches than people without endogamy, unless that group of people is under-sampled. Jewish people have significantly more matches, but Native people have fewer due to under-sampling.
  • You may experience a higher-than-normal cM (centiMorgan) total for estimated relationships, especially more distant relationships, 3C and beyond.
  • You will have many matches related to you on both your maternal and paternal sides.
  • Parts of your autosomal DNA will be the same on both your mother’s and father’s sides, meaning your DNA will be fully identical in some locations. (I’ll explain more in a minute.)

If either (or both) of your parents are from an endogamous population, you:

  • Will, in some cases, carry identifying Y and mitochondrial DNA that points to a specific endogamous group. This is true for Native people, can be true for Jewish people and Pacific Islanders, but is not true for Anabaptist people.

One Size Does NOT Fit All

Please note that there is no “one size fits all.”

Each or any of these tools may provide relevant hints, depending on:

  • Your heritage
  • How many other people have tested from the relevant population group
  • How many close or distant relatives have tested
  • If your parents share the same heritage
  • Your unique DNA inheritance pattern
  • If your parents, individually, were fully endogamous or only partly endogamous, and how far back generationally that endogamy occurred

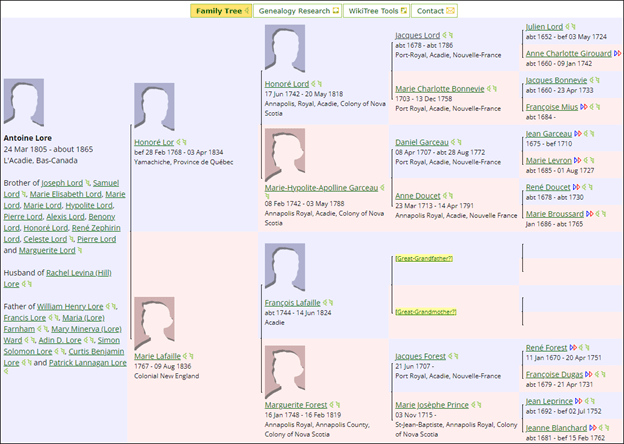
For example, in my own genealogy, my maternal grandmother’s father was Acadian on his father’s side. While I’m not fully endogamous, I have significantly more matches through that line proportionally than on my other lines.

I have Brethren endogamy on my mother’s side via her paternal grandmother.

Endogamous ancestors are shown with red stars on my mother’s pedigree chart, above. However, please note that her maternal and paternal endogamous ancestors are not from the same endogamous population.

However, I STILL have fewer matches on my mother’s side in total than on my father’s side because my mother has recent Dutch and recent German immigrants which reduces her total number of matches. Neither of those lines have had as much time to produce descendants in the US, and Europe is under-sampled when compared with the US where more people tend to take DNA tests because they are searching for where they came from.

My father’s ancestors have been in the US since it was a British Colony, and I have many more cousins who have tested on his side than mother’s.

If you looked at my pedigree chart and thought to yourself, “that’s messy,” you’d be right.

The “endogamy means more matches” axiom does not hold true for me, comparatively, between my parents – in part because my mother’s German and Dutch lines are such recent immigrants.

The number of matches alone isn’t going to tell this story.

We are going to need to look at several pieces and parts for more information. Let’s start with ethnicity.

Ethnicity and Populations

Ethnicity can be a double-edged sword. It can tell you exactly nothing you couldn’t discern by looking in the mirror, or, conversely, it can be a wealth of information.

Ethnicity reveals the parts of the world where your ancestors originated. When searching for recent ancestors, you’re most interested in majority ethnicity, meaning the 50% of your DNA that you received from each of your parents.

Ethnicity results at each vendor are easy to find and relatively easy to understand.

This individual at FamilyTreeDNA is 100% Ashkenazi Jewish.

If they were 50% Jewish, we could then estimate, and that’s an important word, that either one of their parents was fully Jewish, and not the other, or that two of their grandparents were Jewish, although not necessarily on the same side.

On the other hand, my mother’s ethnicity, shown below, has nothing remarkable that would point to any majority endogamous population, yet she has two.

The only hint of endogamy from ethnicity would be her ~1% Americas, and that isn’t relevant for finding close relatives. However, minority ancestry is very relevant for identifying Native ancestors, which I wrote about, here.

You can correlate or track your ethnicity segments to specific ancestors, which I discussed in the article, Native American & Minority Ancestors Identified Using DNAPainter Plus Ethnicity Segments, here.

Since I wrote that article, FamilyTreeDNA has added the feature of ethnicity or population Chromosome Painting, based on where each of your populations fall on your chromosomes.

In this example on chromosome 1, I have European ancestry (blue,) except for the pink Native segment, which occurs on the following segment in the same location on my mother’s chromosome 1 as well.

Both 23andMe, and FamilyTreeDNA provide chromosome painting AND the associated segment information so you can identify the relevant ancestors.

Ancestry is in the process of rolling out an ethnicity painting feature, BUT, it has no segment or associated matching information. While it’s interesting eye candy, it’s not terribly useful beyond the ethnicity information that Ancestry already provides. However, Jonny Perl at DNAPainter has devised a way to estimate Ancestry’s start and stop locations, here. Way to go Jonny!

Now all you need to do is convince your Ancestry matches to upload their DNA file to one of the three databases, FamilyTreeDNA, MyHeritage, and GEDMatch, that accept transfers, aka uploads. This allows matching with segment data so that you can identify who matches you on that segment, track your ancestors, and paint your ancestral segments at DNAPainter.

I provided step-by-step instructions, here, for downloading your raw DNA file from each vendor in order to upload the file to another vendor.

Ethnicity Sides

Three of the four DNA testing vendors, 23andMe, FamilyTreeDNA, and recently, Ancestry, attempt to phase your ethnicity DNA, meaning to assign it to one parental “side” or the other – both in total and on each chromosome.

Here’s Ancestry’s SideView, where your DNA is estimated to belong to parent 1 and parent 2. I detailed how to determine which side is which, here, and while that article was written specifically pertaining to Ancestry’s SideView, the technique is relevant for all the vendors who attempt to divide your DNA into parents, a technique known as phasing.

I say “attempt” because phasing may or may not be accurate, meaning the top chromosome may not always be parent 1, and the bottom chromosome may not always be chromosome 2.

Here’s an example at 23andMe.

See the two yellow segments. They are both assigned as Native. I happen to know one is from the mother and one is from the father, yet they are both displayed on the “top” chromosome, which one would interpret to be the same parent.

I am absolutely positive this is not the case because this is a close family member, and I have the DNA of the parent who contributed the Native segment on chromosome 1, on the top chromosome. That parent does not have a Native segment on chromosome 2 to contribute. So that Native segment had to be contributed by the other parent, but it’s also shown on the top chromosome.

The DNA segments circled in purple belong together on the same “side” and were contributed to the tester by the same parent. The Native segment on chromosome 2 abuts a purple African segment, suggesting perhaps that the ancestor who contributed that segment was mixed between those ethnicities. In the US, that suggests enslavement.

The other African segments, circled, are shown on the second chromosome in each pair.

To be clear, parent 1 is not assigned by the vendors to either mother or father and will differ by person. Your parent 1, or the parent on the top chromosome may be your mother and another person’s parent 1 may be their father.

As shown in this example, parents can vary by chromosome, a phenomenon known as “strand swap.” Occasionally, the DNA can even be swapped within a chromosome assignment.

You can, however, get an idea of the division of your DNA at any specific location. As shown above, you can only have a maximum of two populations of DNA on any one chromosome location.

In our example above, this person’s majority ancestry is European (blue.) On each chromosome where we find a minority segment, the opposite chromosome in the same location is European, meaning blue.

Let’s look at another example.

At FamilyTreeDNA, the person whose ethnicity painting is shown below has a Native American (pink) ancestor on their father’s side. FamilyTreeDNA has correctly phased or identified their Native segments as all belonging to the second chromosome in each pair.

Looking at chromosome 18, for example, most of their father’s chromosome is Native American (pink). The other parent’s chromosome is European (dark blue) at those same locations.

If one of the parents was of one ethnicity, and the other parent is a completely different ethnicity, then one bar of each chromosome would be all pink, for example, and one would be entirely blue, representing the other ethnicity.

Phasing ethnicity or populations to maternal and paternal sides is not foolproof, and each chromosome is phased individually.

Ethnicity can, in some cases, give you a really good idea of what you’re dealing with in terms of heritage and endogamy.

If someone had an Ashkenazi Jewish father and European mother, for example, one copy of each chromosome would be yellow (Ashkenazi Jewish), and one would be blue (European.)

However, if each of their parents were half European Jewish and half European (not Jewish), then their different colored segments would be scattered across their entire set of chromosomes.

In this case, both of the tester’s parents are mixed – European Jewish (green) and Western Europe (blue.) We know both parents are admixed from the same two populations because in some locations, both parents contributed blue (Western Europe), and in other locations, both contributed Jewish (green) segments.

Both MyHeritage and Ancestry provide a secondary tool that’s connected to ethnicity, but different and generally in more recent times.

Ancestry’s DNA Communities

While your ethnicity may not point to anything terribly exciting in terms of endogamy, Genetic Communities might. Ancestry says that a DNA Community is a group of people who share DNA because their relatives recently lived in the same place at the same time, and that communities are much smaller than ethnicity regions and reach back only about 50-300 years.

Based on the ancestors’ locations in the trees of me and my matches, Ancestry has determined that I’m connected to two communities. In my case, the blue group is clearly my father’s line. The orange group could be either parent, or even a combination of both.

My endogamous Brethren could be showing up in Maryland, Pennsylvania, and Ohio, but it’s uncertain, in part, because my father’s ancestral lines are found in Virginia, West Virginia, and Maryland too.

These aren’t useful for me, but they may be more useful for fully endogamous people, especially in conjunction with ethnicity.

My Acadian cousin’s European ethnicity isn’t informative.

However, viewing his DNA Communities puts his French heritage into perspective, especially combined with his match surnames.

I wrote about DNA Communities when it was introduced with the name Genetic Communities, here.

MyHeritage’s Genetic Groups

MyHeritage also provides a similar feature that shows where my matches’ ancestors lived in the same locations as mine.

One difference, though, is that testers can adjust their ethnicity results confidence level from high, above, to low, below where one of my Genetic Groups overlaps my ethnicity in the Netherlands.

You can also sort your matches by Genetic Groups.

The results show you not only who is in the group, but how many of your matches are in that group too, which provides perspective.

I wrote about Genetic Groups, here.

Next, let’s look at how endogamy affects your matches.

Matches

The number of matches that a person has who is from an entirely endogamous community and a person with no endogamy may be quite different.

FamilyTreeDNA provides a Family Matching feature that triangulates your matches and assigns them to your paternal or maternal side by using known matches that you have linked to their profile cards in your tree. You must link people for the Family Matching feature known as “bucketing” to be enabled.

The people you link are then processed for shared matches on the same chromosome segment(s). Triangulated individuals are then deposited in your maternal, paternal, and both buckets.

Obviously, your two parents are the best people to link, but if they haven’t tested (or uploaded their DNA file from another vendor) and you have other known relatives, link them using the Family Tree tab at the top of your personal page.

I uploaded my Ancestry V4 kit to use as an example for linking. Let’s pretend that’s my sister. If I had not already linked my Ancestry V4 kit to “my sister’s” profile card, I’d want to do that and link other known individuals the same way. Just drag and drop the match to the correct profile card.

Note that a full or half sibling will be listed as such at FamilyTreeDNA, but an identical twin will show as a potential parent/child match to you. You’re much more likely to find a parent than an identical twin, but just be aware.

I’ve created a table of FamilyTreeDNA bucketed match results, by category, comparing the number of matches in endogamous categories with non-endogamous.

Total Matches Maternal Matches Paternal Matches Both % Both % DNA Unassigned
100% Jewish 34,637 11,329 10,416 4,806 13.9 23.3
100% Jewish 32,973 10,700 9,858 4,606 14 23.7
100% Jewish 32,255 9,060 10,970 3,892 12 25.8
75% Jewish 24,232 11,846 Only mother linked Only mother linked Only mother linked
100% Acadian 8093 3826 2299 1062 13 11
100% Acadian 7828 3763 1825 923 11.8 17
Not Endogamous 6760 3845 1909 13 0.19 14.5
Not Endogamous 7723 1470 3317 6 0.08 38
100% Native American 1,115 Unlinked Unlinked Unlinked
100% Native American 885 290 Unknown Can’t calculate without at least one link on both sides

The 100% Jewish, Acadian, and Not Endogamous testers both have linked their parents, so their matches, if valid (meaning not identical by chance, which I discussed here,) will match them plus one or the other parent.

One person is 75% Jewish and has only linked their Jewish mother.

The Native people have not tested their parents, and the first Native person has not linked anyone in their tree. The second Native person has only linked a few maternal matches, but their mother has not tested. They are seeking their father.

It’s very difficult to find people who are fully Native as testers. Furthermore, Native people are under-sampled. If anyone knows of fully Native (or other endogamous) people who have tested and linked their parents or known relatives in their trees, and will allow me to use their total match numbers anonymously, please let me know.

As you can see, Jewish, Acadian, and Native people are 100% endogamous, but many more Jewish people than Native people have tested, so you CAN’T judge endogamy by the total number of matches alone.

In fact, in order:

  • Fully Jewish testers have about 4-5 times as many matches as the Acadian and Non-endogamous testers
  • Acadian and Non-endogamous testers have about 5-6 times as many matches as the Native American testers
  • Fully Jewish people have about 30 times more matches than the Native American testers

If a person’s endogamy with a particular population is only on their maternal or paternal side, they won’t have a significant number of people related to both sides, meaning few people will fall into the “Both” bucket. People that will always be found in the ”Both” bucket are full siblings and their descendants, along with descendants of the tester, assuming their match is linked to their profiles in the tester’s tree.

In the case of our Jewish testers, you can easily see that the “Both” bucket is very high. The Acadians are also higher than one would reasonably expect without endogamy. A non-endogamous person might have a few matches on both sides, assuming the parents are not related to each other.

A high number of “Both” matches is a very good indicator of endogamy within the same population on both parents’ sides.

The percentage of people who are assigned to the “Both” bucket is between 11% and 14% in the endogamous groups, and less than 1% in the non-endogamous group, so statistically not relevant.

As demonstrated by the Native people compared to the Jewish testers, the total number of matches can be deceiving.

However, being related to both parents, as indicated by the “Both” bucket, unless you have pedigree collapse, is a good indicator of endogamy.

Of course, if you don’t know who your relatives are, you can’t link them in your tree, so this type of “hunt” won’t generally help people seeking their close family members.

However, you may notice that you’re matching people PLUS both of their parents. If that’s the case, start asking questions of those matches about their heritage.

A very high number of total matches, as compared to non-endogamous people, combined with some other hints might well point to Jewish heritage.

I included the % DNA Unassigned category because this category, when both parents are linked, is the percentage of matches by chance, meaning the match doesn’t match either of the tester’s parents. All of the people with people listed in “Both” categories have linked both of their parents, not just maternal and paternal relatives.

Matching Location at MyHeritage

MyHeritage provides a matching function by location. Please note that it’s the location of the tester, but that may still be quite useful.

The locations are shown in the most-matches to least-matches order. Clicking on the location shows the people who match you who are from that location. This would be the most useful in situations where recent immigration has occurred. In my case, my great-grandfather from the Netherlands arrived in the 1860s, and my German ancestors arrived in the 1850s. Neither of those groups are endogamous, though, unless it would be on a village level.

AutoClusters

Let’s shift to Genetic Affairs, a third-party tool available to everyone.

Using their AutoCluster function, Genetic Affairs clusters your matches together who match both each other and you.

This is an example of the first few clusters in my AutoCluster. You can see that I have several colored clusters of various sizes, but none are huge.

Compare that to the following endogamous cluster, sample courtesy of EJ Blom at Genetic Affairs.

If your AutoCluster at Genetic Affairs looks something like this, a huge orange blob in the upper left hand corner, you’re dealing with endogamy.

Please also note that the size of your cluster is also a function of both the number of testers and the match threshold you select. I always begin by using the defaults. I wrote about using Genetic Affairs, here.

If you tested at or transferred to MyHeritage, they too license AutoClusters, but have optimized the algorithm to tease out endogamous matches so that their Jewish customers, in particular, don’t wind up with a huge orange block of interrelated people.

You won’t see the “endogamy signature” huge cluster in the corner, so you’re less likely to be able to discern endogamy from a MyHeritage cluster alone.

The commonality between these Jewish clusters at MyHeritage is that they all tend to be rather uniform in size and small, with lots of grey connecting almost all the blocks.

Grey cells indicate people who match people in two colored groups. In other words, there is often no clear division in clusters between the mother’s side and the father’s side in Jewish clusters.

In non-endogamous situations, even if you can’t identify the parents, the clusters should still fall into two sides, meaning a group of clusters for each parent’s side that are not related to each other.

You can read more about Genetic Affairs clusters and their tools, here. DNAGedcom.com also provides a clustering tool.

Endogamous Relationships

Endogamous estimated relationships are sometimes high. Please note the word, “sometimes.”

Using the Shared cM Project tool relationship chart, here, at DNAPainter, people with heavy endogamy will discover that estimated relationships MAY be on the high side, or the relationships may, perhaps, be estimated too “close” in time. That’s especially true for more distant relationships, but surprisingly, it’s not always true. The randomness of inheritance still comes into play, and so do potential unknown relatives. Hence, the words “may” are bolded and underscored.

Unfortunately, it’s often stated as “conventional wisdom” that Jewish matches are “always” high, and first cousins appear as siblings. Let’s see what the actual data says.

At DNAPainter, you can either enter the amount of shared DNA (cM), or the percent of shared DNA, or just use the chart provided.

I’ve assembled a compilation of close relationships in kits that I have access to or from people who were generous enough to share their results for this article.

I’ve used Jewish results, which is a highly endogamous population, compared with non-endogamous testers.

The “Jewish Actual” column reports the total amount of shared DNA with that person. In other words, someone to their grandparent. The Average Range is the average plus the range from DNAPainter. The Percent Difference is the % difference between the actual number and the DNAPainter average.

You’ll see fully Jewish testers, at left, matching with their family members, and a Non-endogamous person, at right, matching with their same relative.

Relationship Jewish Actual Percent Difference than Average Average -Range Non-endogamous Actual Percent Difference than Average
Grandparent 2141 22 1754 (984-2482) 1742 <1 lower
Grandparent 1902 8.5 1754 (984-2482) 1973 12
Sibling 3039 16 2613 (1613-3488) 2515 3.5 lower
Sibling 2724 4 2613 (1613-3488) 2761 5.5
Half-Sibling 2184 24 1759 (1160-2436) 2127 21
Half-Sibling 2128 21 1759 (1160-2436) 2352 34
Aunt/Uncle 2066 18.5 1741 (1201-2282) 1849 6
Aunt/Uncle 2031 16.5 1741 (1201-2282) 2097 20
1C 1119 29 866 (396-1397) 959 11
1C 909 5 866 (396-1397) 789 9 lower
1C1R 514 19 433 (102-980) 467 8
1C1R 459 6 433 (102-980) 395 9 lower

These totals are from FamilyTreeDNA except one from GEDMatch (one Jewish Half-sibling).

Totals may vary by vendor, even when matching with the same person. 23andMe includes the X segments in the total cMs and also counts fully identical segments twice. MyHeritage imputation seems to err on the generous side.

However, in these dozen examples:

  • You can see that the Jewish actual amount of DNA shared is always more than the average in the estimate.
  • The red means the overage is more than 100 cM larger.
  • The percentage difference is probably more meaningful because 100 cM is a smaller percentage of a 1754 grandparent connection than compared to a 433 cM 1C1R.

However, you can’t tell anything about endogamy by just looking at any one sample, because:

  • Some of the Non-Endogamous matches are high too. That’s just the way of random inheritance.
  • All of the actual Jewish match numbers are within the published ranges, but on the high side.

Furthermore, it can get more complex.

Half Endogamous

I requested assistance from Jewish genealogy researchers, and a lovely lady, Sharon, reached out, compiled her segment information, and shared it with me, granting permission to share with you. A HUGE thank you to Sharon!

Sharon is half-Jewish via one parent, and her half-sibling is fully Jewish. Their half-sibling match to each other at Ancestry is 1756 cM with a longest segment of 164 cM.

How does Jewish matching vary if you’re half-Jewish versus fully Jewish? Let’s look at 21 people who match both Sharon and her fully Jewish half-sibling.

Sharon shared the differences in 21 known Jewish matches with her and her half-sibling. I’ve added the Relationship Estimate Range from DNAPainter and colorized the highest of the two matches in yellow. Bolding in the total cM column shows a value above the average range for that relationship.

Total Matching cMs is on the left, with Longest Segment on the right.

While this is clearly not a scientific study, it is a representative sample.

The fully Jewish sibling carries more Jewish DNA, which is available for other Jewish matches to match as a function of endogamy (identical by chance/population), so I would have expected the fully Jewish sibling to match most if not all Jewish testers at a higher level than the half-Jewish sibling.

However, that’s not universally what we see.

The fully Jewish sibling is not always the sibling with the highest number of matches to the other Jewish testers, although the half-Jewish tester has the larger “Longest Segment” more often than not.

Approximately two-thirds of the time (13/21), the fully Jewish person does have a higher total matching cM, but about one-third of the time (8/21), the half-Jewish sibling has a higher matching cM.

About one-fourth of the time (5/21), the fully Jewish sibling has the longest matching segment, and about two-thirds of the time (13/21), the half-Jewish sibling does. In three cases, or about 14% of the time, the longest segment is equal which may indicate that it’s the same segment.

Because of endogamy, Jewish matches are more likely to have:

  • Larger than average total cM for the specific relationship
  • More and smaller matching segments

However, as we have seen, neither of those are definitive, nor always true. Jewish matches and relationships are not always overestimated.

Ancestry and Timber

Please note that Ancestry downweights some matches by removing some segments using their Timber algorithm. Based on my matches and other accounts that I manage, Ancestry does not downweight in the 2-3rd cousin category, which is 90 cM and above, but they do begin downweighting in the 3-4th cousin category, below 90 cM, where my “Extended Family” category begins.

If you’ve tested at Ancestry, you can check for yourself.

By clicking on the amount of DNA you share with your match on your match list at Ancestry, shown above, you will be taken to another page where you will be able to view the unweighted shared DNA with that match, meaning the amount of DNA shared before the downweighting and removal of some segments, shown below.

Given the downweighting, and the information in the spreadsheet provided by Sharon, it doesn’t appear that any of those matches would have been in a category to be downweighted.

Therefore, for these and other close matches, Timber wouldn’t be a factor, but would potentially be in more distant matches.

Endogamous Segments

Endogamous matches tend to have smaller and more segments. Small amounts of matching DNA tend to skew the total DNA cM upwards.

How and why does this happen?

Ancestral DNA from further back in time tends to be broken into smaller segments.

Sometimes, especially in endogamous situations, two smaller segments, at one time separated from each other, manage to join back together again and form a match, but the match is only due to ancestral segments – not because of a recent ancestor.

Please note that different vendors have different minimum matching cM thresholds, so smaller matches may not be available at all vendors. Remember that factors like Timber and imputation can affect matching as well.

Let’s take a look at an example. I’ve created a chart where two ancestors have their blue and pink DNA broken into 4 cM segments.

They have children, a blue child and a pink child, and the two children, shown above, each inherited the same blue 4 cM segment and the same pink 4 cM segment from their respective parents. The other unlabeled pink and blue segments are not inherited by these two children, so those unlabeled segments are irrelevant in this example.

The parents may have had other children who inherited those same 4 cM labeled pink and blue segments as well, and if not, the parents’ siblings were probably passing at least some of the same DNA down to their descendants too.

The blue and pink children had children, and their children had children – for several generations.

Time passed, and their descendants became an endogamous community. Those pink and blue 4 cM segments may at some time be lost during recombination in the descendants of each of their children, shown by “Lost pink” and “Lost blue.”

However, because there is only a very limited amount of DNA within the endogamous community, their descendants may regain those same segments again from their “other parent” during recombination, downstream.

In each generation, the DNA of the descendant carrying the original blue or pink DNA segment is recombined with their partner. Given that the partners are both members of the same endogamous community, the two people may have the same pink and/or blue DNA segments. If one parent doesn’t carry the pink 4 cM segment, for example, their offspring may receive that ancestral pink segment from the other parent.

They could potentially, and sometimes do, receive that ancestral segment from both parents.

In our example, the descendants of the blue child, at left, lost the pink 4 cM segment in generation 3, but a few generations later, in generation 11, that descendant child inherited that same pink 4 cM segment from their other parent. Therefore, both the 4 cM blue and 4 cM pink segments are now available to be inherited by the descendants in that line. I’ve shown the opposite scenario in the generational inheritance at right where the blue segment is lost and regained.

Once rejoined, that pink and blue segment can be passed along together for generations.

The important part, though, is that once those two segments butt up against each other again during recombination, they aren’t just two separate 4 cM segments, but one segment that is 8 cM long – that is now equal to or above the vendors’ matching threshold.

This is why people descended from endogamous populations often have the following matching characteristics:

  • More matches
  • Many smaller segment matches
  • Their total cM is often broken into more, smaller segments

What does more, smaller segments, look like, exactly?

More, Smaller Segments

All of our vendors except Ancestry have a chromosome browser for their customers to compare their DNA to that of their matches visually.

Let’s take a look at some examples of what endogamous and non-endogamous matches look like.

For example, here’s a screen shot of a random Jewish second cousin match – 298 cM total, divided into 12 segments, with a longest segment of 58 cM,

A second Jewish 2C with 323 cM total, across 19 segments, with a 69 cM longest block.

A fully Acadian 2C match with 600 cM total, across 27 segments, with a longest segment of 69 cM.

A second Acadian 2C with 332 cM total, across 20 segments, with a longest segment of 42 cM.

Next, a non-endogamous 2C match with 217 cM, across 7 segments, with a longest segment of 72 cM.

Here’s another non-endogamous 2C example, with 169 shared cM, across 6 segments, with a longest segment of 70 cM.

Here’s the second cousin data in a summary table. The take-away from this is the proportion of total segments

Tester Population Total cM Longest Block Total Segments
Jewish 2C 298 58 12
Jewish 2C 323 69 19
Acadian 2C 600 69 27
Acadian 2C 332 42 20
Non-endogamous 2C 217 72 7
Non-endogamous 2C 169 70 6

You can see more examples and comparisons between Native American, Jewish and non-endogamous DNA individuals in the article, Concepts – Endogamy and DNA Segments.

I suspect that a savvy mathematician could predict endogamy based on longest block and total segment information.

Lara Diamond, a mathematician, who writes at Lara’s Jewnealogy might be up for this challenge. She just published compiled matching and segment information in her Ashkenazic Shared DNA Survey Results for those who are interested. You can also contribute to Laura’s data, here.

Endogamy, Segments, and Distant Relationships

While not relevant to searching for close relatives, heavily endogamous matches 3C and more distant, to quote one of my Jewish friends, “dissolve into a quagmire of endogamy and are exceedingly difficult to unravel.”

In my own Acadian endogamous line, I often simply have to label them “Acadian” because the DNA tracks back to so many ancestors in different lines. In other words, I can’t tell which ancestor the match is actually pointing to because the same DNA segments or segments is/are carried by several ancestors and their descendants due to founder effect.

The difference with the Acadians is that we can actually identify many or most of them, at least at some point in time. As my cousin, Paul LeBlanc, once said, if you’re related to one Acadian, you’re related to all Acadians. Then he proceeded to tell me that he and I are related 137 different ways. My head hurts!

It’s no wonder that endogamy is incredibly difficult beyond the first few generations when it turns into something like multi-colored jello soup.

“Are Your Parents Related?” Tool

There’s another tool that you can utilize to determine if your parents are related to each other.

To determine if your parents are related to each other, you need to know about ROH, or Runs of Homozygosity (ROH).

ROH means that the DNA on both strands or copies of the same chromosome is identical.

For a few locations in a row, ROH can easily happen just by chance, but the longer the segment, the less likely that commonality occurs simply by chance.

The good news is that you don’t need to know the identity of either of your parents. You don’t need either of your parent’s DNA tests – just your own. You’ll need to upload your DNA file to GEDmatch, which is free.

Click on “Are your parents related?”

GEDMatch analyzes your DNA to see if any of your DNA, above a reasonable matching threshold, is identical on both strands, indicating that you inherited the exact same DNA from both of your parents.

A legitimate match, meaning one that’s not by chance, will include many contiguous matching locations, generally a minimum of 500 SNPs or locations in a row. GEDmatch’s minimum threshold for identifying identical ancestral DNA (ROH) is 200 cM.

Here’s my result, including the graphic for the first two chromosomes. Notice the tiny green bars that show identical by chance tiny sliver segments.

I have no significant identical DNA, meaning my parents are not related to each other.

Next, let’s look at an endogamous example where there are small, completely identical segments across a person’s chromosome

This person’s Acadian parents are related to each other, but distantly.

Next, let’s look at a Jewish person’s results.

You’ll notice larger green matching ROH, but not over 200 contiguous SNPs and 7 cM.

GEDMatch reports that this Jewish person’s parents are probably not related within recent generations, but it’s clear that they do share DNA in common.

People whose parents are distantly related have relatively small, scattered matching segments. However, if you’re seeing larger ROH segments that would be large enough to match in a genealogical setting, meaning multiple greater than 7 cM and 500 SNPs,, you may be dealing with a different type of situation where cousins have married in recent generations. The larger the matching segments, generally, the closer in time.

Blogger Kitty Cooper wrote an article, here, about discovering that your parents are related at the first cousin level, and what their GEDMatch “Are Your Parents Related” results look like.

Let’s look for more clues.

Surnames

There MAY be an endogamy clue in the surnames of the people you match.

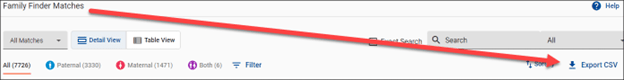
Viewing surnames is easier if you download your match list, which you can do at every vendor except Ancestry. I’m not referring to the segment data, but the information about your matches themselves.

I provided instructions in the recent article, How to Download Your DNA Match Lists and Segment Files, here.

If you suspect endogamy for any reason, look at your closest matches and see if there is a discernable trend in the surnames, or locations, or any commonality between your matches to each other.

For example, Jewish, Acadian, and Native surnames may be recognizable, as may locations.

You can evaluate in either or both of two ways:

  • The surnames of your closest matches. Closest matches listed first will be your default match order.
  • Your most frequently occurring surnames, minus extremely common names like Smith, Jones, etc., unless they are also in your closest matches. To utilize this type of matching, sort the spreadsheet in surname order and then scan or count the number of people with each surname.

Here are some examples from our testers.

Jewish – Closest surname matches.

  • Roth
  • Weiss
  • Goldman
  • Schonwald
  • Levi
  • Cohen
  • Slavin
  • Goodman
  • Sender
  • Trebatch

Acadian – Closest surname matches.

  • Bergeron
  • Hebert
  • Bergeron
  • Marcum
  • Muise
  • Legere
  • Gaudet
  • Perry
  • Verlander
  • Trombley

Native American – Closest surname matches.

  • Ortega
  • Begay
  • Valentine
  • Hayes
  • Montoya
  • Sun Bear
  • Martin
  • Tsosie
  • Chiquito
  • Yazzie

You may recognize these categories of surnames immediately.

If not, Google is your friend. Eliminate common surnames, then Google for a few together at a time and see what emerges.

The most unusual surnames are likely your best bets.

Projects

Another way to get some idea of what groups people with these surnames might belong to is to enter the surname in the FamilyTreeDNA surname search.

Go to the main FamilyTreeDNA page, but DO NOT sign on.

Scroll down until you see this image.

Type the surname into the search box. You’ll see how many people have tested with that surname, along with projects where project administrators have included that surname indicating that the project may be of interest to at least some people with that surname.

Here’s a portion of the project list for Cohen, a traditional Jewish surname.

These results are for Muise, an Acadian surname.

Clicking through to relevant surname projects, and potentially contacting the volunteer project administrator can go a very long way in helping you gather and sift information. Clearly, they have an interest in this topic.

For example, here’s the Muise surname in the Acadian AmerIndian project. Two great hints here – Acadian heritage and Halifax, Nova Scotia.

Repeat for the balance of surnames on your list to look for commonalities, including locations on the public project pages.

Locations

Some of the vendor match files include location information. Each person on your match list will have the opportunity at the vendor where they tested to include location information in a variety of ways, either for their ancestors or themselves.

Where possible, it’s easiest to sort or scan the download file for this type of information.

Ancestry does not provide or facilitate a match list, but you can still create your own for your closest 20 or 30 matches in a spreadsheet.

MyHeritage provides common surname and ancestral location information for every match. How cool is that!

Y DNA, Mitochondrial DNA, and Endogamy

Haplogroups for both Y and mitochondrial DNA can indicate and sometimes confirm endogamy. In other cases, the haplogroup won’t help, but the matches and their location information just might.

FamilyTreeDNA is the only vendor that provides Y DNA and mitochondrial DNA tests that include highly granular haplogroups along with matches and additional tools.

23andMe provides high-level haplogroups which may or may not be adequate to pinpoint a haplogroup that indicates endogamy.

Of course, only males carry Y DNA that tracks to the direct paternal (surname) line, but everyone carries their mother’s mitochondrial DNA that represents their mother’s mother’s mother’s, or direct matrilineal line.

Some haplogroups are known to be closely associated with particular ethnicities or populations, like Native Americans, Pacific Islanders, and some Jewish people.

Haplogroups reach back in time before genealogy and can give us a sense of community that’s not available by either looking in the mirror or through traditional records.

This Native American man is a member of high-level haplogroup Q-M242. However, some men who carry this haplogroup are not Native, but are of European or Middle Eastern origin.

I entered the haplogroup in the FamilyTreeDNA Discover tool, which I wrote about, here.

Checking the information about this haplogroup reveals that their common ancestor descended from an Asian man about 30,000 years ago.

The migration path in the Americans explains why this person would have an endogamous heritage.

Our tester would receive a much more refined haplogroup if he upgraded to the Big Y test at FamilyTreeDNA, which would remove all doubt.

However, even without additional testing, information about his matches at FamilyTreeDNA may be very illuminating.

The Q-M242 Native man’s Y DNA matches men with more granular haplogroups, shown above, at left. On the Haplogroup Origins report, you can see that these people have all selected the “US (Native American)” country option.

Another useful tool would be to check the public Y haplotree, here, and the public mitochondrial tree here, for self-reported ancestor location information for a specific haplogroup.

Here’s an example of mitochondrial haplogroup A2 and a few subclades on the public mitochondrial tree. You can see that the haplogroup is found in Mexico, the US (Native,) Canada, and many additional Caribbean, South, and Central American countries.

Of course, Y DNA and mitochondrial DNA (mtDNA) tell a laser-focused story of one specific line, each. The great news, if you’re seeking information about your mother or father, the Y is your father’s direct paternal (surname) line, and mitochondrial is your mother’s direct matrilineal line.

Y and mitochondrial DNA results combined with ethnicity, autosomal matching, and the wide range of other tools that open doors, you will be able to reveal a great deal of information about whether you have endogamous heritage or not – and if so, from where.

I’ve provided a resource for stepping through and interpreting your Y DNA results, here, and mitochondrial DNA, here.

Discover for Y DNA Only

If you’re a female, you may feel left out of Y DNA testing and what it can tell you about your heritage. However, there’s a back door.

You can utilize the Y DNA haplogroups of your closest autosomal matches at both FamilyTreeDNA and 23andMe to reveal information

Haplogroup information is available in the download files for both vendors, in addition to the Family Finder table view, below, at FamilyTreeDNA, or on your individual matches profile cards at both 23andMe and FamilyTreeDNA.

You can enter any Y DNA haplogroup in the FamilyTreeDNA Discover tool, here.

You’ll be treated to:

  • Your Haplogroup Story – how many testers have this haplogroup (so far), where the haplogroup is from, and the haplogroup’s age. In this case, the haplogroup was born in the Netherlands about 250 years ago, give or take 200 years. I know that it was 1806 or earlier based on the common ancestor of the men who tested.
  • Country Frequency – heat map of where the haplogroup is found in the world.
  • Notable Connections – famous and infamous (this haplogroup’s closest notable person is Leo Tolstoy).
  • Migration Map – migration path out of Africa and through the rest of the world.
  • Ancient Connections – ancient burials. His closest ancient match is from about 1000 years ago in Ukraine. Their shared ancestor lived about 2000 years ago.
  • Suggested Projects – based on the surname, projects that other matches have joined, and haplogroups.
  • Scientific Details – age estimates, confidence intervals, graphs, and the mutations that define this haplogroup.

I wrote about the Discover tool in the article, FamilyTreeDNA DISCOVER Launches – Including Y DNA Haplogroup Ages.

Endogamy Tools Summary Tables

Endogamy is a tough nut sometimes, especially if you’re starting from scratch. In order to make this topic a bit easier and to create a reference tool for you, I’ve created three summary tables.

  • Various endogamy-related tools available at each vendor which will or may assist with evaluating endogamy
  • Tools and their ability to detect endogamy in different groups
  • Tools best suited to assist people seeking information about unknown parents or grandparents

Summary of Endogamy Tools by Vendor

Please note that GEDMatch is not a DNA testing vendor, but they accept uploads and do have some tools that the testing vendors do not.

 Tool 23andMe Ancestry FamilyTreeDNA MyHeritage GEDMatch
Ethnicity Yes Yes Yes Yes Use the vendors
Ethnicity Painting Yes + segments Yes, limited Yes + segments Yes
Ethnicity Phasing Yes Partial Yes No
DNA Communities No Yes No No
Genetic Groups No No No Yes
Family Matching aka Bucketing No No Yes No
Chromosome Browser Yes No Yes Yes Yes
AutoClusters Through Genetic Affairs No Through Genetic Affairs Yes, included Yes, with subscription
Match List Download Yes, restricted # of matches No Yes Yes Yes
Projects No No Yes No
Y DNA High-level haplogroup only No Yes, full haplogroup with Big Y, matching, tools, Discover No
Mitochondrial DNA High-level haplogroup only No Yes, full haplogroup with mtFull, matching, tools No
Public Y Tree No No Yes No
Public Mito Tree No No Yes No
Discover Y DNA – public No No Yes No
ROH No No No No Yes

Summary of Endogamous Populations Identified by Each Tool

The following chart provides a guideline for which tools are useful for the following types of endogamous groups. Bolded tools require that both parents be descended from the same endogamous group, but several other tools give more definitive results with higher amounts of endogamy.

Y and mitochondrial DNA testing are not affected by admixture, autosomal DNA or anything from the “other” parent.

Tool Jewish Acadian Anabaptist Native Other/General
Ethnicity Yes No No Yes Pacific Islander
Ethnicity Painting Yes No No Yes Pacific Islander
Ethnicity Phasing Yes, if different No No Yes, if different Pacific Islander, if different
DNA Communities Yes Possibly Possibly Yes Pacific Islander
Genetic Groups Yes Possibly Possibly Yes Pacific Islander
Family Matching aka Bucketing Yes Yes Possibly Yes Pacific Islander
Chromosome Browser Possibly Possibly Yes, once segments or ancestors identified Possibly Pacific Islander, possibly
Total Matches Yes, compared to non-endogamous No No No No, unknown
AutoClusters Yes Yes Uncertain, probably Yes Pacific Islander
Estimated Relationships High Not always Sometimes No Sometimes Uncertain, probably
Relationship Range High Possibly, sometimes Possibly Possibly Possibly Pacific Islander, possibly
More, Smaller Segments Yes Yes Probably Yes Pacific Islander, probably
Parents Related Some but minimal Possibly Uncertain Probably similar to Jewish Uncertain, Possibly
Surnames Probably Probably Probably Not Possibly Possibly
Locations Possibly Probably Probably Not Probably Probably Pacific Islander
Projects Probably Probably Possibly Possibly Probably Pacific Islander
Y DNA Yes, often Yes, often No Yes Pacific Islander
Mitochondrial DNA Yes, often Sometimes No Yes Pacific Islander
Y public tree Probably not alone No No Yes Pacific Islander
MtDNA public tree Probably not No No Yes Pacific Islander
Y DNA Discover Yes Possibly Probably not, maybe projects Yes Pacific Islander

Summary of Endogamy Tools to Assist People Seeking Unknown Parents and Grandparents

This table provides a summary of when each of the various tools can be useful to:

  • People seeking unknown close relatives
  • People who already know who their close relatives are, but are seeking additional information or clues about their genealogy

I considered rating these on a 1 to 10 scale, but the relative usefulness of these tools is dependent on many factors, so different tools will be more or less useful to different people.

For example, ethnicity is very useful if someone is admixed from different populations, or even 100% of a specific endogamous population. It’s less useful if the tester is 100% European, regardless of whether they are seeking close relatives or not. Conversely, even “vanilla” ethnicity can be used to rule out majority or recent admixture with many populations.

Tools Unknown Close Relative Seekers Known Close Relatives – Enhance Genealogy
Ethnicity Yes, to identify or rule out populations Yes
Ethnicity Painting Yes, possibly, depending on population Yes, possibly, depending on population
Ethnicity Phasing Yes, possibly, depending on population Yes, possibly, depending on population
DNA Communities Yes, possibly, depending on population Yes, possibly, depending on population
Genetic Groups Possibly, depending on population Possibly, depending on population
Family Matching aka Bucketing Not if parents are entirely unknown, but yes if one parent is known Yes
Chromosome Browser Unlikely Yes
AutoClusters Yes Yes, especially at MyHeritage if Jewish
Estimated Relationships High Not No
Relationship Range High Not reliably No
More, Smaller Segments Unlikely Unlikely other than confirmation
Match List Download Yes Yes
Surnames Yes Yes
Locations Yes Yes
Projects Yes Yes
Y DNA Yes, males only, direct paternal line, identifies surname lineage Yes, males only, direct paternal line, identifies and correctly places surname lineage
Mitochondrial DNA Yes, both sexes, direct matrilineal line only Yes, both sexes, direct matrilineal line only
Public Y Tree Yes for locations Yes for locations
Public Mito Tree Yes for locations Yes for locations
Discover Y DNA Yes, for heritage information Yes, for heritage information
Parents Related – ROH Possibly Less useful

Acknowledgments

A HUGE thank you to several people who contributed images and information in order to provide accurate and expanded information on the topic of endogamy. Many did not want to be mentioned by name, but you know who you are!!!

If you have information to add, please post in the comments.

_____________________________________________________________

Follow DNAexplain on Facebook, here or follow me on Twitter, here.

Share the Love!

You’re always welcome to forward articles or links to friends and share on social media.

If you haven’t already subscribed (it’s free,) you can receive an email whenever I publish by clicking the “follow” button on the main blog page, here.

You Can Help Keep This Blog Free

I receive a small contribution when you click on some of the links to vendors in my articles. This does NOT increase the price you pay but helps me to keep the lights on and this informational blog free for everyone. Please click on the links in the articles or to the vendors below if you are purchasing products or DNA testing.

Thank you so much.

DNA Purchases and Free Uploads

Genealogy Products and Services

My Book

Genealogy Books

Genealogy Research

How to Download Your DNA Match Lists & Segment Files

If you’ve taken an autosomal DNA test and you’re working to determine how your matches are related to you, meaning which ancestors you share, you’ll want to download your DNA match list.

There are three types of files that you can potentially download from each of the major autosomal DNA testing vendors.

Raw DNA file – If you want to upload your DNA file to another vendor for matching at their site (MyHeritage and FamilyTreeDNA,) you’ll need to download your raw data file from the vendor where you tested. I provided step-by-step instructions for this process at each of the vendors, here.

DNA Segment File – This file contains the segment information with each of your matches, including the start and end locations of your matching segment(s), the total number of matching (shared) centiMorgans (cM) above the vendor’s matching threshold, and sometimes the longest segment.

If you want to sort a spreadsheet to look for all of your matches on specific areas of chromosomes, this is the best way to achieve that goal. I use this information at DNAPainter when painting the segments of matches with whom I can identify a common ancestor.

You may be able to download filtered lists or individual match data as well, as opposed to an entire match list spreadsheet, but the methodology varies at each vendor.

Ancestry does not provide segment information at all. 23and Me combines this information with the next file.

Match List – This file will contain your list of matches along with other information about the matches which you will find genealogically helpful. I find using this file easier than viewing each match separately at the vendors when trying to obtain an overview or when searching for a particular surname in either my match list or their ancestral surnames.

I can also sort by haplogroup, for example, which can sometimes help immensely if that information is available.

Ancestry does not facilitate or allow downloading your match list. 23andMe combines this information with your matching DNA segments in one file.

Here’s a handy-dandy summary by testing vendor.

Vendor Raw DNA File DNA Segment File Match List
23andMe Yes, instructions here Yes, instructions in this article Yes, instructions in this article
FamilyTreeDNA Yes, instructions here Yes, instructions in this article Yes, instructions in this article
MyHeritage Yes, instructions here Yes, instructions in this article Yes, instructions in this article
Ancestry Yes, instructions here No, does not provide No, does not provide

I’ve written step-by-step instructions for how to download your Match List and DNA Segment file(s) at each vendor.

23andMe

Please note that 23and Me is the only vendor to limit your matches, which means you will only receive a file containing:

  • 1500 matches if you tested before the V5 chip, so before August 9, 2017, and have not established communications with matches that would have rolled off of your list otherwise. (I have 1805 matches, so have established contact with 305 that would otherwise have rolled off the end.)
  • 1500 if you tested on the V5 chip, so beginning August 9, 2017, but did not establish communications OR did not purchase the health option, OR did not purchase the yearly membership. If you established communications, those matches won’t roll off, and if you purchase the membership, the match threshold is raised. You may still need to establish contact to keep people from rolling off the larger list as well.
  • 5000-ish (23andMe doesn’t say exactly) if you tested on the V5 chip for BOTH ancestry and healthy AND purchased the yearly membership.

You will only receive match information for people who are listed on your restricted match list, not people who have rolled off as closer matches arrived. Therefore, I encourage you to retain your old match lists because some of your matches will be gone each time you download.

23andMe combines your match list with your segment file.

Sign on and select DNA Relatives on the toolbar.

Next, select “See all relatives.”

Scroll to the very bottom and click on Request DNA Relatives Data Download.

Your file will be prepared, and you’ll receive an email when the file is ready to be downloaded. Mine only took a minute or two, and I simply waited on my 23andMe page until the message appeared.

Save and open the downloaded file, and you’ll see a variety of information about each of your matches, in closest-match-first order, including:

  • Match name
  • Chromosome segment match information, including start and end locations, genetic distance (centiMorgans cMs,) and SNPs
  • Maternal and paternal sides if your parent or parents have tested
  • Number of matching segments
  • Relationship information
  • Birth year
  • Percent shared DNA
  • Haplogroups
  • Notes you’ve made
  • Family surnames
  • Family locations
  • 4 Grandparents’ birth country
  • Family Tree URL, external to 23andMe, if provided by tester

FamilyTreeDNA

At FamilyTreeDNA, your match list and segment information are contained in two separate files.

Sign on and click on Family Finder Matches under Autosomal DNA Results and Tools.

You’ll see your matches. At the top of your match list, on the right side, click on “Export CSV.”

You can select “All Matches” or “Filtered Matches.”

If you haven’t selected a filter, you won’t be able to make that selection. Generally, you want the entire match list.

Your match list will be prepared and downloaded.

You’ll find:

  • Match name
  • Relationship information
  • Shared DNA total
  • Longest segment
  • Linked relationship if you have linked that person to their profile card in your tree
  • Ancestral surnames
  • Haplogroups if tested
  • Notes you’ve made
  • Bucketing – Paternal, maternal, both, none
  • X-Match amount

Note – If you’re a male, valid X matches (meaning matches that are not identical by chance,) will always be on your maternal side because you received your Y chromosome from your father instead of a copy of his X. I wrote about X matching, here.

If your match is a male, an X match will always be through his mother’s line.

Segment information is available in a separate download on the chromosome browser page.

Under Autosomal DNA Results and Tools, click on the Chromosome Browser.

You’ll be able to select people to compare in the chromosome browser, but to download all of your matching segments to all of your matches, click on “Download All Segments.”

If you select people to compare your relationship, and then click on “Download Segments,” you’ll only be downloading the segments for the people you are comparing.

To download all of your segments, be sure the “All” is showing in the link and download before selecting anyone for comparison.

MyHeritage

MyHeritage also provides two separate files for matches and chromosome segment information.

Select DNA matches, then the 3-dot menu, then “Export DNA Matches.”

If you also want your individual segment information for your matches, also order the second file on that menu, “Export shared DNA segment info for shared DNA matches.”.

You’ll see a message that your report is being prepared and will be sent to the email address on file.

If your file doesn’t appear in your email box, check your spam folder.

Your match list provides:

  • Match name
  • Age
  • Country
  • Contact link
  • DNA managed by (if not the tester)
  • Contact link for DNA manager
  • Relationship information
  • Total cM
  • Percent of matching DNA
  • Number of matching segments
  • Largest segment
  • Has tree and tree manager
  • Number of people in their tree
  • Tree link and link to contact tree manager
  • Number of SmartMatches
  • Shared ancestral surnames
  • All ancestral surnames
  • Notes you’ve made
  • Has Theory of Family Relativity

Now that you have these files, what do you do with them?

Evaluating

Is there anything that stands out as remarkable, perhaps that you didn’t know or notice before? Patterns that might be informative?

I had a huge brick wall on my mother’s side that has since fallen, but retrospectively, had I reviewed these lists when that wall was still standing firm, there was a huge hint just waiting for me.

My mother has a very unexpected Acadian line through her great-grandfather, Anthony Lore, so 12.5% of her heritage.

On my match list, I see a large number of French surnames, but I didn’t know of any French ancestors on either side of my tree. Many surnames repeat, such as LeBlanc, d’Entremont (which is really unusual), Landry, and deForest. Why were these people on my match list? This is definitely smoke, and there must be fire someplace, but where?

Looking at the locations associated with these matches’ ancestors would have provided additional clues.

However, simply googling my great-grandfather’s surname in combination with those French surnames I listed above produced these 3 top search results.

Yes, you guessed it. Anthony turned out to be “Antoine” and Lore is spelled in a variety of ways, including Lord. His family is Acadian.

That’s Anthony Lore, which is how he was listed on the death certificate of his son, in the software on my computer, above, and here is Antoine Lore at WikiTree, below.

As you can see, that brick wall falling opened a whole new group of ancestors, and along with it, my appreciation of endogamy😊

Match lists facilitate viewing the big picture and can be a very useful tool for people seeking unknowns or trying to group people together in a variety of ways.

Do you have any brick walls that need to fall?

How can or do you utilize your match lists?

_____________________________________________________________

Follow DNAexplain on Facebook, here or follow me on Twitter, here.

Share the Love!

You’re always welcome to forward articles or links to friends and share on social media.

If you haven’t already subscribed (it’s free,) you can receive an email whenever I publish by clicking the “follow” button on the main blog page, here.

You Can Help Keep This Blog Free

I receive a small contribution when you click on some of the links to vendors in my articles. This does NOT increase the price you pay but helps me to keep the lights on and this informational blog free for everyone. Please click on the links in the articles or to the vendors below if you are purchasing products or DNA testing.

Thank you so much.

DNA Purchases and Free Uploads

Genealogy Products and Services

My Book

Genealogy Books

Genealogy Research