It’s that time again, to look over the year that has just passed and take stock of what has happened in the genetic genealogy world. I wrote a review in both 2012 and 2013 as well. Looking back, these momentous happenings seem quite “old hat” now. For example, both www.GedMatch.com and www.DNAGedcom.com, once new, have become indispensable tools that we take for granted. Please keep in mind that both of these tools (as well as others in the Tools section, below) depend on contributions, although GedMatch now has a tier 1 subscription offering for $10 per month as well.
So what was the big news in 2014?
Beyond the Tipping Point
Genetic genealogy has gone over the tipping point. Genetic genealogy is now, unquestionably, mainstream and lots of people are taking part. From the best I can figure, there are now approaching or have surpassed three million tests or test records, although certainly some of those are duplicates.
- 500,000+ at 23andMe
- 700,000+ at Ancestry
- 700,000+ at Genographic
The organizations above represent “one-test” companies. Family Tree DNA provides various kinds of genetic genealogy tests to the community and they have over 380,000 individuals with more than 700,000 test records.
In addition to the above mentioned mainstream firms, there are other companies that provide niche testing, often in addition to Family Tree DNA Y results.
In addition, there is what I would refer to as a secondary market for testing as well which certainly attracts people who are not necessarily genetic genealogists but who happen across their corporate information and decide the test looks interesting. There is no way of knowing how many of those tests exist.
Additionally, there is still the Sorenson data base with Y and mtDNA tests which reportedly exceeded their 100,000 goal.
Spencer Wells spoke about the “viral spread threshold” in his talk in Houston at the International Genetic Genealogy Conference in October and terms 2013 as the year of infection. I would certainly agree.

Autosomal Now the New Normal
Another change in the landscape is that now, autosomal DNA has become the “normal” test. The big attraction to autosomal testing is that anyone can play and you get lots of matches. Earlier in the year, one of my cousins was very disappointed in her brother’s Y DNA test because he only had a few matches, and couldn’t understand why anyone would test the Y instead of autosomal where you get lots and lots of matches. Of course, she didn’t understand the difference in the tests or the goals of the tests – but I think as more and more people enter the playground – percentagewise – fewer and fewer do understand the differences.
Case in point is that someone contacted me about DNA and genealogy. I asked them which tests they had taken and where and their answer was “the regular one.” With a little more probing, I discovered that they took Ancestry’s autosomal test and had no clue there were any other types of tests available, what they could tell him about his ancestors or genetic history or that there were other vendors and pools to swim in as well.
A few years ago, we not only had to explain about DNA tests, but why the Y and mtDNA is important. Today, we’ve come full circle in a sense – because now we don’t have to explain about DNA testing for genealogy in general but we still have to explain about those “unknown” tests, the Y and mtDNA. One person recently asked me, “oh, are those new?”
Ancient DNA
This year has seen many ancient DNA specimens analyzed and sequenced at the full genomic level.
The year began with a paper titled, “When Populations Collide” which revealed that contemporary Europeans carry between 1-4% of Neanderthal DNA most often associated with hair and skin color, or keratin. Africans, on the other hand, carry none or very little Neanderthal DNA.
http://dna-explained.com/2014/01/30/neanderthal-genome-further-defined-in-contemporary-eurasians/
A month later, a monumental paper was published that detailed the results of sequencing a 12,500 Clovis child, subsequently named Anzick or referred to as the Anzick Clovis child, in Montana. That child is closely related to Native American people of today.
http://dna-explained.com/2014/02/13/clovis-people-are-native-americans-and-from-asia-not-europe/
In June, another paper emerged where the authors had analyzed 8000 year old bones from the Fertile Crescent that shed light on the Neolithic area before the expansion from the Fertile Crescent into Europe. These would be the farmers that assimilated with or replaced the hunter-gatherers already living in Europe.
http://dna-explained.com/2014/06/09/dna-analysis-of-8000-year-old-bones-allows-peek-into-the-neolithic/
Svante Paabo is the scientist who first sequenced the Neanderthal genome. Here is a  great interview and speech. This man is so interesting. If you have not read his book, “Neanderthal Man, In Search of Lost Genomes,” I strongly recommend it.
http://dna-explained.com/2014/07/22/finding-your-inner-neanderthal-with-evolutionary-geneticist-svante-paabo/
In the fall, yet another paper was released that contained extremely interesting information about the peopling and migration of humans across Europe and Asia. This was just before Michael Hammer’s presentation at the Family Tree DNA conference, so I covered the paper along with Michael’s information about European ancestral populations in one article. The take away messages from this are two-fold. First, there was a previously undefined “ghost population” called Ancient North Eurasian (ANE) that is found in the northern portion of Asia that contributed to both Asian populations, including those that would become the Native Americans and European populations as well. Secondarily, the people we thought were in Europe early may not have been, based on the ancient DNA remains we have to date. Of course, that may change when more ancient DNA is fully sequenced which seems to be happening at an ever-increasing rate.
http://dna-explained.com/2014/10/21/peopling-of-europe-2014-identifying-the-ghost-population/

Ancient DNA Available for Citizen Scientists
If I were to give a Citizen Scientist of the Year award, this year’s award would go unquestionably to Felix Chandrakumar for his work with the ancient genome files and making them accessible to the genetic genealogy world. Felix obtained the full genome files from the scientists involved in full genome analysis of ancient remains, reduced the files to the SNPs utilized by the autosomal testing companies in the genetic genealogy community, and has made them available at GedMatch.
http://dna-explained.com/2014/09/22/utilizing-ancient-dna-at-gedmatch/
If this topic is of interest to you, I encourage you to visit his blog and read his many posts over the past several months.
https://plus.google.com/+FelixChandrakumar/posts
The availability of these ancient results set off a sea of comparisons. Many people with Native heritage matched Anzick’s file at some level, and many who are heavily Native American, particularly from Central and South America where there is less admixture match Anzick at what would statistically be considered within a genealogical timeframe. Clearly, this isn’t possible, but it does speak to how endogamous populations affect DNA, even across thousands of years.
http://dna-explained.com/2014/09/23/analyzing-the-native-american-clovis-anzick-ancient-results/
Because Anzick is matching so heavily with the Mexican, Central and South American populations, it gives us the opportunity to extract mitochondrial DNA haplogroups from the matches that either are or may be Native, if they have not been recorded before.
http://dna-explained.com/2014/09/23/analyzing-the-native-american-clovis-anzick-ancient-results/
Needless to say, the matches of these ancient kits with contemporary people has left many people questioning how to interpret the results. The answer is that we don’t really know yet, but there is a lot of study as well as speculation occurring. In the citizen science community, this is how forward progress is made…eventually.
http://dna-explained.com/2014/09/25/ancient-dna-matches-what-do-they-mean/
http://dna-explained.com/2014/09/30/ancient-dna-matching-a-cautionary-tale/
More ancient DNA samples for comparison:
http://dna-explained.com/2014/10/04/more-ancient-dna-samples-for-comparison/
A Siberian sample that also matches the Malta Child whose remains were analyzed in late 2013.
http://dna-explained.com/2014/11/12/kostenki14-a-new-ancient-siberian-dna-sample/
Felix has prepared a list of kits that he has processed, along with their GedMatch numbers and other relevant information, like gender, haplogroup(s), age and location of sample.
http://www.y-str.org/p/ancient-dna.html
Furthermore, in a collaborative effort with Family Tree DNA, Felix formed an Ancient DNA project and uploaded the ancient autosomal files. This is the first time that consumers can match with Ancient kits within the vendor’s data bases.
https://www.familytreedna.com/public/Ancient_DNA
Recently, GedMatch added a composite Archaic DNA Match comparison tool where your kit number is compared against all of the ancient DNA kits available. The output is a heat map showing which samples you match most closely.

Indeed, it has been a banner year for ancient DNA and making additional discoveries about DNA and our ancestors. Thank you Felix.
Haplogroup Definition
That SNP tsunami that we discussed last year…well, it made landfall this year and it has been storming all year long…in a good way. At least, ultimately, it will be a good thing. If you asked the haplogroup administrators today about that, they would probably be too tired to answer – as they’ve been quite overwhelmed with results.
The Big Y testing has been fantastically successful. This is not from a Family Tree DNA perspective, but from a genetic genealogy perspective. Branches have been being added to and sawed off of the haplotree on a daily basis. This forced the renaming of the haplogroups from the old traditional R1b1a2 to R-M269 in 2012. While there was some whimpering then, it would be nothing like the outright wailing now that would be occurring as haplogroup named reached 20 or so digits.
Alice Fairhurst discussed the SNP tsunami at the DNA Conference in Houston in October and I’m sure that the pace hasn’t slowed any between now and then. According to Alice, in early 2014, there were 4115 individual SNPs on the ISOGG Tree, and as of the conference, there were 14,238 SNPs, with the 2014 addition total at that time standing at 10,213. That is over 1000 per month or about 35 per day, every day.
Yes, indeed, that is the definition of a tsunami. Every one of those additions requires one of a number of volunteers, generally haplogroup project administrators to evaluate the various Big Y results, the SNPs and novel variants included, where they need to be inserted in the tree and if branches need to be rearranged. In some cases, naming request for previously unknown SNPs also need to be submitted. This is all done behind the scenes and it’s not trivial.
The project I’m closest to is the R1b L-21 project because my Estes males fall into that group. We’ve tested several, and I’ll be writing an article as soon as the final test is back.
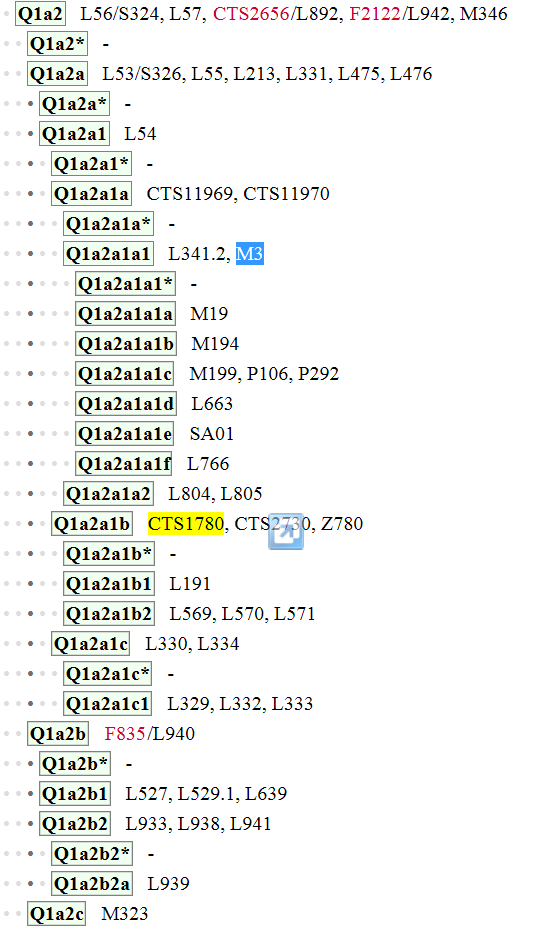
The tree has grown unbelievably in this past year just within the L21 group. This project includes over 700 individuals who have taken the Big Y test and shared their results which has defined about 440 branches of the L21 tree. Currently there are almost 800 kits available if you count the ones on order and the 20 or so from another vendor.
Here is the L21 tree in January of 2014

Compare this with today’s tree, below.

Michael Walsh, Richard Stevens, David Stedman need to be commended for their incredible work in the R-L21 project. Other administrators are doing equivalent work in other haplogroup projects as well. I big thank you to everyone. We’d be lost without you!
One of the results of this onslaught of information is that there have been fewer and fewer academic papers about haplogroups in the past few years. In essence, by the time a paper can make it through the peer review cycle and into publication, the data in the paper is often already outdated relative to the Y chromosome. Recently a new paper was released about haplogroup C3*. While the data is quite valid, the authors didn’t utilize the new SNP naming nomenclature. Before writing about the topic, I had to translate into SNPese. Fortunately, C3* has been relatively stable.
http://dna-explained.com/2014/12/23/haplogroup-c3-previously-believed-east-asian-haplogroup-is-proven-native-american/
10th Annual International Conference on Genetic Genealogy
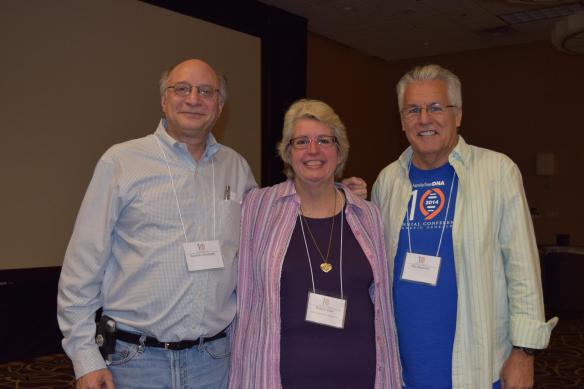
The Family Tree DNA International Conference on Genetic Genealogy for project administrators is always wonderful, but this year was special because it was the 10th annual. And yes, it was my 10th year attending as well. In all these years, I had never had a photo with both Max and Bennett. Everyone is always so busy at the conferences. Getting any 3 people, especially those two, in the same place at the same time takes something just short of a miracle.
Ten years ago, it was the first genetic genealogy conference ever held, and was the only place to obtain genetic genealogy education outside of the rootsweb genealogy DNA list, which is still in existence today. Family Tree DNA always has a nice blend of sessions. I always particularly appreciate the scientific sessions because those topics generally aren’t covered elsewhere.
http://dna-explained.com/2014/10/11/tenth-annual-family-tree-dna-conference-opening-reception/
http://dna-explained.com/2014/10/12/tenth-annual-family-tree-dna-conference-day-2/
http://dna-explained.com/2014/10/13/tenth-annual-family-tree-dna-conference-day-3/
http://dna-explained.com/2014/10/15/tenth-annual-family-tree-dna-conference-wrapup/
Jennifer Zinck wrote great recaps of each session and the ISOGG meeting.
http://www.ancestorcentral.com/decennial-conference-on-genetic-genealogy/
http://www.ancestorcentral.com/decennial-conference-on-genetic-genealogy-isogg-meeting/
http://www.ancestorcentral.com/decennial-conference-on-genetic-genealogy-sunday/
I thank Family Tree DNA for sponsoring all 10 conferences and continuing the tradition. It’s really an amazing feat when you consider that 15 years ago, this industry didn’t exist at all and wouldn’t exist today if not for Max and Bennett.
Education
Two educational venues offered classes for genetic genealogists and have made their presentations available either for free or very reasonably. One of the problems with genetic genealogy is that the field is so fast moving that last year’s session, unless it’s the very basics, is probably out of date today. That’s the good news and the bad news.
http://dna-explained.com/2014/11/12/genetic-genealogy-ireland-2014-presentations
http://dna-explained.com/2014/09/26/educational-videos-from-international-genetic-genealogy-conference-now-available/
In addition, three books have been released in 2014.
In January, Emily Aulicino released Genetic Genealogy, The Basics and Beyond.

In October, Richard Hill released “Guide to DNA Testing: How to Identify Ancestors, Confirm Relationships and Measure Ethnicity through DNA Testing.”

Most recently, David Dowell’s new book, NextGen Genealogy: The DNA Connection was released right after Thanksgiving.
Ancestor Reconstruction – Raising the Dead
This seems to be the year that genetic genealogists are beginning to reconstruct their ancestors (on paper, not in the flesh) based on the DNA that the ancestors passed on to various descendants. Those segments are “gathered up” and reassembled in a virtual ancestor.
I utilized Kitty Cooper’s tool to do just that.
http://dna-explained.com/2014/10/03/ancestor-reconstruction/
 I know it doesn’t look like much yet but this is what I’ve been able to gather of Henry Bolton, my great-great-great-grandfather.
Kitty did it herself too.
http://blog.kittycooper.com/2014/08/mapping-an-ancestral-couple-a-backwards-use-of-my-segment-mapper/
http://blog.kittycooper.com/2014/09/segment-mapper-tool-improvements-another-wold-dna-map/
Ancestry.com wrote a paper about the fact that they have figured out how to do this as well in a research environment.
http://corporate.ancestry.com/press/press-releases/2014/12/ancestrydna-reconstructs-partial-genome-of-person-living-200-years-ago/
http://www.thegeneticgenealogist.com/2014/12/16/ancestrydna-recreates-portions-genome-david-speegle-two-wives/
GedMatch has created a tool called, appropriately, Lazarus that does the same thing, gathers up the DNA of your ancestor from their descendants and reassembles it into a DNA kit.
Blaine Bettinger has been working with and writing about his experiences with Lazarus.
http://www.thegeneticgenealogist.com/2014/10/20/finally-gedmatch-announces-monetization-strategy-way-raise-dead/
http://www.thegeneticgenealogist.com/2014/12/09/recreating-grandmothers-genome-part-1/
http://www.thegeneticgenealogist.com/2014/12/14/recreating-grandmothers-genome-part-2/
Tools
Speaking of tools, we have some new tools that have been introduced this year as well.
Genome Mate is a desktop tool used to organize data collected by researching DNA comparsions and aids in identifying common ancestors. I have not used this tool, but there are others who are quite satisfied. It does require Microsoft Silverlight be installed on your desktop.
The Autosomal DNA Segment Analyzer is available through www.dnagedcom.com and is a tool that I have used and found very helpful. It assists you by visually grouping your matches, by chromosome, and who you match in common with.

Charting Companion from Progeny Software, another tool I use, allows you to colorize and print or create pdf files that includes X chromosome groupings. This greatly facilitates seeing how the X is passed through your ancestors to you and your parents.

WikiTree is a free resource for genealogists to be able to sort through relationships involving pedigree charts. In November, they announced Relationship Finder.
Probably the best example I can show of how WikiTree has utilized DNA is using the results of King Richard III.

By clicking on the DNA icon, you see the following:

And then Richard’s Y, mitochondrial and X chromosome paths.

Since Richard had no descendants, to see how descendants work, click on his mother, Cecily of York’s DNA descendants and you’re shown up to 10 generations.

While this isn’t terribly useful for Cecily of York who lived and died in the 1400s, it would be incredibly useful for finding mitochondrial descendants of my ancestor born in 1802 in Virginia. I’d love to prove she is the daughter of a specific set of parents by comparing her DNA with that of a proven daughter of those parents! Maybe I’ll see if I can find her parents at WikiTree.
Kitty Cooper’s blog talks about additional tools. I have used Kitty’s Chromosome mapping tools as discussed in ancestor reconstruction.
Felix Chandrakumar has created a number of fun tools as well. Take a look. I have not used most of these tools, but there are several I’ll be playing with shortly.
Exits and Entrances
With very little fanfare, deCODEme discontinued their consumer testing and reminded people to download their date before year end.
http://dna-explained.com/2014/09/30/decodeme-consumer-tests-discontinued/
I find this unfortunate because at one time, deCODEme seemed like a company full of promise for genetic genealogy. They failed to take the rope and run.
On a sad note, Lucas Martin who founded DNA Tribes unexpectedly passed away in the fall. DNA Tribes has been a long-time player in the ethnicity field of genetic genealogy. I have often wondered if Lucas Martin was a pseudonym, as very little information about Lucas was available, even from Lucas himself. Neither did I find an obituary. Regardless, it’s sad to see someone with whom the community has worked for years pass away. The website says that they expect to resume offering services in January 2015. I would be cautious about ordering until the structure of the new company is understood.
http://www.dnatribes.com/
In the last month, a new offering has become available that may be trying to piggyback on the name and feel of DNA Tribes, but I’m very hesitant to provide a link until it can be determined if this is legitimate or bogus. If it’s legitimate, I’ll be writing about it in the future.
However, the big news exit was Ancestry’s exit from the Y and mtDNA testing arena. We suspected this would happen when they stopped selling kits, but we NEVER expected that they would destroy the existing data bases, especially since they maintain the Sorenson data base as part of their agreement when they obtained the Sorenson data.
http://dna-explained.com/2014/10/02/ancestry-destroys-irreplaceable-dna-database/
The community is still hopeful that Ancestry may reverse that decision.
Ancestry – The Chromosome Browser War and DNA Circles
There has been an ongoing battle between Ancestry and the more seasoned or “hard-core” genetic genealogists for some time – actually for a long time.
The current and most long-standing issue is the lack of a chromosome browser, or any similar tools, that will allow genealogists to actually compare and confirm that their DNA match is genuine. Ancestry maintains that we don’t need it, wouldn’t know how to use it, and that they have privacy concerns.
Other than their sessions and presentations, they had remained very quiet about this and not addressed it to the community as a whole, simply saying that they were building something better, a better mousetrap.
In the fall, Ancestry invited a small group of bloggers and educators to visit with them in an all-day meeting, which came to be called DNA Day.
http://dna-explained.com/2014/10/08/dna-day-with-ancestry/
In retrospect, I think that Ancestry perceived that they were going to have a huge public relations issue on their hands when they introduced their new feature called DNA Circles and in the process, people would lose approximately 80% of their current matches. I think they were hopeful that if they could educate, or convince us, of the utility of their new phasing techniques and resulting DNA Circles feature that it would ease the pain of people’s loss in matches.
I am grateful that they reached out to the community. Some very useful dialogue did occur between all participants. However, to date, nothing more has happened nor have we received any additional updates after the release of Circles.
Time will tell.
http://dna-explained.com/2014/11/18/in-anticipation-of-ancestrys-better-mousetrap/
http://dna-explained.com/2014/11/19/ancestrys-better-mousetrap-dna-circles/

DNA Circles, while interesting and somewhat useful, is certainly NOT a replacement for a chromosome browser, nor is it a better mousetrap.
http://dna-explained.com/2014/11/30/chromosome-browser-war/
In fact, the first thing you have to do when you find a DNA Circle that you have not verified utilizing raw data and/or chromosome browser tools from either 23andMe, Family Tree DNA or Gedmatch, is to talk your matches into transferring their DNA to Family Tree DNA or download to Gedmatch, or both.
http://dna-explained.com/2014/11/27/sarah-hickerson-c1752-lost-ancestor-found-52-ancestors-48/
I might add that the great irony of finding the Hickerson DNA Circle that led me to confirm that ancestry utilizing both Family Tree DNA and GedMatch is that today, when I checked at Ancestry, the Hickerson DNA Circle is no longer listed. So, I guess I’ve been somehow pruned from the circle. I wonder if that is the same as being voted off of the island. So, word to the wise…check your circles often…they change and not always in the upwards direction.
The Seamy Side – Lies, Snake Oil Salesmen and Bullys
Unfortunately a seamy side, an underbelly that’s rather ugly has developed in and around the genetic genealogy industry. I guess this was to be expected with the rapid acceptance and increasing popularity of DNA testing, but it’s still very unfortunate.
Some of this I expected, but I didn’t expect it to be so…well…blatant.
I don’t watch late night TV, but I’m sure there are now DNA diets and DNA dating and just about anything else that could be sold with the allure of DNA attached to the title.
I googled to see if this was true, and it is, although I’m not about to click on any of those links.


Unfortunately, within the ever-growing genetic genealogy community a rather large rift has developed over the past couple of years. Obviously everyone can’t get along, but this goes beyond that. When someone disagrees, a group actively “stalks” the person, trying to cost them their employment, saying hate filled and untrue things and even going so far as to create a Facebook page titled “Against<personname>.” That page has now been removed, but the fact that a group in the community found it acceptable to create something like that, and their friends joined, is remarkable, to say the least. That was accompanied by death threats.
Bullying behavior like this does not make others feel particularly safe in expressing their opinions either and is not conducive to free and open discussion. As one of the law enforcement officers said, relative to the events, “This is not about genealogy. I don’t know what it is about, yet, probably money, but it’s not about genealogy.”
Another phenomenon is that DNA is now a hot topic and is obviously “selling.” Just this week, this report was published, and it is, as best we can tell, entirely untrue.
http://worldnewsdailyreport.com/usa-archaeologists-discover-remains-of-first-british-settlers-in-north-america/
There were several tip offs, like the city (Lanford) and county (Laurens County) is not in the state where it is attributed (it’s in SC not NC), and the name of the institution is incorrect (Johns Hopkins, not John Hopkins). Additionally, if you google the name of the magazine, you’ll see that they specialize in tabloid “faux reporting.” It also reads a lot like the King Richard genuine press release.
http://urbanlegends.about.com/od/Fake-News/tp/A-Guide-to-Fake-News-Websites.01.htm
Earlier this year, there was a bogus institutional site created as well.
On one of the DNA forums that I frequent, people often post links to articles they find that are relevant to DNA. There was an interesting article, which has now been removed, correlating DNA results with latitude and altitude. I thought to myself, I’ve never heard of that…how interesting. Here’s part of what the article said:
Researchers at Aberdeen College’s Havering Centre for Genetic Research have discovered an important connection between our DNA and where our ancestors used to live.
Tiny sequence variations in the human genome sometimes called Single Nucleotide Polymorphisms (SNPs) occur with varying frequency in our DNA. These have been studied for decades to understand the major migrations of large human populations. Now Aberdeen College’s Dr. Miko Laerton and a team of scientists have developed pioneering research that shows that these differences in our DNA also reveal a detailed map of where our own ancestors lived going back thousands of years.
Dr. Laerton explains: “Certain DNA sequence variations have always been important signposts in our understanding of human evolution because their ages can be estimated. We’ve known for years that they occur most frequently in certain regions [of DNA], and that some alleles are more common to certain geographic or ethnic groups, but we have never fully understood the underlying reasons. What our team found is that the variations in an individual’s DNA correlate with the latitudes and altitudes where their ancestors were living at the time that those genetic variations occurred. We’re still working towards a complete understanding, but the knowledge that sequence variations are connected to latitude and altitude is a huge breakthrough by itself because those are enough to pinpoint where our ancestors lived at critical moments in history.”
The story goes on, but at the bottom, the traditional link to the publication journal is found.
The full study by Dr. Laerton and her team was published in the September issue of the Journal of Genetic Science.
I thought to myself, that’s odd, I’ve never heard of any of these people or this journal, and then I clicked to find this.
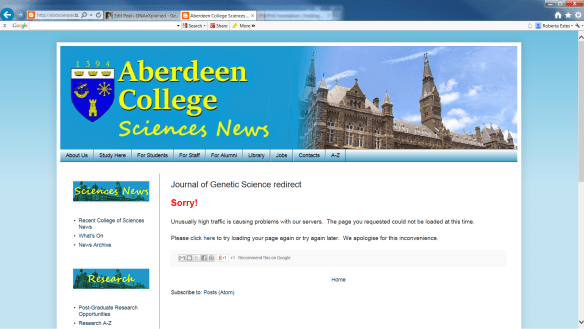
About that time, Debbie Kennett, DNA watchdog of the UK, posted this:
April Fools Day appears to have arrived early! There is no such institution as Aberdeen College founded in 1394. The University of Aberdeen in Scotland was founded in 1495 and is divided into three colleges: http://www.abdn.ac.uk/about/colleges-schools-institutes/colleges-53.php
The picture on the masthead of the “Aberdeen College” website looks very much like a photo of Aberdeen University. This fake news item seems to be the only live page on the Aberdeen College website. If you click on any other links, including the link to the so-called “Journal of Genetic Science”, you get a message that the website is experienced “unusually high traffic”. There appears to be no such journal anyway.
We also realized that Dr. Laerton, reversed, is “not real.”
I still have no idea why someone would invest the time and effort into the fake website emulating the University of Aberdeen, but I’m absolutely positive that their motives were not beneficial to any of us.
What is the take-away of all of this? Be aware, very aware, skeptical and vigilant. Stick with the mainstream vendors unless you realize you’re experimenting.
King Richard

The much anticipated and long-awaited DNA results on the remains of King Richard III became available with a very unexpected twist. While the science team feels that they have positively identified the remains as those of Richard, the Y DNA of Richard and another group of men supposed to have been descended from a common ancestor with Richard carry DNA that does not match.
http://dna-explained.com/2014/12/09/henry-iii-king-of-england-fox-in-the-henhouse-52-ancestors-49/
http://dna-explained.com/2014/12/05/mitochondrial-dna-mutation-rates-and-common-ancestors/
Debbie Kennett wrote a great summary article.
http://cruwys.blogspot.com/2014/12/richard-iii-and-use-of-dna-as-evidence.html
More Alike than Different
One of the life lessons that genetic genealogy has held for me is that we are more closely related that we ever knew, to more people than we ever expected, and we are far more alike than different. A recent paper recently published by 23andMe scientists documents that people’s ethnicity reflect the historic events that took place in the part of the country where their ancestors lived, such as slavery, the Trail of Tears and immigration from various worldwide locations.

From the 23andMe blog:
The study leverages samples of unprecedented size and precise estimates of ancestry to reveal the rate of ancestry mixing among American populations, and where it has occurred geographically:
- All three groups – African Americans, European Americans and Latinos – have ancestry from Africa, Europe and the Americas.
- Approximately 3.5 percent of European Americans have 1 percent or more African ancestry. Many of these European Americans who describe themselves as “white” may be unaware of their African ancestry since the African ancestor may be 5-10 generations in the past.
- European Americans with African ancestry are found at much higher frequencies in southern states than in other parts of the US.
The ancestry proportions point to the different regional impacts of slavery, immigration, migration and colonization within the United States:
- The highest levels of African ancestry among self-reported African Americans are found in southern states, especially South Carolina and Georgia.
- One in every 20 African Americans carries Native American ancestry.
- More than 14 percent of African Americans from Oklahoma carry at least 2 percent Native American ancestry, likely reflecting the Trail of Tears migration following the Indian Removal Act of 1830.
- Among self-reported Latinos in the US, those from states in the southwest, especially from states bordering Mexico, have the highest levels of Native American ancestry.
http://news.sciencemag.org/biology/2014/12/genetic-study-reveals-surprising-ancestry-many-americans?utm_campaign=email-news-weekly&utm_source=eloqua
23andMe provides a very nice summary of the graphics in the article at this link:
http://blog.23andme.com/wp-content/uploads/2014/10/Bryc_ASHG2014_textboxes.pdf
The academic article can be found here:
http://www.cell.com/ajhg/home
2015
So what does 2015 hold? I don’t know, but I can’t wait to find out. Hopefully, it holds more ancestors, whether discovered through plain old paper research, cousin DNA testing or virtually raised from the dead!
What would my wish list look like?
- More ancient genomes sequenced, including ones from North and South America.
- Ancestor reconstruction on a large scale.
- The haplotree becoming fleshed out and stable.
- Big Y sequencing combined with STR panels for enhanced genealogical research.
- Improved ethnicity reporting.
- Mitochondrial DNA search by ancestor for descendants who have tested.
- More tools, always more tools….
- More time to use the tools!
Here’s wishing you an ancestor filled 2015!
______________________________________________________________
Disclosure
I receive a small contribution when you click on some of the links to vendors in my articles. This does NOT increase the price you pay but helps me to keep the lights on and this informational blog free for everyone. Please click on the links in the articles or to the vendors below if you are purchasing products or DNA testing.
Thank you so much.
DNA Purchases and Free Transfers
Genealogy Services
Genealogy Research


