Autosomal DNA, Ancient Ancestors, Ethnicity and the Dandelion

 dandelion 1

Understanding our own ancient DNA is a little different than contemporary DNA that we use for genealogy, but it’s a continuum between the two with a very long umbilical cord between them, then, and now.  And just when you think you’re about to understand autosomal DNA transmission and how it works, the subject of ancient DNA comes up.  This is particularly perplexing when all you wanted in the first place was a simple answer to the question, “who am I and who were my ancestors?”  Well, as you’re probably figured out by now, there is no simple answer.

Inheritance

In a nutshell – we know that every generation gets divided by 50% when we’re talking about autosomal DNA transmission.

So you inherit 50% of the DNA of each of your parents.  They inherited 50% of the DNA of each of their parents, so you inherit ABOUT 25% of the DNA of each of your grandparents.

Did you see that word, about?  It’s important, because while you do inherit exactly 50% of the DNA of each parent, you don’t inherit exactly 25% of the DNA of each grandparent.  You can inherit a little less or a little more from either grandparent as your parents 50% that you’re going to receive is in the mixer.

This is also true for the 12.5% of each of your great-grandparents, and the 6.25% of each of your great-great-grandparents, and so forth, on up the line.

The chart below shows the percentages that you share from each generation.

Relationship to You Approximate % Of Their DNA You Share
Parents Exactly 50%
Grandparents 25
Great-grandparents 12.5
Great-great-grandparents 6.25
Great-great-great-grandparents 3.125
Great-great-great-great-grandparents 1.5625

Ethnicity

So, here’s the question posed by people trying to understand their ethnicity.

If I have 3% Melanesian (or Middle Eastern, Indo-Tibetan or fill-in-the-blank ethnicity), doesn’t that mean that one of my great-great-great-grandparents was Melanesian?

There are really two answers to this question.  (I can hear you groaning!!!)

If the amount is 25% (for example) and not very small amounts, then the answer would be yes, that is very likely what this is telling you.  Or maybe it’s telling you that you have two different great-grandparents who have 12.5 each – but those relatives are fairly close in time due to the amount of DNA that came from that region.  See, that was easy.

However, the answer changes when we’re down in the very small percentages, below 5%, often in the 1 and 2% range.  This answer isn’t nearly as straightforward.

The Dandelion – Your Ancestor

The answer is the dandelion.

dandelion 2

The dandelion is one of your ancestors who lived in the Middle East, let’s say, 20,000 years ago, maybe 30,000 years ago.  In case you’re counting generations, that is 800 to 1200 generations ago.  The percentage of DNA you would carry from a single ancestor who lived 20,000 years ago, assuming you only descended from that ancestor 1 time, is infinitesimally small.  There are more zeroes following that decimal point than I have patience to type.  Let’s call that ancestor Xenia and let’s say she is a female.

However, you did inherit DNA from many of your ancestors who lived 20,000 years ago, thousands of them, because all of them, through their descendants, make up the DNA you carry today.  So infinitesimally small or not, you do carry some of the DNA of some of those ancestors.  It’s just broken into extremely small pieces today and their individual contributions to you may be extremely small.  You don’t carry any DNA from some of them, actually, probably most of them, due to the recombination event, dividing their DNA in half, happening 800 times, give or take.

Now, given that your ancestors’ DNA is divided in every generation by approximately half, and we know there are about 3 billion base pairs on all of your chromosomes combined, this means that by generation 32 or 33, on average, you carry 1 segment from this ancestor.  By generation 45, you carry, on average, .00017 segments of this ancestor’s DNA.  And for those math aficionados among us, this is the mathematical notation for how much of our ancestor’s DNA we carry after 800 generations: 4.4991E-232.

But, we also know that this dividing in half, on the average, doesn’t always work exactly that way in reality, because some of those ancestors from 20,000 years ago did in fact pass their DNA to you, despite the infinitesimal odds against that happening.  Some of their DNA was passed intact generation after generation, to you, and you carry it today.  The DNA contributed by any one ancestor from 800 generations ago is probably limited to one or two locations, or bases, but still, it’s there, and it’s the combined DNA of those ancient ancestors that make us who we are today.

The autosomal DNA of any specific ancestor from long ago is probably too small and fragmented to recognize as “theirs” and attribute to them.  Of course, the beauty of Y DNA and mitochondrial is that it is passed in tact for all of those generations.  But for autosomal DNA and genealogy, we need hundreds of thousands of DNA pieces in a row from a particular ancestor to be recognizable as “theirs.”  When we measure DNA for genealogy, what we are measuring is both centiMorgans, a measure of distance between chromosome positions (length) and the number of contiguous SNP (Single Nucleotide Polymorphism) base locations that match (quantity).  The values from these calculations tells us how closely we are related to people, because remember, DNA is divided in each generation so there is a mathematically predictable amount we will share with specific relatives.

Here is an example from a Family Finder comparison table showing both centiMorgans and matching SNPs with a second cousin.

family finder table

The matching threshold for genealogical significance is either 5 or 7 cM depending on which of the major companies you are using.  At Family Tree DNA, if you match above the threshold, then you can view down to 1cM, which is the case above.  Another match criteria is the number of SNPs, or locations, matching contiguously.  Anything below about 500-800 is considered to be a population match, not a genealogical match, unless you also have a significant number of genealogical matches at higher cMs and segments with this person.

OK, where is all of this going?

Dispersion

Think of your ancestor 20,000 years ago as the dandelion.  Now, blow.

dandelion 3

Xenia lived in the Middle East.  Where might her descendants land, over time, with every new generation?  In Europe?  In Asia?  In India?  In America via the Native Americans through Asia?  In North Africa?  Where?

So let’s say that groups of descendants settle across the globe.  Let’s say that her mitochondrial haplogroup is X.  Yes, haplogroup X is found both in Europe and in Asia and in the Native Americans, so this is actually a good example.  So Xenia carried mitochondrial haplogroup X and we know for sure via mitochondrial DNA testing that indeed, Xenia’s seeds were scattered to all of the winds.  The only place we haven’t found Xenia’s children is in Subsaharan Africa and the Australian archipelago, at least not yet.

Ok, so now that we know where her children and their children went, let’s go back to ancient DNA.

Predictive DNA

The way ethnicity is determined is by studying the frequency with which a specific allele or group of alleles is found in any particular population.  Two “pure” examples come to mind.

The first example is the Duffy Null allele that is only found in the Subsaharan African populations.  Currently this marker is found in about 68% of American blacks and in 88-100% of African blacks.  If you have the Duffy Null allele, you have African heritage.  Of course, you don’t know which line or which ancestor it came from, or how far back in time, but it assures you that you do in fact have African heritage.  It could have been from an ancestor long ago.  It could have been very recent.  This is one of the factors considered when determining percentage of ethnicity.

A second example is the STR marker known as D9S919 which is present in about 30% of the Native American people.  The value of 9 at this marker is not known to be present in any other ethnic group, so this mutation occurred after the Native people migrated across Beringia into the Americas, but long enough ago to be present in many descendants.  There is also no other known marker that is only found only among Native Americans, although I expect as we move into full genome sequencing we will discover more.  You can test this marker individually at Family Tree DNA, which is the only lab that offers this test.  If you have the value of 9 at this marker, it confirms Native heritage, but if you don’t carry 9, it does NOT disprove Native heritage.  After all, many Native people don’t carry it.  Again, you don’t know how long ago this marker was introduced into your ancestry.

These two examples are very unique because the markers are found only in certain groups.  Generally, with the rest of the DNA values, they are found in different amounts, or frequencies, in different parts of the world and ethnic groups.

So, if you’re trying to determine the ethnicity of an individual, you’re going to compile a huge data base of percentages of DNA values found of Ancestrally Informative Markers (AIMs) in different parts of the world.

So, you would compare the participant’s values against your data base and you will come up with those regions or ethnicities that are present most often in your comparison.  This is exactly what the products and services that provide you with your ethnicity percentages do – and how accurate the results are depend highly on the data base itself, the amount of data, and the quality of data.  Dare I mention Ancestry’s issue that they’ve had since they first began offering their autosomal product over a year ago where everyone seems to have Scandinavian ancestry?  Ancestry doesn’t share with us their sources, so as a community we have no idea how they have come up with these numbers.

You can easily compare your autosomal results in nauseating detail at both 23andMe and Family Tree DNA by testing with both companies, or by testing with either 23andMe or Ancestry and transferring your autosomal results to Family Tree DNA.  All 3 of these companies will give you a somewhat different result, but they should be in the same ballpark.  You can also then download your raw data file from any of those vendors and upload it to www.gedmatch.com where you can then do ethnicity comparisons using a variety of tools.  These tools, an example shown below, will have much more variance and detail than the vendor’s tools or results.  And because of that, they tend to be more confusing as well.

gedmatch example

Many people with small amounts of minority admixture are disappointed with the results through the vendors, especially if their Native American admixture doesn’t show.  I wrote extensively about this in my series, The Autosomal Me, so I won’t rehash it here, but using the GedMatch tools is very enlightening, as you can see above with my results.  And do I really have Indo-Tibetan and Indo-Iranian ancestors?

Where’s Xenia?

Back to Xenia and her descendants.  Let’s say that Xenia’s descendants settled in four primary locations.  One is in the Middle East – they never left home.  One is in Asia and from there, to the Americans to become the Native Americans and lastly, to Europe.  Now let’s say there is a pocket of them in the Altai region of Asia and a pocket in France.  The Altai is the ancestral home of the Native Americans and could explain the Indo-Tibet result, above.  We’ll call that Central Asia.  And France is where my Acadian ancestors were from.  Hmmm….this is getting confusing.  To make matters even more confusing, I might well descend from both groups, who originally descended from Xenia.

Let’s say that I do in fact carry small segments of Xenia’s DNA.  Now let’s say that this same DNA is found in a group of people in Central Asia, maybe in Tibet, it’s published in an obscure journal someplace, and it finds its way into a data base.  Voila – there you go – I now have a match in Central Asia in a place called Indo-Tibet.  But do I really?

Does this mean that my ancestor was from Central Asia?  Not necessarily.  And if so, maybe not recently, but the people from that location for some reason share some of the DNA that I carry.  The question of course is why, how and when?

What this really means to you is a matter of degrees.  If you have a few matches from obscure regions, along with very small percentages, it is likely a result of the dandelion’s dispersion.  If you have a lot of matches, meaning a high percentage hit rate, from a particular region, pay attention, it probably has some genealogical significance.

It’s no wonder people are confused by this!  Now, just think how many dandelions you have.  In 15 generations, you have 32,768 ancestors.  In fact, this is how we know for sure that we all descend from the same ancestor multiple times.  Our number of ancestors quickly exceeds the world population.  In 30 (25 years) generations, in about the year 1263, we reach about 1 billion ancestors.  In 1750, there were 791 million people on Earth, in 1600, 580 million, in 1500, 458 million and in 1000, 310 million.

Ancestors - Years

We know that we very likely descend several times from a much smaller group of ancestors from isolated local populations.  However, just looking at the 32,000+ ancestors in 15 generations, it’s still an entire dandelion field!!!

???????????????????????????????????????????????????????????????????????

______________________________________________________________

Disclosure

I receive a small contribution when you click on some of the links to vendors in my articles. This does NOT increase the price you pay but helps me to keep the lights on and this informational blog free for everyone. Please click on the links in the articles or to the vendors below if you are purchasing products or DNA testing.

Thank you so much.

DNA Purchases and Free Transfers

Genealogy Services

Genealogy Research

The Autosomal Me – The Holy Grail – Identifying Native Genealogy Lines

holy grail

Sangreal – the Holy Grail.  We are finally here, Part 9 and the final article in our series.  The entire purpose of The Autosomal Me series has been to use our DNA and the clues it holds to identify minority admixture, in this case, Native American, and by identifying those Native segments, and building chromosomal clusters, to identify the family lines that contributed that Native admixture.  Articles 1-8 in the series set the stage, explained the process and walked us through the preparatory steps.  In this last article, we apply all of the ingredients, fasten the lid, shake and see what we come up with.  Let’s take a minute and look at the steps that got us to this point.

Part 1 was “The Autosomal Me – Unraveling Minority Admixture” and Part 2 was “The Autosomal Me – The Ancestors Speak.”  Part 1 discussed the technique we are going to use to unravel minority ancestry, and why it works.  Part two gave an example of the power of fragmented chromosomal mapping and the beauty of the results.

Part 3, “The Autosomal Me – Who Am I?,” reviewed using our pedigree charts to gauge expected results and how autosomal results are put into population buckets.

Part 4, “The Autosomal Me – Testing Company Results,” shows what to expect from all of the major testing companies, past and present, along with Dr. Doug McDonald’s analysis.

In Part 5, “The Autosomal Me – Rooting Around in the Weeds Using Third Party Tools,” we looked at 5 different third party tools and what they can tell us about our minority admixture that is not reported by the major testing companies because the segments are too small and fragmented.

In Part 6, “The Autosomal Me – DNA Analysis – Splitting Up” we began the analysis part of the data we’ve been gathering.   We looked at how to determine whether minority admixture on specific chromosomes came from which parent.

Part 7, “The Autosomal Me – Start, Stop, Go – Identifying Native Chromosomal Segments” took a deeper dive and focused on the two chromosomes with proven Native heritage and began by comparing those chromosome segments using the 4 GedMatch admixture tools.

Part 8, “The Autosomal Me – Extracting Data Segments and Clustering,” we  extract all of the Native and Blended Asian segments in all 22 chromosomes, but only used chromosomes 1 and 2 for illustration purposes.  We then clustered the resulting data to look for trends, grouping clusters by either the Strong Native criteria or the Blended Asian criteria.

In this final segment, Part 9, we will be applying the chromosomal information we’ve gathered to our matches and determine which of our lines are the most likely to have Native Ancestry.  This, of course, has been the goal all along.  So, drum roll…..here we go.

In Part 8, we ended by entering the start and stop locations of both Strong Native and Blended Asian clusters into a table to facilitate easy data entry into the chromosome match spreadsheet downloaded from either 23andMe or Family Tree DNA.  If you downloaded it previously, you might want to download it again if you haven’t modified it, or download new matches since you last downloaded the spreadsheet and add them to the master copy.

My goal is to determine which matches and clusters indicate Native ancestry, and how to correlate those matches to lineage.  In other words, which family lines in my family were Native or carry Native heritage someplace.

The good news is that my mother’s line has proven Native heritage, so we can use her line as proof of concept.  My father’s family has so many unidentified wives, marginalized families and family secrets that the Native line could be almost any of them, or all of them!  Let’s see how that tree shakes out.

Finding Matches

So let’s look at a quick example of how this would work.  Let’s say I have a match, John, on chromosome 4 in an area where my mother has no Native admixture, but I do.  Therefore, since John does not match my mother, then the match came from my father and if we can identify other people who also match both John and I in that same region on that chromosome, they too have Native ancestry.  Let’s say that we all also share a common ancestor.  It stands to reason at that point, that the common ancestor between us indicates the Native line, because we all match on the Native segment and have the same ancestor.  Obviously, this would help immensely in identifying Native families and at least giving pointers in which direction to look.  This is a “best case’ example.  Some situations, especially where both parents contribute Native heritage to the same chromosome, won’t be this straightforward.

Based on our findings, the maximum range and minimum (least common denominator or “In Common” range is as follows for the strongest Native segments on chromosomes 1 and 2.

  Chromosome 1 Chromosome 2
Largest   Range 162,500,000   – 180,000,000 79,000,000   – 105,000,000
Smallest   Range 165,658,091   – 171,000,000 90,000,000   – 103,145,425

At GedMatch

At GedMatch, I used a comparison tool to see who matched me on chromosome 1.  Only 2 people outside of immediate family members matched, and both from Family Tree DNA.  Both matched me on the critical Native segments between about 165-180mg.  I was excited.  I went to Family Tree DNA and checked to see if these two people also matched my mother, which would confirm the Native connection, but neither did, indicating of course that these two people matched me on my father’s side.  That too is valuable information, but it didn’t help identify any common Native heritage with my mother on chromosome 1.  It did, however, eliminate them as possibilities which is valuable information as well.

DNAGedcom

I used a new tool, DNAGedcom, compliments of Rob Warthen who has created a website, DNA Tools, at www.dnagedcom.com.  This wonderful tool allows you to download all of your autosomal matches at Family Tree DNA and 23andMe along with their chromosomal segment matches.  Since my mother’s DNA has only been tested at Family Tree DNA, I’m limiting the download to those results for now, because what I need is to find the people who match both she and I on the critical segments of chromosome 1 or 2.

Working with the Download Spreadsheet

It was disappointing to discover that my mother and I had no common matches that fell into this range on chromosome 1, but chromosome 2 was another matter.  Please note that I have redacted match surnames for privacy.

step 9 table 1

The spreadsheet above shows the comparison of my matches (pink) and Mother’s (white).  The Native segment of chromosome 2 where I match Mother is shaded mustard.  I shaded the chromosome segments that fell into the “common match” range in green.  Of those matches, there is only one person who matches both Mother and I, Emma.  The next step, of course, is to contact Emma and see if we can discover our common ancestor, because whoever it is, that is the Native line.  As you might imagine, I am chomping at the bit.

There are no segments of chromosome 2 that are unquestionably isolated to my father’s line.

Kicking it up a Notch

Are you wondering about now how something that started out looking so simple got so complex?  Well, I am too, you’re not alone.  But we’ve come this far, so let’s go that final leg in this journey.  My mom always used to say there was no point in doing something at all if you weren’t going to do it right.  Sigh….OK Mom.

The easiest way to facilitate a chromosome by chromosome comparison with all of your matches and your Strong Native and Blended Asian segments is to enter all of these segment groups into the match spreadsheet.  If you’re groaning and your eyes glaze over right after you do one big ole eye roll, I understand.

But let’s take a look at how this helps us.

On the excerpt from my spreadsheet below, for a segment of chromosome 5, I have labeled the people and how they match to me.  The ones labeled “Mom” in the last column are labeled that way because these people match both Mom and I.  The ones labeled “Dad” are labeled that way because I know that person is related on my father’s side.

Using the information from the tables created in Step 8, I entered the beginning and end of all matching segment clusters into my spreadsheet.  You can see these entries on lines 7, 8, 22, 23 and 24.  You then proceed to colorize your matches based on the entry for either Mom or Dad – in other words the blue row or the purple row, line 7, 22 or 24.  In this example, actually, line 5 Rex, based on the coloration, should have been half blue and half purple, but we’ll discuss his case in a minute.

The you can then sort either by match name or by chromosome to view data in both ways.  Let’s look at an example of how this works.

Legend:

  • White Rows:  Mother’s matches.  When Mother and I both match an individual, you’ll see the same matches for me in pink.  This double match indicates that the match is to Mother’s side and not Father’s side.
  • Pink Rows:  My matches.
  • Purple “Mom” labels in last column:  The individual matches both me and Mom.  This is a genetic match.
  • Teal “Dad” labels in last column: Genealogically proven to be from my father’s side.  This is a genealogical, not a genetic label, since I don’t have Dad’s DNA and can only infer these genetically when they don’t also match Mother.
  • Dark Pink Rows labeled “Me Amerind Only” are Strong Native or Blended Asian segments from Chromosome Table that I have entered.  My segments must come from one of my parents, so I’ve either colored them purple, if the match is someone who matches Mother and I both, or teal, if they don’t match both Mom and I, so by inference they come from my father’s line.
  • Dark Purple Rows labeled “Mom Amerind Only” are Mom’s segments from the Chromosome Table.
  • Dark Teal Rows labeled “Dad Amerind Only” are inferred segments belonging to my father based on the fact that Mother and I don’t share them.

Inferred Relationships

This is a good place to talk for just a minute about inferred relationships in this context.  Inference gets somewhat tenuous or weak.  The inferred matches on my father’s side began with the Native segments in the admix tools.  Some inferences are very strong, where Mother has no Native at all in that region.  For example, Mom has European and I have Native American.  No question, this had to come from my father.  But other cases are much less straightforward.

In many cases, categorization may be the issue.  Mom has West Asian for example and I have Siberian or Beringian.  Is this a categorization issue or is this a real genetic difference, meaning that my Siberian/Beringian is actually Native and came from my father’s side?

Other cases of confusion arise from segment misreads, etc.  I’ve actually intentionally included a situation like this below, so we can discuss it.  Like all things, some amount of common sense has to enter the picture, and known relationships will also weigh heavily in the equation.  How known family members match on other chromosome segments is important too.  Do you see a pattern or is this match a one-time occurrence?  Patterns are important.

Keep in mind that these entries only reflect STRONG Asian or Native signals, not all signals.  So even if Mother doesn’t have a strong signal, it doesn’t mean that she doesn’t have ANY signal in that region.  In some cases, start and stop segments for Mom and Dad overlapped due to very long segments on some matches.  In this case, we have to rely on the fact that we do have Mother’s actual DNA and assume that if they aren’t also a match to Mother, that what we are seeing is actually Dad’s lines, although this may not in actuality always be true.  Why?  Because we are dealing with segments below the matching threshold limit at both Family Tree DNA and 23andMe, and both of my parents carry Native heritage.  We can also have crossed a transitional boundary where the DNA that is being matched switches from Mom’s side to Dad’s side.

Ugh, you say, now that’s getting messy.  Yes, it is, and it has complicated this process immensely.

The Nitty-Gritty Data Itself

step 9 table 2

Taking a look at this portion of chromosome 5, we have lots going on in this cluster.  Most segments will just be boring pink and white (meaning no Native), but this segment is very busy.  Mom and I match on a small segment from 52,000,000 to 53,000,000.  Indeed, this is a very short segment when compared to the entire chromosome, but it is strongly Native.  We both also match Rex, our known cousin.  I’ve noted him with yellow in the table. Please note that Mom’s white matches are never shaded.  I am focused on determining where my own segments originate, so coloring Mother’s too was only confusing.  Yes, I did try it.

You can see that Mother actually shares all or any part of her segment with only me and Rex.  This simplifies matters, actually.  However, also note that I carry a larger segment in this region than does Mother, so either we have a categorization issue, a misread, or my father also contributed.  So, a conundrum.  This very probably implies that my father also carried Native DNA in this region.

Let’s see what Rex’s DNA looks like on this same segment of chromosome 5, from 52-53 using Eurogenes.  In the graph below, my chromosome is the top bar, Rex’s the middle and the bottom bar shows common DNA with the black nonmatching.  Yellow is Native American, red is South Asian, putty is Siberian, lime green is Mediterranean, teal is North Europe, orange is Caucus.

Step 9 item 3

This same comparison is shown to Mother’s DNA (top row) below.

step 9 item 4

It’s interesting that while Mother doesn’t have a lot of yellow (Native), she does have it throughout the same segment where Rex’s occurs, from about 52 through 53.5.

Does this actually point to a Native ancestor in the common line between Rex, Mom and I, which is the Swiss/German Johann Michael Miller line which does include an unidentified wife stateside, or does this simply indicate a common ancient population long ago in Asia?  It’s hard to say and is deserving of more research.  I feel that it is most likely Native because of the actual yellow, Native segment. If this was an Asian/European artifact, it would be much less likely to carry the actual yellow segment.

Is Rex also genealogically related to my father?  As I’ve worked through this process with all of my chromosomes and matches, I’ve really come to question if one of my father’s dead ends is also an ancestral line of my mother’s.

The key to making sense of these results is clusters.

Clusters vs Singleton Outliers

The work we’ve already done, especially in Step 8, clusters the actual DNA matching segments.  We’ve now entered that information into the spreadsheet and colored the segments of those who match.  What’s next?

The key is to look for people with clusters.  Many matches will have one segment, of say, 10 that match, colored.  Unless this is part of a large chromosome cluster, it’s probably simply an outlier.  Part of a large chromosome cluster would be like the large Strong Native segments on chromosome 1 or 2, for example.  How do we tell if this is a valid match or just an outlier?

Sort the spreadsheet by match name.  Take a look at all of the segments.

The example we’ll use is that of my cousin, Rex.  If you recall, he matches both me and Mother, is a known first cousin twice removed to me, (genetically equal to a second cousin), and is descended from the Miller line.

In this example, I also colored Mother’s segments because I wanted to see which segments that I did not receive from her were also Native. You can see that there are many segments where we all match and several of those are Native.  These also match to other Miller descendants as well, so are strongly indicative of a Native connection someplace in our common line.

If we were only to see one Native segment, we would simply disregard this as an outlier situation.  But that’s not the case.  We see a cluster of matches on various segments, we match other cousins from the same line on these segments, and reverting back to the original comparison admixture tools verifies these matches are Native for Rex, Mom and me.

step 9 item 5

Hmmmm…..what is Dad’s blue segment color doing in there?  Remember I said that we are only dealing with strong match segments?  Well, Mom didn’t have a strong segment at that location and so we inferred that Dad did.  But we know positively that this match does come from Mother’s side.  I also mentioned that I’ve come to wonder if my Mom and Dad share a common line.  It’s the Miller line that’s in question.  One of Johann Michael Miller’s children, Lodowick, moved from Pennsylvania to Augusta County, Virginia in the 1700s and his line became Appalachian, winding up in many of the same counties as my father’s family.  I’m going to treat this as simply an anomaly for now, but it actually could be, in this case, an small indication that these lines might be related.  It also might be a weak “Mom” match, or irrelevant.  I see other “double entries” like this in other Miller cousins as well.

What is the pink row on chromosome 12?  When I grouped the Strong Native and Asian Clusters, sometimes I had a strong grouping, and Mom had some.  The way I determined Dad’s inferred share was to subtract what Mom had in those segments from mine.  In a few cases, Mom didn’t have enough segments to be considered a cluster but she had enough to prevent Dad from being considered a cluster either, so those are simply pink, me with no segment coloring for Mom or Dad.

Let’s say I carry Strong Native/Mixed Asian at the following 8 locations:

10, 12, 14, 16, 18, 20, 22, 24

This meets the criteria for 8 of 15 ethno-geographic locations (in the admix tools) within a 2.5 cM distance of each other, so this cluster would be included in the Mixed Asian for me.  It could also be a Strong Native cluster if it was found in 3 of 4 individual tools.  Regardless of how, it has been included.

Let’s now say that Mom carries Native/Mixed Asian at 10, 12 and 14, but not elsewhere in this cluster.

Mom’s 3 does not qualify her for the 8/15 and it only leaves Dad with 5 inferred segments, which disqualifies him too.  So in this case, my cluster would be listed, but not attributable directly to either parent.

What this really says is that both of my parents carry some Native/Blended Asian on this segment and we have to use other tools to extrapolate anything further.  The logic steps are the same as for Dad’s blue segment.  We’re going to treat that as an outlier.  If I really need to know, I can go back to the actual admixture tools and see whether Mom or Dad really match me strongly on which segments and how we compare to Rex as well.  In this case, it’s obvious that this is a match to my Mother’s side, so I’m leaving well enough alone.

Let’s see what the matches reveal.

Matches

Referring back to the Nitty Gritty Data spreadsheet, Mom’s match to Phyllis on row 15 confirms an Acadian line.  This is the known line of Mother’s Native ancestry.  This makes sense and they match on Native segments on several other chromosomes as well.  In fact, many of my and Mother’s matches have Acadian ancestry.

My match to row 19, Joy, is a known cousin on my father’s side with common Campbell ancestry.  This line is short however, because our common ancestor, believed to be Charles Campbell died before 1825 in Hawkins County, TN.  He was probably born before 1750, given that his sons were born about 1770 and 1772.  Joy and I descend from those 2 sons.  Charles wife and parents are unknown, as is his wife.

My match to row 20, inferred through my father’s side, is to a Sizemore, a line with genetically proven Native ancestry.  Of course, this needs more research, but it may be a large hint.  I also match with several other people who carry Sizemore ancestors.  This line appears to have originated near the NC/VA border.

I wanted to mention rows 4 and 17.  Using our rules for the spreadsheet, if I match someone and they don’t also match Mother on this segment, I have inferred them to be through my father.  These are two instances that this is probably incorrect.  I do match these people through Mother, but Mother didn’t carry a strong signal on this segment, so it automatically became inferred to Dad.  Remember, I’m only recording the Strong Native or the Blended Asian segments, not all segments.  However, I left the inferred teal so that you can see what kinds of judgment calls you’ll have to make.  This also illustrates that while Mom’s genetic matches are solid, Dad’s inferred matches are less so and sometimes require interpretation.  The proper thing to do in this instance would be to refer back to the original admixture tools themselves for clarification.

Let’s see what that shows.

step 9 item 6

Using HarrappaWorld, the most pronounced segment is at about 52.  Teal is American.  You can see that Mother has only a very small trace between 53 and 54, almost negligible.  Mother’s admixture at location 52 is two segments of purple, brown and cinnamon which translate to Southwest Asian (lt purple), Mediterranean (dk purple), Caucasian (brown) and Balock (cinnamon), from Pakistan.

Checking Dodecad shows pretty much the same thing, except Mother’s background there is South Asian, which could be the same thing as Caucus and Pakistan, just different categorizations.

In this case, it looks like the admixture is not a categorization issue, but likely did come from my father.  Each segment will really be a case by case call, with only the strongest segments across all tools being the most reliable.

It’s times like this that we have to remember that we have two halves of each chromosome and they carry vastly different information from each of our parents.  Determining which is which is not always easy.  If in doubt, disregard that segment.

Raw Numbers

So, what, really did I figure out after all of this?

First, let’s look at some numbers.

I was working with a total of 292 people who had at least one chromosomal segment that matched me with a Strong Native or Blended Asian segment.  Of those, 59 also matched Mom’s DNA.  Of those, 18 had segments that matched only Mom.  This means that some of them had segments that also matched my father.  Keep in mind, again, that we are only using “strong matches” which involves inferring Dad’s segments and that referring back to the original tools can always clarify the situation.  There seems to be some specific areas that are hotspots for Native ancestry where it appears that both of my parents passed Native ancestry to me.

Many of my and my mother’s 59 matches have Acadian ancestry which is not surprising as the Acadians intermarried heavily with the Native population as well as within their own ethnic group.

Several also have Miller Ancestry.  My Miller ancestor is Johann Michael Miller (1692-1771) who immigrated in the colonial period and settled on the Pennsylvania frontier.  His son, Philip Jacob Miller’s (1726-1799) wife was a woman named Magdalena whose last name has been rumored for years to be Rochette, but no trace of a Rochette family has ever been found in the county where they lived, region or Brethren church history…and it’s not for lack of looking.  Several matches point to Native Ancestry in this line.  This also begs the question of whether this is really Native or whether it is really the Asian heritage of the German people.  Further analysis, referring back to the admixture tools, suggests that this is actually Native. It’s also interesting that absolutely none of Mother’s other German or Dutch lines show this type of ancestry.

There is no suggestion of Native ancestry in any of her other lines.  Mother’s results are relatively clean.  Dad’s are anything but.

Dad’s Messy Matches

My father’s side of the family, however, is another story.

I have 233 matches that don’t also match my mother.  There can be some technical issues related to no-calls and such, but by and large, those would not represent many.  So we need to accept that most of my matches are from my Father’s side originating in colonial America.  This line is much “messier” than my mother’s, genealogically speaking.

Of those 233 matches, only 25 can be definitely assigned to my father.  By definitely assigned, I mean the people are my cousins or there is an absolutely solid genealogical match, not a distant match.  Why am I not counting distant matches in this total?  We all know by virtue of the AncestryDNA saga that just because we match family lines and DNA does NOT mean that the DNA match is the genealogical line we think it is.  If you would like to read all about this, please refer to the details in CeCe Moore’s blog where she discussed this phenomenon.  The relevant discussion begins just after the third photo in this article where she shows that 3 of 10 matches at Ancestry where they “identify” the common DNA ancestor are incorrect.  Of course, they never SAY that the common ancestor is the DNA match, but it’s surely inferred by the DNA match and the “leaf” connecting these 2 people to a common ancestor.  It’s only evident to someone who has tested at least one parent and is savvy enough to realize that the individual whose ancestor on Mom’s side that they have highlighted, isn’t a match to Mom too.  Oops.  Mega-oops!!!

However, because we are dealing in our project, on Dad’s side, with inferences, we’re treading on some of the same ground.  Also, because we are dealing with only “strong clustered” segments, not all Native or Asian segments and because it appears that my parents both have Native ancestry.  To make matters worse, they may both have Algonquian, Iroquoian or both.

I have also discovered during this process that several of my matches are actually related to both of my parents.  I told you this got complex.

Of the people who don’t match Mother, 32 of them have chromosomal matches only to my father, so those would be considered reliable matches, as would the closest ones of the 25 that can be identified genealogically as matching Dad.  Many of these 25 are cousins I specifically asked to test, and those people’s results have been indispensable in this process.

In fact, it’s through my close circle of cousins that we have been able to eliminate several lines as having Native ancestry, because it doesn’t’ show as strong and they don’t have it either.

Many of these lines group together when looking at a specific chromosome.  There is line after line and cousin after cousin with highlighted data.

Dad’s Native Ancestors

So what has this told me?  This information strongly suggests that the following lines on my father’s side carry Native heritage.  Note the word “carry.”  All we can say at this point is that it’s in the soup – and we can utilize current matches at our testing company and at GedMatch, genealogy research and future matches to further narrow the branches of the tree.  Many of these families are intermarried and I have tried to group them by marriage group.  Obviously, eventually, their descendants all intermarried because they are all my ancestors on my father’s side.  But multiple matches to other people who carry the Native markers but aren’t related to my other lines are what define these as lines carrying Native heritage someplace.

  • Campbell – Hawkins County, Tn around 1800, missing wife and parents, married into the Dodson family
  • Dodson – Hawkins County, Tn, Virginia – written record of Lazarus Dodson camping with the Cherokee – missing wife, married into the Campbell and Estes family
  • Claxton/Clarkson – Russell Co., Va, Claiborne and Hancock Co., Tn – In NC associated with the known Native Hatcher family.  Possibly a son-in-law.  Missing family entirely.
  • Cook – Russell Co., Va. – daughter married Claxton/Clarkson – missing wives
  • Harrold, Harrell, Herrell – Hancock Co., Tn., Wilkes Co., NC – missing wives
  • McDowell – Hancock Co. Tn, Wilkes Co., NC, Augusta Co., Va – married into the Harrell family, missing wife
  • McNeil, McNiel – Wilkes Co., NC – missing wives, married into the Vannoy family
  • Vannoy – Wilkes County – some wives unaccounted for pre-1800
  • Crumley – Greene County, Tn., Lee Co., Va. – oral history of Native wife, married into the Vannoy family
  • Brown – Greene County, Tn, Montgomery Co., Va – married into the Crumley family, missing wives

While this looks like a long list, the list of families that don’t have any Native ancestry represented is much longer and effectively serves to eliminate all of those lines.  While I don’t have “THE” answer, I certainly know where to focus my research.  Maybe there isn’t the one answer.  Maybe there are multiple answers, in multiple lines.

The Take Away

Is this complex?  Yes!  Is it a lot of work?  You bet it is!  Is everything cast in concrete?  Never!  You can see that by the differences we’ve found in data interpretation, not to mention issues like no-calls (areas that for some reason in the test don’t read) and cross overs where your inheritance switches from your mom’s side to your dad’s side.  Is there any other way to do this?  No, not if your minority admixture is down in that weedy area around 1%.

Is it worth it?  You’ll have to decide.  It guess it depends on how desperately you want to know.

Part of the reason this is difficult is because we are missing tools in critical locations.  It’s an intensively laborious manual process.  In essence, using various tools, one has to figure out the locations of the Native and Asian chromosome segments and then use that information to infer Native matches by a double match (genetic match at DNA company plus match with Strong Native/Blended Asian segment) with the right parent.  It becomes even more complex if neither parent is available for testing, but it is doable although I would think the reliability could drop dramatically.

Tidbits and Trivia

I’ve picked up a number of little interesting tidbits during this process.  These may or may not be helpful to you.  Just kind of file them away until needed:)

  • Matches at testing companies come and go….and sometimes just go.  At Family Tree DNA, I have some matches that must be trembling on the threshold that come and go periodically.  Now you see them, now you don’t.  I lost matches moving from the Affy chip to the Illumina chip and lost additional matches between Build 36 and 37.  Some reappeared, some haven’t.
  • The start and stop boundaries changed for some matches between build 36 and build 37.  I did not go back and readjust, as most of these, in the larger scheme of things, were minor.  Just understand that you are looking for  patterns here that indicate Native heritage, not exact measurements.  This process is a tool, and unfortunately, not a magic wand:)
  • The centromere locations change between builds.  If you have matches near or crossing the middle of the chromosome, called the centromere, there may be breaks in that region.  I enter the centromere start and stop locations in my spreadsheet so that if I notice something odd going on in that region, the centromere addresses are right there to alert me that I’m dealing with that “odd” region.  You can find the centromere addresses in the FAQ at Family Tree DNA for their current build.
  • At 23andMe, when you reach the magic 1000 matches threshold, you start losing matches and the matching criteria is elevated so that you can stay under 1000 matches.  For people with colonial American or Jewish heritage, in other words those with high numbers of matches, this is a problem.
  • Watch for matches that are related to both sides of your family.  If your family lived in colonial America, you’re going to have a lot of matches and many are probably related to each other in ways you aren’t aware of.
  • If your parents are related to each other, this process might simply be too complex and intertwined to provide enough granular data to be useful.
  • Endogamous groups are impossible to sort through as to where, meaning which ancestor, the DNA came from.  This is because the original group founders’ DNA is just getting passed around and around, with little or no new DNA being introduced.  The effect of this on downstream generations relative to genetic genealogy is that matches appear to be more closely related than they are because of the amount of matching DNA they carry.  For my Brethren and my Acadian groups of people, I just list them by the group name, since, as the saying goes, “if you’re related to one Acadian, you’re related to all Acadians.”
  • If you’re going to follow this procedure, save one spreadsheet copy with the Strong Native only and then a second one with both the Strong Native and Blended Asian.  I’m undecided truthfully whether the Mixed Asian adds enough resolution for the extra work it generates.
  • When in question, refer back to the original tools.  The answer will always be found there.
  • Unfortunately, tools change.  You may want to take screen shots.  During this process, FTDNA went from build 36 to 37, match thresholds changed, 23andMe introduced a new user interface (which I find much less intuitive) and GedMatch has made significant changes.  The net-net of this is when you decide to undertake this project, commit to it and do it, start to finish.  Doing this little by little makes you vulnerable to changes that may make your data incompatible midstream – and you may not even realize it.
  • This entire process is intensively manual.  My spreadsheet is over 5500 rows long.  I won’t be doing it again…although I will update my spreadsheet with new matches from time to time.  The hard work is already done.
  • This same technique applies to any minority ancestry, not just Native, although that’s what I’ve been hunting for and one of the most common inquiries I receive.
  • I am hopeful that in the not too distant future many of these steps and processes will be automated by the group of bright developers that contribute to GedMatch or via other tools like DNAGedcom. HINT – HINT!!!

I would like to follow this same process to identify the source of my African heritage, but I’m thinking I’ll wait for the tools to become automated.  The great irony is that it’s very likely in the same lines as my Native ancestors.

If You Want to Test

What does it take to do this for yourself using the tools we have today, as discussed?

If your parents are living, the best gift you can give yourself is to test them, now, while you still can.  My mother has been gone for several years, but her DNA archived at Family Tree DNA was still viable.  This is not always the case.  I was fortunate.  Her DNA is one of the best gifts she gave me.  Not just by inheritance, but by having hers tested.  I thank her every single day, for both!  I could not have written this article without her DNA results.  The gift that keeps on giving.

If you don’t have a parent to test, you can test several other family members who will provide some information, but clearly won’t carry the same amounts of common DNA with you as your parents.  These would include your aunts and uncles, your parents’ siblings and what I’ve referred to as your close cousin circle.  Attempt to test at least someone from each line.  Yes, it gets expensive, but as one of my cousins said, as she took her third or 4th DNA test.  “It’s only money.  This is about family.”

You can also test your own siblings as well to obtain more information that you can use to match up to your family lines. Remember, you only receive half of your parents DNA, and your siblings will received some DNA from your parents that you didn’t.

I don’t have any other siblings to test, but I have tested cousins from several lines which have proven invaluable when trying to discern the sources of certain segments. For example, one of these Native segments fell on a common segment with my cousin Joy.  Therefore, I know it’s from the Campbell line, and because I have the Campbell paternal Y-DNA which is European, I know immediately the Native admixture would have had to be from a wife.

Much of this puzzle is deductive, but we now have the tools, albeit manual, to do this type of work that was previously impossible.  I am somewhat disappointed that I can’t pinpoint the exact family lines, yet, but hopefully as more people test and more matches provide genealogical information, this will improve.

If you want to play in this arena, you need to test at either Family Tree DNA, 23andMe, or both.  Right now, the most cost effective way to achieve this is to purchase a $99 kit from 23andMe, test there, then download your results from 23andMe and upload them to Family Tree DNA for $99.  That way, you are fishing in both pools.  Be aware that less than half of the people who test at either company download results to GedMatch, so your primary match locations are with the testing companies.  GedMatch is auxiliary, but critical for this analysis.  And the newest tool, DNAGedcom is a Godsend.

Also note that transferring your result to Family Tree DNA is NOT the same thing as actually testing there.  Why does this matter?  If you want a future test at Family Tree DNA, who is the premiere genetic genealogy testing company, offering the most variety and “deepest” commercial tests, they archive your DNA for 25 years, but if you transfer results, they don’t have your DNA to archive, so no future products can be ordered.  All I can say is thank Heavens Mom’s DNA was there.

Ancestry.com doesn’t provide any tools such as the chromosome browser or even the basic information of matching segments.  All you get is a little leaf that says you’re related, but the questions of which segment or how are not answerable today at Ancestry and as CeCe’s experience proved, its unreliable.  It’s  possible that you share the same surnames and ancestor, but your genetic connection is not through that family line.  Without tools, there is no way to tell.  Ancestry released raw data files a few weeks ago and very recently, GedMatch has implemented the ability to upload them so that Ancestry participants can now utilize the additional tools at GedMatch.

Although this has been an extraordinarily long and detailed process, I can’t tell you how happy I am to have developed this new technique to add to my toolbox.  My Native and African ancestors have been most elusive.  There are no records, they didn’t write and probably didn’t even speak English, certainly not initially.  The only clues to their existence, prior to DNA, were scant references and family lore.  The only prayer of actually identifying them is though these small segments of our DNA – yep – down in the weeds.  Are there false starts perhaps, and challenges and maybe a few snakes down there?  Yes, for sure, but so is the DNA of your ancestors.

Happy gardening and rooting around in the weeds.  Just think of it as searching for the very best buried treasure!  It’s down there, just waiting to be found.  Keep digging!

I hope you’ve enjoyed this series and that it leads you to your own personal genealogical treasure trove!

treasure chest

______________________________________________________________

Disclosure

I receive a small contribution when you click on some of the links to vendors in my articles. This does NOT increase the price you pay but helps me to keep the lights on and this informational blog free for everyone. Please click on the links in the articles or to the vendors below if you are purchasing products or DNA testing.

Thank you so much.

DNA Purchases and Free Transfers

Genealogy Services

Genealogy Research

The Autosomal Me – Extracting Data Segments and Clustering

This is Part 8 of a multi-part series, “The Autosomal Me.”

Part 1 was “The Autosomal Me – Unraveling Minority Admixture” and Part 2 was “The Autosomal Me – The Ancestors Speak.”  Part 1 discussed the technique we are going to use to unravel minority ancestry, and why it works.  Part two gave an example of the power of fragmented chromosomal mapping and the beauty of the results.

Part 3, “The Autosomal Me – Who Am I?,” reviewed using our pedigree charts to gauge expected results and how autosomal results are put into population buckets.  Part 4, “The Autosomal Me – Testing Company Results,” shows what to expect from all of the major testing companies, past and present, along with Dr. Doug McDonald’s analysis.  In Part 5, “The Autosomal Me – Rooting Around in the Weeds Using Third Party Tools,” we looked at 5 different third party tools and what they can tell us about our minority admixture that is not reported by the major testing companies because the segments are too small and fragmented.

In Part 6, “The Autosomal Me – DNA Analysis – Splitting Up” we began the analysis part of the data we’ve been gathering.   We looked at how to determine whether minority admixture on specific chromosomes came from which parent.

Part 7, “The Autosomal Me – Start, Stop, Go – Identifying Native Chromosomal Segments”, took a deeper dive and focused on the two chromosomes with proven Native heritage and began by comparing those chromosome segments using the 4 GedMatch admixture tools.

In this segment, Part 8, we’ll be extracting all of the Native and Blended Asian segments on all 22 chromosomes, but I’ll only be using chromosomes 1 and 2 for illustration purposes.  We will then be clustering the resulting data to look for trends.  If you’re following along and using this methodology, you’ll be extracting the Native segment start and stop locations from all 22 chromosomes.

I apologize in advance for the length of this article, but there was just no good place to break it into pieces.

So, let’s get started.  As a reminder, we are using the admixture tools at www.gedmatch.com.

I experimented with several types of extractions to see which ones best reflected the results found by both 23andMe and Dr. McDonald and confirmed by the start and stop segments in the highly Native segments of chromosomes 1 and 2 in Part 7 of this series.  We verified that all 4 tools accurately reflected and corroborated the segments listed as Native, so now we’re going to apply that same methodology to the rest of our chromosomal data.

Initially, I tried to use the information from chromosomes 1 and 2 to extract the Native chromosomes using only the “best” tool, but when I looked at all 4 tools, I quickly realized that there was no single “best” choice.  A couple of crucial points came to light.

  • Some of the geographic colors are almost impossible to tell apart.
  • None of the tools are universally best.
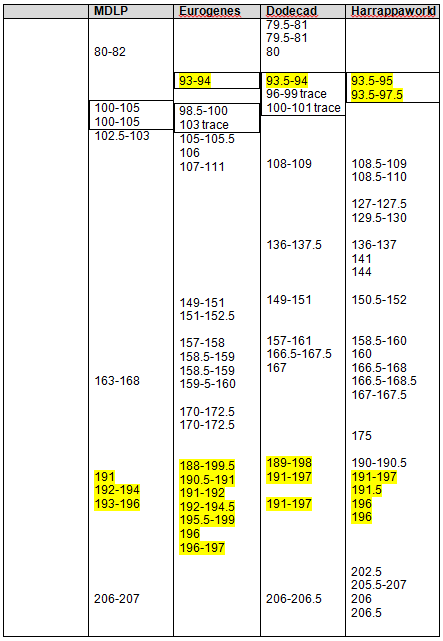
  • When looking at all 4 tools, generally a “best 3 out of 4” approach allowed for one of the tools to be wrong, to perhaps reference a slightly different data base that called the segment differently or for the colors to be indistinguishable.  In other words, if three called a segment Native and one did not, it’s Native and conversely, if less than 3 call it Native, in this comparison, it’s not.

Unfortunately, this created an awful lot of work.  This is probably the best example of where automation tools could and would make a huge difference in this process.

I did two separate extracts.  The first one is what I refer to as the “Strong Native” extract and the second is the “Blended Asian.”  In part, I did these separately as a check and balance to be sure that my first extraction was accurate.

In the first extract, I selected only one category, the one best fitted to “Native American” for each tool.  I used the following categories for each admixture tool:

  • MDLP – Amerind
  • Eurogenes – North Amerindian
  • Dodecad – NE Asian
  • Harrappaworld – American

I completed this process for every chromosome, but I’m only showing the first two chromosomes in this article.

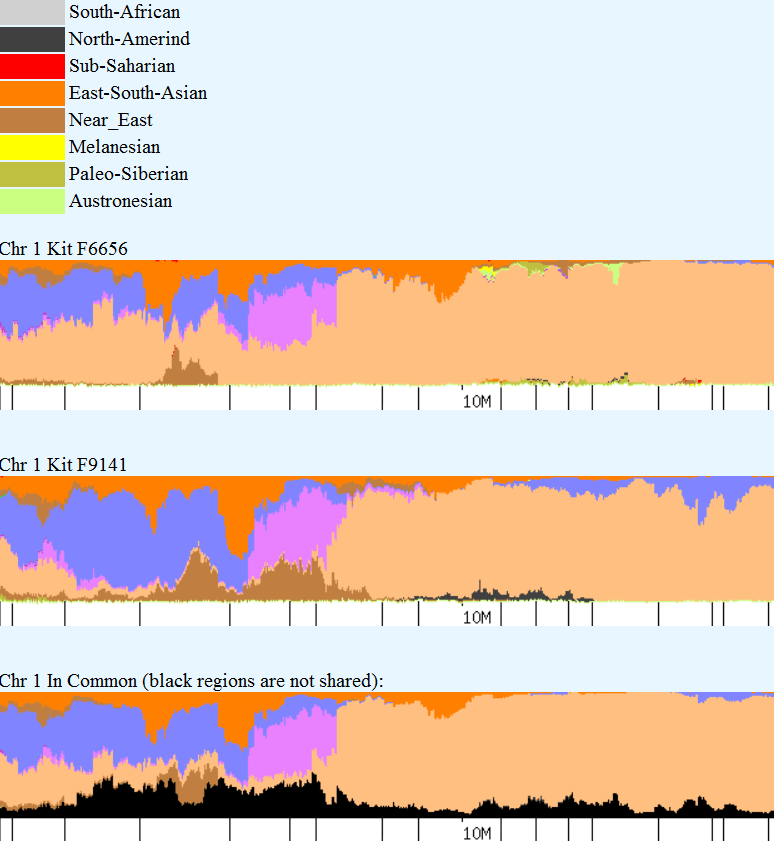
By way of example, using the first tool, MDLP, North Amerind looks black, but is actually very dark grey.  It is, fortunately, distinctive.

On the chromosome painting below, my results for the first part of chromosome 1 are shown in the first band, and mother’s for the same segment are shown as the second band.  The bottom band represents common segments and the black is non-matching segments, meaning those I obtained from my father.  Sometimes this third band can help you determine what you are really seeing in terms of colors and blending, but it’s not always useful.  In this case, trying to spot a small amount of dark gray against black is almost impossible, so not terribly helpful.  But if you were looking for red, that would be another story.  As you move through this process, remember, it’s not exact and utilizing best 3 of 4 will help you recover from any major errors.

You can see that my grey segments show up from about 12-13 and then again at about 14.5.  Sometimes it’s difficult to know how to count something.  For example, my Native at 14.5 – it’s actually more like 14.25 -14.5, but I chose not to divide further than half mb segments.  As long as you are consistent in whatever methodology you select, it will work out.

step 8 - 1

Please note that when reading these charts, that the small hash mark is the indicator for the measure.  In other words, the small hash mark above 10M means that is the 10M location.  It’s obvious here, but on some charts, the hash mark and the location legend look to be 1-off.  Again, as long as you’re consistent, it really doesn’t matter.

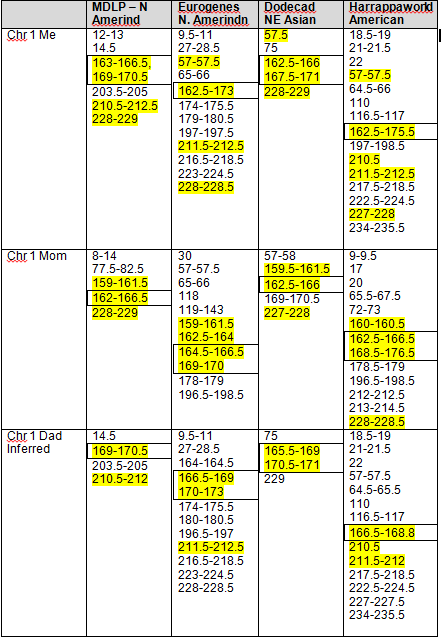
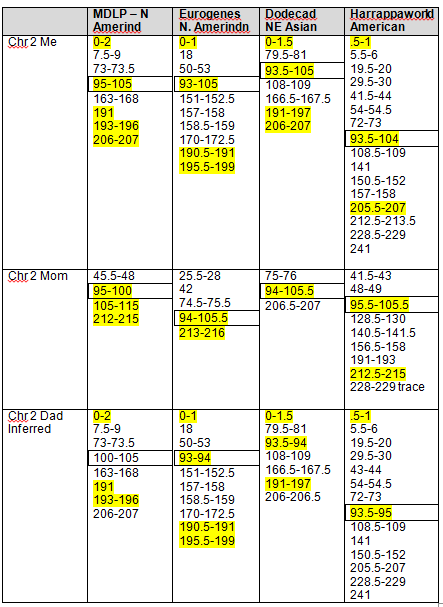
Mother’s Native segments are more pronounced and obvious.  They range from about 8-14.  Using the actual tools, you would record this and then continue scrolling to the right until you reach the end of the chromosome.  On chromosomes 1 and 2, I found the strong Native segments for the four admixture tools, as shown below.

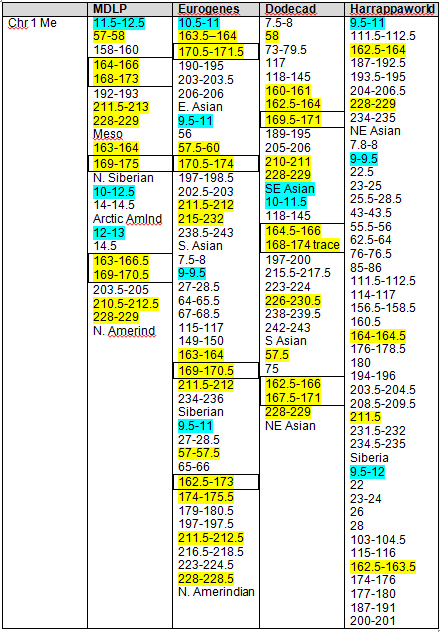
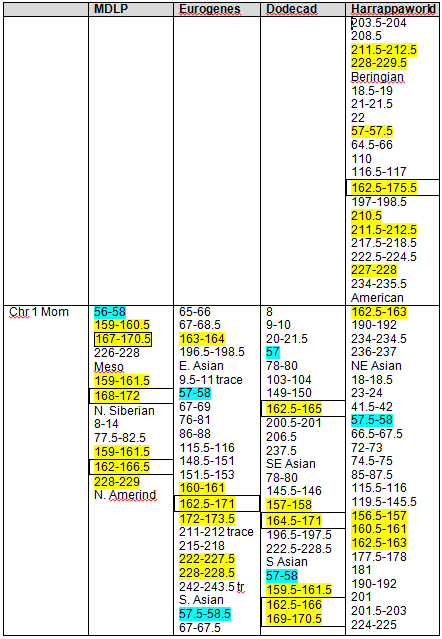
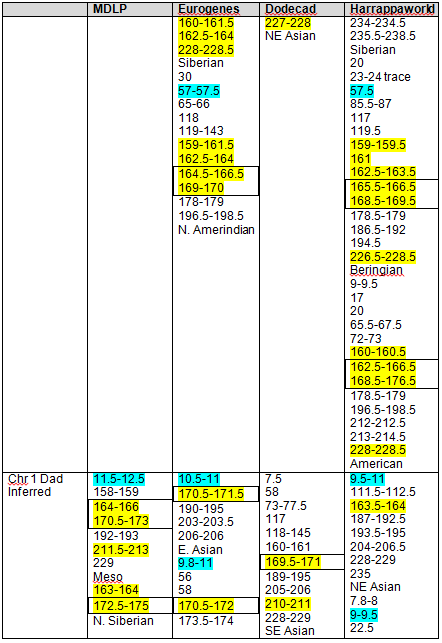
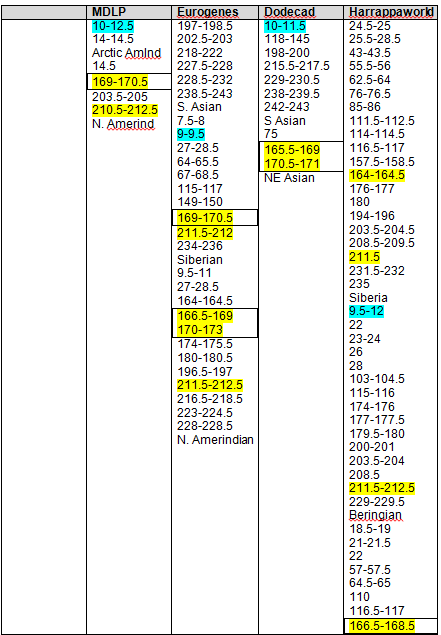
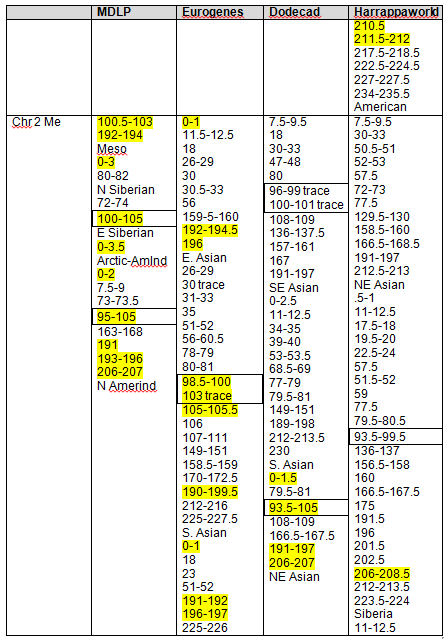
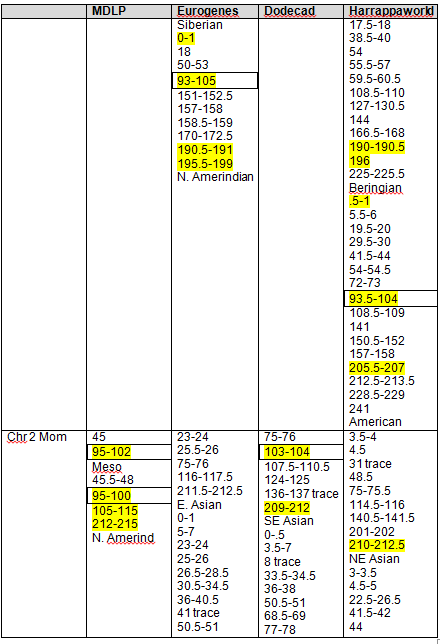
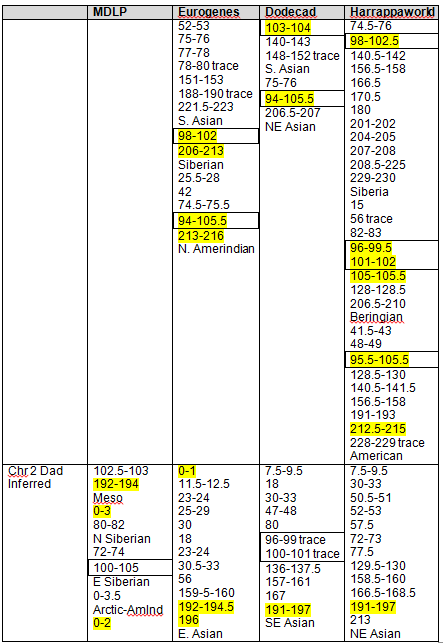
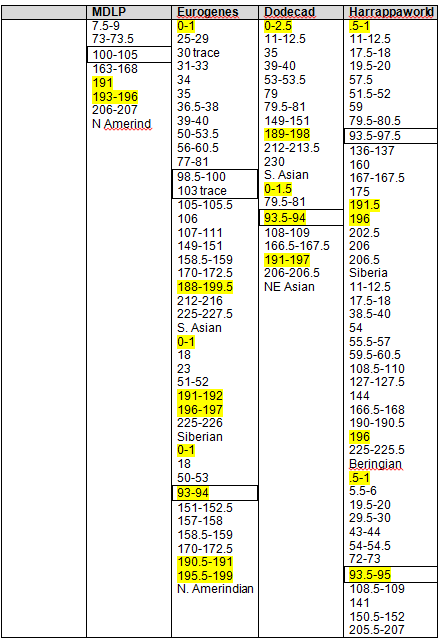
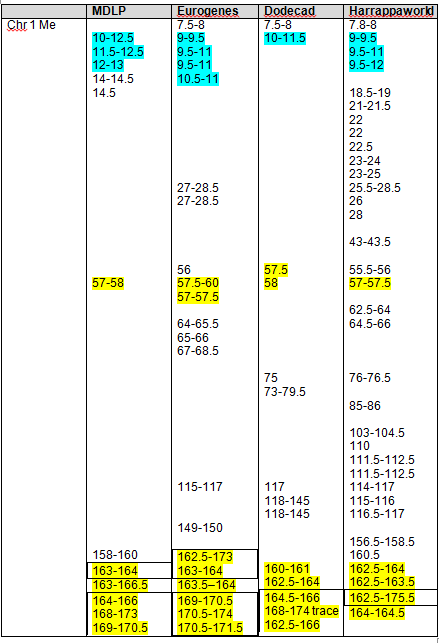
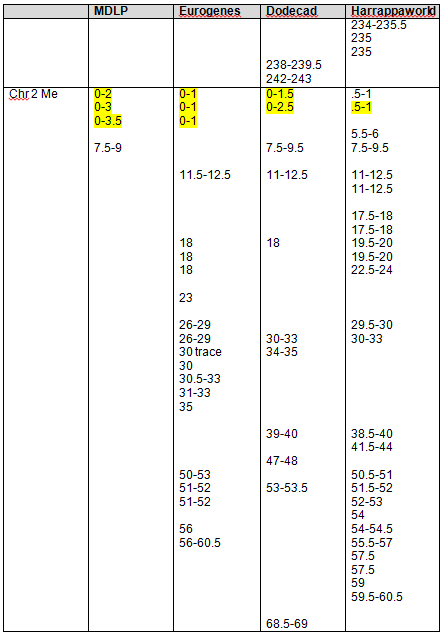
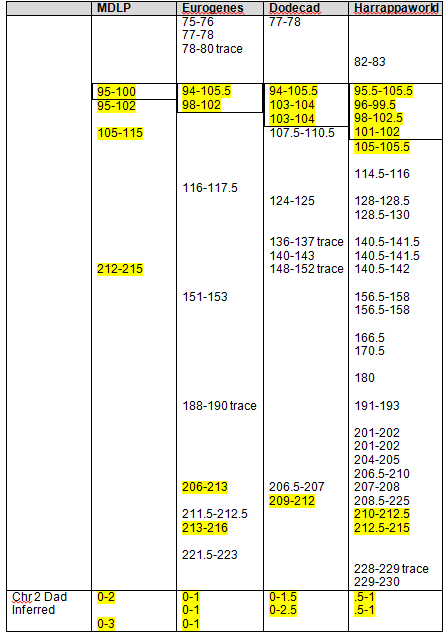
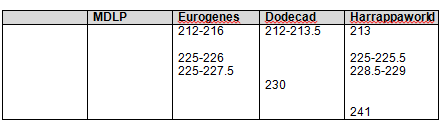
The boxed numbers show the areas that were found “in common” between 23andMe, Dr. McDonald and the admixture tools, as determined in Part 7 of this series.  Highlighted segments show segments where at least 3 of 4 admixture tools reported Native heritage.  As you can see, there were clearly additional Native segments not reported by 23andme and Dr. McDonald.

Strong Native Chromosomal Detail Table

step 8 - 2

step 8 - 3

Because we have both my and mother’s results, we can infer my father’s contribution.  Clearly, some of his will wind up being some amount of “noise” and some IBS segments, but not all, by any means, and this is the only way to get a “read” on Dad.  This is one form of phasing data.  Phasing refers to various methodologies of figuring out which DNA comes from what source, meaning which parental line.

While the strongest Native segments are the ones individually most likely to indicate Native American ancestry, that really isn’t the whole story.  I discovered that many of these Native segments are actually embedded in other segments that are indicative of Native heritage too.  In other words, it’s not a line in the sand, yes or no, but more of a sliding scale.

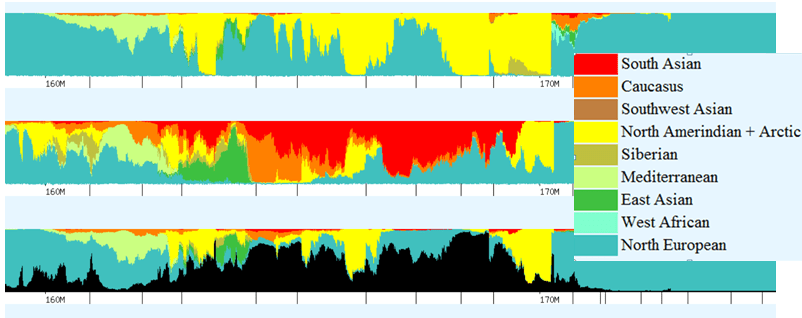
On the chromosome painting below, this one using Eurogenes, with my results shown above and mother’s below, you can see two excellent examples.  Regions relevant to Native ancestry include:

  • Red – South Asian
  • Brown – Southwest Asian
  • Yellow – North Amerindian and      Arctic
  • Putty – Siberian
  • Emerald – East Asian

You can see that while mine is almost universally yellow, or Native, with a little Siberian (putty) mixed in for good measure between 169-170, a hint of East Asian (emerald) plus a little Asian (red), mother’s isn’t.  In fact, hers is a mixture of Native American and South Asian (red), with more red than yellow,  Siberian (putty) and a large segment of East Asian (emerald green).

step 8 - 4A

While her yellow Native segments alone would be staggered across this entire segment in 7 different pieces, when taken together as a whole, the “blended Asian” segment reaches entirely across the screen with the exception of 1 mb between 161.5-162.5, roughly.

The following Blended Asian Chromosomal Detail Table shows all of the blended Asian segments using all four of the admixture tools for chromosomes 1 and 2.

It’s clear that these regions are not solely “Native American” but reach back in time genetically into Asia, particularly Northeast Asia.

Again, the boxed numbers show the “in common” segments between all tools and the yellow highlighted segments are common between at least three of the four admixture tools.

Please note that there were some issues distinguishing colors, as follows:

  • For the MDLP comparison, Mesoamerican and Paleo Siberian are both putty colored and indistinguishable on the chart.  Also, the apple green for Arctic Amerind is very similar to the Austronesian.
  • When using Dodecad, Southeast Asian (light green) and South Asian (apple green) are nearly impossible to distinguish from each other on the graphs.
  • When using HarappaWorld, the apple green for Siberian was very similar to the light forest green for Papua New Guinea and was very difficult to distinguish.  The South Asian putty appears often with the other Native markers, and I considered including this group, but it too was difficult to distinguish from other regions so in the end, I opted not to include this category.
  • If you are colorblind – get help as this is impossible otherwise.

Blended Asian Chromosomal Detail Table

On the blended Asian Chromosome Detail Table, I added yellow highlighting where the same segments show in other Asian geographies that showed in the Strong Native table.  In each column, the Strong Native category is the last one at the bottom of the list.

The blue highlighting shows other common segments found that were not included in the Strong Native segments.  For a Strong Native yellow segment to be highlighted, it had to be present in 3 of 4 tools, or 75%.  In the Blended Asian group, there are a total of 15 categories between the 4 admixture tools, so for a segment to be shaded blue, it must be found in at least 8 of the categories, so just over half.  There are many segments that are found in several categories across the tools.  For example, segment 192-193 on chromosome 1 is found five times.  This isn’t to say you should discount this segment, only that it isn’t one of the strongest, most universal.  Surprisingly, there really weren’t too many that were close to the cutoff.  Several, but not a majority, were in the 4 or 5 range, only one was at 7.

step 8 - 4

 step 8 - 5

step 8 - 6

 step 8 - 7

  step 8 - 8step 8 - 9

 step 8 - 10

 Step 8 - 11

step 8 - 12

Clustering

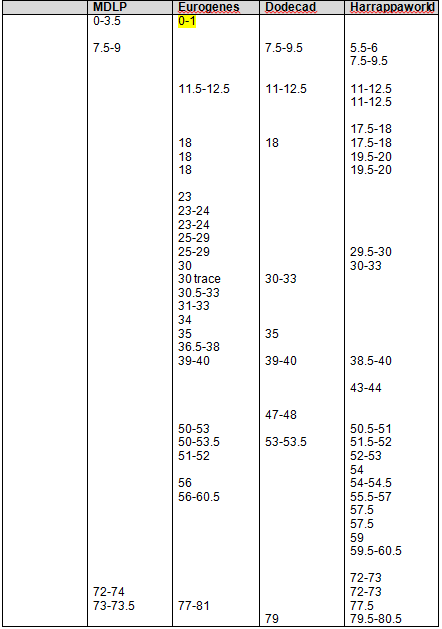
The third step in data extraction is to look at all of the data together.  In this step, we are removing the geographic boundaries of Siberian, N. Amerindian, etc. and combining all of our data.  I have only combined the data within columns, not between columns, so we can get a feel for which tool or tools performed best or maybe not so well.  Each chromosome in each column has its data ordered numerically, and yes, this is a manual cut and paste process.  Sorry.  I warned you, this is an very manually intensive process.

After I put each column in numerical order, I arranged them so that the numbers were approximately in a line, or a row, with each other.  For example, in the first group below, you can clearly see that the first cluster of results is found using all 4 tools.  When looked at individually, only the blue results were noted as common (at least 8 of 15 for blue), but when viewed as a cluster, you can see between the tools that the cluster itself runs from about 7.5, with a small break from 8-9, and then to about 14.5.  As you would expect the beginning and end points of the cluster trail off and are not uniform between tools, but the main part of the cluster is found in all the tools.  This introduces the question of how to measure a cluster.  In this case, there is a clean break using all tools between 8 and 9, but that is only 1 mb, rather difficult to measure accurately.  You could record this as two distinct clusters but since it’s very closely adjacent the rest of the cluster, I’m inclined to include this as one large cluster and use the starting and ending segments for the cluster as a whole, in other words, the cluster runs from 7.5 through 14.5.  The alternate, or more conservative methodology would be to use the “in common” numbers, but in this case, that would be only 10-11.5 and I think you would miss a great deal of useful data.  So, for clusters, I’m recording the full extent of the cluster.  In some cases, you may need to exercise a judgment call.

Let’s look at the second group of numbers, beginning with 18.5 in Harrappaworld.  This grouping runs though about 28.  Eurogenes found some blended Asian between 27-28.5 as well in two of the geographies, but over all, of the 15 tools, we don’t see much.  This could be a result of a number of things.  I could have had problems with the colors, there may be only a very small amount and it may be categorized as something else with the other tools.  I would not consider this a cluster, and using our best 3 or 4 methodology eliminates this cluster from consideration.  This also holds true for 43-43.5.

However, the next cluster, from 55.5 to 58 is found in the Strong Native comparison, indicated by the yellow highlighting and is found using all 4 tools.  This is definitely a cluster.

step 8 - 13

step 8 - 14

step 8 - 15

step 8 - 16

step 8 - 17

step 8 - 18

step 8 - 19

Step 8 - 20

step 8 - 21

step 8 - 22

step 8 - 23

step 8 - 24

I’ve synthesized the cluster information into a list.  From the clusters above, I’ve created a list that I will be using in the next segment for data input into my spreadsheet of matches.  The blended segments below that include Strong Native segments are shown with yellow.

step 8 - 25

Using the GedMatch admixture applications, we’ve isolated the strongest Native and the Blended Asian segments and clusters in preparation for identifying specific Native family lines within our group of matches.

This process shows that, for the most part, the Strong Native segments picked up the strongest signals, about half of the segments that will be useful in determining Native admixture, although it does miss some.

When we use the clustering technique to view our results across all the admixture tools, we see a somewhat different picture emerge, adding several Blended Asian clusters.

In Part 9 of this series, we will use the highlighted Strong Native segments and the Blended Asian clusters, both of which suggest Native chromosomal “hotspots” to begin our comparison to our genetic matches for genealogical relevance.  In other words, using this information, we will determine which genealogical lines carry Native ancestry.

Part 9 may be somewhat delayed.  The good news is that Family Tree DNA is finishing work on their Build 36 to Build 37 conversion.  The bad news is that it fell right in the middle of writing this series.  When they finish Build 37, I’ll finish Part 9 of this series.  In the mean time, you can be extracting your minority segments using the tools and techniques that we have covered in Parts 1-8.

______________________________________________________________

Disclosure

I receive a small contribution when you click on some of the links to vendors in my articles. This does NOT increase the price you pay but helps me to keep the lights on and this informational blog free for everyone. Please click on the links in the articles or to the vendors below if you are purchasing products or DNA testing.

Thank you so much.

DNA Purchases and Free Transfers

Genealogy Services

Genealogy Research

The Autosomal Me – DNA Analysis – Splitting Up

DNA Analysis purchased 1-24-2013

This is Part 6 of a multi-part series.

Part 1 was “The Autosomal Me – Unraveling Minority Admixture” and Part 2 was “The Autosomal Me – The Ancestors Speak.”  Part 1 discussed the technique we are going to use to unravel minority ancestry, and why it works.  Part two gave an example of the power of fragmented chromosomal mapping and the beauty of the results.

Part 3, “The Autosomal Me – Who Am I?,” reviewed using our pedigree charts to gauge expected results and how autosomal results are put into population buckets.  Part 4, “The Autosomal Me – Testing Company Results,” shows what to expect from all of the major testing companies, past and present, along with Dr. Doug McDonald’s analysis.  In Part 5, “The Autosomal Me – Rooting Around in the Weeds Using Third Party Tools,” we looked at 5 different third party tools and what they can tell us about our minority admixture that is not reported by the major testing companies because the segments are too small and fragmented.

In this segment, Part 6, “DNA Analysis – Splitting Up” we’re going to focus on specific aspects of those tools and begin our analysis of our minority ancestry.

Analysis.  Sounds like I’m climbing on the shrink’s couch.  But I’m not, I’m saving all my dollars for DNA kits!  Besides, I don’t want to stop!  This analysis, we’ll do by putting several pieces of data together and sorting the wheat from the chaff.  And yes, we’ll be splitting up…well…splitting our DNA up into pieces contributed by our father and mother.

Let’s start with looking at the DNA segments that mother and I share that are Native.

According to Doug McDonald, we have significant Native matches on chromosomes 1 and 2, with third party tools confirm that finding.  Unfortunately, the only company where Mom’s DNA resides is Family Tree DNA whose test did not reveal the Native ancestry.  23andMe did confirm Native segments in my DNA in those locations.

I’ve used several third party tools at GedMatch to see where Mom and I both have Native heritage, where she has it and I don’t, and equally as important, where I have it and she doesn’t?  What is that so important?  Simple, it means my father had Native heritage too, and tells me on which chromosomes his Native DNA is located  This could, when matching people in the future, on particular segments, help to isolate who our common Native ancestor was, or at least which line.  That is the ultimate goal we are working towards with this entire process.

In this case, to identify my father’s Native lines, if Mom and I neither or both have Native markers at a particular chromosome location, the values are irrelevant, because the Native lineage came from mother.  I did notice in a few cases that I had more than mother, and of course, in that situation, it means that my father contributed some too, or my mother had a misread in that region or a categorization issue exists.  For that reason, I am looking for patterns, not single instances.  We’ll discuss using patterns in a future segment.

Using the MDLP chromosome mapping tool, as MDLP appears to be the most comprehensive, I created a spreadsheet using my results as a base.  I then added mother’s values in the spaces where I had no values, and then I highlighted my results in the locations where mother had no value.  The essence of this is that the red, bold, underscore values mean Mom had a Native result here, but I didn’t receive it.  A yellow highlighted cell means I got the entire amount from my father, because my mother has no percentage showing.  In other cases, of course, it’s possible that both mother and father contributed Native ancestry on some adjacent chromosome segments.  The MDLP mapping tool with my additions is shown below for chromosomes one through eight.  Chromosomes 9-22 are similar, but the chart is too big to display as a whole.  This provides an example of how to do this analysis with your own results.

MDLP Chromosome Map Table

The results were very interesting.

My two primary regions, North-East-Europe and Atlantic-Mediterranean-Neolithic, were represented on every chromosome for both my mother and myself.  No surprises there.  The other regions would be considered minority admixture.

In 2 categories, North-European-Mesolithic and East Siberian, only my father contributed genetic material on some chromosomes and there were no chromosomes where my mother alone contributed.

In 1 category, Melanesia, only my mother contributed genetic material on some chromosomes and there were no chromosomes where my father alone contributed.

In all other categories, both parents contributed on some chromosomes where the other didn’t.  This is important, because it will allow me to associate a match with a particular segment of a chromosome on a particular parent’s side with Native ancestry.

In the minority categories for Native American, Mesoamerican, Arctic-Amerind, South America Amerind and North Amerind, grouped together, both parents contributed on some chromosomes where the other didn’t, and in two categories, on 3 chromosomes, I carry more than my mother, indicating an additional contribution from my father.

This is a repeated occurrence, with Native ancestry for my parents and I combined showing on a total of 42 chromosome locations across 4 geographic/ethnic categories, and in at least three cases, both parents contributed.

In the African categories, South African, Sub-Saharan and Pygmy, I had contributions from both parents on a combined total of 18 chromosome segments.  The African admixture, in total, was less than the Native, and they are assuredly below 5% combined.  If they were present at higher levels, I wouldn’t need to go through these genetic gyrations to prove or disprove the heritage and which parent contributed, because it would be evident in the testing results of all companies.

In our next segment, Step 7, we will be further scrutinizing Chromosomes 1 and 2 for additional information about Native heritage and assigning specific Native segments that I carry on various chromosomes  to either my mother or father’s lineage.

______________________________________________________________

Disclosure

I receive a small contribution when you click on some of the links to vendors in my articles. This does NOT increase the price you pay but helps me to keep the lights on and this informational blog free for everyone. Please click on the links in the articles or to the vendors below if you are purchasing products or DNA testing.

Thank you so much.

DNA Purchases and Free Transfers

Genealogy Services

Genealogy Research

The Autosomal Me – Rooting Around in the Weeds Using Third Party Tools

This is Part 5 of a series.

Part 1 was “The Autosomal Me – Unraveling Minority Admixture” and Part 2 was “The Autosomal Me – The Ancestors Speak.”  Part 1 discussed the technique we are going to use to unravel minority ancestry, and why it works.  Part two gave an example of the power of fragmented chromosomal mapping and the beauty of the results.  Part 3, “The Autosomal Me – Who Am I?,” reviewed using our pedigree charts to gauge expected results and how autosomal results are put into population buckets.  Part 4, “The Autosomal Me – Testing Company Results,” shows what to expect from all of the major testing companies, past and present, along with Dr. Doug McDonald’s analysis.

In this segment, Part 5, we’re going to look at various third party tools and what they can do for our search for minority admixture.  We will use the download files from either 23andMe and Family Tree DNA and utilize third party tools to analyze the raw data.  We’ll see how third party developers put those puzzle pieces together, if the results are consistent and what they tell us.

The Weeds

When dealing with testing companies, particularly any individual source (as opposed to multiple testing company results, as I have done), minority admixture, especially less than 1% may not be successfully recognized.  One percent equates to between 6 and 7 generations or about to the 1800 threshold in time.  However the history of both African and Native admixture in colonial America goes back another 200 years to the Jamestown era.

The social history in the US means that there are many people looking for this admixed heritage as long ago as 1609 when Jamestown was established and the first European/Native marriages took place (although there were “blonde Indians” reported by Jamestown settlers).  In round numbers, that’s about 400 years or between 13 and 16 generations.  Of course, a minority ancestor drops below the 1% threshold between 7 and 8 generations (with the first generation being the person tested) and by the time you get to the 12th generation, you’re at .048%.  At this level, Bennett Greenspan says we’re “rooting around in the weeds,” and he’s right.

However, rooting around in the weeds for those dreaded IBS (Identical by State) segments in genealogy is exactly what we need when looking for small amounts of minority admixture.  What’s an IBS segment you ask?  It’s a segment that is typically too small to be counted as an IBD, or identical by descent, segment.  IBS means that you’re from a common population if you match someone with a very small segment, not necessarily that you share a common ancestor within the past several generations.  But how to you tell if a small segment is IBS or IBD?

There is no absolute line in the sand, but often segments smaller than 7cM (centimorgans) or 700 SNPS (some say 5cM and 500 SNPs) fall into the IBS category.  This has caused some researchers to discard all segments of this size because they can’t tell the difference.  That’s unfortunate, because clearly some of these segments are IBD and the IBS segments can be useful too.

When looking for minority admixture in two people, both of them having these small segments in the same location can provide meaningful information, and can confirm minority heritage.  Said another way, if two people have less than 1% Native heritage, both share a common ancestor, and both carry part of their “less than 1%” on the same segment….one might say it’s not likely to be coincidence.  Identifying the common segments of your common ancestor can lead to identifying the specific family line those segments came from, especially if you match others as well.  This is in essence what Minority Admixture Mapping, or MAP, does.  It uses these techniques to look for patterns in these small fragmented pieces that, when taken together, indicate minority heritage.  Having said that, some IBS segments will indeed, be simply that, because you share the same base population, but some will be IBD, or more current in time.  With the MAP technique, we’re sorting through ways to utilize these small segments, whether they are IBS or IBD.

Using the tools, MDLP, Eurogenes, Dodecad and HarrappaWorld at GedMatch allows us to “root around in the weeds,” to quote Bennett, and find those all-important small IBS/IBD segments that connect us to a particular ethnicity and ultimately, to other relatives who carry these same segments in the same locations.

In general, using these this type of DNA is called BGA, or Biogeographical Ancestry where we use SNPs of autosomal DNA called AIMs, Ancestry Informative Markers.  A SNP is a Single Nucleotide Polymorphism, or a mutation that happened in one specific location on a gene.  AIMs are generally SNPs, not clusters of markers, found at different frequencies in different populations.  We combine all we know about them scientifically with information about population frequencies and then draw inferences about where our ancestors came from based on that information.  So a SNP that is useful in determining ancestry is called an AIM.

These SNPs, or AIMs, are the foundation for these BGA tools that we will be using to sort through small segments of minority admixture.  So this is a building block process.  Scientists identify SNPs found in different populations at different frequencies and identify them as such, then scientists and genetic genealogists create BGA tools that use and combine SNPs/AIMs to suggest populations and ethnicities for those who carry them.  Using these tools, majority ancestry is easy to discern.  We’re going to use those tools to look at groups of SNPs/AIMs clustered in small, fragmented IBS or IBD segments to do Minority Admixture Mapping (MAP) to confirm our minority admixture and to identify our minority admixed lines, families and perhaps even (in time) our original minority ancestor.

I bet you thought I couldn’t fit all of those acronyms in one paragraph, but I did:)  It is a bit like alphabet soup, but when you understand that this is a building process, it’s much easier to grasp as a whole.

Having at least one parents DNA makes this process much easier, because you can immediately tell if your other parent, by inferrence or process of elimination, has contributed any of the minority ancestry, or if it’s all on one side of the tree.  Of course, that’s assuming your parents aren’t related to each other.  There’s a test for that too at GedMatch.  If you don’t have one parent available, you can “make do” with aunts, uncles and cousins, but it’s a much more tedious process.

Third Party Tools

To use any of these BGA tools, you’ll need to download your results from either 23andMe, Family Tree DNA or National Geographic.  Currently at GedMatch, the only supported formats are 23andMe or Family Tree DNA, because the National Geographic test is so new.  I used my Family Finder (Illumina Build 36) raw data file.

To download your results from 23andMe, sign on to your account, then click on this link and it will take you to the area to download your results.

https://www.23andme.com/you/explorer/

Save the file and do not open it as the act of opening it sometimes causes corruption and you will have a hard time uploading the file.  If the upload fails, download a new copy and start over.  If you have an older copy on your computer, it’s always a good idea to use a fresh copy to incorporate any changes made by the vendor since your last file download.

To download your results from Family Tree DNA, sign on to your personal page, click on the Family Finder tab and then on “Download Raw Data.”  As I write this, Family Tree DNA is in the midst of a conversion from Build 36 to Build 37 for their autosomal files (in order to facilitate the integration of 23andMe results), so you may need to be a bit patient while this process completes.  Files may not be available for download at some points.  You certainly don’t want to mix comparisons, meaning using one build 36 and one build 37 file for comparison.

If you’re following this process yourself with your own data, please read all the way through this posting before starting your own processing.

Now, let’s look at the third party tools.

Stanford University

This tool is available at Stanford University.  Scientists have collaborated to provide this service and I think it’s quite interesting.  This tool is not compatible with any browser except Chrome and it requires a download of your autosomal data in a .txt file.  If it can’t load your file, the loading task simply never completes.  For me, that meant it wasn’t a .txt file I was trying to load.

http://esquilax.stanford.edu/

Load your file and choose Ancestry, then Paintings, then Hap Map 3 (experimental), then Paint my Chromosomes.

weeds 1

Their legend, above, translates to the regions, below.

ASW – African ancestry in Southwest USA

CHD – Chinese in Metropolitan Denver, Colorado

GIH – Gujarati Indians in Houston, Texas

LWK – Luhya in Webuye, Kenya

MEX – Mexican Ancestry in Los Angeles

TSI – Toscani in Italia

weeds2

Unfortunately, this isn’t terribly useful.  Hap Map 3 utilizes additional regions, including Utah, but this tool doesn’t seem to be mapping them, so my closest match region is Italy, which is midleading since none of my family was from Italy.  Hap Map 2 is also an option which does include the Utah population, but it’s not as up to date otherwise as Hap Map 3.

David Pike has figured out how to tweak these settings some.  You can read about it at this link:  https://www.23andme.com/you/community/thread/8062/.  David’s posting on June 20th shows what he did.  However, compared to the other tools available, I find this a poor choice and did not spend a lot of time trying to work with it.

However, a second feature that they provide is fun.

Stanford provides a Neanderthal tool that’s a little different than the Nat Geo or 23andMe ones.  Click on Explore, Neanderthal, Look Up Exercise.  Then enter your primary ethnicity and click on Look Up Exercise again.

Of a possible 84 Neanderthal alleles, I have 9, partially displayed below.

weeds3

GedMatch

www.Gedmatch.com is a complimentary (voluntary contribution) site created by two genetic genealogists that includes several autosomal analysis tools.  One of the areas of this site is “Admix Tools.”  On that page one finds several private or proprietary tools, some written by genetic genealogists, some by researchers, and all free.  Let’s take a look at each one and their results.  If you want to see any of the results more closely than the photos here allow, you can run each of the comparisons using kit F6656 (mine) as the first kit and kit F9141 (my mother) as the second kit.

Each of these tools offers the same functionality, as follows.

weeds 4

We will be utilizing 4 of these functions for each tool.

  • Admixture Proportions
  • Admixture Proportions by Chromosome
  • Chromosome Painting
  • Paint Differences between 2 kits, 1 chromosome

We select from the tools as follows:

weeds 5

Let’s take a look at what the tools provide.

MDLP World 22

The MDLP software is sponsored by two genetic genealogists.  You can read more about the project at http://magnusducatus.blogspot.com/ and http://magnusducatus.blogspot.com/2012/09/behind-curtains-mdlp-world-22-showcase.html.

weeds 6

MDLP shows several populations.  I was interested to see if my mother also shared the African percentage.  Interestingly, mother does have a South African segment, but it’s .12, so less than mine.  Therefore, I would have obtained part of my African heritage from my father.  She also has three different categories of Native American heritage, compared to my one.  She carried a total of 1.92% and I carry .58%.  Otherwise, our results are very similar.

weeds 7

The next feature is ethnicity mapping by chromosome.  While the display is too large to see well it’s interesting to note that indeed, both Native American and African were detected on several chromosomes, not just on chromosomes 1 and 2 as reported by 23andMe and Dr. McDonald.  Note that DeCode Genetics showed “East Asian” admixture on several chromosomes.

weeds 8

Here’s a portion of the above chart that you can actually see.  The highlighted blue regions are your major ethnic regions.

weeds 9

Another feature is chromosome painting, shown below.  This shows the first part of my chromosomes 1 and 2 painted by ethnic/regional breakdown.  The legend for each tool is different and above their graph.

weeds 10

weeds 11

These tools also provide the ability to compare one chromosome between two people.  On the graph below, my chromosome 1 is on the top, and my mother’s is second, with the third band being our common painting.  The black represents non-shared regions, meaning those contributed to me by my father.  Unfortunately, North American Native American is dark grey, sometimes difficult to distinguish from black.

weeds 12

The graph below shows that while I do share a large piece of Chromosome 1’s Native region (about 160-180mb) with my mother, there are also segments, 169-170 for example, where I have Native genes that she does not, indicating Native heritage in this location from my father’s side.

weeds 13

Eurogenes K9

Eurogenes was created by another genetic genealogist.  You can read more about it at http://bga101.blogspot.com.au/2012/04/eurogenes-admixture-utilities-at.html.

weeds 14

Eurogenes calls me primarily North European with .67 Native American and no African in the percentages above, but below, on the individual chromosomes, some African does show, although not on as many chromosomes as MDLP.

weeds 15

In the charts above and below, you can see that Eurogenes detected small amounts of African along with Native American.

weeds 16

weeds 17

Notice that at about 10mb on chromosome 1, on the graph below in the top band, that the North American Indian (yellow) and the South Asian (red) are imbedded with each other.  These appear again together at the beginning of chromosome 2, shown as the second band.  This hints at how and why it’s sometimes so difficult to determine and filter Native American from Asian.  There is no line in the sand, there is a continuum between populations, the only differentiator being 10,000 to 15,000 years spent apart in which time, they, hopefully, developed enough differentiating mutations that we can tell them apart.

weeds 18

On the chart below, the top band shows the chromosome painting of my chromosome, and the second band shows the chromosome 1 Native American segment (about 160-180 mb) of my mother with the third band showing both matching and non-matching regions, painted black.  Looking at the segment of chromosome 1, in the graph below, characerized as Native, we can see in mine, top row, that this is categorized as Native American (yellow), but some of the same regions below, in Moms are categorized as South Asian (red), causing a technical non-match, when in reality, It’s likely a categorization issue, not a genetic mismatch.  In future analysis, we’ll be using two methods of comparison, one called “Strong Native” that only matches Native to Native and another, the “Blended Asian” method that allows for grouping of similar ancestral types that together likely indicate a Native heritage.

weeds 19

Dodecad V3

Dodecad was created by an anthropologist.  You can read more about it at http://dodecad.blogspot.com/ and http://dodecad.blogspot.com/2011/06/design-of-dodecad-v3.html.

weeds 20

Dodecad, unfortunately, does not subdivide into Native American, so the Native will show here as some form of Asian.  Northwest Africa shows in the percentages above, but more detailed African heritage shows in the chromosome detail below in regions not shown above.

weeds 21

weeds 22

weeds 23

weeds 24

Above, my chromosome painting for the first part of chromosomes 1 and 2.

Below, the comparison showing the Native segments from about 160-180mb.   My Native segment (top) compared to mother’s (middle) with the comparison of the two on the bottom for chromosome 1.

weeds 25

HarappaWorld

HarappaWorld divides results into fewer population groups and is focused on Asia.  You can read more about it at http://www.harappadna.org/2012/05/diy-harappaworld/.

weeds 26

In HarrappaWorld, Beringian and American appear to be equivalent to Native American.  Like Dodecad and Eurogenes, African does not show in the total percentages, but does on the individual chromosome analysis, although in smaller percentages with this application.

weeds 27

weeds 28

weeds 29

Chromosome painting of my chromosomes 1 and 2 are shown below.

weeds 30

The graphs below show the Native region comparison of chromosome 1 between me, top row, mother, middle row, and the third graph showing the common areas, with black representing areas where there is no match.

weeds 31

For each of these tools and their results, we’ll do further analysis in a future segment of this series.

Tools Summary

Now that we’ve looked at these individual tools,  and building on the Test Results Chart created in Parts 3 and 4, let’s compare and see what information these tools add.

Test Results Chart Including Third Party Tools

Test/Company European Asian Native African Unknown
Pedigree Analysis

75%

0

~1%

0

24%

Testing Companies
Family Tree   DNA – Original

100%[1]

0

0

0

deCodeme

92%

5%

Inferred[2]

3%

deCodeme –   X

91%

6%

Inferred

3%

Dr.   McDonald

97-99%

1-3%

0.5%

0

23andMe –   Original

99%

1%

Inferred[3]

0

0

23andMe –   2012 – Standard

99.2%[4]

0

.5%

0

.3%

23andMe –   2012 – Conservative

98.7%[5]

0

.3%

0

1%

23andMe –   2012 – Speculative

99.3%[6]

0

.5%

0

.2%

Family Tree   DNA – 2012

100%[7]

Geno 2.0

79%[8]

18%

0

0

0

Ancestry

92%[9]

0

0

0

8%

Third Party Tools
MDLP

86.68%

12.55%

.58%

.17%

0

Eurogenes

94.83%

4.5%

.67%

0

0

Dodecad

85.47%

13.43%

Inferred

1.09%

0

HarrappaWorld

86.56%

12.80%

.65%

0

0

Of the various chromosomes, the breakdown is as follows. Dodecad does not break the categories in a comparable fashion to these other 3 tools, so their results are omitted in the following chart.  Please note that how geographies are categorized can make a significant difference.

Minority by Chromosome Chart

Tool/Chr MDLP Native Eurogenes Native Harrappa Native MDLP African Eurogenes African Harrappa African
1 Y Y Y N N N
2 Y Y Y Y Y N
3 N N N Y Y N
4 Y N Y N N N
5 N N N N N N
6 Y Y Y Y N N
7 N N Y N N N
8 Y Y Y Y N Y
9 Y N N Y N N
10 Y N N Y N N
11 Y N Y Y N N
12 Y N Y N N N
13 Y N Y N N N
14 Y Y Y Y N N
15 Y N N N N Y
16 Y Y Y Y N N
17 Y Y Y N N N
18 N N N N N N
19 Y Y Y Y N N
20 Y Y Y Y N N
21 Y N Y N N N
22 N N N Y Y N

From these various tools, it’s obvious that I do have some Native admixture, probably about 1%, and it’s from both parents.  I also have some African, but it looks to be an even smaller proportion that Native American.

Join me for Part 6 of this series, where we look at how to analyze and use this information.


[1] 71.5% western European, 28.4% Northeastern European

[2] Inferred that Asian is actually Native in an American with no history of Asian ancestry.

[3] No category, inferred.

[4] 78.6% Northern European, 1.8% Southern European, 18.7% Nonspecific European

[5] 54.6% Northern European, .3% Southern European, 43% Nonspecific European

[6] 91.7% Northern European, 3% Southern European, 3.3% Nonspecific European

[7] 75.18% West Europe (French and Orcadian), 24.82 Europe (Romanian, Russian, Tuscan and Finnish).  Note that my mother’s results are almost identical except the Finnish is missing from hers.

[8] 43% North Europe and 36% Mediterranean

[9] 80% British, 12% Scandinavian

______________________________________________________________

Disclosure

I receive a small contribution when you click on some of the links to vendors in my articles. This does NOT increase the price you pay but helps me to keep the lights on and this informational blog free for everyone. Please click on the links in the articles or to the vendors below if you are purchasing products or DNA testing.

Thank you so much.

DNA Purchases and Free Transfers

Genealogy Services

Genealogy Research

2012 Top 10 Genetic Genealogy Happenings

2012 has been a very busy year for genetic genealogists.  There have been lots of discoveries and announcements that affect everyone, now and in the future.  The watchwords for 2012 would be “churn” and “explosive growth.”  Let’s take a look at the 10 most important events, why they are important and what they mean for the future of genetic genealogy.

These items are in what I think are relatively good order, ranked by their importance, although I had a very difficult time deciding between number 1 and 2.

1. The New Root – Haplogroup A00

At the Family Tree DNA conference in November, Michael Hammer, Bonnie Schrack and Thomas Krahn announced that they had made a monumental discovery in the age of modern man known as Y-line Adam.  The discovery of Haplogroup A00 pushes the “birth” of mankind back from about 140,000 years ago to an amazing 338,000 years ago.  Utterly amazing.  The DNA came from an American family from South Carolina.  This discovery highlights the importance of citizen science.  Bonnie is a haplogroup administrator who recognized the potential importance of one of her participants’ DNA.  Thomas Krahn of course is with Family Tree DNA and ran the WTY test, and Michael Hammer is at the University of Arizona.  So you have the perfect blend here of participant, citizen scientist, commercial lab and academia.  What was never thought possible a decade or so ago is not only working, it’s working well and changing the face of both science and humanity.

http://dna-explained.com/2012/11/16/the-new-root-haplogroup-a00/

http://www.haplogroup-a.com./

2. Geno 2.0

Geno 2.0 is the Nickname for the National Geographic Society’s Genographic Project version 2.0.  That mouthful is why it has a nickname.

This amazing project has leveraged the results of the past 7 years of research from the original Genographic project into a new groundbreaking product.  Geno 2.0, utilizing the GenoChip, a sequencing chip created specifically for Nat Geo, offers the most complete Y tree in the world today, expanding the SNP tree from just over 800 SNPs to over 12,000.  They are in essence redrawing the Y chromosome tree as I write this.  In addition, the person who purchases Geno 2.0 will receive a mitochondrial DNA haplogroup assignment.  Over 3300 new mitochondrial mutations were discovered. A brand new anthropological “percentages of ethnicity” report is featured based on over 75,000 Ancestry Informative Markers, many only recently discovered by the Genographic project.  Additionally, participants will receive their percentage of both Neanderthal and Denisovan ancestry based on 30,000 SNPs identified that signal interbreeding between the hominids.  A new website will also facilitate social networking and uploading information to Family Tree DNA.
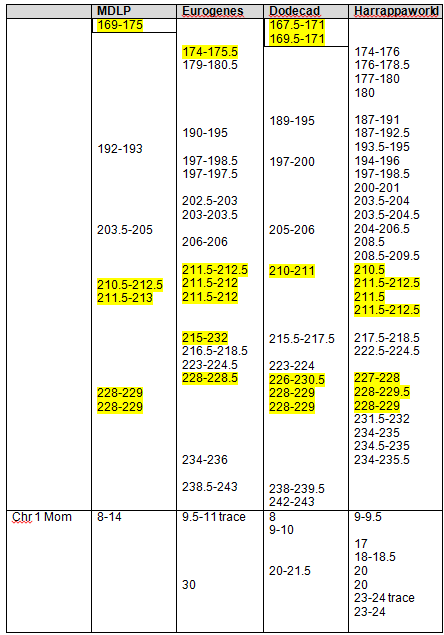
The wonderful news is that there is a massive amount of new information here that will change the landscape of genetic genealogy.  The difficulty is that we are struggling a bit under the load of that massive amount of information that is just beginning to descend upon us.  It’s a great problem to have!

http://dna-explained.com/2012/07/25/national-geographic-geno-2-0-announcement-the-human-story/

http://dna-explained.com/2012/07/26/geno-2-0-qa-with-bennett-greenspan/

http://dna-explained.com/2012/07/30/geno-2-0-answers-from-spencer-wells/

http://dna-explained.com/2012/07/31/geno-2-0-wty-mtdna-full-sequence-participants-and-more/

http://dna-explained.com/2012/10/14/what-to-order-geno-2-0-vs-family-tree-dna-products/

http://dna-explained.com/2012/10/16/geno-2-0-the-kit-arrives/

http://dna-explained.com/2012/12/11/geno-2-0-results-first-peek/

http://dna-explained.com/2012/12/12/geno-2-0-results-kicking-the-tires/

3. Reconstructed Sapiens Reference Sequence (RSRS)

In July, Family Tree DNA implemented the RSRS that in effect reconstructs the genetic profile of Mitochondrial Eve and bases the comparison of our DNA today against the RSRS sequence as opposed to the Cambridge Reference Sequence (rCRS) created in 1981 that is or was the current standard.  The RSRS is a result of the watershed paper published in April 2012 by Dr. Doron Behar and 8 other authors titled “A “Copernican” Reassessment of the Human Mitochondrial DNA Tree from its Root.”  A complementary research website, www.mtdnacommunity.org, accompanies the paper.
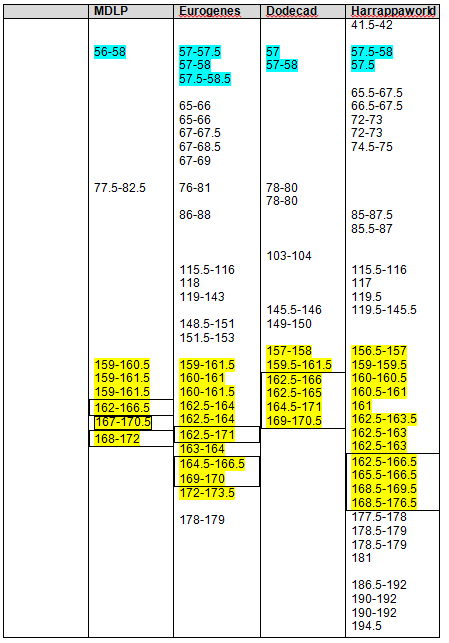
http://dna-explained.com/2012/07/14/what-happened-to-my-mitochondrial-dna/

http://dna-explained.com/2012/07/15/the-crs-and-the-rsrs/

http://dna-explained.com/2012/07/16/the-mtdna-community/

http://dna-explained.com/2012/12/02/little-a-big-a-mitochondrial-dna/

4. Full Genome and Exome Sequence Offered Commercially by Gene by Gene

It was announced at the November DNA conference that Gene by Gene, the parent company of Family Tree DNA, through their division titled DNA DTC is offering full genomic sequencing for the amazing price of $5495 for the full genome and $695 for the exome.  This is a first in the consumer marketspace.  Today, this doesn’t have a lot of application for genetic genealogy, but as the price continues to drop, and utilities are built to process the full genomic data, certainly a market and applications will emerge.  This is an important step forward in the industry with a product that still cost 3 million dollars in 2007.

http://dna-explained.com/2012/11/30/gene-by-gene-announces-landmark-dna-dtc-full-genome-sequence/

5. Neanderthal and Denisovan DNA

It’s official – they did it.  Yep, they interbred and well, they are not them anymore, they are us.  Given that everyone in Asia and Europe carries a part of them, but not people from Africa, it would appear that two populations admixed rather thoroughly in Eurasia and/or the populations were small.  The amount of Neanderthal and Denisovan DNA will continue at approximately the proportions seen today in Europe (2% Neanderthal) and Asia unless a significant amount of admixture from a population (Africa) that does not carry this admixture is introduced.  So if you’re European, you carry both Neanderthal and Denisovan DNA.  They are your ancestors.  The good news is that you can find how much of each through  the Geno 2.0 test.  23andMe results give you the percentage of Neanderthal, but not Denisovan.

http://dna-explained.com/2012/08/31/denisovan-dna-tells-a-story/

http://dna-explained.com/2012/12/12/geno-2-0-results-kicking-the-tires/

6. Ancestral Genome Reconstruction Begins,  Led by Falling Autosomal Prices and the Ability to Fish in Multiple Ponds

2012 has been the year of autosomal testing price reductions and a great deal of churn in this marketspace.  Companies are playing leap-frog with one another.  However, sometimes things are not all that they seem.

Initially, 23andMe opted for an initial payment plus monthly subscription model, which they abandoned for a one time payment price of $299 in early 2012.  Family Tree DNA was slightly less, at $289.

Ancestry led the price war by giving away kits, then selling them for $99, then $129 plus a subscription as an entrance into this market.  However, looking at the Ancestry consent form hints at possible reasons why they were selling below the cost of the tests.  You are in essence giving them permission to sell your DNA and associated information.  In addition, to gain full access to your results and matches, you must maintain some level of subscription to Ancestry.com, increasing the total effective price.

Next came Family Tree DNA’s sale where they dropped their autosomal price to $199, but they were shortly upstaged by 23andMe whose price has now dropped to $99 permanently, apparently, a result of a 50 million dollar investment in order to reach 1 million customers.  They currently have about 180,000.  23andMe has always been in the medical/health business, so their clients have always understood what they were consenting to and for.

Not to be outdone, Family Tree DNA introduced the ability earlier in 2012 to upload your data files from 23andMe to FamilyTree DNA for $89, far less than a second test, which allows you to fish in a second pond where genealogists live for matches.  The challenge at 23andMe is that most of their clients test for the health traits and either don’t answer inquiries or match requests, or know little about their genealogy if they do.  At Family Tree DNA, matches don’t have to answer and allow a match, testers are automatically matched with all participants who take the Family Finder test (or upload their 23andMe results) and testers are provided with their matches’ e-mail address.

Of course, Geno 2.0 was also introduced in the midst of this, in July, for $199 with the additional lollipop of new SNPS, lots of them, that others simply don’t have access to yet.

The good news is that consumers have benefitted from this leapfrogging, I think.  Let’s hope that the subsidized tests at Ancestry and 23andMe don’t serve long term to water down the demand to the point where unsubsidized companies (who don’t selling participants genetic results to others) have problems remaining viable.

Personally, I’ve tested at all of these companies.  I’ll be evaluating the results shortly in detail on my blog at www.dna-explained.com.

The tools provided by most testing companies, plus GedMatch, and multiple ponds to fish in are allowing the serious genetic genealogist to “reconstruct” their genome, attributing segments to specific ancestors.  Conversely, we will also be able to “reconstruct” specific ancestral family lines as well by identifying autosomal segments in multiple descendants.  This new vision of autosomal genetic genealogy will allow much more accurate ancestral line matching, and ancestor identification in the not-so-distant future.

http://www.yourgeneticgenealogist.com/2012/01/family-tree-dna-now-accepting-23andme.html

http://www.yourgeneticgenealogist.com/2012/05/23andme-eliminates-subscription-model.html

http://www.yourgeneticgenealogist.com/2012/10/clarification-of-what-is-available-to.html

http://www.yourgeneticgenealogist.com/2012/12/23andme-receives-50-million-and-drops.html

http://www.thegeneticgenealogist.com/2012/12/26/23andme-and-labcorp-sued-for-patent-infringement/

7. Ethnicity Tests Mature – Minus 1

The good news is that the various ethnicity tests (known as BGA or biogeographical ancestry tests) that provide participants with their percentages of various world populations are improving.  The bad news is that there is currently one bad apple in the card with very misleading percentages – and that is Ancestry.com.

23andMe introduced a new version of their ethnicity product in December, expanding from only 3 geographic categories to several.  The Geno 2.0 test results are just beginning to be returned which include ethnicity predictions and references to several base populations.

Family Tree DNA finally has some competition in this arena where for years they have been the only serious player, although opinions differ widely about which of these three organizations results are the most accurate.  All four are Illumina chip based, using hundreds of thousands of locations, as compared with the previous CODIS type tests which used between 15 and 300 markers and are now outdated.  All companies use different reference populations which, of course, provide somewhat different results to participants.  All companies, except Ancestry, have documented and shared their reference population information.

Outside of these companies, Doug McDonald offers a private analysis and Gedmatch offers a series of BGA comparisons written by third parties.

While this industry continues to grow and mature, I’m thinking about just averaging the autosomal ethnic results and calling it good:)

http://dna-explained.com/2012/07/21/ethnicity-finders/

http://dna-explained.com/2012/10/24/ancestrys-mythical-admixture-percentages/

http://dna-explained.com/2012/12/07/new-worldview-at-23andme/

http://dna-explained.com/2012/09/09/doug-mcdonald-on-biogeograpical-analysis/

http://dna-explained.com/2012/12/11/geno-2-0-results-first-peek/

http://www.yourgeneticgenealogist.com/2012_12_01_archive.html

8. Finding Your Roots PBS Series with Henry Louis Gates

PBS sponsored a wonderful series in the spring of 2012 hosted by Henry Louis “Skip” Gates, the chair of African American Studies at Harvard.  This series followed a lesser known 2010 series.  The 2012 inspirational series reached tens of thousands of people and increased awareness of genetic genealogy as well as sparked an interest in genealogy itself, especially for mixed race and African American people.  I was disappointed that the series did not pursue the Native American results unexpectedly obtained for one participant.  It seemed like a missed opportunity.  Series like this bring DNA testing for genealogy into the mainstream, making it less “strange” and frightening and more desirable for the average person.  These stories were both inspirational and heartwarming.  I hope we can look forward to similar programs in the future.

http://en.wikipedia.org/wiki/Finding_Your_Roots

CeCe Moore covered this series in March and April on her blog.

http://www.yourgeneticgenealogist.com/2012/03/finding-your-roots-with-henry-louis.html

http://www.yourgeneticgenealogist.com/2012/04/finding-your-roots-with-henry-louis.html

http://www.yourgeneticgenealogist.com/2012/04/finding-your-roots-with-henry-louis_09.html

http://www.yourgeneticgenealogist.com/2012/04/finding-your-roots-with-henry-louis_16.html

http://www.yourgeneticgenealogist.com/2012/04/finding-your-roots-with-henry-louis_23.html

http://www.yourgeneticgenealogist.com/2012/04/finding-your-roots-with-henry-louis_30.html

9. Ancestry, GeneTree and Sorenson

GeneTree, a for profit company and Sorenson, a non-profit company were both purchased by Ancestry.com.  This was about the same time as Ancestry introduced their autosomal AncestryDNA product.  Speculation was that the autosomal results at Sorenson might be the foundation for the new autosomal test comparisons, although there has been no subsequent evidence of this.

Ancestry initially gave away several thousand kits in order to build their data base, then sold thousands more for $99 before raising the price to what appears to be a normalized price of $129 plus an annual ancestry subscription.

While GeneTree was never a major player in the DNA testing marketspace, Sorenson Molecular Genealogical Foundation played an important role for many years as a nonprofit research institute.  There was significant distress in the genetic genealogy community related to the DNA contributed to Sorenson for research being absorbed by Ancestry as a “for profit” company.  Ancestry is maintaining the www.smgf.org website, but no additional results will be added.  Sorenson has been entirely shuttered.  Many of the Sorenson/GeneTree employees appear to have moved over to Ancestry.
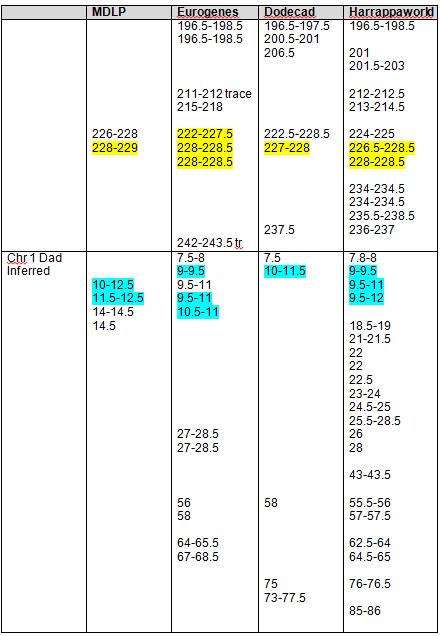
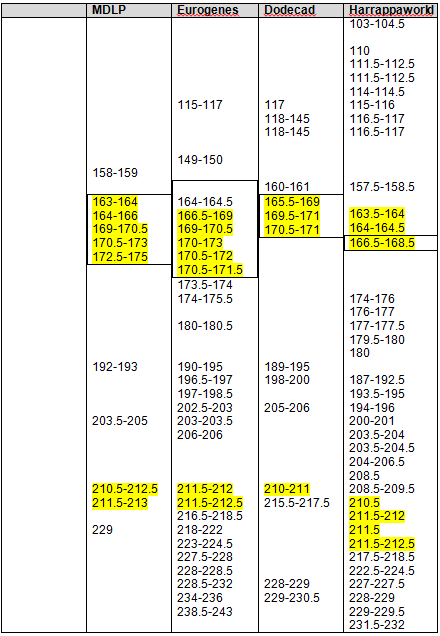
The initial AncestryDNA autosomal product offering is poor, lacks tools and the ethnicity portion has significant issues. It’s strength is that many people who test are already Ancestry subscribers and have attached their trees.  So you can’t see how you connect genetically to your matches (lack of tools), but you can see the trees, if they are attached and not marked as private, of those with whom you match.  Ancestry provides “hints” relative to matching individuals or surnames.

Eventually, if Ancestry improves its products, provides tools and releases the raw data to consumers, this may be a good thing.  It’s an important event in 2012 because of the massive size of Ancestry, but the product is mediocre at best.  Ancestry seems unwilling to acknowledge issues unless their feet are held to the fire publicly as illustrated with a “lab error” erroneous match for an adoptee caught by the consuming public and ignored by Ancestry until CeCe Moore exposed them in her blog.  Whether Ancestry ultimately helps or hurts the genetic genealogy industry is a story yet to be told.  There is very little positive press in the genetic genealogy community surrounding the Ancestry product, but with their captive audience, they are clearly going to be a player.
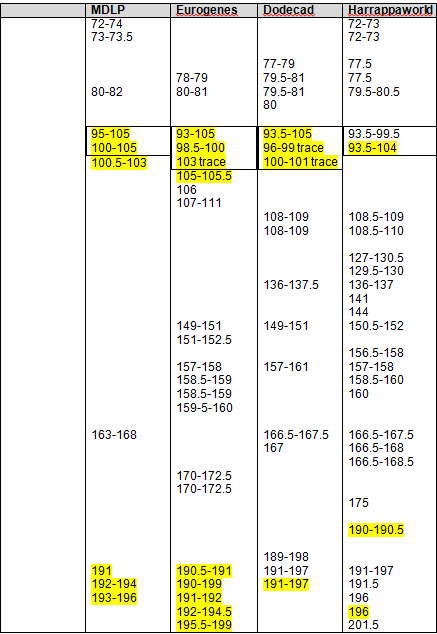
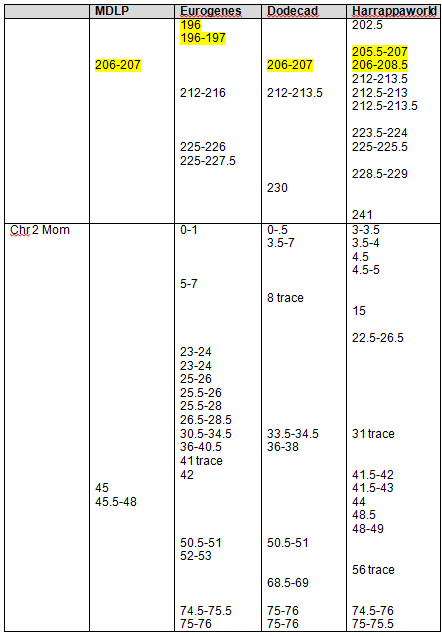
http://www.yourgeneticgenealogist.com/2012/05/ancestrycom-buys-genetree-and-launches.html

http://dna-explained.com/2012/07/12/did-you-test-at-genetree/

http://dna-explained.com/2012/08/30/is-history-repeating-itself-at-ancestry/

http://dna-explained.com/2012/07/18/the-trouble-with-ancestry-com-matches/

http://dna-explained.com/2012/08/14/y-dna-family-tree-dna-vs-ancestry/

http://dna-explained.com/2012/08/16/ancestrys-consent-form-for-ancestrydna-autosomal-test/

http://dna-explained.com/2012/09/10/ancestry-autosomal-results-are-back/

http://dna-explained.com/2012/10/15/ancestrys-dna-survey/

http://dna-explained.com/2012/10/23/ancestry-to-release-array-data-in-2013/

http://dna-explained.com/2012/10/24/ancestrys-mythical-admixture-percentages/

http://www.thegeneticgenealogist.com/2012/06/19/problems-with-ancestrydnas-genetic-ethnicity-prediction/

http://www.yourgeneticgenealogist.com/2012/08/ancestrydna-confusing-relationship.html

http://www.yourgeneticgenealogist.com/2012/08/follow-up-on-ancestrydna-and-adoptees.html

http://www.yourgeneticgenealogist.com/2012/09/23andme-says-no-match-for-adoptees.html

10. GedMatch

GedMatch, www.gedmatch.com, created by John Olson and Curtis Rogers, isn’t new in 2012, but it’s maturing into a tool that is becoming the defacto workhorse of the serious autosomal community.  People who test at either 23andMe or Family Tree DNA download their raw results and other match information and then use a variety of tools at GedMatch to look at results in different ways and using different thresholds. GedMatch is currently working to accept the newly arriving Geno 2.0 data files.  Ancestry does not at this time allow their customers access to their raw data files, so there is nothing to upload. The bad news is that not everyone downloads/uploads their information.  Only the most savvy users, and the download/upload is not always a smooth process, often necessitating several attempts, a magic wand and some fairy dust for luck.

GedMatch is a volunteer effort funded by donations on the GedMatch site.  The magnitude of this project came to light when they needed new servers this year because the amount of traffic disabled their internet service provider.  It may be a volunteer effort, but it has mainstream requirements.  Therefore, while occasionally frustrating, it’s easy to understand why it’s light on documentation and one has to poke around a bit to figure things out.  I would actually prefer that they make it a subscription site, clean up the bugs, add the documentation and take it to the next level.  It would also be very nice if they could arrange something with the major players in terms of a seamless data transfer for clients.  All told, it’s an amazing contribution as a volunteer site.  Hats off to Curtis and John for their ongoing contribution to genetic genealogists!!!

www.gedmatch.com

http://www.legalgenealogist.com/blog/2012/08/12/gedmatch-a-dna-geeks-dream-site/

______________________________________________________________

Disclosure

I receive a small contribution when you click on some of the links to vendors in my articles. This does NOT increase the price you pay but helps me to keep the lights on and this informational blog free for everyone. Please click on the links in the articles or to the vendors below if you are purchasing products or DNA testing.

Thank you so much.

DNA Purchases and Free Transfers

Genealogy Services

Genealogy Research