Recently Shawn and Lois Potter utilized the Minority Admixture Mapping technique I developed, utilized and described in the series “The Autosomal Me” to establish that the mother of John Red Bank Payne was Native American. Shawn and Lois were so encouraged after that positive experience that they set forth to document another Native ancestor.
They produced this report as a beautiful and fully sourced booklet which they have very graciously given permission to reproduce in part here.
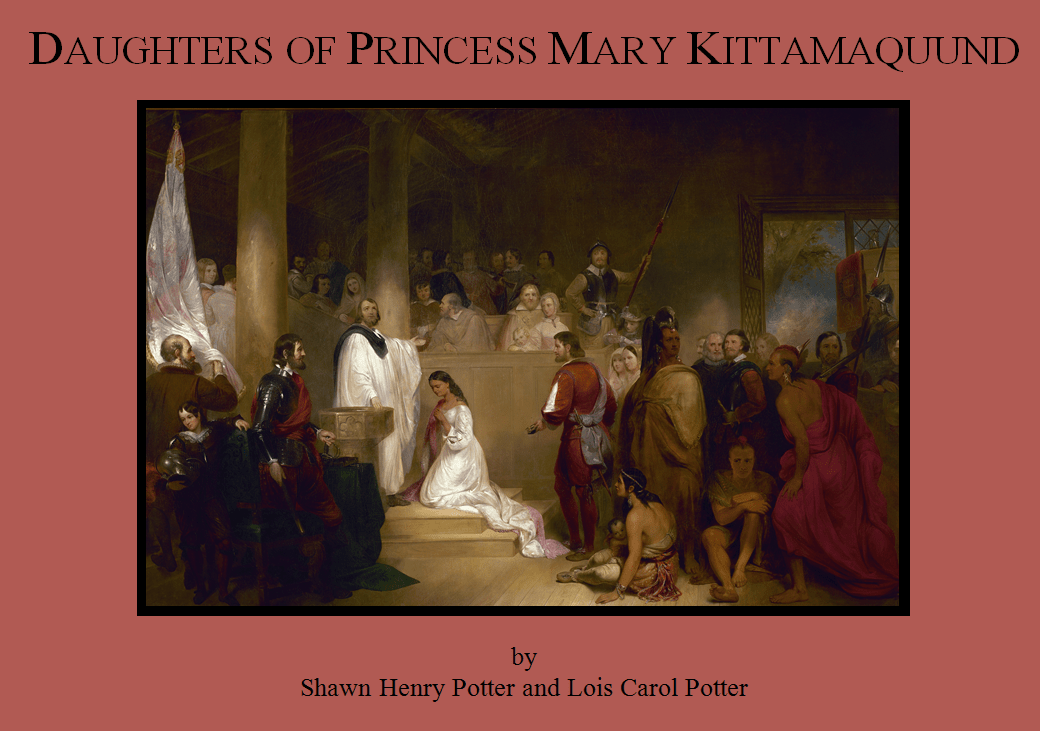
Daughters of Princess Mary Kittamaquund
Every student of American history has heard about Pocahontas—the young Indian princess who struggled to establish peace between the Powhatan Indians and Virginia colonists, married Englishman John Rolfe, and left descendants through her son Thomas Rolfe. But, few have heard about Mary Kittamaquund—another young Indian princess who likewise promoted peace between the Piscataway Indians and Maryland colonists, married Englishman Giles Brent, and, as revealed by archival research combined with DNA analysis, left descendants through her daughters. Both women lived heroic yet brief lives; and both should be remembered for their devotion to their people in an age of momentous danger and change. The following sketch introduces Princess Mary Kittamaquund and her daughters.
Mary Kittamaquund, daughter of the Tayac (Paramount Chief) of the Piscataway Indians, was born in Maryland probably about 1631.[i] Her father ruled over as many as 7,000 people between the Potomac and Patuxent Rivers.[ii] Following about six months of dialogue and study with Jesuit Missionary Father Andrew White, Mary’s father converted to Christianity and was baptized on July 5, 1640.[iii] Soon after February 15, 1640/1, Mary too was baptized, and her father sent her to the English settlement called St Mary’s City, near the mouth of the Potomac River, to be educated by Governor Leonard Calvert and his sister-in-law, Margaret Brent.[iv]
Mary married Giles Brent, brother of Margaret Brent, before January 9, 1644/5.[v] A band of Parliamentarians led by Richard Ingle and William Claiborne attacked St Mary’s City on February 14, 1644/5, and carried Giles Brent, Father Andrew White, and others in chains to England. Upon his arrival in London, Giles brought suit against his captors and returned to Maryland before June 19, 1647.[vi] Mary and Giles moved to present day Aquia, Stafford County, Virginia, after November 8, 1648, and before August 20, 1651.[vii] Mary died probably after April 18, 1654, and before September 4, 1655.[viii] Giles Brent died in Middlesex County, Virginia, on September 2, 1679.[ix]
Scholars disagree about the number of children born to Mary Kittamaquund and Giles Brent. Some list only three children named in the 1663 and 1671 wills of sister and brother Margaret and Giles Brent.[x] Margaret appointed her brother Giles “and his children Giles Brent, Mary Brent, and Richard Brent” executors of her estate.[xi] Giles left bequests to his son Giles Brent and daughter Mary Fitzherbert.[xii] Other historians, such as Dr. Lois Green Carr, Maryland Historian at the Maryland State Archives, on the basis of information gleaned from provincial court records, probate records, and quitrent rolls, identify six children of Mary and Giles, including Katherine Brent (who married Richard Marsham), Giles Brent (who married his cousin Mary Brent), Mary Brent (who married John Fitzherbert), Richard Brent (who died after December 26, 1663), Henry Brent (who died young), and Margaret Brent (who also died young).[xiii]
Some researchers further believe daughter Mary Brent divorced John Fitzherbert before April 26, 1672, and married second Charles Beaven. This belief is supported by (1) a reference to the divorce of Mary and John in a letter of this date from Charles Calvert to his father, (2) a statement regarding “my brother iñ Richard Marsham” in the June 20, 1698 will of Charles Beaven, (3) the appointment of “my well beloved Richard Marsham” by Mary Beaven to be executor of her 1712 will, and (4) other circumstances demonstrating kinship ties between these families.[xiv] Still others refuse to accept this relationship without further evidence, lamenting the loss of contemporary records which has “confused researchers for a hundred years.”[xv]
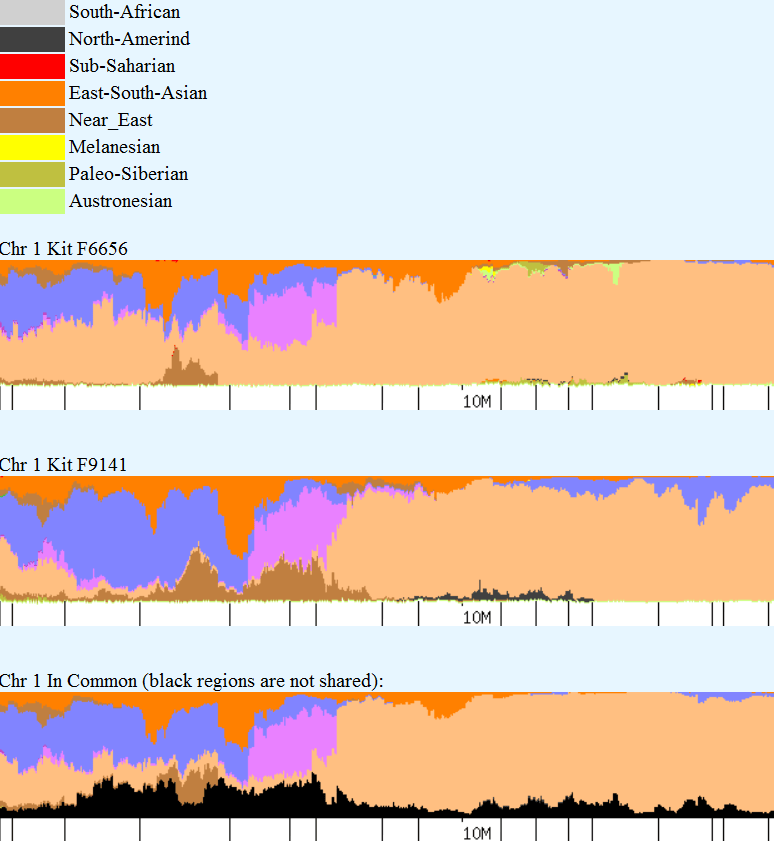
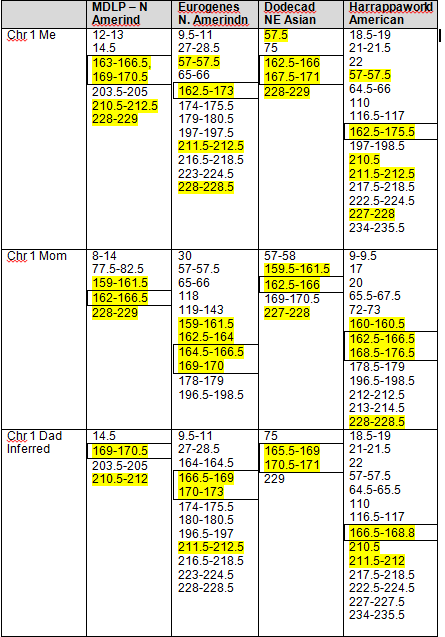
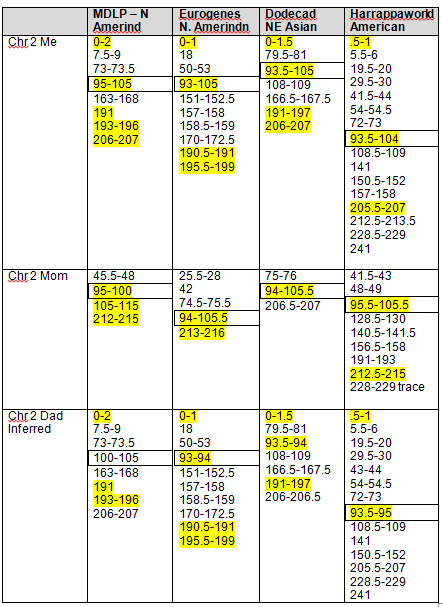
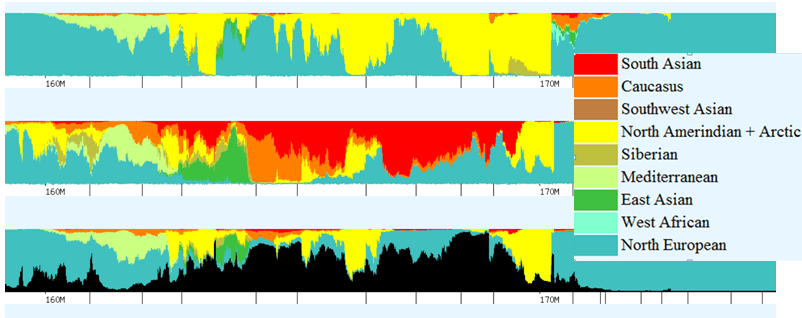
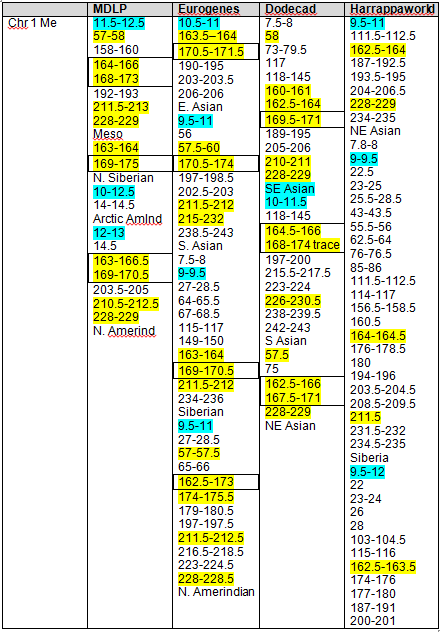
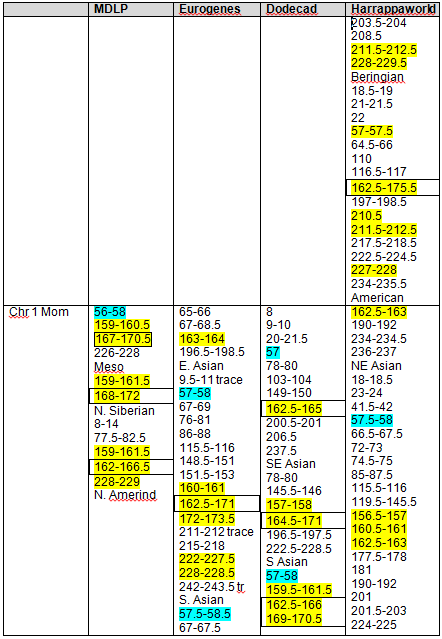
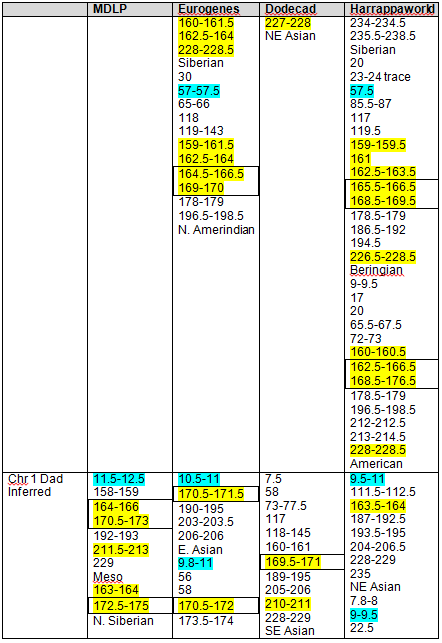
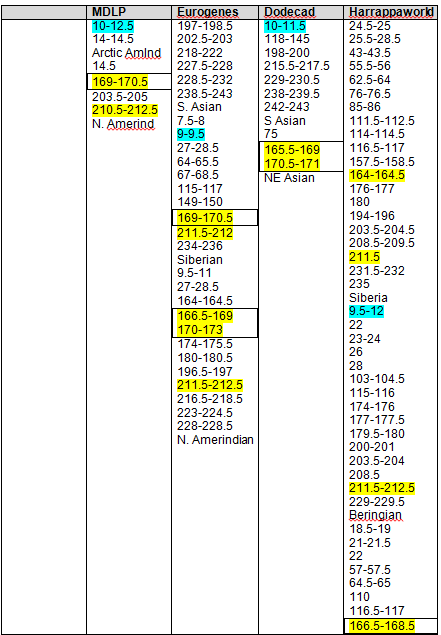
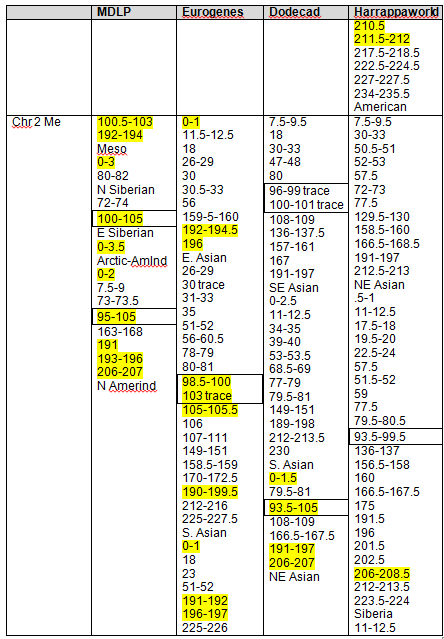
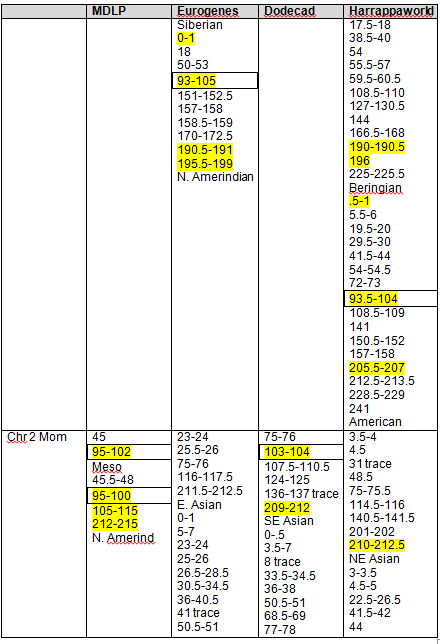
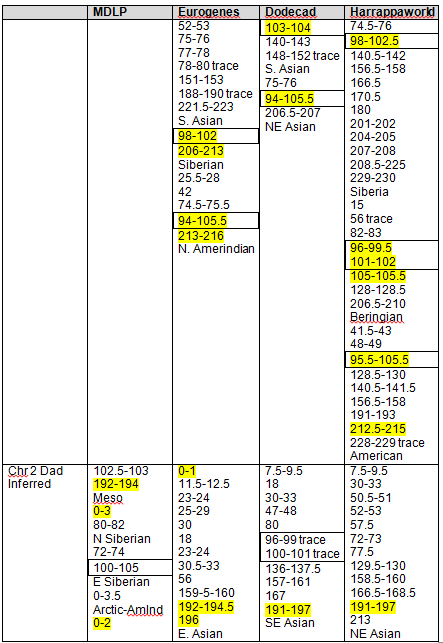
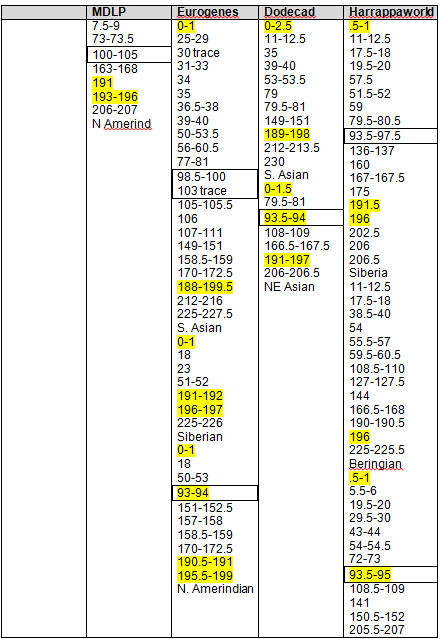
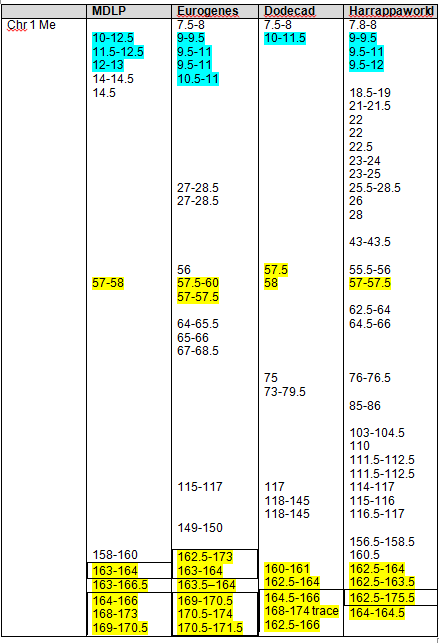
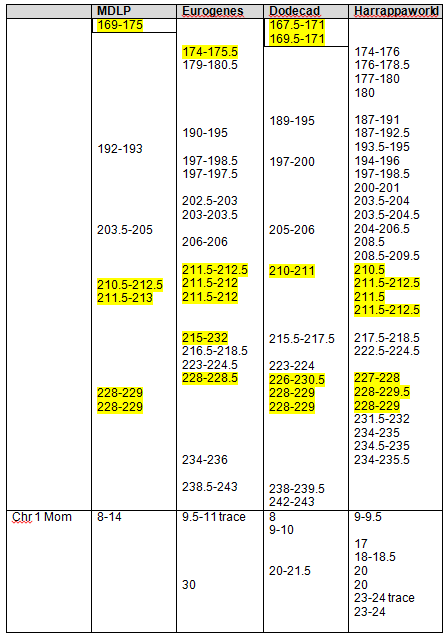
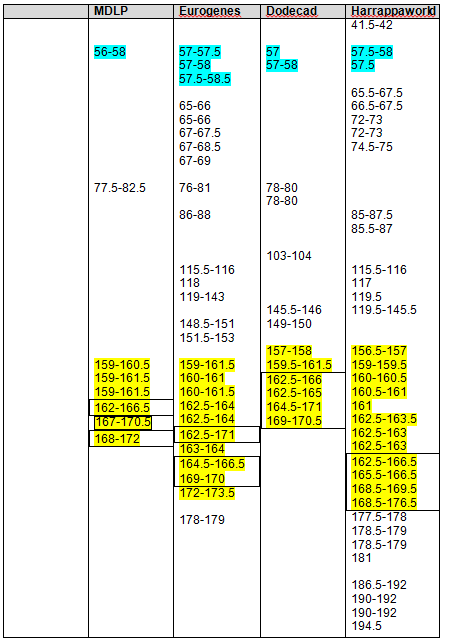
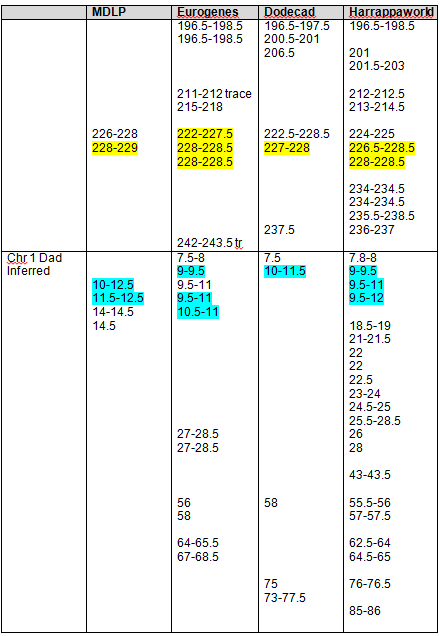
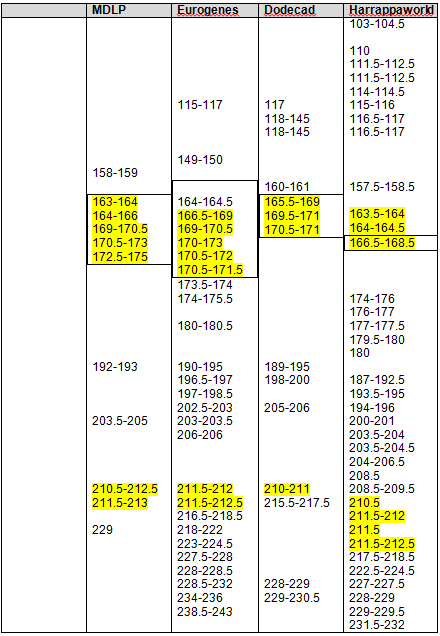
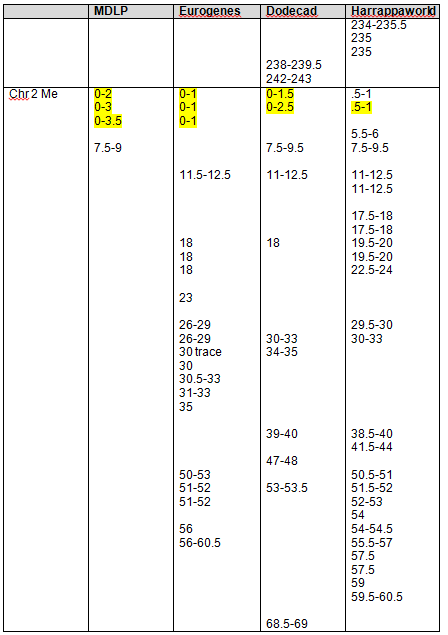
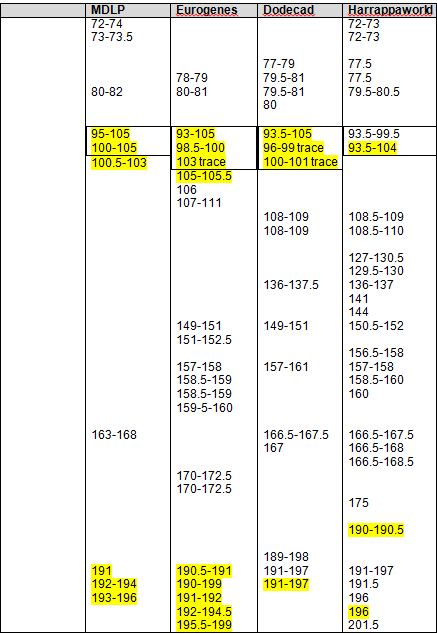
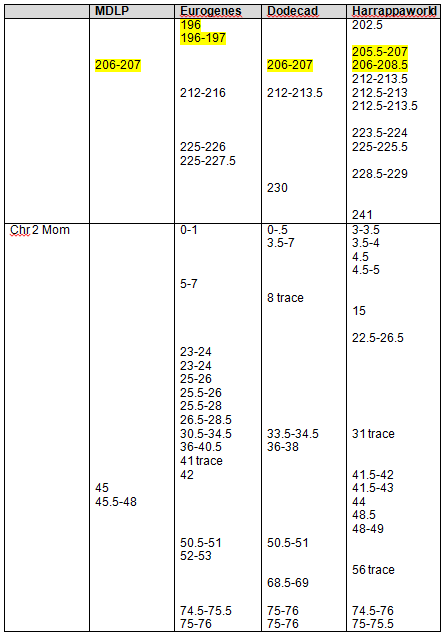
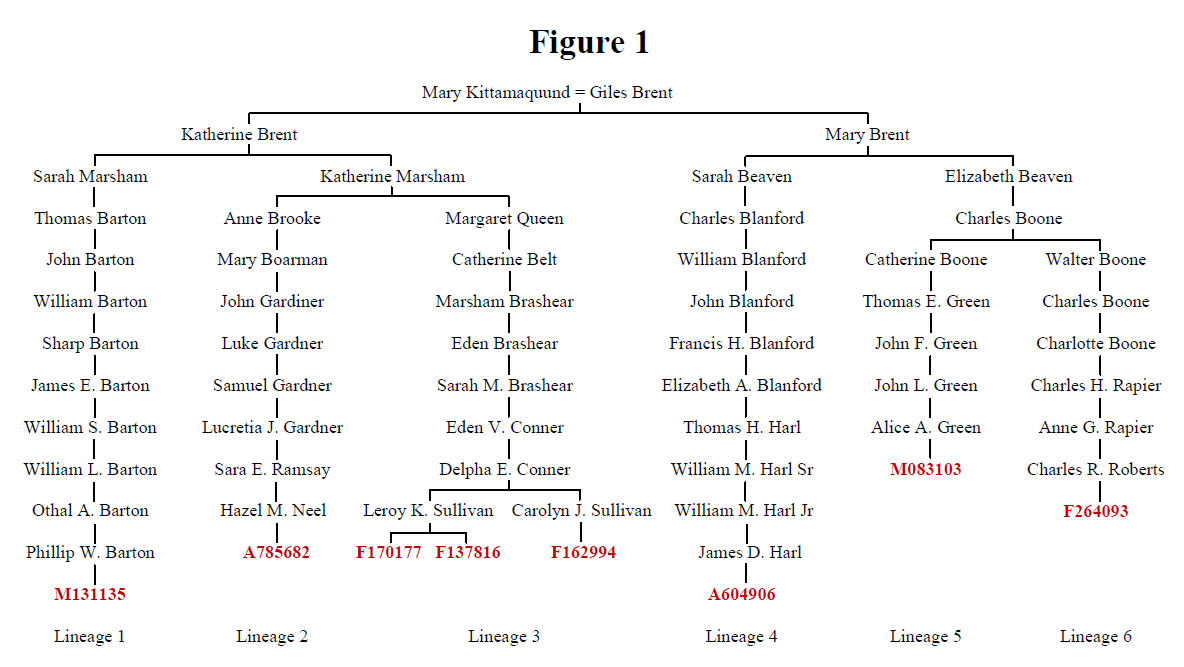
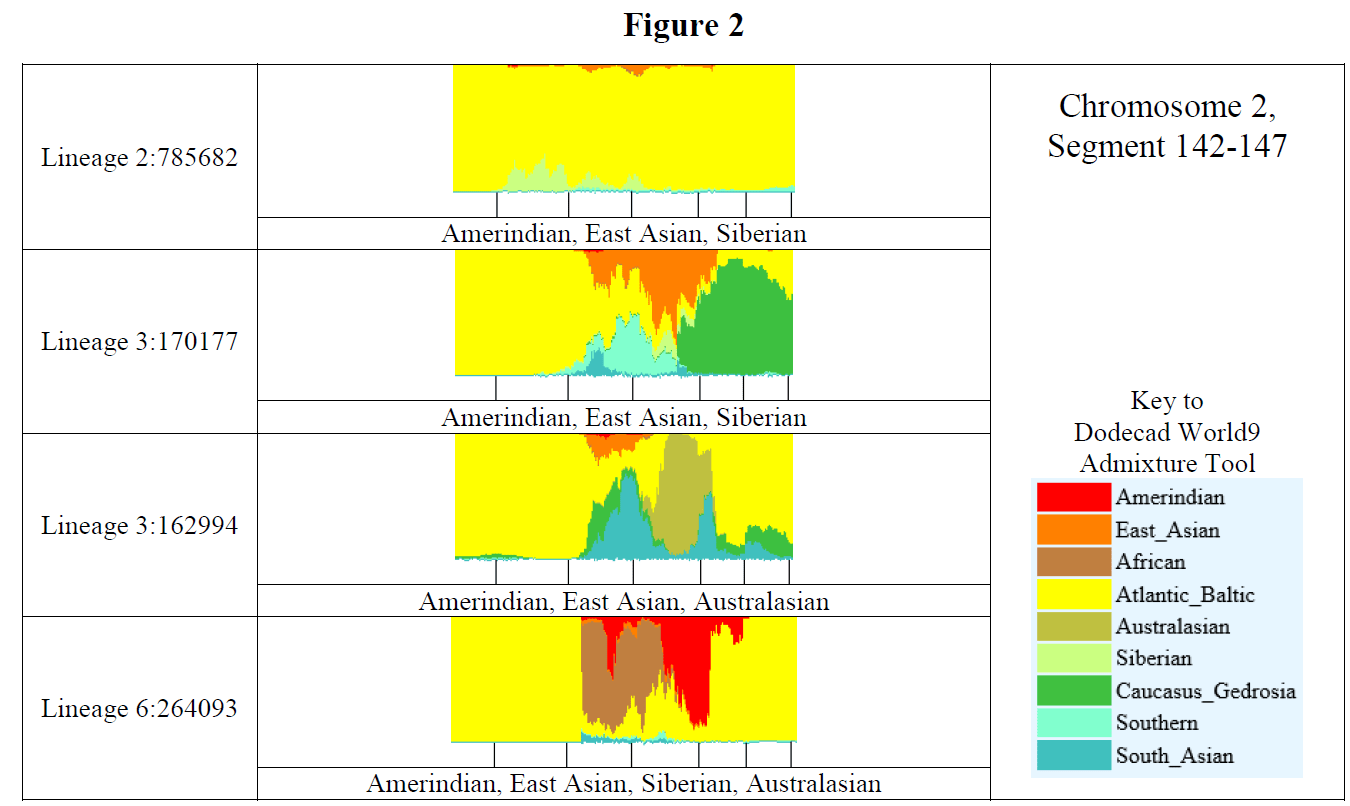
Recent DNA analysis, however, reveals six descendants of Katherine and Richard Marsham and three descendants of Mary and Charles Beaven, representing six separate lineages, inherited at least sixteen matching segments of Native American DNA on chromosomes 2, 3, 4, 5, 6, 7, 8, 13, 15, 16, 20, and 22. Figure 1 shows the relationships between these descendants; and Figures 2-17 illustrate the sixteen matching Native American chromosomal segments (see Figures 18-33 for additional images of these segments produced by four independent admixture tools; and also see http://dna-explained.com/2013/06/02/the-autosomal-me-summary-and-pdf-file/ for information about Minority Admixture Mapping). These matching chromosomal segments point to a common Native American ancestor, who, because other possibilities can be eliminated, must have been the mother of Katherine and Mary.[xvi] Considering this DNA evidence in light of contemporary records, it now seems certain Mary Kittamaquund and Giles Brent were the parents of Katherine, wife of Richard Marsham, and Mary, wife first of John Fitzherbert and second of Charles Beaven.
Genealogical Summary
Katherine Brent was born probably in Aquia, Stafford County, Virginia, say about 1650. She may have served an unknown period of indentured service to Thomas Brooke, perhaps following the death of her mother, before she married Richard Marsham perhaps before December 26, 1663, and certainly before March 11, 1664/5.[xvii] Richard immigrated to Maryland in 1658, where he served three-years of indentured service to John Horne for his transatlantic voyage.[xviii] Katherine died in Calvert County, Maryland, before October 26, 1670.[xix] Richard married second Anne Calvert, widow first of Baker Brooke Sr., and second of Henry Brent, after April 30, 1695, and before February, 1696.[xx] Richard died in Prince George’s County, Maryland, between April 14 and 22, 1713.[xxi] Katherine and Richard were the parents of the following children:
1. Sarah Marsham was born in Calvert County, Maryland, say about 1667, married first Basil Waring say about 1685, married second William Barton after December 29, 1688, married third James Haddock after April 19, 1703, and died in Charles County, Maryland, after January 8, 1733.[xxii]
2. Katherine Marsham was born in Calvert County, Maryland, say about 1669, married first her future step-brother Baker Brooke Jr. say about 1689, married second Samuel Queen after May 27, 1698, and died in St Mary’s County after March 18, 1712, and before April 14, 1713.[xxiii]
Mary Brent was born probably in Aquia, Stafford County, Virginia, say about 1654.[xxiv] She married first John Fitzherbert before 1671.[xxv] Mary and John divorced before April 26, 1672.[xxvi] Mary married second Charles Beaven say about 1674. Charles died in Prince George’s County, Maryland, between June 20, 1698, and June 21, 1699.[xxvii] Mary died in Prince George’s County between April 28, 1712, and June 13, 1713.[xxviii] Mary and Charles were the parents of the following children:
1. Richard Beaven was born in Calvert County, Maryland, say about 1676, married Jane Blanford before June 11, 1703, and died in Prince Georges County, Maryland, before August 9, 1744.[xxix]
2. Sarah Beaven was born in Calvert County, Maryland, say about 1678, married Thomas Blanford on June 20, 1698, and died in Prince Georges County, Maryland, after August 7, 1749.[xxx]
3. Margaret Beaven was born in Calvert County, Maryland, say about 1680, and died in Prince George’s County, Maryland, between April 28, 1712, and June 13, 1713.
4. Elizabeth Beaven was born in Calvert County, Maryland, say about 1682, married John Boone about 1708, and died in Prince Georges County, Maryland, before October 30, 1725.
5. Katherine Beaven was born in Calvert County, Maryland, say about 1684, married Henry Culver about 1711, and died in Prince Georges County, Maryland, before December 20, 1762.[xxxi]
6. Charles Beaven was born in Calvert County, Maryland, say about 1686, married Mary Finch about 1712, and died in Prince Georges County, Maryland, on December 16, 1761.[xxxii]
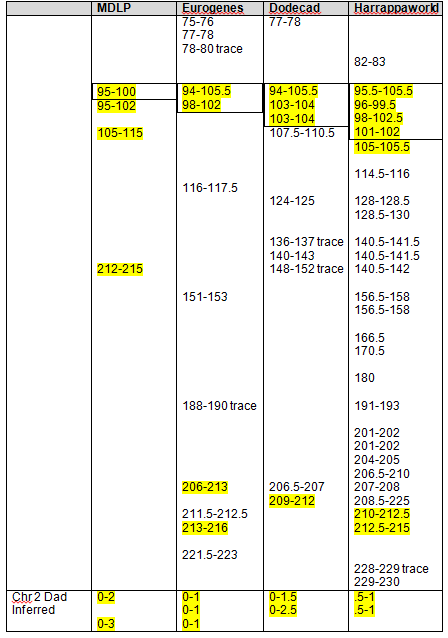
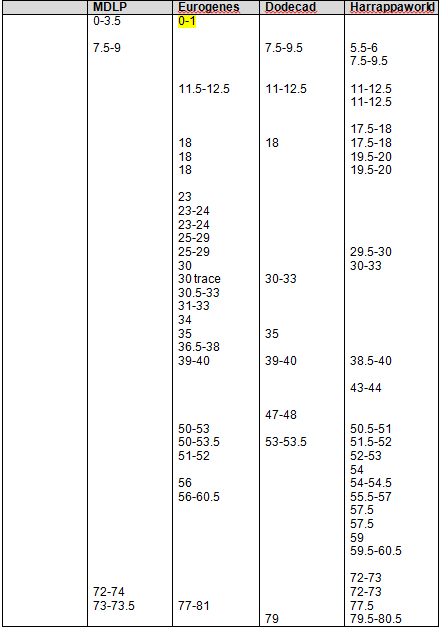
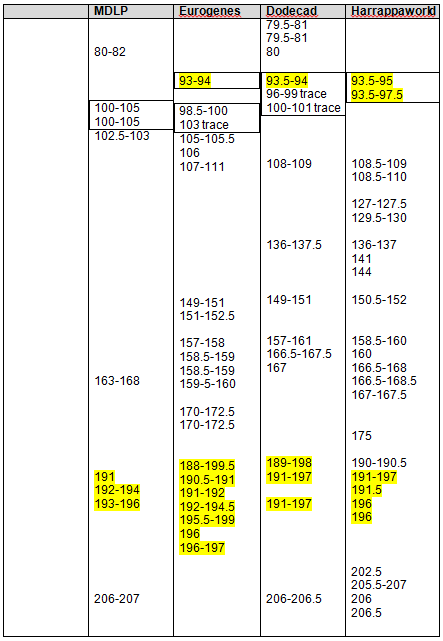
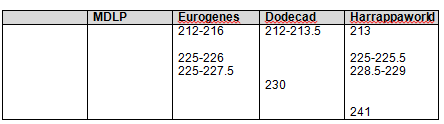
Following this lineage information, Shawn and Lois included a chromosome by chromosome analysis of the various individuals who tested. I am including only one example, below.
Following the many pages of genetic comparison information, Shawn and Lois included quite a bit for their readers about the Piscataway History and Culture. After all, DNA without genealogy and history is impersonal science. Included were early drawings and paintings of Native people and villages, an account of the people by Father Andrew White in 1635 as well as anonymous documents from 1639 and 1640. Their food, language and vocabulary were discussed as well with historical events being presented in timeline format.
Piscataway Timeline
1550 Piscataway Tayac governed c. 7,000 people between Potomac and Patuxent Rivers
1608 John Smith explored the Potomac River; Piscataway welcomed him with kindness
1622 Powhatan Indians attacked at least 31 Virginia settlements along the James River
1623 Virginia colonists attacked Moyaone, killing many and burning houses and corn
1634 Piscataway Tayac Wannas permitted Leonard Calvert to establish St Mary’s City
1640 Piscataway Tayac Kittamaquund was baptized by Jesuit Father Andrew White
1644 Wahocasso succeeded as Tayac, who was succeeded by Uttapoingassenem in 1658, who was succeeded by Wannasapapin in 1662, who was succeeded by Nattowasso (son of Wahocasso—breaking the tradition of matrilineal succession) in 1663
1666 Facing increasing encroachments by European settlers, the Piscataway petitioned the Maryland council, saying: “We can flee no further. Let us know where to live, and how to be secured for the future from the hogs and cattle.”
1695 Maryland Governor Francis Nicholson “advised the council to find a way of depriving Indians beyond Mattawoman Creek of their lands, in order to ‘occasion a greater quantity of Tobacco to be made.'”
1697 Piscataway Tayac Ochotomaquath and about 400 others fled to northern Virginia; then they allied with the Iroquois in 1701 and moved to Pennsylvania.
1699 Maryland colonists estimated Piscataway military strength at 80-90 warriors
Although many Piscataway left Maryland by the end of the 17th century in the face of encroaching European settlements, others remained on their homeland, intermarrying with Europeans and Africans, while preserving their cultural traditions. In 1996, an advisory committee appointed by the Maryland Historical Trust voted unanimously to recommend state recognition of the Piscataway Indian Nation, citing genealogical, linguistic, cultural, and political continuity between the earliest Piscataway people and their modern descendants. On January 9, 2012, Maryland Governor Martin O’Malley issued two executive orders, granting official state recognition to the Piscataway Indian Nation (about 100 members), and the Piscataway Conoy Tribe—consisting of the Piscataway Conoy Confederacy and Subtribes (about 3,500 members), and the Cedarville Band of Piscataway (about 500 members).

This drawing of St Mary’s City in 1634 by Cary Carson from the Maryland State Archives Map Collection shows the Native people living outside the city fortifications.
This 262 page book is a wonderful combination of genealogy, genetics and history, and does exactly what genetic genealogy is supposed to do. It enables us to document and better understand our ancestors, and in this case, to prove they were indeed, Native American. Shawn and Lois would welcome inquiries about the book or the family lines included and you can contact them at shpxlcp@comcast.net.
[i] Most scholars estimate her year of birth as 1634, because an unidentified Catholic missionary made the following statement about her. “On the 15th of February we came to Pascatoe, not without the great gratulation and joy of the inhabitants, who indeed seem well inclined to receive the christian faith. So that not long after, the king brought his daughter, seven years old, (whom he loves with great affection,) to be educated among the English at St. Mary’s; and when she shall well understand the christian mysteries, to be washed in the sacred font of baptism.” See “Extracts from Different Letters of Missionaries, from the Year 1635, to the Year 1638,” in E.A. Dalrymple, ed., Relatio Itineris in Marylandiam. Declaratio Coloniae Domini Baronis de Baltimoro. Excerpta ex Diversis Litteris Missionariorum ab Anno 1635, ad Annum 1638, Narrative of a Voyage to Maryland, by Father Andrew White, S.J. An Account of the Colony of the Lord Baron Baltimore. Extracts from Different Letters of Missionaries, from the Year 1635 to the Year 1677 (Baltimore: Maryland Historical Society, 1874), 76. But, the circumstances of Mary’s life suggest she was born a few years earlier. So, we suspect the author of this letter underestimated her age.
[ii] Father Andrew White, “Annual Letter of the English Province of the Society of Jesus, 1639,” in Clayton Colman Hall, ed., Narratives of Early Maryland, 1633-1684 (New York: Barnes & Noble, Inc., 1910), 126.
[iii] Ibid.
[iv] Ibid., 131.
[v] John Lewger to Governor Leonard Calvert, January 9, 1644/5, in Proceedings of the Council of Maryland, 1636-1667, Vol 3, pp. 162-163 (original pages 186-187), Archives of Maryland Online. “To the horle Governor. Sir I doe signify unto you that Mr Giles Brent hath delivered unto me 2. petitions nerewth sent unto you; and I desire you by vertue of the Law in that behalfe, that you wilbe pleased to give him a competent security for his indemnification in the possession of the lands at Kent, mentioned in one of the said petitions, & for iustification of his title in them, according to the said petition, dated 7. January instant: & likewise to satisfy unto him 5700l tob & cask, demanded in the other petition for damage of non pformance of a covenant to his wife Mary touching certaine cattell; or els to shew cause why you refuse to doe either; and to appoint some time when the Counsell shall attend you for it, betweene this & Monday next. So humbly take leave to rest Yor servant S. Johns. 9th Jan: 1644 John Lewger.” See also Margaret Brent, “Account of the Estate of Governor Leonard Calvert,” June 6, 1648, in Judicial and Testamentary Business of the Provincial Court, 1637-1650, Vol. 4, pp. 388-389 (original pages 159-160). “By payd to Mrs. Mary Brent Kittamagund 0748.”
[vi] For information about the arrest and transport of Giles Brent to London during Richard Ingle’s Rebellion, see “Richard Ingle in Maryland” in Maryland Historical Magazine, Vol. 1(1906), 125-140. For the terminus ad quem (limit to which—latest possible date) Giles Brent returned to Maryland, see Maryland State Archives, Judicial and Testamentary Business of the Provincial Court, 1637-1650, Vol. 4:312-313. “June 19th This day came Margaret Brent Gent, & desyred the testimony of the prnt Gouernor Mr Tho: Greene concerning the last will & Testamt of the late Gouernor Leonard Calvert Esqr And the sd Gouernor did authorize Giles Brent Esqr one of his Lops Counsell to administer an oath unto him the sd Gouernr concerning the foresd busines. The sd Gouernor Tho: Greene Esqr answered uppon oath concerning the last will & Testamt of Leo: Calvert Esqr aforesd That the sd Leo: Calvert, lying uppon his death bed, some 6 howres before his death, being in prfect memory, directing his speech to Mrs Margarett Brent sayd in pnce of him the sd Mr Greene & some others I make you my sole Exequutrix, Take all, & pay all. After wch words hee the sd Leon: Calvert desyred every one to depart the roome & was some space in priuate conference wth Mrs Marg: Brent aforesd Afterwards the Mr Greene comeing into the roome againe, he heard the sd Mr L: Calvert appoint certaine Legacies in manner following. Viz I doe giue my warring cloaths to James Linsay, & Richard William my servants, specifying his coath suite to Rich. Willan & his black suite to James Linsey. & his waring Linnen to be diuided betweene them. Aliso I giue a mare Colt to my God sonne Leon: Greene. Allso hee did desyre tht his exequutrix should giue the first mare Colt tht should fall this yeare, (& if non fall in this yeare, then the first tht shall hereafter fall) unto Mrs Temperance Pippett of Virginea. And further he deposeth not. Recognit Teste mc Willm Bretton Clk.”
[vii] The terminus a quo (limit from which—earliest possible date) for the relocation of Giles Brent from Maryland to Virginia is the date Giles Brent appeared in court at St. Mary’s on November 8, 1648, requesting compensation for destruction of his property on the Isle of Kent by anti-Papists. See Archives of Maryland, November 8, 1648, Liber A, Folio 205. The terminus ad quem (limit to which—latest possible date) Giles Brent removed from Maryland to Virginia is the date Giles Brent patented Marlborough in Potomac Neck, Virginia, on August 20, 1651. See entry from Mercer Land Book cited by W.B. Chilton, ed., “The Brent Family,” The Virginia Magazine of History and Biography, Vol. 16, No. 1 (Jul., 1908), 96-97.
[viii] Virginia Magazine XVI, 211. On April 17, 1654, Giles conveyed his personal estate in Virginia and Maryland to his sister Mary, in trust to educate his children and allow maintenance to his wife Mary. See also Lurene Rose Bivin in “Brent-Marsham-Beaven-Blandford Article: A Closer Look,” Maryland Genealogical Society Bulletin, Vol. 37, No. 3, 328-334. “In the grant to John Harrison (dated 4 September 1655), he refers to his “sister” as Mrs. Frances Harrison (Nugent, p. 319).” Giles may have been engaged to marry his second wife, Frances Whitgreaves, widow of Jeremiah Harrison, on this date, because John Harrison made a provision for Giles.
[ix] W.B. Chilton, ed., “The Brent Family,” The Virginia Magazine of History and Biography, Vol. 16, No. 2 (Oct., 1908), 212. “‘Register of Christ Church, Middlesex County, Virginia. Collo Giles Brent of Potomac departed this life 2d of September 1679 and was buried in the Great Church Yard ye next day following.'”
[x] For example, see Douglas Richardson, Magna Carta Ancestry: A Study in Colonial and Medieval Families (Baltimore: Genealogical Publishing Co., Inc., 2005), 129. “They had two sons, [Col.] Giles and Richard, and one daughter, Mary (wife of [Capt.] John Fitzherbert).” See also, Robert W. Barnes, British Roots of Maryland Families (Baltimore: Genealogical Publishing Co., Inc., 1999), 73-74.
[xi] W.B. Chilton, Vol. 16, No. 1 (Jul., 1908), 98-99. “The Will of Margaret Brent. In the name of God Amen. I Margaret Brent of Peace in the County of Westmoreland in Virginia considering the casualtys of human life do therefore make this my last Will and Testament as followeth my soul I do bequeath to the mercies of my Savior Jesus Christ and my worldly estate to be disposed of by my Executors as followeth to my nephew George Brent I give all my rights to take up land in Maryland except those already assigned to my cousin James Clifton to my niece Clifton I give a cow and to my neece Elizabeth Brent I give a heifer; to Ann Vandan I give a cow calf; to my neece Mary Brent daughter of my Brother Giles Brent I give all my silver spoons which are six; to my nephew Richard Brent son of my brother Giles Brent I give my patent of lands at the Falls of Rappahanock River also my lease of Kent Fort Mannor in Maryland saving yet power to his Father my brother Giles Brent that if he shall like to do so he may sell said lease and satisfye to his son other where as he shall think fitt in lands good or money and in case of my said nephew Richard Brents death under age and without heirs of his body lawfully begotten his legacy thereto to go to his brother Giles Brent or his sister Mary Brent or to the heirs of my brother Giles Brent or otherwise as my said brother shall dispose it by his Deed or last Will to my brother Giles Brent and to his heirs forever I give all my lands goods and chattles and all my estate real and personal and all that is or may be due to me in England Virginia Maryland or elsewhere still excepting the before disposed of in this my last will and Testament and I do appoint him my said Brother Giles Brent and his children Giles Brent Mary Brent and Richard Brent or such of them as are living at the time of my death the Executors of this my last Will and Testament. In witness whereof I have hereunto set my hand and seal this 26th day of December, Anno Domini, 1663.”
[xii] W.B. Chilton, Vol. 16, No. 1 (Jul., 1908), 98. “The Will of Giles Brent. In the Name of God Amen. I Giles Brent of the Retirement in Stafford County in Virginia Esquire contemplating the uncertainty of my time of death do ordain this my last Will and Testament in manner and form following my body to the earth and my Soul I bequeath to the mercy of my Savior Christ all my worldly estate I appoint to my Exectors to be disposed of as followeth to my daughter Mary Fitzherbert I give five ewes and a ram to my son and heir Giles Brent and to the heirs of his body lawfully begotten I give for ever all my lands rights unto lands and reversions of lands any ways due to me in either England Virginia or Maryland and for want of such heirs then unto mine own right heirs and for want of such then to the right heirs of my Honored Father Richard Brent, Esquire, deceased Antiently Lord of the mannors of Admington and Lark Stoke in the County of Gloucestershire in England after my debts paid I give all my goods moveable or immoveable whatsoever to be disposed of as followeth three thousand pounds of good tobacco with cask to be given by them my Executors unto pious use where and to whom they shall see fitt for which doing and how and to whom given I Will that to none else but God they shall be accountable. I also Will that to Mr. Edward Sanders they give four ewes and a ram and to John Howard four ewes and a ram. Executors of this my last Will and Testament I appoint my son Giles Brent and my Brother Richard Brent and my Brother William Brent both in England and as Attorneys in their Executorship untill my said Brothers shall otherwise order and I do appoint Mr. Edward Sanders and John Howard above mentioned both of Stafford County to be and to act and it is my Will that after my debts and my Legacies paid my said Executors stand possessed of all my goods and personal estate to the sole use of my son Giles Brent then to be delivered into his sole dispose when it shall please God that he hath arrived to the age of one and twenty years. In witness unto this my within written last Will and Testament I have hereunto set my hand and seal this last day of August, Anno Domini, 1671.”
[xiii] Image SC4040-0166-1, Dr. Lois Green Carr’s Biographical Files of 17th and 18th Century Marylanders, Maryland State Archives, http://msa.maryland.gov/megafile/msa/speccol/sc4000/sc4040/000001/000166/html/sc4040-0166-1.html. Note: Dr. Carr lists the children in the following order: Mary, Giles, Richard, Katherine, Henry, Margaret.
[xiv] See excerpt from Charles Calvert to Cecilius Calvert, April 26, 1672, in William Hand Browne, ed., Proceedings of the Council of Mayland: 1671-1682 (Baltimore: Maryland Historical Society, 1896), xiv. “Major Fitzherbert’s brother who maryed the Indian Brent, has civilly parted with her, and (as I suppose) will never care to bed with her more; soe that your Lordship needs not to feare any ill consequence from that match, butt what has already happened to the poore man, who unadvisedly threw himself away upon her in hopes of a great portion which now is come to little.” See also Will of Charles Beaven, signed June 20, 1698, proved June 21, 1699, Prerogative Court (Wills) Vol. 2, pp. 182-183, Liber 6, Folios 285-286. See also Will of Mary Beaven, signed April 18, 1712, proved June 13, 1713, Prerogative Court (Wills) Vol. 3, p. 240, Liber 13, Folio 513. See also Maryland Land Patents, BB#37:374. On March 15, 1696/7, Richard Marsham transferred 600 acre grant called The Hickory Thickett to Charles Beaven by assignment.
[xv] Lurene Rose Bivin in “Brent-Marsham-Beaven-Blandford Article: A Closer Look,” Maryland Genealogical Society Bulletin, Vol. 37, No. 3, 328-334.
[xvi] Four potential scenarios explain this matching DNA considered together with Charles Beaven’s reference to Richard Marsham as “my brother iñ Richard Marsham.” The first scenario is Richard Marsham and Charles Beaven were brothers. This scenario almost certainly is not true because Richard Marsham and Charles Beaven had different last names and the written reference by Charles Beaven to Richard Marsham as “my brother iñ” appears to have been a standard contraction of “my brother-in-law.” The second scenario is Richard Marsham and Mary, wife of Charles Beaven, were brother and sister. This scenario almost certainly is not true because Mary referred to Richard Marsham as “my well beloved Richard Marsham.” If Richard Marsham and Mary had been brother and sister, Mary surely would have referred to Richard as her brother. The third scenario is Charles Beaven and Katherine, wife of Richard Marsham, were brother and sister. This scenario almost certainly is not true because their descendants inherited matching segments of Native American DNA. Charles Beaven immigrated from England to Maryland in 1666 (Skordas, Liber 9, folio 455), so he surely did not inherit Native American DNA from his parents. The fourth and most compelling scenario is Katherine, wife of Richard Marsham, and Mary, wife of Charles Beaven, were sisters, and they also were daughters of a parent with Native American ancestry. This scenario is consistent with other indications that Katherine and Mary were daughters of Mary Kittamaquund and Giles Brent.
[xvii] Maryland Colonial Land Records, Liber 7, Folio 582, 583, Maryland State Archives. “March xith 1664. Came David Bowens and demands land for these rights following John Barnes, Clement Barnes, Margaret Whitthe, Martha Garbett, Catherine Marsham by Assign and Francis Street by Assign as follows–Know all to whom these presents may concern, that I Katherine Marsham doe assigne all my Right and Title of a Right due to mee the said Katherine for fifty acres of land unto David Bowing as witness my hand this Eleventh of March One Thousand six hundred sixty foure. Katherine Marsham (her K mark). Witness Richard Marsham, Robert Turner. Know all men by these presents to whom this may concern that I Francis Streete doe assigne all my Right and Title of a right due to mee the said Francis Streete for fifty acres of Land unto David Bowing as witness my hand this Eleventh of March One Thousand six hundred sixty four. Francis Streete. Witness Richard Marsham, Robert Turner.” See also Maryland Colonial Land Records, Liber 12, Folio 512, Maryland State Archives. “May 11th 1670. Came Richard Marsham of Calvert County and proved right to fifty acres of land it being due to him for the time of service of Katherine his wife performed to Major Thomas Brooke, Warrant then issued in the name of the said Richard Marsham for fifty acres of land it being due to him for the causio oraem above. Certified the 11th of August next.” Note: Even though these two documents indicate Katherine was due a total of 100 acres, the first 50 acres for an unstated cause and the second 50 acres for service to Thomas Brooke, neither record says Katherine was transported to Maryland, and both records may result from fraudulent claims. If these records reflect legitimate claims, they do not say or prove Katherine was transported to Maryland, since some claims were granted for people who were born in Maryland. For example, a patent for 1,644 acres was granted to Mary Brent on November 17, 1652, for the transportation of 33 persons, including “Mrs. Mary Brent, wife to Capt. Brent.” See Nugent, pp. 266-267. This Mrs. Mary Brent was Mary Kittamaquund, wife of Giles Brent, who certainly was born in Maryland. Furthermore, according to Abbott Emerson Smith (“The Indentured Servant and Land Speculation in Seventeenth Century Maryland,” in The American Historical Review, Vol. 40, p. 467), “A great many of the warrants which were granted were for rights proved by the wife of a freedman. It is not unlikely that some persons managed to get freedom dues in land, although they had never been in indentured service.” Finally, if Katherine did serve a term of indenture, her service may have resulted from the death of her mother at a time when she was old enough to begin providing for her own maintenance. It was not unusual during this era for children of deceased well-to-do colonists to serve a term of indenture.
[xviii] See Maryland Colonial Land Records, Liber 4, Folio 4, Maryland State Archives. “May the 7th 1659. John Home demands Land for the transportation of himself and his Servants, Richard Marsham & John Edmondson, in 1658.” See also Maryland Colonial Land Records, Liber 5, Folio 295, Maryland State Archives. “Know all men that I Richard Marsham do give and make over to Thomas Pagett my right as is due to me as being a Servant, and now being free in Roberto McJohn Hearen as witness my hand the 16th of September 1661. Richard Marsham. Wit: Robert Coberthwail, Michael Coreuly.”
[xix] See Maryland Colonial Land Records, Liber 12, Folio 512, Maryland State Archives, as cited above. “May 11th 1670. Came Richard Marsham of Calvert County and proved right to fifty acres of land it being due to him for the time of service of Katherine his wife performed to Major Thomas Brooke, Warrant then issued in the name of the said Richard Marsham for fifty acres of land it being due to him for the causio oraem above. Certified the 11th of August next.” See also Maryland Colonial Land Records, October 26, 1670, Liber 14, Folio 228. “Patent for 50 acres in St. Mary’s County, originally Calvert County, to Richard Marsham, tract called St. Katherine’s.” Note: This patent establishes the terminus ad quem (limit to which—latest possible date) for Katherine’s death, because Richard would be unlikely to name this property Saint Katherine’s unless Katherine had died.
[xx] The terminus a quo (limit from which—earliest possible date) for Richard’s marriage to Anne Calvert is established by the date of a Prerogative Court record concerning the estate of Henry Brent naming Anne Brent executrix. See Prerogative Court Records, April 30, 1695, Liber 13A, folio 291, Maryland State Archives. The terminus ad quem (limit to which—latest possible date) for Richard’s marriage to Anne Calvert is the date they were named as husband and wife on a probate record. See Provincial Court Judgments, February Court 1696, Liber P. L. #3, Folios 556-557, Maryland State Archives. Richard Marsham with Ann Marsham, administrator of Henry Brent, against Thomas Collier.
[xxi] Will of Richard Marsham, signed April 14, 1713, probated April 22, 1713, Maryland Prerogative Court (Wills), Liber xiii, Folio 514-520, Maryland State Archives.
[xxii] The approximate year of Sarah’s marriage to Basil Waring is estimated from the year of Basil’s death preceded by four years to account for the births of two children. See Will of Basil Waring, signed December 8, 1688, probated December 29, 1688, Maryland Calendar of Wills, Vol. 2, p. 50, and Liber 6, Folio 66. Basil named his wife Sarah and sons Marsham and Basil. The terminus a quo (limit from which—earliest possible date) for Sarah’s marriage to William Barton is determined by the probate date of the will of her first husband Basil Waring. See Will of Basil Waring, signed December 8, 1688, probated December 29, 1688, Maryland Calendar of Wills, Vol. 2, p. 50, and Liber 6, Folio 66. The terminus a quo (limit from which—earliest possible date) for Sarah’s death is determined by her deed to Robert Mackhorn. See Deed from Sarah Haddock to Robert Mackhorn, signed January 8, 1733, recorded March 18, 1733/4, Charles County Land Rcords: 1733-1743, Book O #2, page 28. “Sarah Haddock, widow, of Prince George’s County, formerly wife of William Barton, late of Charles County, Gent., deceased, to Robert Mackhorn of Charles County, planter. William Barton by his will, divised to his son-in-law, Basil Waring, 300 acres, being part of this tract of land called Hadlow, lying in Charles County, and the rest of Hadlow to his wife, being now the aforementioned Sarah Haddock. Now this deed witnesses that sd. Sarah Haddock, for 4500 lbs tobacco, has sold to said Robert the rest of Hadlow, lying in Charles County, bounded by Thos. Gerard, the division line made by sd. Sarah Haddock and Basil Waring. Signed Sarah Haddock. Wit. Jas. Haddock Waring, Henry Keen.”
[xxiii] The approximate year of Katherine’s marriage to Baker Brook is estimated from the year of Baker’s death preceded by eight years to account for the births of four children. See Will of Baker Book, signed February 5, 1698, probated May 27, 1698, Maryland Calendar of Wills, Vol. 2, p. 142, and Liber 6, Folio 83. Baker named his wife Katherine and four children Baker, Leonard, Richard, and Ann. The terminus ad quem (limit to which—latest possible date) for Katherine’s marriage to Samuel Queen is determined by the probate date of the will of her first husband Baker Brooke. See Will of Baker Book, signed February 5, 1698, probated May 27, 1698, Maryland Calendar of Wills, Vol. 2, p. 142, Liber 6, Folio 83. The terminus a quo (limit from which—earliest possible date) for Katherine’s death is determined by the date her husband’s will was probated. See Will of Samuel Queen, signed January 10, 1711, probated March 18, 1712, Maryland Prerogative Court (Wills), Vol. 3, p. 222, Liber 13, Folio 389, Maryland State Archives. The terminus ad quem (limit to which—latest possible date) for Katherine’s death is determined by the date of the will of her father, Richard Marsham, which provides for her children but does not mention her. See Will of Richard Marsham, signed April 14, 1713, probated April 22, 1713, Maryland Prerogative Court (Wills), Liber 13, Folios 514-520, Maryland State Archives.
[xxiv] On April 5, 1673, Giles Brent Jr., son of Col. Giles Brent and Mary Kittamaquund, deeded 500 acres, which he had inherited from his father, to his uncle George Brent of Woodstock, Stafford County, Virginia, stating he had reached the age of 21—a condition set in his father’s will for his ability to take possession of the land. This suggests Giles Brent Jr. was born about 1652. See W.B. Chilton, Vol. 16, No. 1 (Jul., 1908), 99-100.
[xxv] Will of Giles Brent, signed August 31, 1671, in W.B. Chilton, Vol. 16, No. 1 (Jul., 1908), 98.
[xxvi] See excerpt from Charles Calvert to Cecilius Calvert, April 26, 1672, in William Hand Browne, ed., Proceedings of the Council of Mayland: 1671-1682 (Baltimore: Maryland Historical Society, 1896), xiv. “Major Fitzherbert’s brother who maryed the Indian Brent, has civilly parted with her, and (as I suppose) will never care to bed with her more; soe that your Lordship needs not to feare any ill consequence from that match, butt what has already happened to the poore man, who unadvisedly threw himself away upon her in hopes of a great portion which now is come to little.”
[xxvii] Will of Charles Beaven, signed January 20, 1698/9, proven June 2, 1699, Prince Georges County Wills, Liber 6, folios 285-286, Maryland State Archives.
[xxviii] Will of Mary Beavan, signed April 28, 1712, proven June 13, 1713, Prince Georges County Wills, Liber 13, folio 513, Maryland State Archives.
[xxix] Will of Richard Bevan Sr., signed February 27, 1738/9, proven May 21, 1739, Maryland Calendar of Wills, Vol. 8, p. 789, Liber 22, folio 58, Maryland State Archives. For the terminus ad quem (limit to which—latest possible date) of Richard’s marriage to Jane Blandford, see Administration of the Will of William Bayly, June 11, 1703, Liber 24, folio 16a, Prince Georges County, MD. “Executrix, Mrs. Jane Beven, wife of Richard Beven.”
[xxx] Will of Thomas Blandford, signed June 17, 1749, proven August 7, 1749, Maryland Calendar of Wills, Maryland State Archives. Thomas named his wife Sarah executrix.
[xxxi] Will of Catherine Culver, signed October 6, 1762, proven December 20, 1762, Maryland Calendar of Wills, Vol. 31, pp. 890-891, Maryland State Archives.
[xxxii] Charles Beaven signed a deposition in 1728, claiming to be 42 years of age.
______________________________________________________________
Disclosure
I receive a small contribution when you click on some of the links to vendors in my articles. This does NOT increase the price you pay but helps me to keep the lights on and this informational blog free for everyone. Please click on the links in the articles or to the vendors below if you are purchasing products or DNA testing.
Thank you so much.
DNA Purchases and Free Transfers
- Family Tree DNA
- MyHeritage DNA only
- MyHeritage DNA plus Health
- MyHeritage FREE DNA file upload
- AncestryDNA
- 23andMe Ancestry
- 23andMe Ancestry Plus Health
- LivingDNA
Genealogy Services
Genealogy Research
- Legacy Tree Genealogists for genealogy research