Anne (probably not) Elmore (c1650/2-c1721), Wife of Charles Dodson, 52 Ancestors #159

Charles Dodson (1649-1706) of Richmond County, Virginia was married to a woman named Ann. That much we know, positively.

The first actual record we have of Ann is found with the birth of her son, Thomas.

The North Farnham Parish register tells us that Thomas Dodson was born to Charles and Ann Dodson on May 15, 1681.

Thomas is the only child attributed to Charles and Ann in the North Farnham Parish church records, which are known to be incomplete. In this case, they are quite incomplete.

Ann is still married to Charles at his death and is named as his executrix in early 1705/1706. Charles’ will lists all of their children, including a son named Charles Jr.

Charles Jr. first appears in the records in 1693 as a witness. This suggests strongly that he is age 21 at that time, which would put his birth in approximately 1672. Charles Jr. is also named after Charles Sr., typical for a first son, and he is also listed first in the deeds when his father conveys land on the same day to both Charles Jr. and Thomas in 1702/03.

Even if Charles Jr. is only 16 instead of 21 when he witnessed the two transactions in 1693, his first appearance in county records, that would put his birth no later than 1677.

Presuming that Ann is also the mother of Charles Jr., that means that Ann and Charles Sr. were probably married by 1671 if Charles Jr. was born in 1672, or perhaps they married slightly earlier. They couldn’t have married much earlier, given their ages.

We know from a deposition in 1699 that Charles Sr. was about 50 years of age at that time, putting his birth about 1649.

It stands to reason that Ann would have been born about the same time, or subtracting 20 years from her first child’s birth, about 1652. This meshes nicely with Charles Sr.’s age as well, so I think we can presume that 1671 marriage date is approximately accurate.

Obviously, given all this effort to figure Ann’s birth year, we have no other information about when she was born.

Ann’s Parents

When I first started Dodson research, Ann’s parents were always recorded as unknown. Then, in the past few years, I saw in several locations, including several Ancestry Trees and now WikiTree as well as FamilySearch where Ann was recorded as Ann Elmore, daughter of Peter Elmore.

At first, I was quite excited, especially when I found something that appeared to be relatively well-researched at Family Search – but appearances can be quitey deceiving.

Here’s the entry for Peter Elmore from FamilySearch.
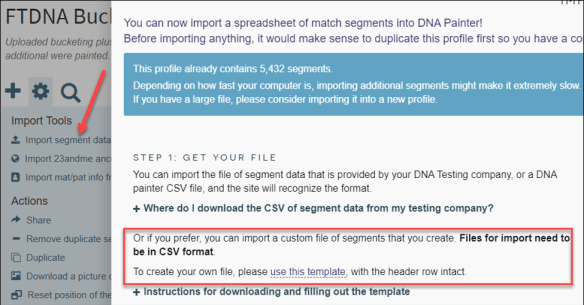
Known Issues

I’m not an Elmore researcher, but I am a Dodson researcher and I don’t want to leave the above information in print without mentioning the known issues with the information, highlighted in red, as follows:

  • There is no indication that I can find where Charles Dodson Sr’s wife, who was remarried to John Hill, died on August 1, 1715. However, Charles Dodson Jr. wrote his will on July 8, 1715 and it was probated on May 1, 1716.
  • Ann Dodson, wife of Charles Dodson Jr., whose surname is unknown, had her will probated in court on March 4, 1718/1719. Of course to make the situation more confusing both Charles Dodson Sr. and Jr. had wifes with unknown surnames named Ann. Of course, Ann Dodson Hill would have been named Ann Hill in 1718/1719 since she was married to John Hill and had been for more than a decade.
  • There is no record that Ann Elmore married Charles Dodson in 1678 in Rappahannock County, or anyplace.
  • There is no shred of evidence that Charles Dodson’s parents were Jesse Dodson and Judith Hagar.
  • There is no evidence that Charles Dodson was born in Rappahannock County, although a deposition in 1799 does state that that he is about 50 years old.
  • There is no evidence that Charles Dodson was christened in 1650 or that his christening, whenever it was, was in Rappahannock County.
  • Charles Dodson Sr. did not sign his will on July 8, 1680, but on January 11, 1702/1703.
  • However, a deed was registered between Peter Elmore and Charles Dodson on July 7, 1680.
  • Charles Dodson Sr. died between October 4, 1705 and February 6, 1705/1706 when his will was probated, not in 1704/1705.
  • Charles Dodson Jr. was not born in or about 1679, because he is witnessing deeds in 1693. He was probably born about 1672.
  • Other than Charles and Thomas Dodson, there is no indication in the Dodson research when the other children of Charles and Ann Dodson were born. Researchers simply have to fit them into the child-bearing years of Ann, around Charles and Thomas.
  • According to Charles Dodson’s will in combination with church and other records, there is no daughter Mary. Charles Dodson Jr. had a daughter Mary born in 1715, several years after Charles Dodson Sr. has died.

Even with the above incorrect information, this is the best information I could find on the Elmore family and how Ann Elmore was thought to be Charles Dodson’s wife. Hopefully the Elmore information is more accurate than the Dodson information.

Is Ann Dodson the daughter of Peter Elmore?

I couldn’t keep the Elmore information straight, so I created this abbreviated tree to track the various Peter Elmores, according to the FamilySearch information.

Peter Elmore proves a bit confusing, because in 1686, the following deed was filed.

Old Rappahannock Co Deed Book 7 – 1686 -1688; pg 306-307

I Wm. Thacker of the County of Lancaster do give William Mathews of the County of Rappa: one Cow Calfe black marked on the right eare with a crop and a slit and the left eare slitt down the midle with the one halfe of her encrease to him his heires and assignes from me my heires forever or from any persons that shall lay claim by me the abovesd Mathews being Son to Mr Wm. Mathews deceased of the Parish of Farnham of the County aforesaid. Peter Elmore being Father in Law to the abovesd Mathews is obliged to see it recorded and to have the other halfe of the encrease of the sd Cow for to looke after them as Witness my hand this 9th day of January 1683/6

Teste Charles Dodson, Wm. Thacker

John Mills marke of

Recordr. in Cur Com Rappa 23d die Martii 1686/7

A Yearling Heifer pide with black and white to be recorded with all her female encrease for Frans: Elmore marked as followeth: Crop in the right eare and a hole and under keeled on the same on the left

Record Cur Com Rappa 23 Marchy 1686/7

Father-in-law in this context probably means step-father, especially given the reference to Frances Elmore, above, and a birth recorded in 1674. Other records from this same time period in this county use the words “father in law” to mean father by law or the person we term as a step-father today.

The only Peter Elmores old enough to be the Peter in the 1686 deed are either Peter Elmore born in 1627 or his son Peter born in 1643.

The Registers of North Farnham Parish 1663-1814 and Lunenburg Parish 1783-1800 Richmond County, Virginia Compiled and Published by George Harrison Sanford King 1966 show:

Elmore, Anne daughter of Peter and Frances Elmore, Aug 29, 1674

Peter, born in 1643, is the only Peter of the age to be having a child, Ann, in 1674, given that his father, Peter born in 1627 is married to Jane and (supposedly) already has a daughter, Ann.

If in fact there was an Ann Elmore born to Peter Elmore Sr., we now have a second, younger Ann Elmore who was born in 1674, shown on the chart below. This younger Ann Elmore is clearly not the wife of Charles Dodson who is having children with his wife Ann at the time the younger Ann Elmore is born in 1674.

Deed Book Page 348 Sept 1, 1675 – I Thomas Dusin give grant and make over Anne Elmore the daughter of Peter Elmore and Frances his wife one yearling heifer…to her the said Ann Ellmore her heirs and assigns forever. Signed with mark, witness Peter Calvin and John Ingo

A year after Anne’s birth, Thomas Dusin, for some reason, gives her a one yearling heifer.

Deed Book Page 278 – July 10, 1679 between Peter Elmore of Rappae County, planter and Charles Dodson, same, planter, and his heirs and assignes, as much plantable land as 3 tithables can tend in corn and tabb, with privilege of leaving out for partuidge and further that said Dodson shall have the privilege of coopers and carpenters timber for the use of ye plantation for the term of 19 years from date hereof. (Further the said Elmore doth engage to furnish ye said Dodson with apple trees and peach trees suffichant to make an orchard both of apples and peaches) and further at the expiration of ye said terms the said Dodson is to leave a 30 foot dwelling house and a 50 foot tobacco house tennentable with all fencing in repairs that is at the expiration of the time. An further ye said Dodson to pay ye said Peter Elmore 50 pounds tobacco yearly during he said terme but if said Dodson chance to leave ye said plantation before the expiration of the said time that then ye said Peter Elmore shall have ye refusal before any other.

Signed Peter Elmore with mark and Charles Dodson. Witness William Smoote and Charles Wilson. Looks like it was registered July 7, 1680.

I’m almost positive that this transaction is why Ann Dodson, wife of Charles, is believed to be Ann Elmore, daughter of Peter. I must admit, this transaction, because of its rather strange nature, makes me wonder the same thing. However, if this were a deed to a daughter, one would think that it would not revert to Peter Elmore after 19 years. This is not a gift, but a business arrangement.

Unfortunately, because land isn’t conveyed, we really can’t say for sure whether this is Peter Elmore Sr. or Peter Elmore Jr., because Peter’s wife is not required to sign a release of her dower.

Deed Book Page 282 April 24, 1680 – Henry Dawson to Peter Elmore right in a bill of sale. Witnessed by William Dawson and Charles Dodson

Charles Dodson clearly does have a close relationship with Peter Elmore. Unfortunately, we really don’t know why. Are they just close neighbors, or is there something more? If they are related, keep in mind that we don’t know who Charles Dodson’s parents are, who Peter Elmore’s parents are, who Jane Elmore’s parents are nor who Ann Dodson’s parents are.  So if they are actually related, it could be through any of those individuals in any capacity.

Deed Book Page 310 – May 30, 1681 John Harding to Jane Elmore, daughter of Peter Elmore one black cow yearling. Signed with mark. Witness Charles Dodson and Jane Ellmore (signed with mark)

Given that this 1681 deed is witnessed by Jane Ellmore, she surely must be the daughter of the elder Peter Elmore, not the Peter Jr. born in 1643.

Deed Book Page 151 November 1684 – Mr Colston, I should desire you to record for Ann Elmore my eldest daughter two cowes with calves by their sides with all their increase and in soe doeing shall obleig. Signed Peter Elmore by mark

And likewise one cowe and calfe to be between my two youngest sons with their increase. Signed Peter Elmore by mark

And likewise a black heifer of 2 years to William Mathews my son-in-law with all her increase Signed Peter Elmore by mark

This deed executed in November 1684 provides us with even more information about Peter Elmore Jr. This has to be Peter Elmore Jr. because he refers to William Matthews, so this Ann Elmore is the Ann born in 1674.

The close relationship between Charles Dodson and Peter Elmore continues, as we see by the following transactions.

Will Book Jan. 29, 1686/87 Edward Johnson will, Charles Dodson executor, Peter Elmore witness.

Court Order Book March 2, 1686/7 page 15 Ordered Richard White, William Smoote, Peter Elmore or any 2 of them do sometime between this and the next court meet to inventory and appraise the estate of Edward Johnson.

Deed Book Page 165 Charles Dodson convey to beloved son Thomas Dodson brown cow called by the name of Nancy marked with a crop and swallow forke on the left eare and a crop on the right eare together with all her female increase being in exchange with him my said son Thomas for one cow given him by his Godfather Peter Elmore. July 31, 1693 signed, wit William Ward and William Colston

Does Ann Elmore, Daughter of Peter Elmore Sr., Exist?

This 1793 document explains something about the relationship between Charles Dodson and Peter Elmore. Peter is the godfather, not the grandfather, of Charles and Ann’s son Thomas Dodson, born in 1681. If Peter was the child’s grandfather, this deed would have said grandfather, not godfather – because blood would trump any other kind of relationship, since a relationship was identified. If Peter Elmore was Peter Elmore Jr., it would have said uncle, not godfather.

Furthermore, there is no child named Peter among Ann Dodson’s children, nor a child named Jane, Peter Elmore’s wife’s name.

I’m beginning to wonder if Anne Elmore, daughter of Peter Sr., born in 1627, ever actually existed at all. There is nothing anyplace to suggest that she did. Jane, yes – Ann, no.

I’m beginning to think that perhaps Ann Elmore was added to the list of Peter Elmore’s children by a genealogist because someone deduced that Ann Dodson was Ann Elmore because of the 1689 transaction between Charles Dodson, whose wife’s name was Ann, and Peter Elmore.

Charles and Ann Dodson obviously were very close to Peter Elmore, but why?

We’ve now produced evidence that suggests Ann Dodson is not Ann Elmore. However, we still have no idea who Ann Dodson is.

We also don’t know who Charles Dodson’s parents were, or where he came from either. We do know that there is no record of any Dodson family in the region before Charles first appears in the 1679 transaction between Charles Dodson and Peter Elmore.

For all we know, Charles and Ann may have married in England, or wherever they were before they are found in Rappahannock County in 1679.

By that time, Ann and Charles have at least one son, Charles Jr., have probably been married about 9 years and most likely have had about 4 children. We know that Charles Jr. lived to adulthood, and it’s safe to say that Thomas born in 1781 is the second son that lived, but we don’t know if any of the children born between Charles and Thomas survived.

Can Ann Dodson Write?

Ann witnesses four documents in 1693, 1694 and 1705. It appears that she signed her name, although that may simply be because the clerk did not mention that she could not write and signed with a mark. Given that her son, Charles Jr., also married an Ann, it’s difficult to discern which Ann was signing, although the ones where Charles Jr. is absent are much more likely to have been signed by Ann, wife of Charles Sr.

If Ann is literate, it makes the probability that she was raised in England much more likely than being raised in early Virginia.

Court Order Book May 1, 1693 Power of Attorney Easter Mills of Richmond Co. constitute my trusty and loving friend Edward Reid of same to be my attorney to ask a deed above made by my husband John Mills and myself unto Charles Richardson of the same of 125 acres. Wit Ann Dodson, Charles Dodson, Jr, Charles Dodson Sr. Book 1, page 71

Deed Book May 28, 1694 William Richardson and Elizabeth his wife of Richmond Co planter to John Henley of same, planter, 50 ac parcel in Farnham parish adj said Richardson’s land and Thomas Dusin part of a devident of land purch of John Mills of Richmond Co on main branch of Totuskey. Wit Ann Dodson, Charles Dodson Jr, Charles Dodson Sr. Ack June 6, 1694 Book 2 page 29

Notice that in the above deed, no one is noted as signing with an X, but below, having to do with the same deed, both Ann and Charles Jr. are noted as signing by their marks.

Court Order Book May 28, 1694 Elizabeth Richardson POA to Thomas Dusin to acknowledge deed. Signed with mark, wit Ann Dodson by mark, Charles Dodson Jr. by mark and Charles Dodson Sr.

Will Book 24 Apr 1704-04 Oct 1705. Richmond Co, Virginia Wills, Will of Eve Smith. Grandson William and John Goad; daughter Catherine to have her father, John Williams’ chest; granddaughter Hannah Goad; exec. son Abraham Goad; Wits: William Dodson, Charles Dodson, Sr., Anne Dodson.

Life on the Northern Neck

Life on the Northern Neck of Virginia at that time revolved around the planting, nurturing and harvesting of tobacco, a very labor intensive crop.

Charles Dodson was very clearly a man with a great deal of initiative and drive, given that he started out in 1679 by working the land of Peter Elmore that he would never own, and by the time he died, 27 years later, he owned 900 acres.

Ann’s life too would have revolved around crops, seasons and church. While church attendance was mandatory at the time, most people, especially women, didn’t need much encouragement to attend. Where the court sessions were an important social occasion for men, women didn’t usually attend court, and church provided that same type of camaraderie for women.

Charles and Ann lived in, along or on Briery Swamp, a part of the Totuskey watershed. They paid for their land with tobacco, the traditionally accepted money in colonial Virginia.

Ann’s husband did the normal male things of the day. He witnessed wills, witnessed deeds and attended court, occasionally serving as a juror. Charles apparently settled differences with people amicably, because for a very long time, he wasn’t sued and he didn’t sue anyone.

He was highly thought of in the community, because in 1686/1687, when neighbor John Lincoln died, it was reported that John would “have none other than Charles Dodson” for his executor.

In 1688, Charles and Ann would have been about 38 years old.

Something began to change. The first suit was filed against Charles Dodson, with a second one following at the same court tern.

In 1693, a rather unusual transaction occurred where Charles Dodson trades cows with his son, Thomas, who was age 12.

Charles continues to sign deeds as a witness and appear in court, until in 1695, when the “Ozgrippin event” occurred. According to depositions, Charles, along with two other men went to the house of Matthew Ozgrippen (or Ozgriffen), apparently Charles Dodson’s tenant, and forcibly entered the house, beat Matthew and destroyed his tobacco and corn crop.

For two years, and with Murphy of Murphy’s law in attendance, Charles Dodson and Matthew Ozgrippen battled in the courts, with Matthew ultimately winning, but not nearly as much money (tobacco) as he had requested.

Charles then begins to file suits and not appear afterwards.

The behavior of Charles has changed perceptibly and I have to wonder if he changed at home too. He would have been between 40 and 50 at this time. His behavior is similar to what I’ve witnessed up close and personal when strokes or closed head injuries are incurred.

About 1698, the 19 year “arrangement” for Charles to farm and improve Peter Elmore’s land expires, and apparently Charles and Ann built a new house on a new plantation on land they owned, because Charles’ will in 1702/1703 references it as such.

In 1699, when he is age 50, Charles does serve on a jury once more, gives a deposition and is also involved with Ozgrippen again in a suit. Ann must have been holding her breath, waiting on one of those two men to kill the other.

In January 1702/03, Charles Dodson wrote his will. He would have been about 53 at the time. He didn’t pass away right away, in fact, not for 3 more years – and he resumes filing suit and not showing up for court too.

In March of 1705/1706, Charles Dodson’s estate is probated, with Ann as executrix.

Charles Dodson’s Estate Inventory

Charles Dodson’s estate inventory was filed with the court on Oct. 17, 1706, as follows:

  • Feather bed and bedstead and parcel of sheets and one blanket and one rugg – 0600
  • One flock bed and paire of blankets one sheet and rug and bolster and bedstead – 0500
  • One saw and six reep hooks and one paire of old pestells holsters and one old chest and one old bill book – 0200
  • Eight chairs – 0800
  • Two wooden chairs – 0100
  • One chest of drawers and table – 1000
  • Two chest – 0250
  • One small table couch – 0150
  • One warming pan two paire of tongs and one box iron – 0200
  • One pair hilliards – 0250
  • One super table cloth and 12 napkins – 0200
  • Four old napkins and one old table cloth – 0050
  • One feather bed curtains and valens one blankett one pair of sheets and two pillows – 1100
  • A parcel of old books – 0150
  • Ole looking glass and lantron? – 0050
  • One old flock bed 2 blankets rug bolster and pillows – 0400
  • 2 spinning wheels – 0150
  • 3 pots 3 pothooks and 3 pot hangers one spit and one iron pestell – 0450
  • 99 weight of pewter – 0950
  • One bellmettle pestle and mortar 0 0700
  • 7.5 pounds of brass – 0130
  • One servant man 3 years and 8 months to serve – 2200
  • One pare of small hilliards and two smoothing iron and two cutting knives and skewers – 0150
  • One mare and two horses – 2400
  • Parcel of old iron – 0100
  • Pair of cart wheels – 0060
  • Old crosscut saw – 0150
  • One saddle and pillow or pillion – 0120
  • 3 cows and 3 years old – 1800
  • One cow and calfe – 0500
  • 6 two yeare olde – 1200
  • One steere of 5 years old – 0500
  • 2 barren cows and heifer and one calfe – 1400
  • 3 old sheep – 0300
  • 3 lambs – 0200

Total 18780

Signed John Rankin, William Smoot and Richard R. White (his mark)

I absolutely love estate inventories, because they tell us exactly what was in the household and on the farm when the man died. Inventories included everything owned by the couple, because the man was presumed to own all property of any kind except for the wife’s clothes and any real estate deeded to her individually after they were married. The wife was entitled to one third of the value of the husband’s estate unless the husband provided for more. However, the estate’s real value was established by the sale of the inventory items, not by the inventory itself, so everything was inventoried prior to sale.  In some cases, the widow was made an initial allocation so she and the children could simply survive.

The feather bed clearly was the bed that Charles and Ann slept in, but it’s worth noting that there were no bedcurtains or valances which would have suggested a more upper-class household.

There were three beds in the inventory, two of flock which meant a mattress of scraps of fabric and wool instead of feathers. However, Ann and Charles had 8 children and a servant. Obviously there was a lot of bed-sharing going on and not everyone had a bed. The servant may have slept in the barn or on straw in the kitchen.

The spinning wheels certainly weren’t tools used by Charles and were obviously Ann’s.

This photo of a woman with a spinning wheel was taken about 1920, but not a lot had changed in spinning wheel design in the past couple hundred years.

The looking glass may have been a shared resource. Looking glasses were scarce and status symbols.

I do wonder why there were no pots and pans, silverware, candle holders, etc. The absence of these items if very unusual for this time period – and let’s face it, you can’t live without candles and silverware and Charles Dodson, while he wasn’t rich, he certainly was not a poor man.

Ann Remarries

Four months after Charles’ will is probated, Ann has remarried to John Hill, probably between March 6th and July 3rd, 1706.

John Hill is no stranger. In fact, he has been a lifelong friend of Charles Dodson. John Hill had previously married the widow of John Lincoln and she had probably recently died as well, assuming Ann married the same John Hill. They probably knew each other well, possibly for their entire lives. A decision to marry would have benefitted both parties. Life alone was difficult if not impossible in colonial Virginia, and Ann would probably have had some children yet at home given that she was probably between 50 and 55 when Charles died. Women had children until they biologically could not, generally between the ages of 41-45, which meant Ann probably had at least 5 or 6 children remaining at home.

Court Order Book Page 137 March 6, 1705/06 Will of Charles Dodson proved by oath of Christopher Petty with oath of John Beckwith.

Will Book Page 171 July 3, 1706 Upon petition of John Hill and Anne his wife, exec of the will of Charles Dodson decd ordered that John Rankin, William Smoote, John Mills and Richard White or any 3 of them meet at the house of John Hill and inventory and appraise the estate of Charles Dodson. All sworn plus John Hill and Anne, his wife.

Court Order Book Page 262 April 3, 1707 Action brought by Thomas Dodson against John Hill marrying the executrix of Charles Dodson is dismissed, plt not prosecuting.

Thomas Dodson was Ann’s second oldest son, of course, who would have about 26 years old at the time and had been married since 1701. Something upset him enough to file suit, although the issue was apparently resolved within the family as the suit was obviously dropped. I wonder if his suit had anything to do with what appears to be missing estate inventory items.

Court Order Book Page 275 May 7, 1707 John Hill and Anne his wife exec of Charles Dodson confest judgement to Katherine Gwyn exec of will of Majr David Gwyn for 8 pounds 19 shillings and 8 pence 3 farthings and 731 pounds of sweet scented tobacco due upon balance of accounts ordered to be paid with costs.

Court Order Book Page 281 May 8, 1707 Imparlance granted in suite between John Harper plt and John Hill and Anne his wife exec of Charles Dodson decd, till next court.

Court Order Book Page 292 July 3, 1707 John Harper against John Hill and Anne his wife exec of Charles Dodson decde, deft for 500 pounds of tobacco upon balance of accounts, def pleaded they owed nothing and plt asked time to next court.

Court Order Book Page 303 Sept. 4, 1707 Judgement granted to John Harper against John Hill and Anne his wife exec of Charles Dodson, decd, for 405 pounds tobacco due by account proved by oath of plt ordered paid with costs.

Court Order Book Page 323 Dec. 4, 1707 John Hill and Anne his wife exe of will of Charles Dodson decd against John Harper dismissed, plt not prosecuting.

Court Order Book Page 40 June 2 1709 Judgment granted to John Davis Sr. against John Hill and Anne, wife, exec of Charles Dodson decd for 136 pounds tobacco due by account ordered paid with costs.

John Hill

As with Charles Dodson previously, we now have to track Ann’s life through husband, John Hill. As we might expect, it appears there is more than one John Hill, at least eventually. We can’t tell the difference between the two, if there are two this early, and we don’t know when Ann died.

Court Order Book Page 27 June 1, 1709 Ordered Luke Hanks officiate as constable for the ensuing year in room and stead of John Hill in the precincts between Totuskey and Farnham Creeks.

Court Order Book Page 337 Sept. 8, 1715 Petition of Thomas Mountjoy and John Hill for their keep an ordinary at the place where they now live is granted provided they give bond and security as the law directs.

Court Order Book Page 475 May 2, 1716 Ordered the Sheriff to summon William Hill and John Hill to appear to answer the presentment of the grand jury against them for stopping the creek and mill road from the Folly Neck in Farnham Parish within this 3 months.

Please note that you can click to enlarge any image.

Folly Neck is the point of land on the south side of Tosuskey Creek where it intersects with the Rappahannock River. Folly Neck Road (614) intersects with the main road (3). Did Ann live here with John Hill, or did they live on one of Charles Dodson’s plantations?  Was this one of Charles Dodson’s plantations? Folly Neck is just south of Totuskey Creek and not far from Rich Neck, shown a the top of the map below, where  Charles Dodson’s land deeded to both Charles Jr. and Thomas in 1703 was located.

The old Farnham Parish church is just south of Emmerton in the bend of the road and the new church, built in 1737, is currently located at Farnham.  The river near Sharps is Farnham Creek and the one heading northwest underneath the word Simonson is Morattico Creek.

Court Order Book Page 43 August 2, 1716 John Hill his action of case against Ann Dodson executrix of the will of Charles Dodson decd for 313 pounds tobacco due by account is dismissed, plt not prosecuting.

This Charles Dodson is Charles Dodson Jr., the son of Charles Sr. and Ann Dodson Hill, and the Ann Dodson mentioned here is the wife of Charles Jr.

Deed Book September 1716 Deed between Thomas Mountjoy and John Hill.

Deed Book Page 66 October 4, 1716 John Doyle from Edward Barrow gent, one of his majesties justices of the peace for this county, against the estate of John Hill for 261 pounds of tobacco is dismissed, the plt not prosecuting.

Given that this 1716 record doesn’t say John Hill, deceased, it’s unclear whether or not this John Hill in question is deceased.  It seems unlikely since there has been no other mention of a will or probate estate in any existing court or will book for Richmond County. The same day, John Hill is in court, noted below.

Deed Book Page 67 October 4, 1716 John Hill came into court and confessed until Augustine Higgins 4167 pounds of tobacco which is ordered to be paid with costs.

Court Order Book Page 72 October 4, 1716 Action of debt between Joseph Hutchinson Plt and Thomas Mountjoy and John Hill, deft, for 750 pounds tobacco due by bill being called and not appearing on motion judgement is granted him against William Carter, returned security for the deft for the aforesaid sum and costs unless defts appear at next court and answer action.

Court Order Book Page 73 October 4, 1716 Mary Stevens action of debt against John Hill for 600 pounds tobacco due by bill, dismissed, plt not prosecuting.

Court Order Page 91 Feb. 7, 1716/17 Joseph Hutchison action of debt against Thomas Mountjoy and John Hill dismissed the plt not prosecuting.

John Hill was appointed constable, but I failed to copy the date which was in either the  1716 -1717 Court Order book or the 1717-1718 book.

Assuming this John Hill is the same John Hill that was married to Ann Dodson, she has died sometime between June 2, 1709 when she is last mentioned in the court records pertaining to the estate of Charles Dodson, and March 7, 1721/1722, when John Hill’s new wife released her down in land John Hill sells.

Court Order Book Page 36 March 7, 1721/22 Frances Hill wife of John Hill relinquished right of dower in piece of land sold by her husband unto Thomas Creele and ack last Jan court.

The Creele family does live in the neighborhood, because in later generations, the Dodson family intermarries with Creeles. Based on the next entry, John Hill has obviously married a recently widowed woman, for the third time. Given that he seems to have a propensity for that, I wonder if Ann Dodson Hill had just recently died in late 1721 or early 1722.

Court Order Book Page 36 March 7, 1721/22 John Hill and Frances Hill, relict of Robert Reynolds, decd came into court and made oath that Robert Reynolds departed this life without making any will so farr as they know or believe and on their petition and giving security for their just and faithful administration of the decds estate, certificate granted them for obtaining probate.

Court Order Book Page 36 March 7, 1721/22 John Hill, Frances Hill, Caron Brannon and James Neale came into court and ack bond for John Hill and Frances Hill admin of estate of Robert Reynolds, decd.

Court Order Book Page 36 March 7, 1721/22 Thomas Dodson, Christopher Petty, Bartholomew Richard Dodson and Thomas Scurlock or any 3 of them to appraise estate of Robert Reynolds decd. All sworn plus John and Frances Hill, the admins.

It’s impossible to tell whether the above John Hill is the same one that was married to Ann Dodson, but the continued interaction with the Dodson family suggests possibly so. It’s also possible that we are dealing with a second generation John Hill, although Jr. and Sr. is never used in these records.

Court Order Book Page 83 January 2, 1722/23 Ordered John Hill in the Forrest of Moratico of Northumberland Parish to answer to the presentment of the grand jury for unlawfully absenting themselves from their Parish Church for one month last past.

This entry is somewhat confusing, because there is not now nor was there ever, that I an find, a Northumberland Parish in Richmond County, Virginia.  There was a Northumberland County formed in 1648, a neighbor to Richmond County, but the parishes in Northumberland were called St. Stephens and Wycomico (Wicomico) when the county was founded.  Northumberland Parish, is therefore, a bit of a mystery.

If John Hill lived in the Forest of Moratico, so did Ann. This reminds me of Sherwood Forest, although I’m sure I’m being overly romantic. I could not find the Forest of Moratico on current maps, or any map between now and then. Clearly, it’s someplace near the Moratico River which is in the general vicinity of the Dodson lands in Richmond County.

I’m guessing that the Forest of Morattico would be someplace near Morattico Creek shown at the red balloon, above. There are several wooded areas, including three state-owned areas shown in green above.  Below, you can see the extent of the tree cover.

The involvement between the Dodson clan and John Hill continues.

Deed Book Dec. 10, 1723 Thomas Durham to Thomas Dodson Sr. 5 shillings 100 acres formerly belonging to Abraham Marshall bounded by Spanish Oak corner tree of Charles Dodson part of patent formerly granted to William Thatcher by the main branch of Totoskey and then (metes and bounds.) Signed Thomas and Mary Durham, wit John Hill, William Walker and Jeremiah Greenham

Deed Book Dec. 10, 1723 between Thomas Durham to Thomas Dodson Sr. of Richmond Co. 5000 pounds tobacco received by Thomas Dodson Sr certain parcel of land formerly belonging to Abraham Marshall bearing date 25th of 9ber, 1692, containing 100 acres bounded (same as lease above). Signed Thomas Durham, Mary Durham, wit John Hill, William Walker, Jeremiah Greenham

Thomas Dodson Sr. is Ann’s son.

Court Order Book Page 307 Sept. 7, 1726 William Garland plt and Edward Jones deft, the deft being called and not appearing, judgement granted him against deft and John Hill his security for the sum sued for in the declaration shall appear next court with cost providing deft does not then appear and answer thereto.

Court Order Book Page 307 Sept. 7, 1726 John Nancy vs John Hill deft damage 100 pounds sterling the plt being called and not appearing, at deft’s motion ordered that he be nonsuited and that he pay the deft damage according to law and attorney’s fees with costs.

Court Order Book Page 308 Sept. 7, 1726 John Hill his case damage 20 pounds sterling against Richard Woollard dismissed, the plt not prosecuting.

I made a note that there is a John Hill listed in the book, Richmond Co Will Book 4 1717-1725 by TLC, but unfortunately, I did not copy the page. The date could be wrong as well, as the books at the Allen County Public Library in this series appears to have the covers mixed up. This site shows that John’s will was probated April 3, 1728 where he leaves the plantation and land to his wife, who is unnamed.

I expect the 1728 entry is “our” John Hill, as he is clearly dead by April 1728 when Frances is shown in the court records as his executrix. Furthermore, three sons of Charles and Ann Dodson are still connected with this man.

Court Order Book Page 399 April 3, 1728 Last will of John Hill decd presented by Frances Hill, executrix and oath of James Wilson and John Hightower, two witnesses.

Court Order Book Page 399 April 3, 1728 Frances Hill, John Hightower and Lambert Dodson came into court and ack bond for Frances Hill’s administration of will of John Hill decd.

Court Order Book Page 399 April 3, 1728 Thomas Scurlock, Thomas Dodson, John Hightower and Bartholomew Richard Dodson or any 3 of them to appraise estate of John Hill. Oaths admin to all 3 plus Frances Hill.

Court Order Book Page 435 October 2, 1728 Action of debt between Frances Hill executrix of will of John Hill, decd, plt and Thomas Livack and Mary, wife executrix of will of John Mills, decd, for 16,000 pounds tobacco due by bond, the def being called and not appearing the motion of the plt judgement is granted her against the defts.

These next two orders show that there was unquestionably (at least) two John Hills, because one is still living.

Court Order Book Page 644 May 3, 1732 Thomas Dodson, Sr, Jeremiah Greenham and John Hill on grand jury.

Court Order Book Page 172 April 1, 1734 Jeremiah Greenham and John Hill on jury.

At this point in time, it’s very unlikely for this John Hill, active in court, to be the husband of Ann Dodson Hill. Ann would have been about 85 years old by now, and John probably as well. They are very likely both deceased by this time and if John isn’t deceased, he’s probably not riding his horse to court. I stopped extracting John Hill information at this point.

I believe that Ann died before 1721/1722 when John had remarried to Frances.

Where is Ann Buried?

In the book, “The Registers of North Farnham Parish 1663-1814,” the following map of the current and old Farnham Parish churches is shown. The current church was built in 1737, and the previous church was located some distance away, on the main road.

This map gives the only locations I have ever seen of the original church, other than a general description.

What I don’t know is whether this is an approximation, or if the old-timers actually knew the location of the old church.

Regardless, given this map, I was able to find the location on Google maps today based on the bends in the road.

Map above, satellite view below.

The X on the map from the Farnham Parish book would be found approximately where the Calvary United Methodist Church is found today.

A closer view allows us to see the lay of the land.

The church does have a cemetery, although we have no idea of course whether this cemetery predates this church or whether the original Farnham Parish church was even in this location.

The original church was certainly someplace nearby, so let’s take a drive down this road.

What a beautiful white country church. Whether the original Farnham Parish Church church was in this location or not, Ann would have seen this beautiful countryside on her way to church.

The earliest burials in this cemetery with markers are a Ficklin in 1873 and a Lyell 1884. The area of the cemetery is quite large, so there may well be many unmarked burials in the churchyard. I was unable to find any history of this particular church online.

The fields beside the church would have been prime farmland – flat and dry. At that time, they would have been planted in tobacco (for 3 years) or corn (for 3 years), or lieing fallow (for 20 years), waiting for the nutrients to replenish so that the fields could be planted once again.

Ann’s Children

Ann and Charles had several children who survived at least until Charles made his will in January 1702/1703. There were likely several more children born to Ann as well. In the following generations, there were at least three grandchildren named for Charles but only one that we know of named for Ann. Of course, we don’t know the identities of the children of William, Anne or Elizabeth and only two names of children of Richard Bartholomew who are remembered in Charles’ will, but we know nothing further.

If Ann was born about 1652 and had her first child in 1672, she would have been having children until about 1695 or so when she would have been about 43 years of age.

  • Charles Junior was born between 1672 and 1677 and likely closer to 1672 given that he witnessed a document in 1693. Based on the deeds by Charles and the fact that he was named for his father, he was most likely the eldest son, if not the eldest child. Charles married an Anne whose surname is unknown.  Charles Jr. died between July of 1715 and May of 1716 when his will was probated.
  • Child born about 1674
  • Child born about 1676
  • Child born about 1678
  • Thomas Dodson was born on May 15, 1681, married Mary Durham on August 1, 1701 and died on November 21, 1740 in Richmond County.

We don’t have birth dates for the remainder of the children, so I’ve listed them as best we know.

  • Child born about 1683
  • Elizabeth possibly born about 1685, nothing further known except that she was alive when her father wrote his will in 1703
  • Anne possibly born about 1687, nothing more is known except that she was alive when her father wrote his will in 1703
  • Bartholomew Richard Dodson married Elizabeth Clark and their first child, James was born on December 23, 1716 according to the North Farnham Parish Records. This would suggest his birth date probably around 1689 if James was the first child. They are last found in the Richmond County records in 1734 selling their land to brother Thomas Dodson, listing themselves as “of Northumberland County.” Unfortunately, Northumberland County records are mostly missing and Bartholomew Richard disappears after this date.

I suspect that Bartholomew Richard’s name may be a hint as to the parents of either Ann or Charles, given that middle names were not utilized at that time unless they were family names and Bartholomew was a very unusual name.

  • William Dodson born about 1691, about whom nothing more is known. He may have died before a 1717 land conveyance by James Tune and Bartholomew Richard Dodson that could have been his land, or he may simply have moved away, abandoning his land with no record.
  • John Dodson born about 1693 was married to Elizabeth Goad about 1724 and died in Shenandoah Co., VA in 1784. In 1726, John sold or leased to Robert Mathews his 100 acres for the use of Mathews for 3 natural lifetimes, with the actual ownership remaining with John, per Charles Sr.’s wishes in his will. In 1737, two of John’s sons, Charles age 1 and Moses age 8 were taken into the care of the church, although nothing more is said as to why. John left soon thereafter and is found in Augusta County by 1741 when his daughter Elizabeth was baptized. John bequeaths his land, leased for 3 lifetimes, to his son, Charles, in his will.
  • Lambeth Dodson was born about 1695 and married a Sarah whose surname is unknown. Lambeth sold the land he inherited from his father being “the new dwelling plantation with 100 acres of land belonging to it” to his brother, Thomas, who bequeathed the land in his will in 1739 to his son Greenham Dodson. By 1753, Lambeth is found in Halifax County, VA and in Guilford Co., NC by 1779.

Lambeth’s son, Greenham Dodson married Eleanor Hightower and sold the 100 acres of Charles’ land to Jeremiah Greenham in 1746, Richmond County deeds 10-373. This land needs to be tracked forward from Jeremiah, with the hope that it can be located today.

Ann’s DNA

The only DNA that we could specifically identify today of Ann’s would be her mitochondrial DNA which is passed from mothers to all of their children, but only passed on to subsequent generations by females. Unfortunately, we know absolutely nothing about what happened to Ann’s two daughters, Anne and Elizabeth. We only know they existed because Charles’ will mentions them. They could have died or married, but regardless, we have no further records of these women, so we can’t obtain Ann’s mitochondrial DNA.

Many people carry autosomal DNA tracking back to Charles and Ann. Some of that DNA is undoubtedly Ann’s DNA, but when we have DNA attributed to a couple, the only way to tell whose DNA is whose is to be able to track specific segments upstream to either the Dodson side or Ann’s side.

The way to do that is to track those segments by finding them in Dodson’s, for example, who do not descend through Ann or Charles – meaning through Charles Dodson’s siblings. Since we don’t know who Charles’ parents nor Ann’s parents were, we don’t know who their siblings are either, so our figurative hands are tied relative to identifying whether segments descending from this couple are his or hers. We can only tell that they are “theirs.”

At Family Tree DNA, where I can both search for current and ancestral surnames, AND compare people to look for matching segments in a chromosome browser, I did just that.

I found a total of 22 people who either have the current surname of Dodson or have Dodson listed in their Ancestral Surnames. Some have trees, and some don’t.

I checked each tree to see how my matches descend from a Dodson ancestor. I discovered that we descend through at least two sons of Charles and Ann Dodson. Several people are brick walled and don’t have their genealogy back far enough to connect.

However, the Dodson DNA connects us when compared to known Dodson descendants.

I pushed all of these people through to the chromosome browser, 5 at a time, and downloaded the matching results, combining them into one working spreadsheet. In total, I had 22 matches that matched me on a total of 452 separate segments. Many of these people matched me on some of the same segments

There are two sizeable segments of chromosome 5 that have, amazingly, arrived intact from the Dodson line.

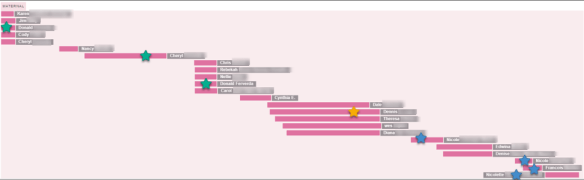
This first segment is staggered across the first half of the chromosome, and of this group, only two, the yellow and orange have their Dodson lines proven back to Charles. Both the yellow and orange descend through son Thomas, the same as me.

The cM values and ranges for the people shown above as compared to me are:

While the chromosome browser tells me that all of these people match me on the same chromosome – all chromosomes have two sides – Mom’s and Dad’s. Furthermore, these matches are staggered, so not entirely overlapping. Therefore, some of the people may not match each other either because their overlapping portion of the segment on chromosome 5 isn’t large enough to be considered a match to each other, or because some people could be matching me from a line on my mother’s side.

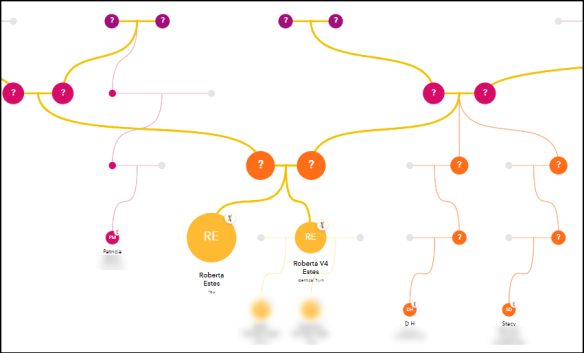
To see if these people all match each other, I used the Matrix tool.

Three of these individuals match each other, plus me, although a matrix match does not guarantee a match on the same segment(s). It does, however, create a genetic network of people known to match and share ancestors, or in this care, a mixture of people proven to Charles and Ann and people whose genealogy isn’t proven quite that far back but who are Dodson descendants.

Two individuals do not match each other. If the overlap occurs without enough DNA matching to be over the threshold, non-matching can be the result. As you can see in the table and also on the chromosome graphic above, the orange and magenta are very offset from the other 3. Sure enough, these two don’t match the other 3 more closely aligned matches over the matching threshold, so either they don’t belong in this group or their overlap isn’t large enough for a match to each other. Looking for other clues, neither of those two are assigned to my father’s side through phased matching.

But wait, there’s more.

A second matching segment on chromosome 5 is even more remarkable.

These segments are even longer and more robust. Five people are shown above on the chromosome browser, above, and in the first 5 rows below.

Three additional people match on these segments, but the chromosome browser only displays 5 at a time. The row below green would be the exact same segment as the green segment. The segment with only 1.37 cM is very small and the last segment, at 13.34 is a known cousin, so I omitted that individual from the browser.

To be as sure as I can be that these segments are legitimate and that these people also match each other, I used the matrix tool again.

This matrix shows that all of the individuals in the matrix match. I’ve included two of the three individuals whose DNA did not fit in the chromosome browser, excluding the one small segment match. All match each other, except for the last row who is the known cousin whose matching segment is much smaller and does not extend the full length of the segments of the other individuals who are matching to me. Therefore, that cousin matches some, but not others, as might be expected.

While Family Tree DNA does not have explicit triangulation, the combination of the chromosome browser showing matches on the same segment, the same family line and the matrix tool indicating that these people also match each other is a very powerful indication that triangulation would or will occur if you can verify that these people also match each other. These individuals form a match group.

So, at this point, we can assume that of these people, all of the group in the second matrix and at least 3 of the 5 in the first matrix all descend from Charles and Ann Dodson, for a minimum total of 10 people plus me.

This is actually quite remarkable, because these large segments have survived through 10 generations on my side alone – plus about as many generations for each of them as well.

If one can assume that the other people matching that chromosome 5 segment are also 10 generations removed from Charles and Ann, they would be my 9th cousins.

The shared cM chart doesn’t even go as far out as 9th cousins. The highest is 8th, with the maximum amount of shared DNA by cM for 8th cousins being 16 cM with an average of 9. These centiMorgans ranging from 15 to 39 for this entire group is really quite amazing. The Dodson DNA seems to “stick together” quite well.

Now if we could just tell if we are looking at Ann’s DNA or Charles’ DNA, or some combination of both. Maybe someday there will be an avenue to associate this segment with the Dodson line or Ann’s family line – and if that day comes, maybe we’ll finally be able to solve the mystery of who Ann Dodson, wife of Charles Dodson, really was.

______________________________________________________________

Disclosure

I receive a small contribution when you click on some of the links to vendors in my articles. This does NOT increase the price you pay but helps me to keep the lights on and this informational blog free for everyone. Please click on the links in the articles or to the vendors below if you are purchasing products or DNA testing.

Thank you so much.

DNA Purchases and Free Transfers

Genealogy Services

Genealogy Research

Which DNA Test is Best?

If you’re reading this article, congratulations. You’re a savvy shopper and you’re doing some research before purchasing a DNA test. You’ve come to the right place.

The most common question I receive is asking which test is best to purchase. There is no one single best answer for everyone – it depends on your testing goals and your pocketbook.

Testing Goals

People who want to have their DNA tested have a goal in mind and seek results to utilize for their particular purpose. Today, in the Direct to Consumer (DTC) DNA market space, people have varied interests that fall into the general categories of genealogy and medical/health.

I’ve approached the question of “which test is best” by providing information grouped into testing goal categories.  I’ve compared the different vendors and tests from the perspective of someone who is looking to test for those purposes – and I’ve created separate sections of this article for each interest..

We will be discussing testing for:

  • Ethnicity – Who Am I? – Breakdown by Various World Regions
  • Adoption – Finding Missing Parents or Close Family
  • Genealogy – Cousin Matching and Ancestor Search/Verification
  • Medical/Health

We will be reviewing the following test types:

  • Autosomal
  • Y DNA (males only)
  • Mitochondrial DNA

I have included summary charts for each section, plus an additional chart for:

  • Additional Vendor Considerations

If you are looking to select one test, or have limited funds, or are looking to prioritize certain types of tests, you’ll want to read about each vendor, each type of test, and each testing goal category.

Each category reports information about the vendors and their products from a different perspective – and only you can decide which of these perspectives and features are most important to you.

You might want to read this short article for a quick overview of the 4 kinds of DNA used for genetic genealogy and DTC testing and how they differ.

The Big 3

Today, there are three major players in the DNA testing market, not in any particular order:

Each of these companies offers autosomal tests, but each vendor offers features that are unique. Family Tree DNA and 23andMe offer additional tests as well.

In addition to the Big 3, there are a couple of new kids on the block that I will mention where appropriate. There are also niche players for the more advanced genetic genealogist or serious researcher, and this article does not address advanced research.

In a nutshell, if you are serious genealogist, you will want to take all of the following tests to maximize your tools for solving genealogical puzzles. There is no one single test that does everything.

  • Full mitochondrial sequence that informs you about your matrilineal line (only) at Family Tree DNA. This test currently costs $199.
  • Y DNA test (for males only) that informs you about your direct paternal (surname) line (only) at Family Tree DNA. This test begins at $169 for 37 markers.
  • Family Finder, an autosomal test that provides ethnicity estimates and cousin matching at Family Tree DNA. This test currently costs $89.
  • AncestryDNA, an autosomal test at Ancestry.com that provides ethnicity estimates and cousin matching. (Do not confuse this test with Ancestry by DNA, which is not the same test and does not provide the same features.) This test currently costs $99, plus the additional cost of a subscription for full feature access. You can test without a subscription, but nonsubscribers can’t access all of the test result features provided to Ancestry subscribers.
  • 23andMe Ancestry Service test, an autosomal test that provides ethnicity estimates and cousin matching. The genealogy version of this test costs $99, the medical+genealogy version costs $199.

A Word About Third Party Tools

A number of third party tools exist, such as GedMatch and DNAGedcom.com, and while these tools are quite useful after testing, these vendors don’t provide tests. In order to use these sites, you must first take an autosomal DNA test from a testing vendor. This article focuses on selecting your DNA testing vendor based on your testing goals.

Let’s get started!

Ethnicity

Many people are drawn to DNA testing through commercials that promise to ‘tell you who you are.” While the allure is exciting, the reality is somewhat different.

Each of the major three vendors provide an ethnicity estimate based on your autosomal DNA test, and each of the three vendors will provide you with a different result.

Yep, same person, different ethnicity breakdowns.

Hopefully, the outcomes will be very similar, but that’s certainly not always the case. However, many people take one test and believe those results wholeheartedly. Please don’t. You may want to read Concepts – Calculating Ethnicity Percentages to see how varied my own ethnicity reports are at various vendors as compared to my known genealogy.

The technology for understanding “ethnicity” from a genetic perspective is still very new. Your ethnicity estimate is based on reference populations from around the world – today. People and populations move, and have moved, for hundreds, thousands and tens of thousands of years. Written history only reaches back a fraction of that time, so the estimates provided to people today are not exact.

That isn’t to criticize any individual vendor. View each vendor’s results not as gospel, but as their opinion based on their reference populations and their internal proprietary algorithm of utilizing those reference populations to produce your ethnicity results.

To read more about how ethnicity testing works, and why your results may vary between vendors or not be what you expected, click here.

I don’t want to discourage anyone from testing, only to be sure consumers understand the context of what they will be receiving. Generally speaking, these results are accurate at the continental level, and less accurate within continents, such as European regional breakdowns.

All three testing companies provide additional features or tools, in addition to your ethnicity estimates, that are relevant to ethnicity or population groups.

Let’s look at each company separately.

Ethnicity – Family Tree DNA

Family Tree DNA’s ethnicity tool is called myOrigins and provides three features or tools in addition to the actual ethnicity estimate and associated ethnicity map.

Please note that throughout this article you can click on any image to enlarge.

On the myOrigins ethnicity map page, above, your ethnicity percentages and map are shown, along with two additional features.

The Shared Origins box to the left shows the matching ethnic components of people on your DNA match list. This is particularly useful if you are trying to discover, for example, where a particular minority admixture comes from in your lineage. You can select different match types, for example, immediate relatives or X chromosome matches, which have special inheritance qualities.

Clicking on the apricot (mitochondrial DNA) and green (Y DNA) pins in the lower right corner drops the pins in the locations on your map of the most distant ancestral Y and mitochondrial DNA locations of the individuals in the group you have selected in the Shared Origins match box. You may or may not match these individuals on the Y or mtDNA lines, but families tend to migrate in groups, so match hints of any kind are important.

A third unique feature provided by Family Tree DNA is Ancient Origins, a tool released with little fanfare in November 2016.

Ancient Origins shows the ancient source of your European DNA, based on genome sequencing of ancient DNA from the locations shown on the map.

Additionally, Family Tree DNA hosts an Ancient DNA project where they have facilitated the upload of the ancient genomes so that customers today can determine if they match these ancient individuals.

Kits included in the Ancient DNA project are shown in the chart below, along with their age and burial location. Some have matches today, and some of these samples are included on the Ancient Origins map.

Individual Approx. Age Burial Location Matches Ancient Origins Map
Clovis Anzick 12,500 Montana (US) Yes No
Linearbandkeramik 7,500 Stuttgart, Germany Yes Yes
Loschbour 8,000 Luxembourg Yes Yes
Palaeo-Eskimo 4,000 Greenland No No
Altai Neanderthal 50,000 Altai No No
Denisova 30,000 Siberia No No
Hinxton-4 2,000 Cambridgeshire, UK No No
BR2 3,200 Hungary Yes Yes
Ust’-Ishim 45,000 Siberia Yes No
NE1 7,500 Hungary Yes Yes

Ethnicity – Ancestry

In addition to your ethnicity estimate, Ancestry also provides a feature called Genetic Communities.

Your ethnicity estimate provides percentages of DNA found in regions shown on the map by fully colored shapes – green in Europe in the example above. Genetic Communities show how your DNA clusters with other people in specific regions of the world – shown with dotted clusters in the US in this example.

In my case, my ethnicity at Ancestry shows my European roots, illustrated by the green highlighted areas, and my two Genetic Communities are shown by yellow and red dotted regions in the United States.

My assigned Genetic Communities indicate that my DNA clusters with other people whose ancestors lived in two regions; The Lower Midwest and Virginia as well as the Alleghenies and Northeast Indiana.

Testers can then view their DNA matches within that community, as well as a group of surnames common within that community.

The Genetic Communities provided for me are accurate, but don’t expect all of your genealogical regions to be represented in Genetic Communities. For example, my DNA is 25% German, and I don’t have any German communities today, although ancestry will be adding new Genetic Communities as new clusters are formed.

You can read more about Genetic Communities here and here.

Ethnicity – 23andMe

In addition to ethnicity percentage estimates, called Ancestry Composition, 23andMe offers the ability to compare your Ancestry Composition against that of your parent to see which portions of your ethnicity you inherited from each parent, although there are problems with this tool incorrectly assigning parental segments.

Additionally, 23andMe paints your chromosome segments with your ethnic heritage, as shown below.

You can see that my yellow Native American segments appear on chromosomes 1 and 2.

In January 2017, 23andMe introduced their Ancestry Timeline, which I find to be extremely misleading and inaccurate. On my timeline, shown below, they estimate that my most recent British and Irish ancestor was found in my tree between 1900 and 1930 while in reality my most recent British/Irish individual found in my tree was born in England in 1759.

I do not view 23andMe’s Ancestry Timeline as a benefit to the genealogist, having found that it causes people to draw very misleading conclusions, even to the point of questioning their parentage based on the results. I wrote about their Ancestry Timeline here.

Ethnicity Summary

All three vendors provide both ethnicity percentage estimates and maps. All three vendors provide additional tools and features relevant to ethnicity. Vendors also provide matching to other people which may or may not be of interest to people who test only for ethnicity. “Who you are” only begins with ethnicity estimates.

DNA test costs are similar, although the Family Tree DNA test is less at $89. All three vendors have sales from time to time.

Ethnicity Vendor Summary Chart

Ethnicity testing is an autosomal DNA test and is available for both males and females.

Family Tree DNA Ancestry 23andMe
Ethnicity Test Included with $89 Family Finder test Included with $99 Ancestry DNA test Included with $99 Ancestry Service
Percentages and Maps Yes Yes Yes
Shared Ethnicity with Matches Yes No Yes
Additional Feature Y and mtDNA mapping of ethnicity matches Genetic Communities Ethnicity phasing against parent (has issues)
Additional Feature Ancient Origins Ethnicity mapping by chromosome
Additional Feature Ancient DNA Project Ancestry Timeline


Adoption and Parental Identity

DNA testing is extremely popular among adoptees and others in search of missing parents and grandparents.

The techniques used for adoption and parental search are somewhat different than those used for more traditional genealogy, although non-adoptees may wish to continue to read this section because many of the features that are important to adoptees are important to other testers as well.

Adoptees often utilize autosomal DNA somewhat differently than traditional genealogists by using a technique called mirror trees. In essence, the adoptee utilizes the trees posted online of their closest DNA matches to search for common family lines within those trees. The common family lines will eventually lead to the individuals within those common trees that are candidates to be the parents of the searcher.

Here’s a simplified hypothetical example of my tree and a first cousin adoptee match.

The adoptee matches me at a first cousin level, meaning that we share at least one common grandparent – but which one? Looking at other people the adoptee matches, or the adoptee and I both match, we find Edith Lore (or her ancestors) in the tree of multiple matches. Since Edith Lore is my grandmother, the adoptee is predicted to be my first cousin, and Edith Lore’s ancestors appear in the trees of our common matches – that tells us that Edith Lore is also the (probable) grandmother of the adoptee.

Looking at the possibilities for how Edith Lore can fit into the tree of me and the adoptee, as first cousins, we fine the following scenario.

Testing the known child of daughter Ferverda will then provide confirmation of this relationship if the known child proves to be a half sibling to the adoptee.

Therefore, close matches, the ability to contact matches and trees are very important to adoptees. I recommend that adoptees make contact with www.dnaadoption.com. The volunteers there specialize in adoptions and adoptees, provide search angels to help people and classes to teach adoptees how to utilize the techniques unique to adoption search such as building mirror trees.

For adoptees, the first rule is to test with all 3 major vendors plus MyHeritage. Family Tree DNA allows you to test with both 23andMe and Ancestry and subsequently transfer your results to Family Tree DNA, but I would strongly suggest adoptees test on the Family Tree DNA platform instead. Your match results from transferring to Family Tree DNA from other companies, except for MyHeritage, will be fewer and less reliable because both 23andMe and Ancestry utilize different chip technology.

For most genealogists, MyHeritage is not a player, as they have only recently entered the testing arena, have a very small data base, no tools and are having matching issues. I recently wrote about MyHeritage here. However, adoptees may want to test with MyHeritage, or upload your results to MyHeritage if you tested with Family Tree DNA, because your important puzzle-solving match just might have tested there and no place else. You can read about transfer kit compatibility and who accepts which vendors’ tests here.

Adoptees can benefit from ethnicity estimates at the continental level, meaning that regional (within continent) or minority ethnicity should be taken with a very large grain of salt. However, knowing that you have 25% Jewish heritage, for example, can be a very big clue to an adoptee’s search.

Another aspect of the adoptees search that can be relevant is the number of foreign testers. For many years, neither 23andMe, nor Ancestry tested substantially (or at all) outside the US. Family Tree DNA has always tested internationally and has a very strong Jewish data base component.

Not all vendors report X chromosome matches. The X chromosome is important to genetic genealogy, because it has a unique inheritance path. Men don’t inherit an X chromosome from their fathers. Therefore, if you match someone on the X chromosome, you know the relationship, for a male, must be from their mother’s side. For a female, the relationship must be from the mother or the father’s mother’s side. You can read more about X chromosome matching here.

Neither Ancestry nor MyHeritage have chromosome browsers which allow you to view the segments of DNA on which you match other individuals, which includes the X chromosome.

Adoptee Y and Mitochondrial Testing

In addition to autosomal DNA testing, adoptees will want to test their Y DNA (males only) and mitochondrial DNA.

These tests are different from autosomal DNA which tests the DNA you receive from all of your ancestors. Y and mitochondrial DNA focus on only one specific line, respectively. Y DNA is inherited by men from their fathers and the Y chromosome is passed from father to son from time immemorial. Therefore, testing the Y chromosome provides us with the ability to match to current people as well as to use the Y chromosome as a tool to look far back in time. Adoptees tend to be most interested in matching current people, at least initially.

Working with male adoptees, I have a found that about 30% of the time a male will match strongly to a particular surname, especially at higher marker levels. That isn’t always true, but adoptees will never know if they don’t test. An adoptee’s match list is shown at 111 markers, below.

Furthermore, utilizing the Y and mitochondrial DNA test in conjunction with autosomal DNA matching at Family Tree DNA helps narrows possible relatives. The Advanced Matching feature allows you to see who you match on both the Y (or mitochondrial) DNA lines AND the autosomal test, in combination.

Mitochondrial DNA tests the matrilineal line only, as women pass their mitochondrial DNA to all of their children, but only females pass it on. Family Tree DNA provides matching and advanced combination matching/searching for mitochondrial DNA as well as Y DNA. Both genders of children carry their mother’s mitochondrial DNA. Unfortunately, mitochondrial DNA is more difficult to work with because of the surname changes in each generation, but you cannot be descended from a woman, or her direct matrilineal ancestors if you don’t substantially match her mitochondrial DNA.

Some vendors state that you receive mitochondrial DNA with your autosomal results, which is only partly accurate. At 23andMe, you receive a haplogroup but no detailed results and no matching. 23andMe does not test the entire mitochondria and therefore cannot provide either advanced haplogroup placement nor Y or mitochondrial DNA matching between testers.

For additional details on the Y and Mitochondrial DNA tests themselves and what you receive, please see the Genealogy – Y and Mitochondrial DNA section.

Adoption Summary

Adoptees should test with all 4 vendors plus Y and mitochondrial DNA testing.

  • Ancestry – due to their extensive data base size and trees
  • Family Tree DNA – due to their advanced tools, chromosome browser, Y and mitochondrial DNA tests (Ancestry and 23andMe participants can transfer autosomal raw data files and see matches for free, but advanced tools require either an unlock fee or a test on the Family Tree DNA platform)
  • 23andMe – no trees and many people don’t participate in sharing genetic information
  • MyHeritage – new kid on the block, working through what is hoped are startup issues
  • All adoptees should take the full mitochondrial sequence test.
  • Male adoptees should take the 111 marker Y DNA test, although you can start with 37 or 67 markers and upgrade later.
  • Y and mitochondrial tests are only available at Family Tree DNA.

Adoptee Vendor Feature Summary Chart

Family Tree DNA Ancestry 23andMe MyHeritage
Autosomal DNA – Males and Females
Matching Yes Yes Yes Yes – problems
Relationship Estimates* Yes – May be too close Yes – May be too distant Yes – Matches may not be sharing Yes –  problematic
International Reach Very strong Not strong but growing Not strong Small but subscriber base is European focused
Trees Yes Yes No Yes
Tree Quantity 54% have trees, 46% no tree (of my first 100 matches) 56% have trees, 44% no tree or private (of my first 100 matches) No trees ~50% don’t have trees or are private (cannot discern private tree without clicking on every tree)
Data Base Size Large Largest Large – but not all opt in to matching Very small
My # of Matches on 4-23-2017 2,421 23,750 1,809 but only 1,114 are sharing 75
Subscription Required No No for partial, Yes for full functionality including access to matches’ trees, minimal subscription for $49 by calling Ancestry No No for partial, Yes for full functionality
Other Relevant Tools New Ancestor Discoveries
Autosomal DNA Issues Many testers don’t have trees Many testers don’t have trees Matching opt-in is problematic, no trees at all Matching issues, small data base size is problematic, many testers don’t have trees
Contact Methodology E-mail address provided to matches Internal message system – known delivery issues Internal message system Internal message system
X Chromosome Matching Yes No Yes No
Y-DNA – Males Only
Y DNA STR Test Yes- 37, 67, and 111 markers No No No
Y Haplogroup Yes as part of STR test plus additional testing available No Yes, basic level but no additional testing available, outdated haplogroups No
Y Matching Yes No No No
Advanced Matching Between Y and Autosomal Yes No No No
Mitochondrial DNA- Males and Females
Test Yes, partial and full sequence No No No
Mitochondrial DNA Haplogroup Yes, included in test No Yes, basic but full haplogroup not available, haplogroup several versions behind No
Advanced Matching Between Mitochondrial and Autosomal Yes No No No

Genealogy – Cousin Matching and Ancestor Search/Verification

People who want to take a DNA test to find cousins, to learn more about their genealogy, to verify their genealogy research or to search for unknown ancestors and break down brick walls will be interested in various types of testing

Test Type Who Can Test
Y DNA – direct paternal line Males only
Mitochondrial DNA – direct matrilineal line Males and Females
Autosomal – all lines Males and Females

Let’s begin with autosomal DNA testing for genealogy which tests your DNA inherited from all ancestral lines.

Aside from ethnicity, autosomal DNA testing provides matches to other people who have tested. A combination of trees, meaning their genealogy, and their chromosome segments are used to identify (through trees) and verify (through DNA segments) common ancestor(s) and then to assign a particular DNA segment(s) to that ancestor or ancestral couple. This process, called triangulation, then allows you to assign specific segments to particular ancestors, through segment matching among multiple people. You then know that when another individual matches you and those other people on the same segment, that the DNA comes from that same lineage. Triangulation is the only autosomal methodology to confirm ancestors who are not close relatives, beyond the past 2-3 generations or so.

All three vendors provide matching, but the tools they include and their user interfaces are quite different. 

Genealogy – Autosomal –  Family Tree DNA

Family Tree DNA entered DNA testing years before any of the others, initially with Y and mitochondrial DNA testing.

Because of the diversity of their products, their website is somewhat busier, but they do a good job of providing areas on the tester’s personal landing page for each of the products and within each product, a link for each feature or function.

For example, the Family Finder test is Family Tree DNA’s autosomal test. Within that product, tools provided are:

  • Matching
  • Chromosome Browser
  • Linked Relationships
  • myOrigins
  • Ancient Origins
  • Matrix
  • Advanced Matching

Unique autosomal tools provided by Family Tree DNA are:

  • Linked Relationships that allows you to connect individuals that you match to their location in your tree, indicating the proper relationship. Phased Family Matching uses these relationships within your tree to indicate which side of your tree other matches originate from.
  • Phased Family Matching shows which side of your tree, maternal, paternal or both, someone descends from, based on phased DNA matching between you and linked relationship matches as distant as third cousins. This allows Family Tree DNA to tell you whether matches are paternal (blue icon), maternal (red icon) or both (purple icon) without a parent’s DNA. This is one of the best autosomal tools at Family Tree DNA, shown below.

  • In Common With and Not In Common With features allow you to sort your matches in common with another individual a number of ways, or matches not in common with that individual.
  • Filtered downloads provide the downloading of chromosome data for your filtered match list.
  • Stackable filters and searches – for example, you can select paternal matches and then search for a particular surname or ancestral surname within the paternal matches.
  • Common ethnicity matching through myOrigins allows you to see selected groups of individuals who match you and share common ethnicities.
  • Y and mtDNA locations of autosomal matches are provided on your ethnicity map through myOrigins.
  • Advanced matching tool includes Y, mtDNA and autosomal in various combinations. Also includes matches within projects where the tester is a member as well as by partial surname.
  • The matrix tool allows the tester to enter multiple people that they match in order to see if those individuals also match each other. The matrix tool is, in combination with the in-common-with tool and the chromosome browser is a form of pseudo triangulation, but does not indicate that the individuals match on the same segment.

  • Chromosome browser with the ability to select different segment match thresholds to display when comparing 5 or fewer individuals to your results.
  • Projects to join which provide group interaction and allow individuals to match only within the project, if desired.

To read more about how to utilize the various autosomal tools at Family Tree DNA, with examples, click here.

Genealogy – Autosomal – Ancestry

Ancestry only offers autosomal DNA testing to their customers, so their page is simple and straightforward.

Ancestry is the only testing vendor (other than MyHeritage who is not included in this section) to require a subscription for full functionality, although if you call the Ancestry support line, a minimal subscription is available for $49. You can see your matches without a subscription, but you cannot see your matches trees or utilize other functions, so you will not be able to tell how you connect to your matches. Many genealogists have Ancestry subscriptions, so this is minimally problematic for most people.

However, if you don’t realize you need a subscription initially, the required annual subscription raises the effective cost of the test quite substantially. If you let your subscription lapse, you no longer have access to all DNA features. The cost of testing with Ancestry is the cost of the test plus the cost of a subscription if you aren’t already a subscriber.

This chart, from the Ancestry support center, provides details on which features are included for free and which are only available with a subscription.

Unique tools provided by Ancestry include:

  • Shared Ancestor Hints (green leaves) which indicate a match with whom you share a common ancestor in your tree connected to your DNA, allowing you to display the path of you and your match to the common ancestor. In order to take advantage of this feature, testers must link their tree to their DNA test. Otherwise, Ancestry can’t do tree matching.  As far as I’m concerned, this is the single most useful DNA tool at Ancestry. Subscription required.

  • DNA Circles, example below, are created when several people whose DNA matches also share a common ancestor. Subscription required.

  • New Ancestor Discoveries (NADs), which are similar to Circles, but are formed when you match people descended from a common ancestor, but don’t have that ancestor in your tree. The majority of the time, these NADs are incorrect and are, when dissected and the source can be determined, found to be something like the spouse of a sibling of your ancestor. I do not view NADs as a benefit, more like a wild goose chase, but for some people these could be useful so long as the individual understands that these are NOT definitely ancestors and only hints for research. Subscription required.
  • Ancestry uses a proprietary algorithm called Timber to strip DNA from you and your matches that they consider to be “too matchy,” with the idea that those segments are identical by population, meaning likely to be found in large numbers within a population group – making them meaningless for genealogy. The problem is that Timber results in the removal of valid segments, especially in endogamous groups like Acadian families. This function is unique to Ancestry, but many genealogists (me included) don’t consider Timber a benefit.
  • Genetic Communities shows you groups of individuals with whom your DNA clusters. The trees of cluster members are then examined by Ancestry to determine connections from which Genetic Communities are formed. You can filter your DNA match results by Genetic Community.

Genealogy – Autosomal – 23and Me

Unfortunately, the 23andMe website is not straightforward or intuitive. They have spent the majority of the past two years transitioning to a “New Experience” which has resulted in additional confusion and complications when matching between people on multiple different platforms. You can take a spin through the New Experience by clicking here.

23andMe requires people to opt-in to sharing, even after they have selected to participate in Ancestry Services (genealogy) testing, have opted-in previously and chosen to view their DNA Relatives. Users on the “New Experience” can then either share chromosome data and results with each other individually, meaning on a one by one basis, or globally by a one-time opt-in to “open sharing” with matches. If a user does not opt-in to both DNA Relatives and open sharing, sharing requests must be made individually to each match, and they must opt-in to share with each individual user. This complexity and confusion results in an approximate sharing rate of between 50 and 60%. One individual who religiously works their matches by requesting sharing now has a share rate of about 80% of their matches in the data base who HAVE initially selected to participate in DNA Relatives. You can read more about the 23andMe experience at this link.

Various genetic genealogy reports and tools are scattered between the Reports and Tools tabs, and within those, buried in non-intuitive locations. If you are going to utilize 23andMe for matching and genealogy, in addition to the above link, I recommend Kitty Cooper’s blogs about the new DNA Relatives here and on triangulation here. Print the articles, and use them as a guide while navigating the 23andMe site.

Note that some screens (the Tools, DNA Relatives, then DNA tab) on the site do not display/work correctly utilizing Internet Explorer, but do with Edge or other browsers.

The one genealogy feature unique to 23andMe is:

  • Triangulation at 23andMe allows you to select a specific match to compare your DNA against. Several pieces of information will be displayed, the last of which, scrolling to the bottom, is a list of your common relatives with the person you selected.

In the example below, I’ve selected to see the matches I match in common with known family member, Stacy Den (surnames have been obscured for privacy reasons.)  Please note that the Roberta V4 Estes kit is a second test that I took for comparison purposes when the new V4 version of 23andMe was released.  Just ignore that match, because, of course I match myself as a twin.

If an individual does not match both you and your selected match, they will not appear on this list.

In the “relatives in common” section, each person is listed with a “shared DNA” column. For a person to be shown on this “in common” list, you obviously do share DNA with these individuals and they also share with your match, but the “shared DNA” column goes one step further. This column indicates whether or not you and your match both share a common DNA segment with the “in common” person.

I know this is confusing, so I’ve created this chart to illustrate what will appear in the “Shared DNA” column of the individuals showing on the list of matches, above, shared between me and Stacy Den.

Clicking on “Share to see” sends Sarah a sharing request for her to allow you to see her segment matches.

Let’s look at an example with “yes” in the Shared DNA column.

Clicking on the “Yes” in the Shared DNA column of Debbie takes us to the chromosome browser which shows both your selected match, Stacy in my case, and Debbie, the person whose “yes” you clicked.

All three people, meaning me, Stacy and Debbie share a common DNA segment, shown below on chromosome 17.

What 23andMe does NOT say is that these people. Stacy and Debbie, also match each other, in addition to matching me, which means all three of us triangulate.

Because I manage Stacy’s kit at 23andMe, I can check to see if Debbie is on Stacy’s match list, and indeed, Debbie is on Stacy’s match list and Stacy does match both Debbie and me on chromosome 17 in exactly the same location shown above, proving unquestionably that the three of us all match each other and therefore triangulate on this segment. In our case, it’s easy to identify our common relative whose DNA all 3 of us share.

Genealogy – Autosomal Summary

While all 3 vendors offer matching, their interfaces and tools vary widely.

I would suggest that Ancestry is the least sophisticated and has worked hard to make their tools easy for the novice working with genetic genealogy. Their green leaf DNA+Tree Matching is their best feature, easy to use and important for the novice and experienced genealogist alike.  Now, if they just had that chromosome browser so we could see how we match those people.

Ancestry’s Circles, while a nice feature, encourage testers to believe that their DNA or relationship is confirmed by finding themselves in a Circle, which is not the case.

Circles can be formed as the result of misinformation in numerous trees. For example, if I were to inaccurately list Smith as the surname for one of my ancestor’s wives, I would find myself in a Circle for Barbara Smith, when in fact, there is absolutely no evidence whatsoever that her surname is Smith. Yet, people think that Barbara Smith is confirmed due to a Circle having been formed and finding themselves in Barbara Smith’s Circle. Copying incorrect trees equals the formation of incorrect Circles.

It’s also possible that I’m matching people on multiple lines and my DNA match to the people in any given Circle is through another common ancestor entirely.

A serious genealogist will test minimally at Ancestry and at Family Tree DNA, who provides a chromosome browser and other tools necessary to confirm relationships and shared DNA segments.

Family Tree DNA is more sophisticated, so consequently more complex to use.  They provide matching plus numerous other tools. The website and matching is certainly friendly for the novice, but to benefit fully, some experience or additional education is beneficial, not unlike traditional genealogy research itself. This is true not just for Family Tree DNA, but GedMatch and 23andMe who all three utilize chromosome browsers.

The user will want to understand what a chromosome browser is indicating about matching DNA segments, so some level of education makes life a lot easier. Fortunately, understanding chromosome browser matching is not complex. You can read an article about Match Groups and Triangulation here. I also have an entire series of Concepts articles, Family Tree DNA offers a webinar library, their Learning Center and other educational resources are available as well.

Family Tree DNA is the only vendor to provide Phased Family Matches, meaning that by connecting known relatives who have DNA tested to your tree, Family Tree DNA can then identify additional matches as maternal, paternal or both. This, in combination with pseudo-phasing are very powerful matching tools.

23andMe is the least friendly of the three companies, with several genetic genealogy unfriendly restrictions relative to matching, opt-ins, match limits and such. They have experienced problem after problem for years relative to genetic genealogy, which has always been a second-class citizen compared to their medical research, and not a priority.

23andMe has chosen to implement a business model where their customers must opt-in to share segment information with other individuals, either one by one or by opting into open sharing. Based on my match list, roughly 60% of my actual DNA matches have opted in to sharing.

Their customer base includes fewer serious genealogists and their customers often are not interested in genealogy at all.

Having said that, 23andMe is the only one of the three that provides actual triangulated matches for users on the New Experience and who have opted into sharing.

If I were entering the genetic genealogy testing space today, I would test my autosomal DNA at Ancestry and at Family Tree DNA, but I would probably not test at 23andMe. I would test both my Y DNA (if a male) and mitochondrial at Family Tree DNA.

Thank you to Kitty Cooper for assistance with parent/child matching and triangulation at 23andMe.

Genealogy Autosomal Vendor Feature Summary Chart

Family Tree DNA Ancestry 23andMe
Matching Yes Yes Yes – each person has to opt in for open sharing or authorize sharing individually, many don’t
Estimated Relationships Yes Yes Yes
Chromosome Browser Yes No – Large Issue Yes
Chromosome Browser Threshold Adjustment Yes No Chromosome Browser No
X Chromosome Matching Yes No Yes
Trees Yes Yes – subscription required so see matches’ trees No
Ability to upload Gedcom file Yes Yes No
Ability to search trees Yes Yes No
Subscription in addition to DNA test price No No for partial, Yes for full functionality, minimal subscription for $49 by calling Ancestry No
DNA + Ancestor in Tree Matches No Yes – Leaf Hints – subscription required – Best Feature No
Phased Parental Side Matching Yes – Best Feature No No
Parent Match Indicator Yes No Yes
Sort or Group by Parent Match Yes Yes Yes
In Common With Tool Yes Yes Yes
Not In Common With Tool Yes No No
Triangulated Matches No – pseudo with ICW, browser and matrix No Yes – Best Feature
Common Surnames Yes Yes – subscription required No
Ability to Link DNA Matches on Tree Yes No No
Matrix to show match grid between multiple matches Yes No No
Match Filter Tools Yes Minimal Some
Advanced Matching Tool Yes No No
Multiple Test Matching Tool Yes No multiple tests No multiple tests
Ethnicity Matching Yes No Yes
Projects Yes No No
Maximum # of Matches Restricted No No Yes – 2000 unless you are communicating with the individuals, then they are not removed from your match list
All Customers Participate Yes Yes, unless they don’t have a subscription No – between 50-60% opt-in
Accepts Transfers from Other Testing Companies Yes No No
Free Features with Transfer Matching, ICW, Matrix, Advanced Matching No transfers No transfers
Transfer Features Requiring Unlock $ Chromosome Browser, Ethnicity, Ancient Origins, Linked Relationships, Parentally Phased Matches No Transfers No transfers
Archives DNA for Later Testing Yes, 25 years No, no additional tests available No, no additional tests available
Additional Tool DNA Circles – subscription required
Additional Tool New Ancestor Discoveries – subscription required
Y DNA Not included in autosomal test but is additional test, detailed results including matching No Haplogroup only
Mitochondrial DNA Not included in autosomal test but is additional test, detailed results including matching No Haplogroup only
Advanced Testing Available Yes No No
Website Intuitive Yes, given their many tools Yes, very simple No
Data Base Size Large Largest Large but many do not test for genealogy, only test for health
Strengths Many tools, multiple types of tests, phased matching without parent DNA + Tree matching, size of data base Triangulation
Challenges Website episodically times out No chromosome browser or advanced tools Sharing is difficult to understand and many don’t, website is far from intuitive


Genealogy – Y and Mitochondrial DNA

Two indispensable tools for genetic genealogy that are often overlooked are Y and mitochondrial DNA.

The inheritance path for Y DNA is shown by the blue squares and the inheritance path for mitochondrial DNA is shown by the red circles for the male and female siblings shown at the bottom of the chart.

Y-DNA Testing for Males

Y DNA is inherited by males only, from their father. The Y chromosome makes males male. Women instead inherit an X chromosome from their father, which makes them female. Because the Y chromosome is not admixed with the DNA of the mother, the same Y chromosome has been passed down through time immemorial.

Given that the Y chromosome follows the typical surname path, Y DNA testing is very useful for confirming surname lineage to an expected direct paternal ancestor. In other words, an Estes male today should match, with perhaps a few mutations, to other descendants of Abraham Estes who was born in 1647 in Kent, England and immigrated to the colony of Virginia.

Furthermore, that same Y chromosome can look far back in time, thousands of years, to tell us where that English group of Estes men originated, before the advent of surnames and before the migration to England from continental Europe. I wrote about the Estes Y DNA here, so you can see an example of how Y DNA testing can be used.

Y DNA testing for matching and haplogroup identification, which indicates where in the world your ancestors were living within the past few hundred to few thousand years, is only available from Family Tree DNA. Testing can be purchased for either 37, 67 or 111 markers, with the higher marker numbers providing more granularity and specificity in matching.

Family Tree DNA provides three types of Y DNA tests.

  • STR (short tandem repeat) testing is the traditional Y DNA testing for males to match to each other in a genealogically relevant timeframe. These tests can be ordered in panels of 37, 67 or 111 markers and lower levels can be upgraded to higher levels at a later date. An accurate base haplogroup prediction is made from STR markers.
  • SNP (single nucleotide polymorphism) testing is a different type of testing that tests single locations for mutations in order to confirm and further refine haplogroups. Think of a haplogroup as a type of genetic clan, meaning that haplogroups are used to track migration of humans through time and geography, and are what is utilized to determine African, European, Asian or Native heritage in the direct paternal line. SNP tests are optional and can be ordered one at a time, in groups called panels for a particular haplogroup or a comprehensive research level Y DNA test called the Big Y can be ordered after STR testing.
  • The Big Y test is a research level test that scans the entire Y chromosome to determine the most refined haplogroup possible and to report any previously unknown mutations (SNPs) that may define further branches of the Y DNA tree. This is the technique used to expand the Y haplotree.

You can read more about haplogroups here and about the difference between STR markers and SNPs here, here and here.

Customers receive the following features and tools when they purchase a Y DNA test at Family Tree DNA or the Ancestry Services test at 23andMe. The 23andMe Y DNA information is included in their Ancestry Services test. The Family Tree DNA Y DNA information requires specific tests and is not included in the Family Finder test. You can click here to read about the difference in the technology between Y DNA testing at Family Tree DNA and at 23andMe. Ancestry is not included in this comparison because they provide no Y DNA related information.

Y DNA Vendor Feature Summary Chart

Family Tree DNA 23andMe
Varying levels of STR panel marker testing Yes, in panels of 37, 67 and 111 markers No
Test panel (STR) marker results Yes Not tested
Haplogroup assignment Yes – accurate estimate with STR panels, deeper testing available Yes –base haplogroup by scan – haplogroup designations are significantly out of date, no further testing available
SNP testing to further define haplogroup Yes – can purchase individual SNPs, by SNP panels or Big Y test No
Matching to other participants Yes No
Trees available for your matches Yes No
E-mail of matches provided Yes No
Calculator tool to estimate probability of generational distance between you and a match Yes No
Earliest known ancestor information Yes No
Projects Surname, haplogroup and geographic projects No
Ability to search Y matches Yes No Y matching
Ability to search matches within projects Yes No projects
Ability to search matches by partial surname Yes No
Haplotree and customer result location on tree Yes, detailed with every branch Yes, less detailed, subset
Terminal SNP used to determine haplogroup Yes Yes, small subset available
Haplogroup Map Migration map Heat map
Ancestral Origins – summary by ancestral location of others you match, by test level Yes No
Haplogroup Origins – match ancestral location summary by haplogroup, by test level Yes No
SNP map showing worldwide locations of any selected SNP Yes No
Matches map showing mapped locations of your matches most distant ancestor in the paternal line, by test panel Yes No
Big Y – full scan of Y chromosome for known and previously unknown mutations (SNPs) Yes No
Big Y matching Yes No
Big Y matching known SNPs Yes No
Big Y matching novel variants (unknown or yet unnamed SNPs) Yes No
Filter Big Y matches Yes No
Big Y results Yes No
Advanced matching for multiple test types Yes No
DNA is archived so additional tests or upgrades can be ordered at a later date Yes, 25 years No

Mitochondrial DNA Testing for Everyone

Mitochondrial DNA is contributed to both genders of children by mothers, but only the females pass it on. Like the Y chromosome, mitochondrial DNA is not admixed with the DNA of the other parent. Therefore, anyone can test for the mitochondrial DNA of their matrilineal line, meaning their mother’s mother’s mother’s lineage.

Matching can identify family lines as well as ancient lineage.

You receive the following features and tools when you purchase a mitochondrial DNA test from Family Tree DNA or the Ancestry Services test from 23andMe. The Family Tree DNA mitochondrial DNA information requires specific tests and is not included in the Family Finder test. The 23andMe mitochondrial information is provided with the Ancestry Services test. Ancestry is omitted from this comparison because they do not provide any mitochondrial information.

Mitochondrial DNA Vendor Feature Summary Chart

Family Tree DNA 23andMe
Varying levels of testing Yes, mtPlus and Full Sequence No
Test panel marker results Yes, in two formats, CRS and RSRS No
Rare mutations, missing and extra mutations, insertions and deletions reported Yes No
Haplogroup assignment Yes, most current version, Build 17 Yes, partial and out of date version
Matching to other participants Yes No
Trees of matches available to view Yes No
E-mail address provided to matches Yes No
Earliest known ancestor information Yes No
Projects Surname, haplogroup and geographic available No
Ability to search matches Yes No
Ability to search matches within project Yes No projects
Ability to search match by partial surname Yes No
Haplotree and customer location on tree No Yes
Mutations used to determine haplogroup provided Yes No
Haplogroup Map Migration map Heat map
Ancestral Origins – summary by ancestral location of others you match, by test level Yes No
Haplogroup Origins –match ancestral location summary by haplogroup Yes No
Matches map showing mapped locations of your matches most distant ancestor in the maternal line, by test level Yes No
Advanced matching for multiple test types Yes No
DNA is archived so additional tests or upgrades can be ordered at a later date Yes, 25 years No


Overall Genealogy Summary

Serious genealogists should test with at least two of the three major vendors, being Family Tree DNA and Ancestry, with 23andMe coming in as a distant third.

No genetic genealogy testing regimen is complete without Y and mitochondrial DNA for as many ancestral lines as you can find to test. You don’t know what you don’t know, and you’ll never know if you don’t test.

Unfortunately, many people, especially new testers, don’t know Y and mitochondrial DNA testing for genetic genealogy exists, or how it can help their genealogy research, which is extremely ironic since these were the first tests available, back in 2000.

You can read about finding Y and mitochondrial information for various family lines and ancestors and how to assemble a DNA Pedigree Chart here.

You can also take a look at my 52 Ancestors series, where I write about an ancestor every week. Each article includes some aspect of DNA testing and knowledge gained by a test or tests, DNA tool, or comparison. The DNA aspect of these articles focuses on how to use DNA as a tool to discover more about your ancestors.

Testing for Medical/Health or Traits

The DTC market also includes health and medical testing, although it’s not nearly as popular as genetic genealogy.

Health/medical testing is offered by 23andMe, who also offers autosomal DNA testing for genealogy.

Some people do want to know if they have genetic predispositions to medical conditions, and some do not. Some want to know if they have certain traits that aren’t genealogically relevant, but might be interesting – such as whether they carry the Warrior gene or if they have an alcohol flush reaction.

23andMe was the first company to dip their toes into the water of Direct to Consumer medical information, although they called it “health,” not medicine, at that time. Regardless of the terminology, information regarding Parkinson’s and Alzheimer’s, for example, were provided for customers. 23andMe attempted to take the raw data and provide the consumer with something approaching a middle of the road analysis, because sometimes the actual studies provide conflicting information that might not be readily understood by consumers.

The FDA took issue with 23andMe back in November of 2013 when they ordered 23andMe to discontinue the “health” aspect of their testing after 23andMe ignored several deadlines. In October 2015, 23andMe obtained permission to provide customers with some information, such as carrier status, for 36 genetic disorders.

Since that time, 23andMe has divided their product into two separate tests, with two separate prices. The genealogy only test called Ancestry Service can be purchased separately for $99, or the combined Health + Ancestry Service for $199.

If you are interested in seeing what the Health + Ancestry test provides, you can click here to view additional information.

However, there is a much easier and less expensive solution.

If you have taken the autosomal test from 23andMe, Ancestry or Family Tree DNA, you can download your raw data file from the vendor and upload to Promethease to obtain a much more in-depth report than is provided by 23andMe, and much less expensively – just $5.

I reviewed the Promethease service here. I found the Promethease reports to be very informative and I like the fact that they provide information, both positive and negative for each SNP (DNA location) reported. Promethease avoids FDA problems by not providing any interpretation or analysis, simply the data and references extracted from SNPedia for you to review.

I would be remiss if I didn’t mention that you should be sure you really want to know before you delve into medical testing. Some mutations are simply indications that you could develop a condition that you will never develop or that is not serious. Other mutations are not so benign. Promethease provides this candid page before you upload your data.

Different files from different vendors provide different results at Promethease, because those vendors test different SNP locations in your DNA. At the Promethease webpage, you can view examples.

Traits

Traits fall someplace between genealogy and health. When you take the Health + Ancestry test at 23andMe, you do receive information about various traits, as follows:

Of course, you’ll probably already know if you have several of these traits by just taking a look in the mirror, or in the case of male back hair, by asking your wife.

At Family Tree DNA, existing customers can order tests for Factoids (by clicking on the upgrade button), noted as curiosity tests for gene variants.

Family Tree DNA provides what I feel is a great summary and explanation of what the Factoids are testing on their order page:

“Factoids” are based on studies – some of which may be controversial – and results are not intended to diagnose disease or medical conditions, and do not serve the purpose of medical advice. They are offered exclusively for curiosity purposes, i.e. to see how your result compared with what the scientific papers say. Other genetic and environmental variables may also impact these same physiological characteristics. They are merely a conversational piece, or a “cocktail party” test, as we like to call it.”

Test Price Description
Alcohol Flush Reaction $19 A condition in which the body cannot break down ingested alcohol completely. Flushing, after consuming one or two alcoholic beverages, includes a range of symptoms: nausea, headaches, light-headedness, an increased pulse, occasional extreme drowsiness, and occasional skin swelling and itchiness. These unpleasant side effects often prevent further drinking that may lead to further inebriation, but the symptoms can lead to mistaken assumption that the people affected are more easily inebriated than others.
Avoidance of Errors $29 We are often angry at ourselves because we are unable to learn from certain experiences. Numerous times we have made the wrong decision and its consequences were unfavorable. But the cause does not lie only in our thinking. A mutation in a specific gene can also be responsible, because it can cause a smaller number of dopamine receptors. They are responsible for remembering our wrong choices, which in turn enables us to make better decisions when we encounter a similar situation.
Back Pain $39 Lumbar disc disease is the drying out of the spongy interior matrix of an intervertebral disc in the spine. Many physicians and patients use the term lumbar disc disease to encompass several different causes of back pain or sciatica. A study of Asian patients with lumbar disc disease showed that a mutation in the CILP gene increases the risk of back pain.
Bitter Taste Perception $29 There are several genes that are responsible for bitter taste perception – we test 3 of them. Different variations of this gene affect ability to detect bitter compounds. About 25% of people lack ability to detect these compounds due to gene mutations. Are you like them? Maybe you don’t like broccoli, because it tastes too bitter?
Caffeine Metabolism $19 According to the results of a case-control study reported in the March 8, 2006 issue of JAMA, coffee is the most widely consumed stimulant in the world, and caffeine consumption has been associated with increased risk for non-fatal myocardial infarction. Caffeine is primarily metabolized by the cytochrome P450 1A2 in the liver, accounting for 95% of metabolism. Carriers of the gene variant *1F allele are slow caffeine metabolizers, whereas individuals homozygous for the *1A/*1A genotype are rapid caffeine metabolizers.
Earwax Type $19 Whether your earwax is wet or dry is determined by a mutation in a single gene, which scientists have discovered. Wet earwax is believed to have uses in insect trapping, self-cleaning and prevention of dryness in the external auditory canal of the ear. It also produces an odor and causes sweating, which may play a role as a pheromone.
Freckling $19 Freckles can be found on anyone no matter what the background. However, having freckles is genetic and is related to the presence of the dominant melanocortin-1 receptor MC1R gene variant.
Longevity $49 Researchers at Harvard Medical School and UC Davis have discovered a few genes that extend lifespan, suggesting that the whole family of SIR2 genes is involved in controlling lifespan. The findings were reported July 28, 2005 in the advance online edition of Science.
Male Pattern Baldness $19 Researchers at McGill University, King’s College London and GlaxoSmithKline Inc. have identified two genetic variants in Caucasians that together produce an astounding sevenfold increase of the risk of male pattern baldness. Their results were published in the October 12, 2008 issue of the Journal of Nature Genetics.
Monoamine Oxidase A (Warrior Gene) $49.50 The Warrior Gene is a variant of the gene MAO-A on the X chromosome. Recent studies have linked the Warrior Gene to increased risk-taking and aggressive behavior. Whether in sports, business, or other activities, scientists found that individuals with the Warrior Gene variant were more likely to be combative than those with the normal MAO-A gene. However, human behavior is complex and influenced by many factors, including genetics and our environment. Individuals with the Warrior Gene are not necessarily more aggressive, but according to scientific studies, are more likely to be aggressive than those without the Warrior Gene variant. This test is available for both men and women, however, there is limited research about the Warrior Gene variant amongst females. Additional details about the Warrior Gene genetic variant of MAO-A can be found in Sabol et al, 1998.
Muscle Performance $29 A team of researchers, led by scientists at Dartmouth Medical School and Dartmouth College, have identified and tested a gene that dramatically alters both muscle metabolism and performance. The researchers say that this finding could someday lead to treatment of muscle diseases, including helping the elderly who suffer from muscle deterioration and improving muscle performance in endurance athletes.
Nicotine Dependence $19 In 2008, University of Virginia Health System researchers have identified a gene associated with nicotine dependence in both Europeans and African Americans.

Many people are interested in the Warrior Gene, which I wrote about here.

At Promethease, traits are simply included with the rest of the conditions known to be associated with certain SNPs, such as baldness, for example, but I haven’t done a comparison to see which traits are included.


Additional Vendor Information to Consider

Before making your final decision about which test or tests to purchase, there are a few additional factors you may want to consider.

As mentioned before, Ancestry requires a subscription in addition to the cost of the DNA test for the DNA test to be fully functional.

One of the biggest issues, in my opinion, is that both 23andMe and Ancestry sell customer’s anonymized DNA information to unknown others. Every customer authorizes the sale of their information when they purchase or activate a kit – even though very few people actually take the time to read the Terms and Conditions, Privacy statements and Security documents, including any and all links. This means most people don’t realize they are authorizing the sale of their DNA.

At both 23andMe and Ancestry, you can ALSO opt in for additional non-anonymized research or sale of your DNA, which you can later opt out of. However, you cannot opt out of the lower level sale of your anonymized DNA without removing your results from the data base and asking for your sample to be destroyed. They do tell you this, but it’s very buried in the fine print at both companies. You can read more here.

Family Tree DNA does not sell your DNA or information.

All vendors can change their terms and conditions at any time. Consumers should always thoroughly read the terms and conditions including anything having to do with privacy for any product they purchase, but especially as it relates to DNA testing.

Family Tree DNA archives your DNA for later testing, which has proven extremely beneficial when a family member has passed away and a new test is subsequently introduced or the family wants to upgrade a current test.  Had my mother’s DNA not been archived at Family Tree DNA, I would not have Family Finder results for her today – something I thank Mother and Family Tree DNA for every single day.

Family Tree DNA also accepts transfer files from 23andMe, Ancestry and very shortly, MyHeritage – although some versions work better than others. For details on which companies accept which file versions, from which vendors, and why, please read Autosomal DNA Transfers – Which Companies Accept Which Tests?

If you tested on a compatible version of the 23andMe Test (V3 between December 2010 and November 2013) or the Ancestry V1 (before May 2016) you may want to transfer your raw data file to Family Tree DNA for free and pay only $19 for full functionality, as opposed to taking the Family Finder test. Family Tree DNA does accept later versions of files from 23andMe and Ancestry, but you will receive more matches if you test on the same chip platform that Family Tree DNA utilizes instead of doing a transfer.

Additional Vendor Considerations Summary Chart

Family Tree DNA Ancestry 23andMe
Subscription required in addition to cost of DNA test No Yes for full functionality, partial functionality is included without subscription, minimum subscription is $49 by calling Ancestry No
Customer Support Good and available Available, nice but often not knowledgeable about DNA Poor
Sells customer DNA information No Yes Yes
DNA raw data file available to download Yes Yes Yes
DNA matches file available to download including match info and chromosome match locations Yes No Yes
Customers genealogically focused Yes Yes Many No
Accepts DNA raw data transfer files from other companies Yes, most, see article for specifics No No
DNA archived for later testing Yes, 25 years No No
Beneficiary provision available Yes No No


Which Test is Best For You?

I hope you now know the answer as to which DNA test is best for you – or maybe it’s multiple tests for you and other family members too!

DNA testing holds so much promise for genealogy. I hesitate to call DNA testing a miracle tool, but it often is when there are no records. DNA testing works best in conjunction with traditional genealogical research.

There are a lot of tests and options.  The more tests you take, the more people you match. Some people test at multiple vendors or upload their DNA to third party sites like GedMatch, but most don’t. In order to make sure you reach those matches, which may be the match you desperately need, you’ll have to test at the vendor where they tested. Otherwise, they are lost to you. That means, of course, that eventually, if you’re a serious genealogist, you’ll be testing at all 3 vendors.  Don’t forget about Y and mitochondrial tests at Family Tree DNA.

Recruit family members to test and reach out to your matches.  The more you share and learn – the more is revealed about your ancestors. You are, after all, the unique individual that resulted from the combination of all of them!

Update: Vendor prices updated June 22, 2017.

______________________________________________________________

Disclosure

I receive a small contribution when you click on some of the links to vendors in my articles. This does NOT increase the price you pay but helps me to keep the lights on and this informational blog free for everyone. Please click on the links in the articles or to the vendors below if you are purchasing products or DNA testing.

Thank you so much.

DNA Purchases and Free Transfers

Genealogy Services

Genealogy Research

2016 Genetic Genealogy Retrospective

In past years, I’ve written a “best of” article about genetic genealogy happenings throughout the year. For several years, the genetic genealogy industry was relatively new, and there were lots of new tools being announced by the testing vendors and others as well.

This year is a bit different. I’ve noticed a leveling off – there have been very few announcements of new tools by vendors, with only a few exceptions.  I think genetic genealogy is maturing and has perhaps begun a new chapter.  Let’s take a look.

Vendors

Family Tree DNA

Family Tree DNA leads the pack this year with their new Phased Family Matches which utilizes close relatives, up to third cousins, to assign your matches to either maternal or paternal buckets, or both if the individual is related on both sides of your tree.

Both Buckets

They are the first and remain the only vendor to offer this kind of feature.

Phased FF2

Phased Family Matching is extremely useful in terms of identifying which side of your family tree your matches are from. This tool, in addition to Family Tree DNA’s nine other autosomal tools helps identify common ancestors by showing you who is related to whom.

Family Tree DNA has also added other features such as a revamped tree with the ability to connect DNA results to family members.  DNA results connected to the tree is the foundation for the new Phased Family Matching.

The new Ancient Origins feature, released in November, was developed collaboratively with Dr. Michael Hammer at the University of Arizona Hammer Lab.

Ancient European Origins is based on the full genome sequencing work now being performed in the academic realm on ancient remains. These European results fall into three primary groups of categories based on age and culture.  Customer’s DNA is compared to the ancient remains to determine how much of the customer’s European DNA came from which group.  This exciting new feature allows us to understand more about our ancestors, long before the advent of surnames and paper or parchment records. Ancient DNA is redefining what we know, or thought we knew, about population migration.

2016-ancient-origins

You can view Dr. Hammer’s presentation given at the Family Tree DNA Conference in conjunction with the announcement of the new Ancient Origins feature here.

Family Tree DNA maintains its leadership position among the three primary vendors relative to Y DNA testing, mtDNA testing and autosomal tools.

Ancestry

In May of 2016, Ancestry changed the chip utilized by their tests, removing about 300,000 of their previous 682,000 SNPs and replacing them with medically optimized SNPs. The rather immediate effect was that due to the chip incompatibility, Ancestry V2 test files created on the new chip cannot be uploaded to Family Tree DNA, but they can be uploaded to GedMatch.  Family Tree DNA is working on a resolution to this problem.

I tested on the new Ancestry V2 chip, and while there is a difference in how much matching DNA I share with my matches as compared to the V1 chip, it’s not as pronounced as I expected. There is no need for people who tested on the earlier chip to retest.

Unfortunately, Ancestry has remained steadfast in their refusal to implement a chromosome browser, instead focusing on sales by advertising the ethnicity “self-discovery” aspect of DNA testing.

Ancestry does have the largest autosomal data base but many people tested only for ethnicity, don’t have trees or have private trees.  In my case, about half of my matches fall into that category.

Ancestry maintains its leadership position relative to DNA tree matching, known as a Shared Ancestor Hint, identifying common ancestors in the trees of people whose DNA matches.

ancestry-common-ancestors

23andMe

23andMe struggled for most of the year to meet a November 2015 deadline, which is now more than a year past, to transition its customers to the 23andMe “New Experience” which includes a new customer interface. I was finally transitioned in September 2016, and the experience has been very frustrating and extremely disappointing, and that’s putting it mildly. Some customers, specifically international customers, are still not transitioned, nor is it clear if or when they will be.

I tested on the 23andMe older V3 chip as well as their newer V4 chip. After my transition to the New Experience, I compared the results of the two tests. The new security rules incorporated into the New Experience meant that I was only able to view about 25% of my matches (400 of 1651(V3) matches or 1700 (V4) matches). 23andMe has, in essence, relegated themselves into the non-player status for genetic genealogy, except perhaps for adoptees who need to swim in every pool – but only then as a last place candidate. And those adoptees had better pray that if they have a close match, that match falls into the 25% of their matches that are useful.

In December, 23andMe began providing segment information for ethnicity segments, except the parental phasing portion does not function accurately, calling into question the overall accuracy of the 23andme ethnicity information. Ironically, up until now, while 23andMe slipped in every other area, they had been viewed at the best, meaning most accurate, in terms of ethnicity estimates.

New Kids on the Block

MyHeritage

In May of 2016, MyHeritage began encouraging people who have tested at other vendors to upload their results. I was initially very hesitant, because aside from GedMatch that has a plethora of genetic genealogy tools, I have seen no benefit to the participant to upload their DNA anyplace, other than Family Tree DNA (available for V3 23andMe and V1 Ancestry only).

Any serious genealogist is going to test at least at Family Tree DNA and Ancestry, both, and upload to GedMatch. My Heritage was “just another upload site” with no tools, not even matching initially.

However, in September, MyHeritage implemented matching, although they have had a series of what I hope are “startup issues,” with numerous invalid matches, apparently resulting from their usage of imputation.

Imputation is when a vendor infers what they think your DNA will look like in regions where other vendors test, and your vendor doesn’t. The best example would be the 300,000 or so Ancestry locations that are unique to the Ancestry V2 chip. Imputation would result in a vendor “inferring” or imputing your results for these 300,000 locations based on…well, we don’t exactly know based on what. But we do know it cannot be accurate.  It’s not your DNA.

In the midst of this, in October, 23andMe announced on their forum that they had severed a previous business relationship with MyHeritage where 23andMe allowed customers to link to MyHeritage trees in lieu of having customer trees directly on the 23andMe site.  This approach had been problematic because customers are only allowed 250 individuals in their tree for free, and anything above that requires a MyHeritage subscription.  Currently 23andMe has no tree capability.

It appears that MyHeritage refined their DNA matching routines at least somewhat, because many of the bogus matches were gone in November when they announced that their beta was complete and that they were going to sell their own autosomal DNA tests. However, matching issues have not disappeared or been entirely resolved.

While Family Tree DNA’s lab will be processing the MyHeritage autosomal tests, the results will NOT be automatically placed in the Family Tree DNA data base.

MyHeritage will be doing their own matching within their own database. There are no comparison tools, tree matching or ethnicity estimates today, but My Heritage says they will develop a chromosome browser and ethnicity estimates. However, it is NOT clear whether these will be available for free to individuals who have transferred their results into MyHeritage or if they will only be available to people who tested through MyHeritage.

2016-myheritage-matches

For the record, I have 28 matches today at MyHeritage.

2016-myheritage-second-match

I found that my second closest match at MyHeritage is also at Ancestry.

2016-myheritage-at-ancestry

At MyHeritage, they report that I match this individual on a total of 64.1 cM, across 7 segments, with the largest segment being 14.9 cM.

Ancestry reports this same match at 8.3 cM total across 1 segment, which of course means that the longest segment is also 8.3 cM.

Ancestry estimates the relationship as 5th to 8th cousin, and MyHeritage estimates it as 2nd to 4th.

While I think Ancestry’s Timber strips out too much DNA, there is clearly a HUGE difference in the reported results and the majority of this issue likely lies with the MyHeritage DNA imputation and matching routines.

I uploaded my Family Tree DNA autosomal file to MyHeritage, so MyHeritage is imputing at least 300,000 SNPs for me – almost half of the SNPs needed to match to Ancestry files.  They are probably imputing that many for my match’s file too, so that we have an equal number of SNPs for comparison.  Combined, this would mean that my match and I are comparing 382,000 actual SNPs that we both tested, and roughly 600,000 SNPs that we did not test and were imputed.  No wonder the MyHeritage numbers are so “off.”

My Heritage has a long way to go before they are a real player in this arena. However, My Heritage has potential, as they have a large subscriber base in Europe, where we desperately need additional testers – so I’m hopeful that they can attract additional genealogists that are willing to test from areas that are under-represented to date.

My Heritage got off to a bit of a rocky start by requiring users to relinquish the rights to their DNA, but then changed their terms in May, according to Judy Russell’s blog.

All vendors can change their terms at any time, in a positive or negative direction, so I would strongly encourage all individuals considering utilizing any testing company or upload service to closely read all the legal language, including Terms and Conditions and any links found in the Terms and Conditions.

Please note that MyHeritage is a subscription genealogy site, similar to Ancestry.  MyHeritage also owns Geni.com.  One site, MyHeritage, allows individual trees and the other, Geni, embraces the “one world tree” model.  For a comparison of the two, check out Judy Russell’s articles, here and here.  Geni has also embraced DNA by allowing uploads from Family Tree DNA of Y, mitochondrial and autosomal, but the benefits and possible benefits are much less clear.

If the MyHeritage story sounds like a confusing soap opera, it is.  Let’s hope that 2017 brings both clarity and improvements.

Living DNA

Living DNA is a company out of the British Isles with a new test that purports to provide you with a breakdown of your ethnicity and the locations of your ancestral lines within 21 regions in the British Isles.  Truthfully, I’m very skeptical, but open minded.

They have had my kit for several weeks now, and testing has yet to begin.  I’ll write about the results when I receive them.  So far, I don’t know of anyone who has received results.

2016-living-dna

Genos

I debated whether or not I should include Genos, because they are not a test for genealogy and are medically focused. However, I am including them because they have launched a new model for genetic testing wherein your full exome is tested, you receive the results along with information on the SNPs where mutations are found. You can then choose to be involved with research programs in the future, if you wish, or not.

That’s a vastly different model that the current approach taken by 23andMe and Ancestry where you relinquish your rights to the sale of your DNA when you sign up to test.  I like this new approach with complete transparency, allowing the customer to decide the fate of their DNA. I wrote about the Genos test and the results, here.

Third Parties

Individuals sometimes create and introduce new tools to assist genealogists with genetic genealogy and analysis.

I have covered these extensively over the years.

GedMatch, WikiTree, DNAGedcom.com and Kitty Cooper’s tools remain my favorites.

I love Kitty’s Ancestor Chromosome Mapper which maps the segments identified with your ancestors on your chromosomes. I just love seeing which ancestors’ DNA I carry on which chromosomes.  Somehow, this makes me feel closer to them.  They’re not really gone, because they still exist in me and other descendants as well.

Roberta's ancestor map2

In order to use Kitty’s tool, you’ll have to have mapped at least some of your autosomal DNA to ancestors.

The Autosomal DNA Segment Analyzer written by Don Worth and available at DNAGedcom is still one of my favorite tools for quick, visual and easy to understand segment matching results.

ADSA Crumley cluster

GedMatch has offered a triangulation tool for some time now, but recently introduced a new Triangulation Groups tool.

2016-gedmatch-triangulation-groups

I have not utilized this tool extensively but it looks very interesting. Unfortunately, there is no explanation or help function available for what this tool is displaying or how to understand and interpret the results. Hopefully, that will be added soon, as I think it would be possible to misinterpret the output without educational material.

GedMatch also introduced their “Evil Twin” tool, which made me laugh when I saw the name.  Using parental phasing, you can phase your DNA to your parent or parents at GedMatch, creating kits that only have your mother’s half of your DNA, or your father’s half.  These phased kits allow you to see your matches that come from that parent, only.  However, the “Evil Twin” feature creates a kit made up of the DNA that you DIDN’T receive from that parent – so in essence it’s your other half, your evil twin – you know, that person who got blamed for everything you “didn’t do.”  In any case, this allows you to see the matches to the other half of your parent’s DNA that do not show up as your matches.

Truthfully, the Evil Twin tool is interesting, but since you have to have that parent’s DNA to phase against in the first place, it’s just as easy to look at your parent’s matches – at least for me.

Others offer unique tools that are a bit different.

DNAadoption.com offers tools, search and research techniques, especially for adoptees and those looking to identify a parent or grandparents, but perhaps even more important, they offer genetic genealogy classes including basic and introductory.

I send all adoptees in their direction, but I encourage everyone to utilize their classes.

WikiTree has continued to develop and enhance their DNA offerings.  While WikiTree is not a testing service nor do they offer autosomal data tools like Family Tree DNA and GedMatch, they do allow individuals to discover whether anyone in their ancestral line has tested their Y, mitochondrial or autosomal DNA.

Specifically, you can identify the haplogroup of any male or female ancestor if another individual from that direct lineage has tested and provided that information for that ancestor on WikiTree.  While I am generally not a fan of the “one world tree” types of implementations, I am a fan of WikiTree because of their far-sighted DNA comparisons, the fact that they actively engage their customers, they listen and they expend a significant amount of effort making sure they “get it right,” relative to DNA. Check out WikiTree’s article,  Putting DNA Results Into Action, for how to utilize their DNA Features.

2016-wikitree-peter-roberts

Thanks particularly to Chris Whitten at WikiTree and Peter Roberts for their tireless efforts.  WikiTree is the only vendor to offer the ability to discover the Y and mtDNA haplogroups of ancestors by searching trees.

All of the people creating the tools mentioned above, to the best of my knowledge, are primarily volunteers, although GedMatch does charge a small subscription service for their high end tools, including the triangulation and evil twin tools.  DNAGedcom does as well.  Wikitree generates some revenue for the site through ads on pages of non-members. DNAAdoption charges nominally for classes but they do have need-based scholarships. Kitty has a donation link on her website and all of these folks would gladly accept donations, I’m sure.  Websites and everything that goes along with them aren’t free.  Donations are a nice way to say thank you.

What Defined 2016

I have noticed two trends in the genetic genealogy industry in 2016, and they are intertwined – ethnicity and education.

First, there is an avalanche of new testers, many of whom are not genetic genealogists.

Why would one test if they weren’t a genetic genealogist?

The answer is simple…

Ethnicity.

Or more specifically, the targeted marketing of ethnicity.  Ethnicity testing looks like an easy, quick answer to a basic human question, and it sells kits.

Ethnicity

“Kim just wanted to know who she was.”

I have to tell you, these commercials absolutely make me CRINGE.

Yes, they do bring additional testers into the community, BUT carrying significantly misset expectations. If you’re wondering about WHY I would suggest that ethnicity results really cannot tell you “who you are,” check out this article about ethnicity estimates.

And yes, that’s what they are, estimates – very interesting estimates, but estimates just the same.  Estimates that provide important and valid hints and clues, but not definitive answers.

ESTIMATES.

Nothing more.

Estimates based on proprietary vendor algorithms that tend to be fairly accurate at the continental level, and not so much within continents – in particular, not terribly accurate within Europe. Not all of this can be laid a the vendor’s feet.  For example, DNA testing is illegal in France.  Not to mention, genetic genealogy and population genetics is still a new and emerging field.  We’re on the frontier, folks.

The ethnicity results one receives from the 3 major vendors (Ancestry, Family Tree DNA and 23andMe) and the various tools at GedMatch don’t and won’t agree – because they use different reference populations, different matching routines, etc.  Not to mention people and populations move around and have moved around.

The next thing that happens, after these people receive their results, is that we find them on the Facebook groups asking questions like, “Why doesn’t my full blooded Native American grandmother show up?” and “I just got my Ancestry results back. What do I do?”  They mean that question quite literally.

I’m not making fun of these people, or light of the situation. Their level of frustration and confusion is evident. I feel sorry for them…but the genetic genealogy community and the rest of us are left with applying ointment and Band-Aids.  Truthfully, we’re out-numbered.

Because of the expectations, people who test today don’t realize that genetic testing is a TOOL, it’s not an ANSWER. It’s only part of the story. Oh, and did I mention, ethnicity is only an ESTIMATE!!!

But an estimate isn’t what these folks are expecting. They are expecting “the answer,” their own personal answer, which is very, very unfortunate, because eventually they are either unhappy or blissfully unaware.

Many become unhappy because they perceive the results to be in error without understanding anything about the technology or what information can reasonably be delivered, or they swallow “the answer” lock stock and barrel, again, without understanding anything about the technology.

Ethnicity is fun, it isn’t “bad” but the results need to be evaluated in context with other information, such as Y and mitochondrial haplogroups, genealogical records and ethnicity results from the other major testing companies.

Fortunately, we can recruit some of the ethnicity testers to become genealogists, but that requires education and encouragement. Let’s hope that those DNA ethnicity results light the fires of curiosity and that we can fan those flames!

Education

The genetic genealogy community desperately needs educational resources, in part as a result of the avalanche of new testers – approximately 1 million a year, and that estimate may be low. Thankfully, we do have several education options – but we can always use more.  Unfortunately, the learning curve is rather steep.

My blog offers just shy of 800 articles, all key word searchable, but one has to first find the blog and want to search and learn, as opposed to being handed “the answer.”

Of course, the “Help” link is always a good place to start as are these articles, DNA Testing for Genealogy 101 and Autosomal DNA Testing 101.  These two articles should be “must reads” for everyone who has DNA tested, or wants to, for that matter.  Tips and Tricks for Contact Success is another article that is immensely helpful to people just beginning to reach out.

In order to address the need for basic understanding of autosomal DNA principles, tools and how to utilize them, I began the “Concepts” series in February 2016. To date I offer the following 15 articles about genetic genealogy concepts. To be clear, DNA testing is only the genetic part of genetic genealogy, the genealogical research part being the second half of the equation.

My blog isn’t the only resource of course.

Kelly Wheaton provides 19 free lessons in her Beginners Guide to Genetic Genealogy.

Other blogs I highly recommend include:

Excellent books in print that should be in every genetic genealogist’s library:

And of course, the ISOGG Wiki.

Online Conference Resources

The good news and bad news is that I’m constantly seeing a genetic genealogy seminar, webinar or symposium hosted by a group someplace that is online, and often free. When I see names I recognize as being reputable, I am delighted that there is so much available to people who want to learn.

And for the record, I think that includes everyone. Even professional genetic genealogists watch these sessions, because you just never know what wonderful tidbit you’re going to pick up.  Learning, in this fast moving field, is an everyday event.

The bad news is that I can’t keep track of everything available, so I don’t mean to slight any resource.  Please feel free to post additional resources in the comments.

You would be hard pressed to find any genealogy conference, anyplace, today that didn’t include at least a few sessions about genetic genealogy. However, genetic genealogy has come of age and has its own dedicated conferences.

Dr. Maurice Gleeson, the gentleman who coordinates Genetic Genealogy Ireland films the sessions at the conference and then makes them available, for free, on YouTube. This link provides a list of the various sessions from 2016 and past years as well. Well worth your time!  A big thank you to Maurice!!!

The 19 video series from the I4GG Conference this fall is now available for $99. This series is an excellent opportunity for genetic genealogy education.

As always, I encourage project administrators to attend the Family Tree DNA International Conference on Genetic Genealogy. The sessions are not filmed, but the slides are made available after the conference, courtesy of the presenters and Family Tree DNA. You can view the presentations from 2015 and 2016 at this link.

Jennifer Zinck attended the conference and published her excellent notes here and here, if you want to read what she had to say about the sessions she attended. Thankfully, she can type much faster and more accurately than I can! Thank you so much Jennifer.

If you’d like to read about the unique lifetime achievement awards presented at the conference this year to Bennett Greenspan and Max Blankfeld, the founders of Family Tree DNA, click here. They were quite surprised!  This article also documents the history of genetic genealogy from the beginning – a walk down memory lane.

The 13th annual Family Tree DNA conference which will be held November 10-12, 2017 at the Hyatt Regency North Houston. Registration is always limited due to facility size, so mark your calendars now, watch for the announcement and be sure to register in time.

Summary

2016 has been an extremely busy year. I think my blog has had more views, more comments and by far, more questions, than ever before.

I’ve noticed that the membership in the ISOGG Facebook group, dedicated to genetic genealogy, has increased by about 50% in the past year, from roughly 8,000 members to just under 12,000. Other social media groups have been formed as well, some focused on specific aspects of genetic genealogy, such as specific surnames, adoption search, Native American or African American heritage and research.

The genetic aspect of genealogy has become “normal” today, with most genealogists not only accepting DNA testing, but embracing the various tools and what they can do for us in terms of understanding our ancestors, tracking them, and verifying that they are indeed who we think they are.

I may have to explain the three basic kinds of DNA testing and how they are used today, but no longer do I have to explain THAT DNA testing for genealogy exists and that it’s legitimate.

I hope that each of us can become an ambassador for genetic genealogy, encouraging others to test, with appropriate expectations, and helping to educate, enlighten and encourage. After all, the more people who test and are excited about the results, the better for everyone else.

Genetic genealogy is and can only be a collaborative team sport.

Here’s wishing you many new cousins and discoveries in 2017.

Happy New Year!!!

______________________________________________________________

Disclosure

I receive a small contribution when you click on some of the links to vendors in my articles. This does NOT increase the price you pay but helps me to keep the lights on and this informational blog free for everyone. Please click on the links in the articles or to the vendors below if you are purchasing products or DNA testing.

Thank you so much.

DNA Purchases and Free Transfers

Genealogy Services

Genealogy Research

Concepts – Parental Phasing

I recently used a technique called parental phasing as part of the proof that one Curtis Lore found in Pennsylvania was the same person as Curtis Benjamin Lore, found later in Indiana.  Given that I’ve already used parental phasing as part of a proof argument, I’d like to break it down further and explain the concepts behind parental phasing, what it is, why it is so important, and why it works so well.

For those of you who don’t have at least one parent available to test, I’m truly sorry, and not just because of the lost DNA opportunity. But please do read this article, because you may be able to substitute other family members and derive at least some of the benefits, although clearly not all.

What is Parental Phasing?

The fundamental concept of parental phasing is that the only way you can obtain your DNA is through one or the other of your parents, so every one of your matches should match you plus one of your parents. Right?

Should, yes, but that’s not exactly how autosomal matching works in real life.

You can match someone in one of two ways:

  1. Because you received the matching segment from one of your two parents, and they received that same segment from one of their two parents, a circumstance that is called identical by descent or IBD.
  2. Because your match’s DNA is zigzagging back and forth between the DNA you inherited from both of your parents, or your DNA is zigzagging back and forth between their parents, either of which is called identical by chance or IBC.

I wrote about his in the article titled, Concepts – Identical by…Descent, State, Population and Chance.

Here’s the matching “Identical By” cheat sheet since you may find it helpful in this article as well.

Identical by Chart

How Does Parental Phasing Work?

Parental phasing works by comparing your DNA against your matches DNA, then comparing your matches DNA against your parents DNA, and telling you which, if either, or both, parents they match in addition to you. Oh yes, and there’s one more tiny tidbit – they must match you and your parent(s) on the same segment(s).

As bizarre as it sounds, sometimes your match will match you on one segment, and match your parents on an entirely different segment.  While this was not an expected finding, it does happen, and frequently enough that it was found in every parental phasing test run – so it’s not an anomaly or something so rare you won’t see it.

Therefore, parental phasing may be a two part process, where:

  • Step 1 is determining whether or not your match matches either or both of your parents.
  • Step 2 is determining if your match matches you and your parent on the same segment(s), or at least part of the same segment? If not, then it’s not a phased IBD match – even though they do match you and your parent.

Conceptually, each of your matches will fall nice and cleanly into one, or both, of your parent’s buckets. Let’s look at a couple of examples.  For each of the people who match you, they will also match your parents on the same segment as follows:

Match Matches Your Mother Matches Your Father Matches Neither Parent Comment
Susie Yes No From Mom’s side, IBD
John No Yes From Dad’s side, IBD
Bob Yes Yes Matches both parents lines, IBD and may be IBP
Roxanne No No Yes Identical by Chance, IBC

Please Note: Your match list will change if you change your matching threshold, and so will your phased matches to your parents.  In other words, while someone might not match you and a parent both on the same segment at 15cM, you might well match on a common segment at a 10, 7 or 5cM threshold.

So in essence, parental phasing puts your matches into very useful buckets for you and helps eliminate false positives – or matches that appear real but aren’t.

How Can Someone Match Me But Not My Parents?

That’s a really good question. Sometimes you match someone because you received common DNA from an ancestor, through your parents, which means you’re identical by descent (IBD), a legitimate genealogical match.  But other times, you match someone just by chance because their DNA is matching pieces of both of your parents’ DNA, and not because you actually share a common ancestor.

Let’s take a look.

This first graphic shows you with an identical by descent match to your match’s father’s DNA. Your match’s father shares a common relative with (at least) one of your mother’s lines.

Phase IBD

In the most basic terms, an identical by descend (IBD) match looks like this, where your match is matching you on one of your parent’s strands of DNA. Both matching strands are colored green in this example.

Of course, your DNA does not come labeled as to which side is mother’s and which side is father’s. You can read more about that here. If it did, we wouldn’t even need to be having this discussion at all – because that’s what parental phasing does.  It tells you which side of your family your DNA match came from.

You can see in the above example that you and your match both share an actual strand of DNA. You inherited yours from your Mom and your match inherited theirs from their Dad, which means your Mom and their Dad share a common ancestor.  However, to be able to discern that fact, that your Mom and your match’s Dad share a common ancestor, you need to be able to phase the DNA of both you and your match to know which parent that strand came from.

In reality, your DNA and their DNA is entirely mixed in each of you, shown in the chart below, and without additional information, neither of you will know which strand of DNA you match on, or who you inherited it from.  Initially, you will only know THAT you match.

Phase IBD2

So here’s what your DNA really looks like. It’s up to the DNA matching software to look at the two strands of your DNA that’s mixed together, and the two strands of your match’s DNA that’s mixed together and see if there is a common grouping of DNA at each location that extends for at least 10 locations in length, which is the “threshold” for our example that signifies a match that is likely to be “real” versus IBC, or identical by chance.  In my example, that common grouping is the green “Matching Portions” column, above.

An identical by chance match looks like the chart below. You can see that the green matching DNA is zigzagging back and forth between your parents’ DNA.

Phase IBC

It can even be worse where your match’s Mom’s and Dad’s DNA is also zigzagging back and forth, but you can certainly get the idea that there are all kinds of ways to NOT match but only three ways to legitimately match – Mom’s side, Dad’s side, or both.

So you can see that indeed, you do technically match, but not because you share a DNA segment of any size with one parent, but because your match’s DNA matches part of your Mom’s DNA and part of your Dad’s, which means that DNA segment does NOT come from one common ancestor, meaning not IBD. However, the matching software can’t tell the difference, because your strands aren’t coded to Mom and Dad.

What parental phasing does is to assign your matches to “sides” or buckets based on whether they match your Mom or Dad in addition to you.

One Parent Matches

In my case, I only have one parent whose DNA is available. Therefore, all of my matches will either match both my mother and me, or not.  The balance that do not match me and my mother, both, will either match to my father or will be IBC, identical by chance matches.  Unfortunately, just by utilizing one-parent phasing, I can’t tell if the “non-Mom” matches are really to my father or are IBC.

Let’s look at an example.

Match Mom’s Side Dad or IBC Comment
Denny Yes Probably not Mom’s side, could also match on Dad’s side but we have no way to tell. My parents lines come from different parts of the world except that they both married into Native American lines.
Sally No Yes Can’t tell whether Dad’s side or IBC
Derrell No Yes Also matches cousin on Dad’s side on same segments, so Derrell is assigned to Dad’s side pending triangulation.

By using the ICW tool at Family Tree DNA, shown below, I can see who matches me and my matches, both – in this case, me and my mother.

No Parent Matches

If I have no parents in the system, but several other close family members, like uncles or cousins, I can easily see who else I match in common with my match.

In other words, without my mother to match, Denny will either match my Mom’s side family members, and I can tentatively group him there, my Dad’s side family members, and I can tentatively group him there, or neither, in which case I can’t do anything with him except note that fact.

An Example

I’m going to use my proven cousin Denny for my examples, because that’s who I used in my Curtis Lore case study and our connection is proven both genetically and genealogically.

Here’s Denny’s match list. My mother is Denny’s closest match and I’m his second closest.

Phase match list

Therefore, I can use the ICW technique to effectively put my matches into buckets that divide my DNA in half, if I have both parents.

If I have one parent, I can fill one bucket for sure by putting everyone who matches both my mother and me into the “mother” bucket. The balance will be in the “Father +IBC” bucket.

This is easy to do at Family Tree DNA by using the crossed arrow ICW tool to find everyone who matches me in common with my mother.

Phase iCW

If I don’t have either parent, but I have an uncle or a cousin, I can still assign some matches to buckets by utilizing this same ICW tool. What I can’t do without both parents is to eliminate IBC or identical by chance matches from my match list.  I need both parents or at least well fleshed out match groups to do that.  There are examples of using match groups to identify IBC matches in the article, Identical By…Descent, Chance, Population and State.

Furthermore, I will need to download my match lists for both my mother and myself to verify that each person matches both my mother and myself on a common segment.

Testing the Theory

Let’s use my real life example and see how this works. I’m going to utilize three generations, because this gives us the ability to see the parental phasing work twice.  In this illustration, below, four people have tested, Denny, Mother, Me and My Child.

Phase pedigree

Denny and my child, who are 3rd cousins once removed, match on the following DNA segments, utilizing the Family Tree DNA chromosome browser.  We are comparing against Denny, meaning he is the “background” black chromosome.  The orange illustrates where my child matches Denny.

Phase browser denny child

There are no matching segments on chromosomes 18-22.  I have not included X chromosome matching.

Here’s the same information in chart format.

Phase chart denny child

You can see that Denny and my child have several fairly significant segment matches, along with some smaller ones too. The question is, which of those segments are legitimate, meaning IBD and which are not, meaning IBC?

Let’s phase my child against my DNA and see which of these segment matches hold up.

My child is orange, and I am blue and we are both matching against cousin Denny.

phase browser denny child me

As you can see, many of those segments are legitimate because Denny matches both me and my child on the same segments. So they are not IBC, or identical by chance, but IBD, identical, literally, by descent – because my child received them from me.

In some cases, Denny matches only me, blue, which is fine because all that means is that either our matches are IBC or I didn’t pass that DNA to my child. Both matches on chromosome 3 are to me (blue) and not to my child (orange).

However, in the cases where Denny matches my child (orange,) and not me (blue,) on the same segments, that means that either Denny and my child share an ancestor that is through my child’s father or the matches are IBC.  Those matches are not through me.  In other words, those segments did not pass phasing.  You can see examples of that on chromosomes 1, 4 and 14, and partial matches on 11 and 12.

Chromosome 16 shows a really good example of a crossover event where my child, orange, received part of my DNA, blue, but about half way through my segment, it was divided and my child inherited part of mine and the other half from their father.  So, visually, you can see that my child only matches Denny on about half of the segment where I match Denny.

Matches Spreadsheet

I downloaded the results of both Denny’s matches to me and Denny’s matches to my child into one Matches Spreadsheet and have color coded them so that you can see the relationships.  If Denny matches both me and my child, you will see a common segment on that chromosome for both me and my child in the spreadsheet.  Rows where Denny matches my child are light orange and rows where Denny matches me are light blue, similar to the chromosome browser colors.

Denny Me Child

There are only three possible conditions and I have colored the chromosome column accordingly:

  • Denny matches me only – dark teal – may be a legitimate match but we don’t have enough information to tell at this point
  • Denny matches my child only, but not me – red – NOT a legitimate match – identical by chance (IBC)
  • Denny matches me and my child both – boxed green – a legitimate identical by descent (IBD) match

You’ll note that some of these matches are exact. For example on the first matching segment of chromosome 2, below, my child received this entire segment of my DNA.  It was not divided at all.

Denny Me Child 2

However, in the next two matching groups on chromosome 2, my child received most of the DNA I share with Denny, but some was shaved off, but not half.

Denny Me Child 2 shaved

On chromosome 16, my child received almost exactly half of the DNA segment that I share with Denny.

Denny Me Child 16

On chromosomes 11 and 17, my child shares more DNA with Denny than I do, which means that all of that DNA isn’t ancestral though me. In this case, either there are some fuzzy boundaries, a read error, part of the DNA is IBD and part is IBC or part of the DNA is matching through both parents.

Denny Me Child 17 c

On chromosome 14, I match Denny, but my child received none of that DNA, which is why I’ve added the color teal.

Denny Me Child 14 c

Now, let’s phase me against my mother and see how the DNA matches hold up in a third generation.

Adding the Next Generation

The view of the chromosome browser below shows Denny matching my child, in orange, me in blue and my mother in green.

Amazingly, many of these segments follow through all three generations.

phase browser denny child me mother

Let’s see how the various matches stacked up, pardon the pun.

I’ve added Denny’s matches to mother to the Matches Spreadsheet and her rows are colored green.

On the Matches Spreadsheet from the first example, there were several segments where Denny matched only me and not my child. They were colored teal.  In the chart below, so we can track those segments, I have colored them teal in the matchname column, and you can see the resolution of how they did or didn’t survive phasing against my mother in the chromosome column.

Of those 11 segments, 2 phased with my mother, the rest did not. That makes sense, since none of those are segments I passed on to my child, so they would be more likely to be IBC.

Denny me Child Mom SS

The legend for the spreadsheet above is as follows:

  • Dark teal in chromosome column – Denny matches Mom only – may be a legitimate match but we don’t have enough information to know (chromosomes 1, 2, 4, 5, 6, 7, 9, 12 and 15)
  • Dark teal in matchname column, plus red in chromosome column – previously Denny matched only me, now I do not phase against my mother, so this is an IBC match (chromosomes 1, 3, 4, 5, 6, 7, 10, 12 and 17)
  • Dark teal in matchname column, plus green box in chromosome column – previously Denny only matched me, but now this segment is parentally phased and considered legitimate (chromosomes 2 and 10)
  • Red in chromosome column – does not phase against parent, so not a legitimate match – IBC (chromosomes 1, 3, 4, 5, 6, 7, 10, 11, 12, 14 and 17)
  • Green box indicates a phased match – considered IBD and legitimate (chromosomes 1, 2, 10, 14, 15, 16 and 17)

Anomalies

*So what the heck happened with chromosome 11?

In the first example, this segment received a green box because Denny matched both me and my child on a partial segment, which means that partial segment is phased and considered legitimate.

denny me child mom ss 11 grn

When we moved to the next generation, phasing against my mother, Denny does not match my mother on this segment, so it could NOT have arrived in me and my child via my mother, so it is not IBD, even though it appeared that way initially. Because of this, I’ve changed the box color to red for a non-IBD match.

Denny me Child Mom SS 11

How could this happen?

First, it’s a very small segment overlap match, and second, Denny matched more to my child than to me, which is a neon warning sign that this segment match is suspect, especially those two conditions in combination with each other.

Here’s an example of how, genetically, a match could phase with a parent in one generation, but not hold into the next generation.

phase n o phase

This match matches both me and my child (gold), but not my mother, who has no gold. As you can see, the match does accrue 10 gold location matches in a row, but not 10 green ones, so doesn’t match my mother.  The larger the number of locations in a row required to be considered a match, the less likely this type of random matching will be to occur.

This is both the purpose and the quandry of thresholds.  Finding that sweet spot that doesn’t eliminate real matches, but is high enough to be useful in eliminating false positive (IBC) matches.  And I can tell you, there are just about as many opinions on what that threshold number should be as there are people giving opinions – and everyone seems to have one!  You can read more about this in the article, Concepts – CentiMorgans, SNPs and Pickin’ Crab.

Segment Survival

Let’s take a look and see how many of which size segments survived parental phasing.  Are some of those smaller segments legitimate matches, or did we lose them in phasing?

The chart below shows the results in segment size order, color coded as follows:

  • Red = segments that did not phase and were IBC
  • Teal = segments that match Mom only and may or may not be valid. We don’t have any way to know without additional matches.
  • Green = segments that phased and are IBD

Phased cMs by size

As you would expect, all of the larger segments phased, but surprisingly, so did several of the smaller segments, through three generations.

Given the fact that teal matches did not phase, for the most part, in the previous example, and given that the teal segments are mostly small, my suspicion would be that most of  these teal segments would not phase (with the probable exception of the 10.27 cm segment), if we have the opportunity to find out – which we don’t.

This example is for a non-endogamous line, or better stated, with distant endogamous groups in multiple lines. Endogamous results would probably be different.

Statistics

What do our statistics look like?

There were 58 matching segments between Denny, my child, me and my mother.

  Match To Whom # Segments # Phased %
Denny My Child 12 8 75
Denny Me 22 11 50
Denny Mother 24 Probably at least 11
Total 58

Of those 58 total matches, 16 were IBC meaning they did not match up through my mother.

  Total

Segment Matches

IBC (no phase) IBD (phase) Just Mother Match Groups 2 gen Groups 3 gen Groups
58 16 29 13 12 3 9
% 28% 50% 22% 25% 75%

Thirteen match just to mother (teal), of which one, on chromosome 12 for 10.27 centiMorgans, is the most likely to be legitimate, or IBD. The rest were smaller segments and none were passed to a the child, so they are less likely to be legitimate, or IBD.

There are a total of 12 matching groups, of which 3 are for only two generations, me and mother. In other words, not all of that DNA got passed on to my child, but at least some of it did 9 of those 12 times.

Does Size Matter?

I wanted to see how the small versus large segments faired in terms of three generations of parental phasing. Are smeller segments legitimate or not?  Do they stand up?  The “Phased cMs by Size” chart above was sorted in chromosome order, with teal being a match to mother only (so we don’t know if it phased), green meaning the segment DID phase and red meaning it DID NOT phase with the parent.

Removing the teal blocks, which match to mother only, meaning we don’t know if they would parentally phase or not, leaves us with the blocks that had the opportunity to phase, and whether they passed or failed. 100% of the blocks 3.57cM and above phased.  A natural dividing line seems to occur about the 3.5 cM level, shown below.

phased cms by size less teal

It’s interesting that all matches above 3.36 cM phased, several of them twice, through three generations or two transmission (inheritance) events. Of those, 9, or 43% were under the 10cM threshold suggested by some, and 7, or 33% were under the 7cM threshold.

Most of the segments 3.36 cM and below, did not pass phasing. Of those, 6 or 26% did pass phasing, while 17, or 74%, did not.  Note that this cM level is with the SNP threshold set to 500 SNPs, which is generally the lowest number I use.

Segment Size # of Segments # Segments Phased %
Larger than 3.5 cM 21 21 100
Smaller than 3.5 cM 23 6 26

Are these results a function of this particular family, or would this hold if more parental generational phasing studies were performed?

Let’s see. 

The Threshold Study

I was surprised by the seemingly low threshold of 3.5 cM that appeared to be the rough dividing line for cMs that passed parental phasing and those that did not. I undertook a small study of four additional 3 generation non-endogamous families.

I’ve included the Lore study that we discussed above in the first column.

I have also removed all duplicates in the results below, since the duplicates were an artifact of matching groups where we had three generations to match.

I completed 4 different three-generation studies in 4 unrelated non-endogamous families and noted the rough threshold for where matches seem to pass or fail phasing – in other words, the fall line. In all 4 examples below, the threshold was between 2.46 and 3.16 cM.  You could move it slightly higher, depending on what criteria you use for the “fall line,” which is why I’ve included the raw data.  In all cases, the SNP threshold was at 500 so you would not see any matches with fewer than 500 SNPs.

The black bar in the results below marks the location where the shift from fail to pass occurs in the various studies.

4 family phasing

Additionally, I have one 4-generation study available as well. The closest related of the 4 generations that were being matched against were first cousins, then first cousins once removed, then first cousins twice removed (equal to 2nd cousins) then 1st cousins three times removed (equal to second cousins once removed).

You can see, below, that the pass/fail threshold for this 4 generation, 3 transmission study was also at 3.69 cM for valid segments that survived. The segments labeled “2 match” mean that they did not get passed to the younger generations, so they only matched in the oldest two generations, 3 match the oldest 3 generations and 4 match meaning the match survived through all 4 generations.

It’s interesting that even some of the smaller segments held through all 4 generations.

4 gen phasing

Ethnicity Matters

Clearly, parental phasing is only successful when you have matches. Of the three data bases available for autosomal DNA comparisons today, Family Tree DNA and 23andMe likely have the largest representation of non-US participants, because the Ancestry.com test was not sold outside the US for quite some time.  The Family Tree DNA Family Finder test was sold in the most locations outside the US.

Family Tree DNA probably has the best representation of Jewish DNA of all of the data bases.

Family Tree DNA projects facilitate the grouping of individuals by self-selected interest which includes ethnic categories, making those relationships visible by virtue of project membership wherein they are not readily evident in other data bases.

Therefore, by virtue of who has tested, if your ancestry is not “US” meaning a melting pot type of environment who are not recent arrivals, then you are likely to have less matches, so less phased matches too.  If you have a high degree of any particular ethnicity, even if your ancestry is “US,” you may still have fewer matches.  For example, 3 of 4 of my mother’s grandparents were either German or Dutch, and she has 710 matches, or roughly half the matches that I have.  My father’s heritage was Appalachian, meaning Colonial American.

Here’s a quick chart showing the total matches as of April, 2016 for a number of individuals who contributed their match totals in Family Finder and who carry either no US heritage or a specific ethnicity.  For purposes of comparison, three individuals with typical mixed colonial US heritage are shown at the top.

Ethnicity match chart

People with high percentages of African heritage tend to have few matches today, as do those of purely European heritage. Unfortunately, not many Africans or African-Americans test their DNA and DNA testing is not as popular in Europe as it is in the US.  Many people in Europe are leary of DNA testing or don’t feel they need to test, because “we’ve always lived here.”   I’m hopeful that the sustained popularity of programs like Who Do You Think You Are and Finding Your Roots will encourage more people of all ethnicities and locations to test from around the globe.

People from highly endogamous populations have a different issue to deal with, as you can see from the very high number of Jewish matches in the chart above. Since these people descend from a common founder population, they share a lot of ancestral DNA that is identical by population, meaning they did receive it from an ancestor, so it’s not IBC, but they received that segment because that particular segment is very prevalent within that population.  Determining which ancestor contributed that piece of DNA is exceedingly difficult, if not impossible because several ancestors carried that same segment.

Therefore, while the segment is identical by descent, it’s probably not genealogically useful in a 100% endogamous scenario.

In an unpublished study, we discovered that while working with parentally phased Jewish results, it’s not unusual for up to half of the matches to not match the participant plus either parent on the same segments. Or conversely, they may match both parents, but the segments are comparatively small.  Matching to both parents in an endogamous population, without a known familial relationship, and without at least one relatively large segment, is an indicator of IBP, identical by population, matches.  For Jewish and other endogamous people, parental phasing is very promising, and will help them sort through irrelevant “diamond in the rough” matches indicated by no parent matches or smaller both parent matches to find the genealogically relevant gems.

In all parental phasing groups studied, no one lost less than 10% of their matches utilizing parental phasing and most people lost significantly more, up to half.  I would very much like to see these same kinds of 3 or 4 generation parental phasing studies done for groups of Jewish, other endogamous and African American families.  In order to do a study of one family, you need at least 3 generations who have tested and another known family member, like a first or second cousin perhaps, to match against.

In Summary

Dual parental phasing works wonderfully.  One parent phasing works pretty well too.  Even close relative phasing works, just not as well as parental phasing.  You can only work with the people you have available to test, so test every relative you can convince!

If you have one or both parents to test, by all means, do. You’ll be able to phase your matches against both of your parents individually and eliminate the majority of IBC matches.

If you have grandparents or their siblings available to test, do, and quickly so you don’t lose the opportunity. Test the oldest person/generation in each line that you can.

If you don’t have both parents, test your half and full siblings, all of them, the more the better, because they inherited parts of your parents DNA that you didn’t.

Find your closest relatives and test them, yes, all of them.

If you are testing parents, you don’t need to test their children too, because their children will only receive half of their parent’s DNA, and you already have the parents DNA.

Even if you can’t phase your matches utilizing your parents DNA, you can use the combination of your matches with other relatively close family members to assign or suggest matches to both sides of your family along family lines – creating match groups. For example, if your match matches you and your great-uncle Charlie on the same segment, then it’s very likely that match is from the common ancestral line shared by your common ancestor with great-uncle Charlie – your great-grandparents.  Triangulation, of course, will prove that.

Some of your relatives will be quite interested in DNA testing and others will be happy to test simply because it helps you, and they like to hear about the result of the genealogy research. I’ve discovered that providing a scholarship for the testing, especially for those people you really want to test, goes a very long way in convincing people that DNA testing for genealogy is something they might be interested in doing.  If you can’t personally afford a scholarship for everyone, try the old fashioned collection jar.  And no, I’m not kidding.  It works wonders and gives everyone an opportunity to participate and invest as well, as much as they can afford.

Ethnicity testing has a lot of sizzle for some folks too – so don’t just deliver the dry facts – be sure to talk about the sizzle too. Sizzle sells!  People get excited about the possibilities and of course, you’ll explain the result to them, so they get to visit with you a second time as well.  Something to look forward to at next summer’s picnic!

Be sure to take swab kits to family events; picnics, reunions, graduation parties, weddings and holiday gatherings. Believe me, I have a DNA kit in my purse or car at all times.  And maybe, if your extended family lives close by, resurrect the old-time Sunday afternoon tradition of “going calling.”  Not only can you collect DNA, you can collect family memories too and I guarantee, you’ll make a new discovery with every visit.  Take this opportunity to interview your relatives.

It’s amazing isn’t it, the things we do for this “DNA phase” that we’re all going through!

Acknowledgements

I want to thank Family Tree DNA for their ongoing support of projects and citizen scientists which makes these types of research studies possible. I also want to thank several individuals in the genetic genealogy community who provided their information and gave permission for me to incorporate their results into this article.  Without sharing and collaboration, these types of efforts would simply not be possible.

______________________________________________________________

Disclosure

I receive a small contribution when you click on some of the links to vendors in my articles. This does NOT increase the price you pay but helps me to keep the lights on and this informational blog free for everyone. Please click on the links in the articles or to the vendors below if you are purchasing products or DNA testing.

Thank you so much.

DNA Purchases and Free Transfers

Genealogy Services

Genealogy Research

Autosomal DNA Matching Confidence Spectrum

Are you confused about DNA matches and what they mean…different kinds of matches…from different vendors and combined results between vendors.  Do you feel like lions and tigers and bears…oh my?  You’re not alone.

As the vendors add more tools, I’ve noticed recently that along with those tools has come a significant amount of confusion surrounding matches and what they mean.  Add to this issue confusion about the terminology being used within the industry to describe various kinds of matches.  Combined, we now have a verbiage or terminology issue and we have confusion regarding the actual matches and what they mean.  So, as people talk, what they mean, what they are trying to communicate and what they do say can be interpreted quite widely.  Is it any wonder so many people are confused?

I reached out within the community to others who I know are working with autosomal results on a daily basis and often engaged in pioneering research to see how they are categorizing these results and how they are referring to them.

I want to thank Jim Bartlett, Blaine Bettinger, Tim Janzen and David Pike (in surname alphabetical order) for their input and discussion about these topics.  I hope that this article goes a long way towards sorting through the various kinds of matches and what they can and do mean to genetic genealogists – and what they are being called.  To be clear, the article is mine and I have quoted them specifically when applicable.

But first, let’s talk about goals.

Goals

One thing that has become apparent over the past few months is that your goals may well affect how you interpret data.  For example, if you are an adoptee, you’re going to be looking first at your closest matches and your largest segments.  Distant matches and small segments are irrelevant at least until you work with the big pieces.  The theory of low hanging fruit, of course.

If your goal is to verify and generally validate your existing genealogy, you may be perfectly happy with Ancestry’s Circles.  Ancestry Circles aren’t proof, as many people think, but if you’re looking for low hanging fruit and “probably” versus “positively,” Ancestry Circles may be the answer for you.

If you didn’t stop reading after the last sentence, then I’m guessing that “probably” isn’t your style.

If your goal is to prove each ancestor and/or map their segments to your DNA, you’re not going to be at all happy with Ancestry’s lack of segment data – so your confidence and happiness level is going to be greatly different than someone who is just looking to find themselves in circles with other descendants of the same ancestor and go merrily on their way.

If you have already connected the dots on most of your ancestry for the past 4 or 5 generations, and you’re working primarily with colonial ancestors and those born before 1700, you may be profoundly interested in small segment data, while someone else decides to eliminate that same data on their spreadsheet to eliminate clutter.  One person’s clutter is another’s goldmine.

While, technically, the different types of tests and matches carry a different technical confidence level, your personal confidence ranking will be influenced by your own goals and by some secondary factors like how many other people match on a particular segment.

Let’s start by talking about the different kinds of matching.  I’ve been working with my Crumley line, so I’ll be utilizing examples from that project.

Individual Matching, Group Matching and Triangulation

There is a difference between individual matching, group matching and triangulation.  In fact, there is a whole spectrum of matching to be considered.

Individual Matching

Individual matching is when someone matches you.

confidence individual match

That’s great, but one match out of context generally isn’t worth much.  There’s that word, generally, because if there is one thing that is almost always true, it’s that there is an exception to every rule and that exception often has to do with context.  For example, if you’re looking for parents and siblings, then one match is all you need.

If this match happens to be to my first cousin, that alone confirms several things for me, assuming there is not a secondary relationship.  First, it confirms my relationship with my parent and my parent’s descent from their parents, since I couldn’t be matching my first cousin (at first cousin level) if all of the lines between me and the cousin weren’t intact.

confidence cousins

However, if the match is to someone I don’t know, and it’s not a close relative, like the 2nd to 4th cousins shown in the match above, then it’s meaningless without additional information.  Most of your matches will be more distant.  Let’s face it, you have a lot more distant cousins than close cousins.  Many ancestors, especially before about 1900, were indeed, prolific, at least by today’s standards.

So, at this point, your match list looks like this:

confidence match list

Bridget looks pretty lonely.  Let’s see what we can do about that.

Matching Additional People

The first question is “do you share a common ancestor with that individual?”  If yes, then that is a really big hint – but it’s not proof of anything – unless they are a close relative match like we discussed above.

Why isn’t a single match enough for proof?

You could be related to this person through more than one ancestral line – and that happens far more than I initially thought.  I did an analysis some time back and discovered that about 15% of the time, I can confirm a secondary genealogical line that is not related to the first line in my tree.  There were another 7% that were probable – meaning that I can’t identify a second common ancestor with certainty, but the surname and location is the same and a connection is likely.  Another 8% were from endogamous lines, like Acadians, so I’m sure there are multiple lines involved.  And of those matches (minus the Acadians), about 10% look to have 3 genealogical lines, not just two.  The message here – never assume.

When you find one match and identify one common genealogical line, you can’t assume that is how you are genetically related on the segment in question.

Ideally, at this point, you will find a third person who shares the common ancestor and their DNA matches, or triangulates, between you and your original match to prove the connection.  But, circumstances are not always ideal.

What is Triangualtion?

Triangulation on the continuum of confidence is the highest confidence level achievable, outside of close relative matching which is evident by itself without triangulation.

Triangulation is when you match two people who share a common ancestor and all three of you match each other on that same segment.  This means that segment descended to all three of you from that common ancestor.

This is what a match group would look like if Jerry matches both John and Bridget.

confidence example 1 match group

Example 1 – Match Group

The classic definition of triangulation is when three people, A, B and C all match each other on the same segment and share a known, identifiable common ancestor.  Above, we only have two.  We don’t know yet if John matches Bridget.

A matches B
A matches C
B matches C

This is what an exact triangulation group would look like between Jerry, John and Bridget.  Most triangulation matches aren’t exact, meaning the start and/or end segment might be different, but some are exact.

confidence example 2 triangulation group

Example 2 – Triangulation Group

It’s not always possible to prove all three.  Sometimes you can see that Jerry matches Bridget and Jerry matches John, but you have no access to John or Bridget’s kits to verify that they also match each other.  If you are at Family Tree DNA, you can run the ICW (in common with) tool to see if John and Bridget do match each other – but that tool does not confirm that they match on the same segment.

If the individuals involved have uploaded their kits to GedMatch, you have the ability to triangulate because you can see the kit numbers of your matches and you can then run them against each other to verify that they do indeed match each other as well.  Not everyone uploads their kits to GedMatch, so you may wind up with a hybrid combination of triangulated groups (like example 2, above) and matching groups (like example 1, above) on your own personal spreadsheet.

Matching groups (that are not triangulated) are referred to by different names within the community.  Tim Janzen refers to them as clusters of cousins, Blaine as pseudo triangulation and I have called them triangulation groups in the past if any three within the group are proven to be triangulated. Be careful when you’re discussing this, because matching groups are often misstated as triangulated groups.  You’ll want to clarify.

Creating a Match List

Sometimes triangulation options aren’t available to us.  For example, at Family Tree DNA, we can see who matches us, and we can see if they match each other utilizing the ICW tool, but we can’t see specifically where they match each other.  This is considered a match group.  This type of matching is also where a great deal of confusion is introduced because these people do match each other, but they are NOT (yet) triangulated.

What we know is that all of these people are on YOUR match list, but we don’t know that they are on each other’s match lists.  They could be matching you on different sides of your DNA or, if smaller segments, they might be IBC (identical by chance.)

You can run the ICW (in common with) tool at Family Tree DNA for every match you have.  The ICW tool is a good way to see who matches both people in question.  Hopefully, some of your matches will have uploaded trees and you can peruse for common ancestors.

The ICW tool is the little crossed arrows and it shows you who you and that person also match in common.

confidence match list ftdna

You can run the ICW tool in conjunction with the ancestral surname in question, showing only individuals who you have matches in common with who have the Crumley surname (for example) in their ancestral surname list.  This is a huge timesaver and narrows your scope of search immediately.  By clicking on the ICW tool for Ms. Bridget,  you see the list, below of those who match both the person whose account we are signed into and Ms. Bridget, below.

confidence icw ftdna

Another way to find common matches to any individual is to search by either the current surname or ancestral surnames.  The ancestral surname search checks the surnames entered by other participants and shows them in the results box.

In the example above, all of these individuals have Crumley listed in their surnames.  You can see that I’ve sorted by ancestral surname – as Crumley is in that search box.

Now, your match lists looks like this relative to the Crumley line.  Some people included trees and you can find your common ancestor on their tree, or through communications with them directly.  In other cases, no tree but the common surname appears in the surname match list.  You may want to note those results on your match list as well.

confidence match list 2

Of course, the next step is to compare these individuals in a matrix to see who matches who and the chromosome browser to see where they match you, which we’ll discuss momentarily.

Group Matching

The next type of matching is when you have a group of people who match each other, but not necessarily on the same segment of DNA.  These matching groups are very important, especially when you know there is a shared ancestor involved – but they don’t indicate that the people share the same segment, nor that all (or any) of their shared segments are from this particular ancestor.  Triangulation is the only thing that accomplishes proof positive.

This ICW matrix shows some of the Crumley participants who have tested and who matches whom.

confidence icw grid

You can display this grid by matching total cM or by known relationship (assuming the individuals have entered this information) or by predicted relationship range.  The total cMs shared is more important for me in evaluating how closely this person might be related to the other individual.

The Chromosome Browser

The chromosome browser at Family Tree DNA shows matches from the perspective of any one individual.  This means that the background display of the 22 Chromosomes (plus X) is the person all of the matches are comparing against. If you’re signed in to your account, then you are the black background chromosomes, and everyone is being compared against your DNA.  I’m only showing the first 6 chromosomes below.

confidence chromosome browser

You can see where up to 5 individuals match the person you’re comparing them to.  In this case, it looks like they may share a common segment on chromosome 2 among several descendants.  Of course, you’d need to check each of these individuals to insure that they match each other on this same segment to confirm that indeed, it did come from a common ancestor.  That’s triangulation.

When you see a grouping of matches of individuals known to descend from a common ancestor on the same chromosome, it’s very likely that you have a match group (cluster of cousins, pseudo triangulation group) and they will all match each other on that same segment if you have the opportunity to triangulate them, but it’s not absolute.

For example, below we have a reconstructed chromosome 8 of James Crumley, the common ancestor of a large group of people shown based on matches.  In other words, each colored segment represents a match between two people.  I have a lot more confidence in the matches shown with the arrows than the single or less frequent matches.

confidence chromosome 8 match group'

This pseudo triangulation is really very important, because it’s not just a match, and it’s not triangulation.  The more people you have that match you on this segment and that have the same ancestor, the more likely that this segment will triangulate.  This is also where much of the confusion is coming from, because matching groups of multiple descendants on the same segments almost always do triangulate so they have been being called triangulation groups, even when they have not all been triangulated to each other.  Very occasionally, you will find a group of several people with a common ancestor who triangulate to each other on this common segment, except one of a group doesn’t triangulate to one other, but otherwise, they all triangulate to others.

confidence triangulation issue

This situation has to be an error of some sort, because if all of these people match each other, including B, then B really must match D.  Our group discussed this, and Jim Bartlett pointed out that these problem matches are often near the vendor matching threshold (or your threshold if you’re using GedMatch) and if the threshold is lowered a bit, they continue to match.  They may also be a marginal match on the edge, so to speak or they may have a read error at a critical location in their kit.

What “in common with” matching does is to increase your confidence that these are indeed ancestral matches, a cousin cluster, but it’s not yet triangulation.

Ancestry Matches

Ancestry has added another level of matching into the mix.  The difference is, of course, that you can’t see any segment data at all, at Ancestry, so you don’t have anything other than the fact that you do match the other person and if you have a shakey leaf hint, you also share a common ancestor in your trees.

confidence ancestry matches

When three people match each other on any segment (meaning this does not infer a common segment match) and also share a common ancestor in a tree, they qualify to be a DNA Circle.  However, there is other criteria that is weighted and not every group of 3 individuals who match and share an ancestor becomes a DNA Circle.  However, many do and many Circles have significantly more than three individuals.

confidence Phoebe Crumley circle

This DNA Circle is for Phebe Crumley, one of my Crumley ancestors.  In this grouping, I match one close family group of 5 people, and one individual, Alyssa, all of whom share Phebe Crumley in their trees.  As luck would have it, the family group has also tested at Family Tree DNA and has downloaded their results to GedMatch, but as it stands here at Ancestry, with DNA Circle data only…the only thing I can do is to add them to my match list.

confidence match list 3

In case you’re wondering, the reason I only added three of the 5 family members of the Abija group to my match list is because two are children of one of the members and their Crumley DNA is represented through their parent.

While a small DNA Circle like Phebe Crumley’s can be incorrect, because the individuals can indeed be sharing the DNA of a different ancestor, a larger group gives you more confidence that the relationship to that group of people is actually through the common ancestor whose circle you are a member of.  In the example Circle shown below, I match 6 individuals out of a total of 21 individuals who are all interrelated and share Henry Bolton in their tree.

Confidence Henry Bolton circle

New Ancestor Discoveries

Ancestry introduced New Ancestor Discoveries (NADs) a few months ago.  This tool is, unfortunately, misnamed – and although this is a good concept for finding people whose DNA you share, but whose tree you don’t – it’s not mature yet.

The name causes people to misinterpret the “ancestors” given to them as genuinely theirs.  So far, I’ve had a total of 11 NADS and most have been easily proven false.

Here’s how NADs work.  Let’s say there is a DNA Circle, John Doe, of 3 people and you match two of them.  The assumption is that John Doe is also your ancestor because you share the DNA of his descendants.  This is a critically flawed assumption.  For example, in one case, my ancestors sister’s husband is shown as my “new ancestor discovery” because I share DNA with his descendants (through his wife, my ancestor’s sister.)  Like I said, not mature yet.

I have discussed this repeatedly, so let’s just suffice it to say for this discussion, that there is absolutely no confidence in NADs and they aren’t relevant.

Shared Matches

Ancestry recently added a Shared Matches function.

For each person that you match at Ancestry, that is a 4th cousin or closer and who has a high confidence match ranking, you can click on shared matches to see who you and they both match in common.

confidence ancestry shared matches

This does NOT mean you match these people through the same ancestor.  This does NOT mean you match them on the same segment.  I wrote about how I’ve used this tool, but without additional data, like segment data, you can’t do much more with this.

What I have done is to build a grid similar to the Family Tree DNA matrix where I’ve attempted to see who matches whom and if there is someone(s) within that group that I can identify as specifically descending from the same ancestor.  This is, unfortunately, extremely high maintenance for a very low return.  I might add someone to my match list if they matched a group (or circle) or people that match me, whose common ancestor I can clearly identify.

Shared Matches are the lowest item on the confidence chart – which is not to say they are useless.  They can provide hints that you can follow up on with more precise tools.

Let’s move to the highest confidence tool, triangulation groups.

Triangulation Groups

Of course, the next step, either at 23andMe, Family Tree DNA, through GedMatch, or some combination of each, is to compare the actual segments of the individuals involved.  This means, especially at Ancestry where you have no tools, that you need to develop a successful begging technique to convince your matches to download their data to GedMatch or Family Tree DNA, or both.  Most people don’t, but some will and that may be the someone you need.

You have three triangulation options:

  1. If you are working with the Family Inheritance Advanced at 23andMe, you can compare each of your matches with each other. I would still invite my matches to download to GedMatch so you can compare them with people who did not test at 23andMe.
  2. If you are working with a group of people at Family Tree DNA, you can ask them to run themselves against each other to see if they also match on the same segment that they both match you on. If you are a project administrator on a project where they are all members, you can do this cross-check matching yourself. You can also ask them to download their results to GedMatch.
  3. If your matches will download their results to GedMatch, you can run each individual against any other individual to confirm their common segment matches with you and with each other.

In reality, you will likely wind up with a mixture of matches on your match list and not everyone will upload to GedMatch.

Confirming that segments create a three way match when you share a common ancestor constitutes proof that you share that common ancestor and that particular DNA has been passed down from that ancestor to you.

confidence match list 4

I’ve built this confidence table relative to matches first found at Family Tree DNA, adding matches from Ancestry and following them to GedMatch.  Fortunately, the Abija group has tested at all 3 companies and also uploaded their results to GedMatch.  Some of my favorite cousins!

Spectrum of Confidence

Blaine Bettinger built this slide that sums up the tools and where they fall on the confidence range alone, without considerations of your goals and technical factors such as segment size.  Thanks Blaine for allowing me to share it here.

confidence level Blaine

These tools and techniques fall onto a spectrum of confidence, which I’ve tried to put into perspective, below.

confidence level highest to lowest

I really debated how to best show these.  Unfortunately, there is almost always some level of judgment involved. In some cases, like triangulation at the 3 vendors, the highest level is equivalent, but in other cases, like the medium range, it really is a spectrum from lowest to highest within that grouping.

Now, let’s take a look at our matches that we’ve added to our match list in confidence order.

confidence match list 5

As you would expect, those who triangulated with each other using some chromosome browser and share a common ancestor are the highest confidence matches – those 5 with a red Y.  These are followed by matches who match me and each other but not on the same segment (or at least we don’t know that), so they don’t triangulate, at least not yet.

I didn’t include any low confidence matches in this table, but of the lowest ones that are included, the shakey leaf matches at Ancestry that won’t answer inquiries and the matches at FTDNA who do share a common surname but didn’t download their information to be triangulated are the least confident of the group.  However, even those lower confidence matches on this chart are medium, meaning at Ancestry they are in a Circle and at FTDNA, they do match and share a common surname.  At Family Tree DNA, they may eventually fall into a triangulation group of other descendants who triangulate.

Caveats

As always, there are some gotchas.  As someone said in something I read recently, “autosomal DNA is messy.”

Endogamy

Endogamous populations are just a mess.  The problem is that literally, everyone is related to everyone, because the founder population DNA has just been passed around and around for generations with little or no new DNA being introduced.

Therefore, people who descend from endogamous populations often show to be much more closely related than they are in a genealogical timeframe.

Secondly, we have the issue pointed out by David Pike, and that is when you really don’t know where a particular segment came from, because the segment matches both the parents, or in some cases, multiple grandparents.  So, which grandparent did that actual segment that descended to the grandchild descend from?

For people who are from the same core population on both parent’s side, close matches are often your only “sure thing” and beyond that, hopefully you have your parents (at least one parent) available to match against, because that’s the only way of even beginning to sort into family groups.  This is known as phasing against your parents and while it’s a great tool for everyone to use – it’s essential to people who descend from endogamous groups. Endogamy makes genetic genealogy difficult.

In other cases, where you do have endogamy in your line, but only in one of your lines, endogamy can actually help you, because you will immediately know based on who those people match in addition to you (preferably on the same segment) which group they descend from.  I can’t tell you how many rows I have on my spreadsheet that are labeled with the word “Acadian,” “Brethren” and “Mennonite.”  I note the common ancestor we can find, but in reality, who knows which upstream ancestor in the endogamous population the DNA originated with.

Now, the bad news is that Ancestry runs a routine that removes DNA that they feel is too matchy in your results, and most of my Acadian matches disappeared when Ancestry implemented their form of population based phasing.

Identical by Population

There is sometimes a fine line between a match that’s from an ancestor one generation further back than you can go, and a match from generations ago via DNA found at a comparatively high percentage in a particular population.  You can’t tell the difference.  All you know is that you can’t assign that segment to an ancestor, and you may know it does phase against a parent, so it’s valid, meaning not IBC or identical by chance.

Yes, identical by population segment matching is a distinct problem with endogamy, but it can also be problematic with people from the same region of the world but not members of endogamous populations.  Endogamy is a term for the timeframe we’re familiar with.  We don’t know what happened before we know what happened.

From time to time, you’ll begin to see something “odd” happened where a group of segments that you already have triangulated to one ancestor will then begin to triangulate to a second ancestor.  I’m not talking about the normal two groups for every address – one from your Mom’s side and one from your Dad’s.  I’m talking, for example, when my Mom’s DNA in a particular area begins to triangulate to one ancestral group from Germany and one from France.  These clearly aren’t the same ancestors, and we know that one particular “spot” or segment range that I received from her DNA can only come from one ancestor.  But these segment matches look to be breaking that rule.

I created the example below to illustrate this phenomenon.  Notice that the top and bottom 3 all match nicely to me and to each other and share a common ancestor, although not the same common ancestor for the two groups.  However, the range significantly overlaps.  And then there is the match to Mary Ann in the middle whose common ancestor to me is unknown.

confidence IBP example

Generally, we see these on smaller segment groups, and this is indicative that you may be seeing an identical by population group.  Many people lump these IBP (identical by population) groups in with IBC, identical by chance, but they aren’t.  The difference is that the DNA in an IBP group truly is coming from your ancestors – it’s just that two distinct groups of ancestors have the same DNA because at some point, they shared a common ancestor.  This is the issue that “academic phasing” (as opposed to parental phasing) is trying to address.  This is what Ancestry calls “pileup areas” and attempts to weed out of your results.  It’s difficult to determine where the legitimate mathematical line is relative to genealogically useful matches versus ones that aren’t.  And as far as I’m concerned, knowing that my match is “European” or “Native” or “African” even if I can’t go any further is still useful.

Think about this, if every European has between 1 and 4% Neanderthal DNA from just a few Neanderthal individuals that lived more than 20,000 years ago in Europe – why wouldn’t we occasionally trip over some common DNA from long ago that found its way into two different family lines.

When I find these multiple groupings, which is actually relatively rare, I note them and just keep on matching and triangulating, although I don’t use these segments to draw any conclusions until a much larger triangulated segment match with an identified ancestor comes into play.  Confidence increases with larger segments.

This multiple grouping phenomenon is a hint of a story I don’t know – and may never know.  Just because I don’t quite know how to interpret it today doesn’t mean it isn’t valid.  In time, maybe its full story will be revealed.

ROH – Runs of Homozygosity

Autosomal DNA tests test someplace over 500,000 locations, depending on the vendor you select.  At each of those locations, you find a value of either T, A, C or G, representing a specific nucleotide.  Sometimes, you find runs of the same nucleotide, so you will find an entire group of all T, for example.  If either of your parents have all Ts in the same location, then you will match anyone with any combination of T and anything else.

confidence homozygosity example

In the example above, you can see that you inherited T from both your Mom and Dad.  Endogamy maybe?

Sally, although she will technically show as a match, doesn’t really “match” you.  It’s just a fluke that her DNA matches your DNA by hopping back and forth between her Mom’s and Dad’s DNA.  This is not a match my descent, but by chance, or IBC (identical by chance.)  There is no way for you to know this, except by also comparing your results to Sally’s parents – another example of parental phasing.  You won’t match Sally’s parents on this segment, so the segment is IBC.

Now let’s look at Joe.  Joe matches you legitimately, but you can’t tell by just looking at this whether Joe matches you on your Mom’s or Dad’s side.  Unfortunately, because no one’s DNA comes with a zipper or two sides of the street labeled Mom and Dad – the only way to determine how Joe matches you is to either phase against Joe’s parents or see who else Joe matches that you match, preferable on the same segment – in other words – create either a match or ICW group, or triangulation.

Segment Size

Everyone is in agreement about one thing.  Large segments are never IBC, identical by chance.  And I hate to use words like never, so today, interpret never to mean “not yet found.”  I’ve seen that large segment number be defined both 13cM and 15cM and “almost never” over 10cM.  There is currently discussion surrounding the X chromosome and false positives at about this threshold, but the jury is still out on this one.

Most medium segments hold true too.  Medium segment matches to multiple people with the same ancestors almost always hold true.  In fact, I don’t personally know of one that didn’t, but that isn’t to say it hasn’t happened.

By medium segments, most people say 7cM and above.  Some say 5cM and above with multiple matching individuals.

As the segment size decreases, the confidence level decreases too, but can be increased by either multiple matches on that segment from a common proven ancestor or, of course, triangulation.  Phasing against your parent also assures that the match is not IBD.  As you can see, there are tools and techniques to increase your confidence when dealing with small segments, and to eliminate IBC segments.

The issue of small segments, how and when they can be utilized is still unresolved.  Some people simply delete them.  I feel that is throwing the baby away with the bathwater and small segments that triangulate from a common ancestor and that don’t find themselves in the middle of a pileup region that is identical by population or that is known to be overly matchy (near the center of chromosome 6, for example) can be utilized.  In some cases, these segments are proven because that same small segment section is also proven against matches that are much larger in a few descendants.

Tim Janzen says that he is more inclined to look at the number of SNPs instead of the segment size, and his comfort number is 500 SNPs or above.

The flip side of this is, as David Pike mentioned, that the fewer locations you have in a row, the greater the chance that you can randomly match, or that you can have runs of heterozygosity.

No one in our discussion group felt that all small segments were useless, although the jury is still out in terms of consensus about what exactly defines a small segment and when they are legitimate and/or useful.  Everyone of us wants to work towards answers, because for those of us who are dealing with colonial ancestors and have already picked the available low hanging fruit, those tantalizing small segments may be all that is left of the ancestor we so desperately need to identify.

For example, I put together this chart detailing my matching DNA by generation. Interesting, I did a similar chart originally almost exactly three years ago and although it has seemed slow day by day, I made a lot of progress when a couple of brick walls fell, in particular, my Dutch wall thanks to Yvette Hoitink.

If you look at the green group of numbers, that is the amount of shared DNA to be expected at each level.  The number of shared cMs drops dramatically between the 5th and 6th generation from 13 cM which would be considered a reasonable matching level (according to the above discussion) at the 5th generation, and 3.32 cM at the 6th generation level, which is a small segment by anyone’s definition.

confidence segment size vs generation

The 6th generation was born roughly in 1760, and if you look to the white grouping to the right of the green group, you can see that my percentage of known ancestors is 84% in the 5th generation, 80% in the 6th generation, but drops quickly after that to 39, 22 and 3%, respectively.  So, the exact place where I need the most help is also the exact place where the expected amount of DNA drops from 13 to 3.32 cM.  This means, that if anyone ever wants to solve those genealogical puzzles in that timeframe utilizing genetic genealogy, we had better figure out how to utilize those small segments effectively – because it may well be all we have except for the occasional larger sticky segment that is passed intact from an ancestor many generations past.

From my perspective, it’s a crying shame that Ancestry gives us no segment data and it’s sad that 23andMe only gives us 5cM and above.  It’s a blessing that we can select our own threshold at GedMatch.  I’m extremely grateful that FTDNA shows us the small segment matches to 1cM and 500 SNPs if we also match on 20cM total and at least one segment over 7cM.  That’s a good compromise, because small segments are more likely to be legitimate if we have a legitimate match on a larger segment and a known ancestor.  We already discussed that the larger the matching segment, the more likely it is to be valid. I would like to see Family Tree DNA lower the matching threshold within projects.  Surname projects imply that a group of people will be expected to match, so I’d really like to be able to see those lower threshold matches.

I’m hopeful that Family Tree DNA will continue to provide small segment information to us.  People who don’t want to learn how to use or be bothered with small segments don’t have to.  Delete is perfectly legitimate option, but without the data, those of us who are interested in researching how to best utilize these segments, can’t.  And when we don’t have data to use, we all lose.  So, thank you Family Tree DNA.

Coming Full Circle

This discussion brings us full circle once again to goals.

Goals change over time.

My initial reason for testing, the first day an autosomal test could be ordered, was to see if my half-brother was my half-brother.  Obviously for that, I didn’t need matching to other people or triangulation.  The answer was either yes or no, we do match at the half-sibling level, or we don’t.

He wasn’t.  But by then, he was terminally ill, and I never told him.  It certainly explained why I wasn’t a transplant match for him.

My next goal, almost immediately, was to determine which if either my brother or I were the child of my father.  For that, we did need matching to other people, and preferably close cousins – the closer the better.  Autosomal DNA testing was new at that time, and I had to recruit cousins.  Bless those who took pity on me and tested, because I was truly desperate to know.

Suffice it to say that the wait was a roller coaster ride of emotion.

If I was not my father’s child, I had just done 30+ years of someone else’s genealogy – not a revelation I relished, at all.

I was my father’s child.  My brother wasn’t.  I was glad I never told him the first part, because I didn’t have to tell him this part either.

My goal at that point changed to more of a general interest nature as more cousins tested and we matched, verifying different lineages that has been unable to be verified by Y or mtDNA testing.

Then one day, something magical happened.

One of my Y lines, Marcus Younger, whose Y line is a result of a NPE, nonparental event, or said differently, an undocumented adoption, received amazing information.  The paternal Younger family line we believed Marcus descended from, he didn’t.  However, autosomal DNA confirmed that even though he is not the paternal child of that line, he is still autosomally related to that line, sharing a common ancestor – suggesting that he may have been born of a Younger female and given that surname, while carrying the Y DNA of his biological father, who remains unidentified.

Amazingly, the next day, a match popped up that matched me and another Younger relative.  This match descended not from the Younger line, but from Marcus Younger’s wife’s alleged surname family.  I suddenly realized that not only was autosomal DNA interesting for confirming your tree – it could also be used to break down long-standing brick walls.  That’s where I’ve been focused ever since.

That’s a very different goal from where I began, and my current goal utilizes the tools in a very different way than my earlier goals.  Confidence levels matter now, a great deal, where that first day, all I wanted was a yes or no.

Today, my goal, other than breaking down brick walls, is for genetic genealogy to become automated and much easier but without taking away our options or keeping us so “safe” that we have no tools (Ancestry).

The process that will allow us to refine genetic genealogy and group individuals and matches utilizing trees on our desktops will ultimately be the key to unraveling those distant connections.  The data is there, we just have to learn how to use it most effectively, and the key, other than software, is collaboration with many cousins.

Aside from science and technology, the other wonderful aspect of autosomal DNA testing is that is has the potential to unite and often, reunite families who didn’t even know they were families.  I’ve seen this over and over now and I still marvel at this miracle given to us by our ancestors – their DNA.

So, regardless of where you fall on the goals and matching confidence spectrum in terms of genetic genealogy, keep encouraging others to test and keep reaching out and sharing – because it takes a village to recreate an ancestor!  No one can do it alone, and the more people who test and share, the better all of our chances become to achieve whatever genetic genealogy goals we have.

______________________________________________________________

Disclosure

I receive a small contribution when you click on some of the links to vendors in my articles. This does NOT increase the price you pay but helps me to keep the lights on and this informational blog free for everyone. Please click on the links in the articles or to the vendors below if you are purchasing products or DNA testing.

Thank you so much.

DNA Purchases and Free Transfers

Genealogy Services

Genealogy Research

Crumley Kinfolk

Just for fun, let’s look at some Crumley folks who are related.  When you work in the genetic genealogy field, people are forever sending photos of someone and saying “doesn’t this person look like that person?  Do you think they are related?”  Or, the most common, “this is my great grandmother – do you think she looks Native American.”

I am forever telling people that phenotypical resemblances are really not good indicators of relatedness, but it’s so difficult to believe when you’re looking for that needle in the haystack and it’s the only tidbit you have.

I did it myself when I found Lee Devine and discovered that not only was he deceased, but he had no children, so my chances of ever finding out definitively if he was my half brother are forever gone.  I reverted to picture comparisons, because it’s the only tool I had at my disposal.

So, let’s have some fun with this.

Take a look at this photo.  These men are unquestionably related.  The question is, how closely?

crumley kin

So, how do you think they are related?

If you said brothers, you’re in good company.  They look like brothers, but they aren’t.

If you said uncle and nephews, you too would be in good company, but nada.

Cousins maybe?

Well, yes.

These are all Crumley men, left to right, John, Ken, Jerry… and Donna, the daughter of one the men whose job it was to keep them in line that day.  Fortunately for Donna, she doesn’t have the signature family beard!

Years ago, the Y DNA tests through the Crumley DNA project confirmed that these men share a common Crumley ancestor, but despite appearances, they are much more distantly related than you might think.

Not first cousins.

Not second.

Not third.

Not fourth.

Not kidding!

The common ancestor of these men is John Crumley, born about 1737.

Yes, I know how much alike they look, but looks can be deceiving – or encouraging – and looks are not an accurate predictor of relatedness.

John and Ken are 4th cousins once removed.

Ken and Jerry are 5th cousins.

John and Jerry are 5th cousins once removed.

Their pedigree chart is shown below.

Crumley kin pedigree

Not quite what you would expect by looking at the picture.  As someone once said to me, “If you look at a picture long enough and hard enough, you can see anything that you want to see.”  Touche!

The Crumley DNA project at Family Tree DNA has embraced autosomal DNA testing, so all three of these gentlemen have taken the Family Finder test.  Knowing that their Y DNA matches (with a mutation or two), and having identified their common ancestor, let’s see if their autosomal DNA matches as well.

At Family Tree DNA, one must meet a 20 cM total DNA matching threshold, and an individual matching segment threshold of 7cM in order to be listed as a match.  Here’s how they matched, or didn’t.

Jerry John Ken
Jerry Self Yes No
John Yes Self No
Ken No No Self

Needless to say, if we didn’t already have the Crumley Y DNA results, this might have given Ken a bit of heartburn – but no need.  It’s not uncommon for distant cousins to not be shown as matches.

Fortunately, all three gentlemen also downloaded their results to GedMatch, where we can adjust the matching threshold.  In some cases, the 20cM total precludes a match, and in some cases, the 7cM segment precludes a match, so let’s see if these gentlemen match at GedMatch using a lower threshold.

At GedMatch, I ran all 3 gentlemen against each other using the threshold of 300 SNPs and 3 cM and then put their results into a common spreadsheet.  I also deleted the duplicate entries, because for every Ken to John match, there is also an identical John to Ken match.

You can see on the spreadsheet below that John and Jerry match each other, just as Family Tree DNA said.  They share not one, but two large matching segments of over 16 cM.  Not bad for 5th cousins once removed.

Crumley kin gedmatch

You can also see that Ken matches both Jerry and John, but not on any segment over 4.9 cM, which precludes matching at Family Tree DNA.  However, Ken exceeded the 20 cM total match threshold with both Jerry, at 51 cM and John at 35.8 cM – but a match has to exceed both thresholds to be counted as such.

Especially within known family groupings, a non-match doesn’t necessarily mean the individuals don’t share any DNA, it may just mean that there isn’t enough cumulatively (>20 cM) or the segments are too small to put them over the threshold (7 cM).  That’s the great thing about GedMatch, you can adjust your own thresholds.

Are all of these segments valid, meaning are they identical by descent?  Most likely not.  Are some valid?  Very probably, especially given that we know that these men unquestionably do share a common ancestor – thanks to their Y DNA.  Could we find out more?  Yes, we can, if we have more cousins to compare against.

And, as luck would have it, we do, another 40 or so….but that story will have to wait until the Crumley DNA Study is ready for publication!

Thanks to Ken, Larry and John, my Crumley kin, for DNA testing and allowing us to tell their story and share their picture.  You can see by the smiles on their faces that they are truly enjoying their kinship – and that is really what matters.  Genealogy and genetic genealogy has the ability to reunite families separated by more than 200 years and 6 or 7 generations – and that’s exactly what has happened with our Crumley kin.

______________________________________________________________

Disclosure

I receive a small contribution when you click on some of the links to vendors in my articles. This does NOT increase the price you pay but helps me to keep the lights on and this informational blog free for everyone. Please click on the links in the articles or to the vendors below if you are purchasing products or DNA testing.

Thank you so much.

DNA Purchases and Free Transfers

Genealogy Services

Genealogy Research

Autosomal DNA Testing 101 – What Now?

When I first started this blog, my goal was to provide explanations and examples of genetic genealogy topics so that there would be fewer questions and easier answers.

That sounded like a great idea, but the reality of the situation is that the consumer market for autosomal DNA testing has exploded – meaning more and more consumers with more and more questions.  Compounding that situation, the consumers who purchase these tests today, especially on impulse, and mostly I’m referring to Ancestry.com here, often have absolutely no idea what to expect or even what they want except that Ancestry will find their ancestors for them.  That’s because that’s what Ancestry tells them in their advertising.

So, in the big picture, the questions and inquiries that experienced people are currently receiving are becoming less specific and more general and often exhibit a lack of understanding of what DNA testing can do.  It’s frustrating to parties on both sides of the fence, but I’m glad people are asking because it means they are interested and willing to learn.

Rather than approach this topic from a technical perspective of how to work with autosomal DNA, I’d like to talk about what can be done with autosomal DNA testing from a newbie perspective.  The person who just got their results back and are saying to themselves, “OK, now what can I do with this?”

However, there is lots “how to” information in this article for everyone if you click on the links.  If nothing else, this gives you a tool to send to those overly excited newbies who are starry eyed but have no clue how to proceed.  Remember, you were once new too!

This is part 1 of a two part series.  The second part will focus on how to make contact with your matches successfully.  But now, let’s pretend it’s day 1 and you just got your autosomal test results back.

Why Did You Test?

The first question to ask yourself is why did you test in the first place?  If your answer is “because Ancestry had a sale,” that’s fine, but then you’ll need to read all four options to know what you can do with autosomal DNA.

1.  I want to meet other people I’m related to.

Ok, but the first thing here you’re going to have to define is the word “related.”  You are likely related to everyone on your match list.  I said likely, because there may be some people there whose DNA simply matches yours by chance.  For the most part, and especially for those people who are your closest matches, you’re related somehow. The challenge, of course, is to figure out how – meaning through which ancestor.  This is the genealogy jigsaw puzzle of you!

All three of the major vendors, Family Tree DNA, Ancestry and 23andMe show you your closest matches first on your match list.

autosomal 101 FTDNA

Do you want to meet your DNA cousins only if you can identify a common ancestor?  Do you want to work with them on genealogy? The answers to these questions will help sort through the rest of what to do and how.

If your goal is to contact your matches, then Family Tree DNA is the easiest, as they provide you with the e-mail addresses of your matches by clicking on the little envelope for each match on your match page, shown above.

Ancestry is second easiest, but forces you to use their internal message system which often doesn’t deliver the messages.  (Do not send more than 30 in one day or Ancestry will blacklist your messages and block your communications, thinking you are a spammer.)

23andMe is the most difficult as you have to request permission to communicate with each match and also to share DNA and if your match authorizes communication, then you can communicate through 23andMe’s message system.  Sound cumbersome?  It is and the response rate is low.

Confirming Genealogy

Let’s look at another reason for testing.

2.  I want to confirm my genealogy is correct – meaning that my great-grandfather really is my great-grandfather and so forth on up the line.

Well, you’re in luck, especially if some of your cousins, known or otherwise, have tested.  Confirming your genealogy is easier done in closer generations than more distant ones and the more cousins from various lines that have tested, the better.  That’s because you will share more of your DNA with relatives when you have a close common ancestor.

Autosomal DNA is divided approximately in half in each generation, when the child receives half of their DNA from each parent – so the closer your cousin, the more likely you are to share more DNA with them.  The more DNA you share, the more likely you are to be able to identify which ancestor it comes from.  And if a match matches you and your proven cousin both on the same segment, that identifies positively which line that match comes from.  That three way matching is called triangulation.

Let’s talk about the word “confirm.”  Herein lies a challenge, because DNA does have the absolute ability to confirm ancestors, as noted above.  DNA also has the ability to give you hints that go towards a “preponderance of evidence.”  DNA, can also lead you astray if you draw erroneous conclusions – and one vendor provides a tool (or tools) that encourages overstepping conclusions.  Let’s look at each circumstance.

Proof Positive through Triangulation

Just what it says – absolutely unquestionable proof that a particular ancestor is your ancestor.  If you match two other people who also descend from your common ancestors, Joe and Jane Doe, on the same segment of DNA, that is confirmation that you share that ancestor and that segment of your DNA is considered proven to that ancestral line.  This requires two things.  First, that your DNA matches on the same segment AND that you have identified the same ancestors, Joe and Jane Doe, genealogically in your trees.

Now, you probably can’t tell which side of the couple, Jane or Joe, the DNA is from unless you also match two people on just Jane’s side of the family or just Joe’s on that same segment.

One caveat here – counting you and your parent as two of the three people doesn’t work because you and your parents are too close in the tree.  By three people, that would preferably be three people who descend from that couple through three different children.

Here’s an example.

JohnDoe

It would also ideally be more than three people, but three is the minimum to form a triangulation group.  In the real world, these matches might not start and end of the same segments as in the example above, but the overlapping portion should be significant

The example above is proof positive, because the three people descend from the same ancestor, through different children, and match on the same chromosome in the same locations.

This technique is called triangulation.

Now for the bad news – you can’t do this at Ancestry.com, because they don’t provide you with any of the segment information in the last 5 columns.  Ancestry has no chromosome browser, which is the tool that shows you where on your DNA you match your cousins.

Family Tree DNA’s chromosome display tool that is part of their chromosome browser is shown below.

Two cousins browser

On the example above, you can see that Barbara Jean Long, the black background person on the chromosome graphic, is being compared to her two first cousins, the blue and orange on the chromosome graphic.

You can download the information from Family Tree DNA or 23andMe in spreadsheet format, or you can display the information graphically, like in the example above.  You can see the “stacked” locations where both the cousins match the black background person they are being compared to.  You can also see that there are some locations where only one of the cousins matches the background person, like on chromosome 20.  And of course, some locations where neither cousin matches the background person, like on chromosome 21.

If you download that data, the information gives you the locations where the people being compared match the person they are being compared against.

Two cousins combined

The chart above is the download of part of chromosome 1 for Barbara, Cheryl and Donald, siblings who are Barbara’s first cousins.

The areas where the 3 people overlap, or triangulate, are colored in green on the spreadsheet, while the rows entirely in pink or blue do not triangulate – meaning Barbara matches either one cousin or the other, but not both.  Keep in mind that this example only proves their common ancestral couple, which in this case are common grandparents – but the technique is the same no matter which common ancestor you are trying to prove.

This bring us to our next topic, that of close relatives.

Close Relative Matches

I previously said that you can’t use you and a close relative to prove a distant ancestor.  But that’s not necessarily true when the relationship you are trying to prove is closer in time.  The chart below shows the relationships of the example above.

Miller Ferverda chart

In the case shown above, two first cousins who are siblings, Cheryl and Don, are being compared to their common first cousin, Barbara.  Their fathers were siblings and their common ancestors were their grandparents.  This is not 6 generations up a tree where matching is iffy.  You can be expected to match closely with your first cousins where you may not match with more distant cousins, because you simply didn’t inherit any of the same DNA from your distant common ancestor.  You should be sharing about 12.5% of your DNA with first cousins, and if you have first cousins that you’re not matching, that might signal that an undocumented adoption has occurred in one line or the other.

In a case like this, if you and a first cousin match, that suffices to prove a close connection.  If you don’t match, it suffices to raise questions.  A lot of questions.  Big ugly questions.  The next thing to do is to see if any other known cousins have tested and who they match – or don’t match.

For example, if Barbara Ferverda was not the child of John Ferverda, she would not match either Cheryl nor Don, and we’d know there was a problem.  If Cheryl and Don match other Ferverda or Miller relatives and Barbara didn’t, then we’d know the genetic break in the line was on Barbara’s side and not on Cheryl/Don’s side.

This same technique is also how we know which “side” matches are on.  If an unknown match matches both Barbara and Cheryl, for example, it’s a good bet that their common ancestor is someplace in the Miller/Ferverda line.  If they also match another Miller on the same segment, then the common ancestor has been narrowed to the Miller side of the Miller/Ferverda couple.

Unfortunately, not all DNA results are as definitive or easy to prove as these.  Let’s look at some of the more “squishy” results.

Preponderance of Evidence through Aggregated Data

In regular genealogy, there are a range of proofs.  There is direct evidence that someone is the child of an ancestor.  That would be a will, for example, that names a daughter and her husband and maybe even tells where they moved to.  This would be your lucky day!

Think of that will as equivalent to triangulated proof of a common ancestor.  There is just no arguing with the evidence.

If you’re not that lucky, you have to piece the shreds of indirect evidence together to make a story.  In the genealogy world, this is called preponderance of evidence, and I am always, always much less comfortable with this type of evidence than I am with solid proof.

There are various flavors of pieces of evidence in the DNA world. Sometimes we have hints of relationships without proof.

The most common is when you have matches with a group of people who share the same surname, but you can’t get back far enough to find a common ancestor.  Is this a probable match?  Yes?  Guaranteed?  No.  Have I seen them fall apart and the actual match be on another entirely unrelated line?  Yes.  See why I call these squishy?

Ancestry takes this one step further with their DNA Circles.  For a DNA Circle to be created, you must match DNA with someone in the Circle AND everyone in the Circle must match DNA with someone else in the Circle AND everyone in the Circle must have a common ancestor in their tree.  Circles begin with a minimum of three people.  Generally, the more people who match AND have the same ancestor, the stronger the likelihood that you would be able to confirmation the common ancestor of the group as your ancestor too – if you had a chromosome browser type of tool.  Still, Circles alone are not and never will be, proof.  Circles are great hints and along with other research, can confirm genealogical research.  For example, my paper genealogy says I descend from Henry Bolton, and I find myself in Henry Bolton’s tree, matching several other Bolton descendants through Henry’s other children.  Those multiple connections pretty well confirms the paper trail is accurate and no undocumented adoptions have occurred in my line.

Now, the bad news….Circles is predicated upon matching of trees.  If there is a common misconception out there that is replicated in these trees, then people who match will be shown in a Circle predicated on bad information.  And, there is no way to know.  However, people interpret the existence of a DNA Circle as proof positive and that it confirms the tree.  Membership in a DNA Circle is absolutely NOT proof of any kind, let alone proof positive – except that your DNA matches the people who you are connected to by lines and their DNA matches the people they are connected to by lines.  You can see my connections in orange below, and the background connections in light grey.

circle henry bolton matches2

This is an example of my Henry Bolton Circle.  I match 5 different people’s DNA (the orange lines) who also show Henry Bolton as their ancestor.  This does NOT mean the match is on the same segment, so it is NOT triangulated.  This is a grouping of data where multiple people match each other, not a genetic triangulation group where everyone matches on the same segment.  In fact there are cases that I have found where the person I match in a circle is through a different line entirely, so in that case, the presumption of which common ancestor our common DNA is from is incorrect.

I want to be very clear, there is nothing wrong with DNA Circles, so far as they go.  The consumer needs to understand what Circles are really saying – and what they can’t and don’t say.  DNA Circles are another important tool in our arsenal.  We just have to be careful not to assume, or presume, more than is there.  Presuming that we match someone in the Circle because we share Henry Bolton’s DNA may in fact be inaccurate.  We may match on a completely unrelated line – but because we do match and share a common ancestor in our tree – we both find ourselves in the Henry Bolton Circle.

Are you reading those squishy words?  Presume – it’s related to the word assume…right???  And keep in mind that Circles are created based in part on those wonderfully accurate Ancestry trees.  Are you feeling good about this preponderance of evidence yet?

However, in my case, I’ve done due diligence with the genealogy and I have all of my proof ducks in a row.  The fact that I do match so many Bolton descendants confirms my work, along with the fact that at the other vendors and at GedMatch, I  have triangulated my matches and proven the Bolton DNA.  So, this circle is valid but the only proof I have is not found at Ancestry or because I’m a Circle member, but by triangulation and aggregated data using other vendor’s tools.

This next screen shot is of an exact triangulated match using GedMatch’s triangulation tool.  Each line shows me matching two cousins, along with the start and stop segments.  This just happens to be the Ferverda example.  So, I match six people, all on the same segment, all with a known common ancestor.  This is proof positive.  Not all “matching” is nearly so definitive.

Gedmatch triangulation

Sometimes the matches aren’t so neat and tidy. That’s when we move to using aggregated data.

Aggregated Data – What’s That?

Aggregated data is a term I’ve come up with because there isn’t any term to fit in today’s genetic genealogy vocabulary.  In essence, aggregated data is when a group of people (who may or may not know who their common ancestor is) match on common segments of data, but not necessarily on the same segments, or not all of the same segments.  When you have an entire group of these people, they form a stair step “right shift” kind of graph.

The interesting part of this is that by utilizing aggregated data and looking not only at who we match, but who our matches match that share a common ancestor, we can gain insight and hints.  Finding a common ancestor is of course a huge benefit in this type of situation because then you’ve identified at least a DNA “line” for the entire group.

If we were to utilize the triangulation tools at Gedmatch and look at my closest triangulated matches, they would look something like this, where the segments that I match with each person (or in this case, two people) shift some to the right.  What you are seeing is the start and stop match locations, with graphing.  Therefore, I match all of these people that have a common ancestor.

Each match overlaps the one above and below to come extent – and often by a lot.  These are known as triangulation groups (TG).

However, the top match and the bottom match do not overlap, so they don’t triangulate with each other.  They are still valid triangulated matches to me and you can expect to see this kind of matching when using aggregated data.

Understand that when you see your triangulation groups at GedMatch, your mother’s side and your father’s side will be intermixed. In this case, I know the common ancestor and I know many of these testers, so I’m positive that this is a valid grouping (plus, they all match my Mom too – the best test of all.)

gedmatch triang group

Here’s another example only showing three matches.  All three are triangulated to me through the same ancestor, but the locations of the top and bottom matches don’t overlap with each other.  Both overlap the one in the middle in part.

gedmatch overlap

New Ancestor Discoveries – Not Evidence at All

Let’s look at the third reason for DNA testing.

3.  I want to find new ancestors.

Discovering brand new ancestors is a bit tougher.

There are two ways to discover new ancestors.  The first is through triangulation combined with traditional genealogy.  I have done this, but in these cases, I did have a clue as to what I was looking for.  In other words, the new ancestor I discovered was actually confirming a wife’s surname or identifying the parents of an ancestor from several potential candidate couples.

The second way to potentially discover a new ancestor is Ancestry’s New Ancestor Discoveries, NADs, which is really a somewhat misleading name.  What Ancestry has determined is that you match a group of people who share a common ancestor – and Ancestry’s leap of faith is that you share that ancestor do too.  While that may not be correct, what IS very relevant is that you do match this group of people who DO share a common lineage and there is an important hint there for you someplace!  But don’t just accept Ancestry’s discovery as your new ancestor – because there is a good chance it isn’t.  Let’s take a look.

Ancestral Lines Through Triangulation

Let’s go back to the John Doe example.

JohnDoe

Let’s take the worst case scenario.  You’re an adopted and have no information.  But you match an entire group of people in a triangulated group who DO know the identity of their common ancestor.

Does this mean that John Doe is your ancestor?  No.  John Doe could be your ancestor, or he could be the brother of your ancestor, or the uncle of your ancestor.  What this does tell you is that either John Doe is your ancestor, some of John Doe’s ancestors are your ancestors, or you are extremely unlucky and you are matching this entire group by chance.  The larger the segment, the less likely your match will be by chance.  Over 10 cM you’re pretty safe on an individual match and I think you’re safe with triangulated groups well below 10 cM.

Ancestry’s New Ancestor Discoveries

You can make this same type of discovery at Ancestry, but it’s not nearly as easy as Ancestry implies in their ads and you have no segment data to work with, just their match, shown below.

Larimer NAD

“Just take the test and we’ll find your ancestors,” the ad says.  Well, yes and no and “it depends.”

Ancestry went out on a limb a few months ago, right about April Fools Day, and frankly, they fell off the end of the branch by claiming that New Ancestor Discoveries are your missing ancestors found.  While that is clearly an overly optimistic marketing statement, the concept of matching you with people you match who all share a common ancestor is sound – it was the implementation and hyper-marketing that was flawed.

The premise here is that if you match people in a Circle that have a common ancestor, that you too might, please note the word might, share that ancestor – even if that person is not in your tree.  In other words, even if you don’t know who they are.  Just like the John Doe triangulation example above.

Here is my connection to the Larimer DNA Circle, even though I don’t know of a Larimer ancestor.

Larimer NAD circle

Now, the problem is that you might be related to an ancestor on one side upstream several generations, but it’s manifesting itself as a match to that particular couple because several people of that couple’s descendants have tested.  I’ve shown an example of how this might work below.

common unknown ancestor

In this example, you can see that your true common ancestor is unknown to both groups of people, but it’s not Mary Johnson and John Jones, or in my case, not John and Jane Larimer.

However, three descendants of Mary Johnson and John Jones tested, and you match all three.  If you also showed Mary Johnson and John Jones in your tree, then you’d be in a Circle with them at Ancestry.  However, since Mary Johnson and John Jones are NOT your ancestors, they are not in your tree.  Since you match three of their descendants, Ancestry concludes that indeed, Mary Johnson and John Jones must also be your ancestors.

While NADs are inaccurate about half the time, the fact that you do share DNA with the people in this group is important, because someplace, upstream, it’s likely that you share a common ancestor.  It’s also possible that you match these three people through unconnected ancestors upstream and it’s a fluke that they all three also descend from this couple.  And yes, that does happen, especially when all of the people involved have ancestors from the same region.

The first day that Ancestry rolled the New Ancestor Discoveries, I was assigned a couple that could not possibly be my ancestors.  I called them Bad NADs.

In my experience, there are more erroneous NADs out there than good ones.  I knew my original one was bad, as I had proof positive because I have triangulated my other lines.  Then, one day, my bad NAD was gone and now, a few weeks later, I have another assigned NAD couple that I have not been able to prove or disprove – the Larimers.  Truthfully, after the bad NAD fiasco, I haven’t spent a lot of time or effort because without tools, there is no place to go with this unless the people I match will download their results to GedMatch.  I’m hoping that a new tool to be released soon will help.

Here’s how NADs could be useful.  Let’s say that my Larimer matches download to GedMatch and I discover that they also match a triangulated group from my McDowell line.  Well, guess what – my Michael’s McDowell’s wife is unknown.  Might she be a Larimer?  Michael’s mother is also unknown.  Might she be a Larimer?  It gives me a line and a place to begin to work, especially if they share any common geography with my ancestors.

Even if the NADs aren’t my direct ancestors, this is still useful information, because somehow, I probably do connect to these people, even though my hands are somewhat tied.  However, labeling them New Ancestor Discoveries encourages people to jump to highly incorrect conclusions.  This isn’t even in the preponderance of evidence category, let alone proof.  It’s information that you can potentially use with other DNA tools (at GedMatch) and old fashioned genealogy to work on proving a connection to this line.  Nothing more.

So what is the net-net of this? Circles can count in the preponderance of evidence, especially in conjunction with other evidence, but NADs don’t.  Neither are proof.  If we were able to work with the segment data and compare it, we might very well be able to determine more, but Ancestry does not provide a chromosome browser, so we can’t.

Ancestor Chromosome Mapping

4.  I want to map my chromosomes to my ancestors so that I know which of my DNA I inherited from each ancestor.

If this is your DNA testing goal, you certainly did not start by testing with Ancestry.com, because they don’t have any tools to help you do this.  This tends to be a goal that people develop after they really understand what autosomal DNA testing can do for them.  In order to map your genome, you have to have access to segment information and you have to triangulate, or prove, the segments to each ancestor.  So count Ancestry out unless you can talk your matches into downloading their raw data files to either GedMatch or Family Tree DNA.  You’ll be testing with both Family Tree DNA and 23andMe and downloading your match information to a spreadsheet and utilizing the tools at www.gedmatch.com and www.dnagedcom.com.

Just so you get an idea of how much fun this can be, here’s my genome mapped to ancestors a few months ago.  I have more mapped now, but haven’t redone my map utilizing Kitty Cooper’s Tools.

Roberta's ancestor map2

Tips and Tricks for Contact Success

Regardless of which of these goals you had when you tested, or have since developed, now that you know what you can do – most of the options are going to require you to do something – often contacting your matches.

One thing that doesn’t happen is that your new genealogy is not delivered to you gift wrapped and all you have to do is open the box, untie the bow around the scroll, and roll it down the hallway.  That only happens on the genealogy TV shows:)

So join me in a few days for part two of Autosomal DNA Testing 101 – Tips and Tricks for Contact Success.

______________________________________________________________

Disclosure

I receive a small contribution when you click on some of the links to vendors in my articles. This does NOT increase the price you pay but helps me to keep the lights on and this informational blog free for everyone. Please click on the links in the articles or to the vendors below if you are purchasing products or DNA testing.

Thank you so much.

DNA Purchases and Free Transfers

Genealogy Services

Genealogy Research

Parent-Child Non-Matching Autosomal DNA Segments

Recently, I had the opportunity to compare 2 children’s autosomal DNA against both of their parents.  Since children obtain 50% of their DNA from each parent (except for the X chromosome in males), it stands to reason that all valid autosomal matches to these children not only will, but must match one parent or the other.  If not, then the match is not valid – in other words – it’s an identical match by chance.

If you remember, the definition of a match by chance, or IBC (identical by chance) is when someone matches a child but doesn’t match either parent.

This means that the DNA segments, or alleles, just happen to line up so that it reads as a match for the child, by zigzagging back and forth between the DNA of both parents, but it really isn’t a valid genealogical match.

You can read about how this works in my article, How Phasing Works and Determining IBD Versus IBS Matches and also in the article, One Chromosome, Two Sides, No Zipper.

The absolute best way to determine if a match is a valid match or not, valid meaning that the DNA was handed down by ancestors, not a match by chance, is to compare a child’s matches against both parents.  By doing that, we can quickly identify and isolate matches that aren’t real.

IBC

In the example above, you can see that Mom contributed all As to me and Dad contributed all Cs to me.  Joe has alternating As and Cs, so he is a match to me on every location.  However, he only matches my parents on half of their locations, so he is not a match to them, because it’s only chance that caused him to match me on those allele values in that order.

DNA matching programs have to take into consideration both allele values in their match routines, since you carry a value from your mother (A above) and a value from your father (C above), and they are not labeled as to which parent they come from.

Valid matches will also match one parent or the other.  After all, the child received all of their DNA from one parent or the other, so for someone to be a valid genealogical match a child, they must match a parent.

Some time back, when I was matching to my own mother’s DNA, I noticed that I matched her on about 40% of my matches, which left 60% to either be matches to my father or identical by chance.

Notice, I’m not talking about IBS, or identical by state, because that phrase is used to mean both identical by chance and identical by population.  Identical by population means that you did in fact inherit the DNA from an ancestor, but it’s either too far back in time to determine which ancestor, or that segment was present in a specific, probably endogamous population, and you could have inherited it from any number of ancestors.

So, identical by population is identical by descent, but we just can’t tell who we got received that DNA from.

  • IBC – identical by chance – not a valid match – you happen to match someone else on a particular segment, but it’s because the match software is jumping back and forth from your mother’s side to your father’s side.
  • IBD – Identical by descent – you share a common segment of DNA because you and another person(s) inherited that DNA segment from a common ancestor who you can identify
  • IBS – Identical by state – currently used to be both IBC and IBS, where IBS means that you did inherit this DNA from a common ancestor, but it’s so far back you can’t determine who, or that segment is so common within a particular population you could have inherited it from a number of people.

Now a 60-40 parental split is certainly possible, especially if one parent was from an endogamous population, which would mean more matches, or one parent was more recently immigrated from the old country, which would mean fewer matches.

However, without my father’s DNA, which is not available, we’ll never know.

Since that time, I have obtained access to 2 sets of child plus both parents DNA results, so I wanted to take a look at how IBD versus IBC stacked up.  These comparisons were done at Family Tree DNA.

Total Matches Non-Matching Either Parent Percent Non-Matching
Child 1 959 133 13.9
Child 2 1037 133 12.8

Based on other evidence I’ve seen, this percentage seems about right, but the amount of shared DNA and the largest segment size surprised me.  Keep in mind that the smallest possible segment size is 7cM which is Family Tree DNA’s lowest single segment threshold to be counted as a match (assuming you meet the 20cM total threshold first.)  If you match, they show you your matching DNA down to 1cM, but these tables are measurements by the 7cM matching criteria only.

In plain English, this means that in this case, 12% and 13% of these matches were identical by chance, or false matches.  These matches included people who shared up to 57cM of data and the largest block was 15cM.

Largest Shared cM Largest Longest Block
Child 1 46.87 14.38
Child 2 57.06 15.18

Could something else be causing this?  Certainly.  Some of these non-matches could be read errors in the files.  I’d certainly want to take a look at that if any of these became critical.  Another possibility could be that valid match segments are “stitched together” by IBC segments creating longer segments in the child.

An alternative to check validity would be to download the files to GedMatch and see if the pattern continues using the same match criteria.  Of course, testing at multiple labs and downloading the results to compare at GedMatch likely removes the issue of read errors in the first set of files.  And if you really, REALLY, want to know, you can look at the raw data files themselves.

Just so you know, this wasn’t an anomaly with just one high read.  Here are the highest 25 entries from Child 2, or about one fifth of her total mismatches.  Only a few were in the 3-5th cousin range.  None were closer.  Most were 4th or 5th to remote.

non-parent matching relationship range

If you want to do these comparisons yourself, they are easy to do if you have a child and both parents who have tested at Family Tree DNA.

On your Family Finder matches page, at the bottom, in the right corner, there is a button to download matches.

download button

I download the matches into separate spreadsheets for the child, mother and father.  I then color all of the rows pink in the mother’s results, and blue in the father’s results, then copy all three to a common spreadsheet.  You can then sort on the match name and this is what you’ll see.

non-match example

What you’re looking for is white (child) rows that don’t match either a blue row (father) or a pink row (mother.)  Don’t worry about pink or blue rows that don’t have matches. It’s normal for the DNA not to be passed to the child part of the time, so these are expected.

In this example, all white rows matched one parent or the other, except for Winnie Whines.  I colored this row red and added the Comment column where I entered the number of this non-matching entry.  When I’m finished comparing and coloring, then all I have to do is sort that column, bringing all of the nonmatching rows together.  I copied those nonmatching entries into a separate sheet so I could sort those alone and obtained the largest shared and longest segments.  To determine the percent, just divide the total number of nonmatches, in this case, 133, by the child’s total number of matches, in this case, 959, giving a non-parent-match percentage of 13.9%.

So, the take-home message is that not all small segment matches are genealogically irrelevant and not all larger segment matches are genealogically relevant.  Thank goodness we have tools and processes to begin to tell the difference.

So, if you don’t have both parents to compare to, and you’re wondering why you just can’t find a common ancestor with someone you match, the answer might be that they fall into your 12 or 13% that are IBC matches.

If you perform this little exercise, comparing a child to both parents, please feel free to post your results in the comments section along with any commentary about endogamous populations or special circumstances.  It really doesn’t take long, probably about an hour total, and the results are really interesting.  Plus, you’ll have eliminated all those irrelevant matches.

I’ll be writing more about this interesting experiment in coming days.

______________________________________________________________

Disclosure

I receive a small contribution when you click on some of the links to vendors in my articles. This does NOT increase the price you pay but helps me to keep the lights on and this informational blog free for everyone. Please click on the links in the articles or to the vendors below if you are purchasing products or DNA testing.

Thank you so much.

DNA Purchases and Free Transfers

Genealogy Services

Genealogy Research

A Study Utilizing Small Segment Matching

There has been quite a bit of discussion in the last several weeks, both pro and con, about how to use small matching DNA segments in genetic genealogy.  A couple of people are even of the opinion that small segments can’t be used at all, ever.  Others are less certain and many of us are working our way through various scenarios.  Evidence certainly exists that these segments can be utilized.

I’ve been writing foundation articles, in preparation for this article, for several weeks now.  Recently, I wrote about how phasing works and determining IBD versus IBS matches and included guidelines for telling the difference between the different kinds of matches.  If you haven’t read that article, it’s essential to understanding this article, so now would be a good time to read or review that article.

I followed that with a step by step article, Demystifying Autosomal DNA Matching, on how to do phasing and matching in combination with the guidelines about how to determine IBD (identical by descent) versus IBS (identical by chance) and identical by population matches when evaluating your own matches.

Now that we understand IBS, IBD, Phasing and how matching actually works on a case by case basis, let’s look at applying those same matching and IBS vs IBD guidelines to small data segments as well.

A Little History

So those of you who haven’t been following the discussion on various blogs and social media don’t feel like you’ve been dropped into the middle of a conversation with no context, let me catch you up.

On Thanksgiving Day, I published an article about identifying one of my ancestors, after many years of trying, Sarah Hickerson.

That article spurred debate, which is just fine when the debate is about the science, but it subsequently devolved into something less pleasant.  There are some individuals with very strong opinions that utilizing small segments of DNA data can “never be done.”

I do not agree with that position.  In fact, I strongly disagree and there are multiple cases with evidence to support small segments being both accurate and useful in specific types of genealogical situations.  We’ll take a look at several.

I do agree that looking at small segment data out of context is useless.  To the best of my knowledge, no genealogist begins with their smallest segments and tries to assemble them, working from the bottom up.  We all begin with the largest segments, because they are the most useful and the closest connections in our tree, and work our way down.  Generally, we only work with small segments when we have to – and there are times that’s all we have.  So we need to establish guidelines and ways to know if those small segments are reliable or not.  In other words, how can we draw conclusions and how much confidence can we put in those conclusions?

Ultimately, whether you choose to use or work with small segment data will be your own decision, based on your own circumstances.  I simply wanted to understand what is possible and what is reasonable, both for my own genealogy and for my readers.

In my projects, I haven’t been using small segment data out of context, or randomly.  In other words, I don’t just pick any two small segment matches and infer or decide that they are valid matches.  Fortunately, by utilizing the IBD vs IBS guidelines, we have tools to differentiate IBD (Identical by Descent) segments from IBS (Identical by State) by chance segments and IBD/IBS by population for matching segments, both large and small.

Studying small segment data is the key to determining exactly how small segments can reasonably be utilized.  This topic probably isn’t black or white, but shades of gray – and assuming the position that something can’t be done simply assures that it won’t be.

I would strongly encourage those involved and interested in this type of research to retain those small segments, work with them and begin to look for patterns.  The only way we, as a community, are ever going to figure out how to work with small segments successfully and reliably is to, well, work with them.

Discussing the science and scenarios surrounding the usage of small data segments in various different situations is critical to seeing our way through the forest.  If the answers were cast in concrete about how to do this, we wouldn’t be working through this publicly today.

Negative personal comments and inferences have no place in the scientific community.  It discourages others from participating, and serves to stifle research and cooperation, not encourage it.  I hope that civil scientific discussions and comparisons involving small segment data can move forward, with decorum, because they are critically needed in order to enhance our understanding, under varying circumstances, of how to utilize small segment data.  As Judy Russell said, disagreeing doesn’t have to be disagreeable.

Two bloggers, Blaine Bettinger and CeCe Moore wrote articles following my Hickerson article.  Blaine subsequently wrote a second article here.  Felix Immanuel wrote articles here and here.

A few others have weighed in, in writing, as well although most commentary has been on Facebook.  Israel Pickholtz, a professional genealogist and genetic consultant, stated on his blog, All My Foreparents, the following:

It is my nature to distrust rules that put everything into a single category and that’s how I feel about small segments. Sometimes they are meaningful and useful, sometimes not.

When I reconstructed my father’s DNA using Lazerus (described last week in Genes From My Father), I happily accepted all small segments of whatever size because those small segments were in the DNA of at least one of his children and at least one of his brother/sister/first cousin. If I have a particular small segment, I must have received it from my parents. If my father’s brother (or sister) has it as well, then it is eminently clear to me that I got it from my father and that it came to him and his brother from my grandfather. And it is not reasonable to say that a sliver of that small segment might have come from my mother, because my father’s people share it.

After seeing Israel’s commentary about Lazarus, I reconstructed the genome of both Roscoe and John Ferverda, brothers, which includes both large and small segments.  Working with the Ferverda DNA further, I wrote an article, Just One Cousin, about matching between two siblings and a first cousin, which includes lots of small data segments, some of which were proven to triangulate, meaning they are genuine, and some which did not.  There are lots more examples in the demystifying article, as well.

What Not To Do 

Before we begin, I want to make it very clear that am not now, and never have, advocated that people utilize small data segments out of context of larger matching segments and/or at least suspected matching genealogy.  For example, I have never implied or even hinted that anyone should go to GedMatch, do a “one to many” compare at 1 cM and then contact people informing them that they are related.  Anyone who has extrapolated what I’ve written to mean that either simply did not understand or intentionally misinterpreted the articles.

Sarah Hickerson Revisited

If I thought Sarah Hickerson caused me a lot of heartburn in the decades before I found her, little did I know how much heartburn that discovery would cause.

Let’s go back to the Sarah Hickerson article that started the uproar over whether small data segments are useful at all.

In that article, I found I was a member of a new Ancestry DNA Circle for Charles Hickerson and Mary Lytle, the parents of Sarah Hickerson.

Ancestry Hickerson match

Because there are no tools at Ancestry to prove DNA connections, I hurried over to Family Tree DNA looking for any matches to Hickersons for myself and for my Vannoy cousins who also (potentially) descended from this couple.  Much to my delight, I found  several matches to Hickersons, in fact, more than 20 – a total of 614 rows of spreadsheet matches when I included all of my Vannoy cousins who potentially descend from this couple to their Hickerson matches.  There were 64 matching clusters of segments, both small and large.  Some matches were as large as 20cM with 6000 SNPs and more than 20 were over 10cM with from 1500 to 6000 SNPs.  There were also hundreds of small segments that matched (and triangulated) as well.

By the time I added in a few more Vannoy cousins that we’ve since recruited, the spreadsheet is now up to 1093 rows and we have 52 Vannoy-Hickerson TRIANGULATED CLUSTERS utilizing only Family Tree DNA tools.

Triangulated DNA, found in 3 or more people at the same location who share a common ancestor is proven to be from that ancestor (or ancestral couple.)  This is the commonly accepted gold standard of autosomal DNA triangulation within the industry.

Here’s just one example of a cluster of three people.  Charlene and Buster are known (proven, triangulated) cousins and Barbara is a descendant of Charles Hickerson and Mary Lytle.

example triang

What more could you want?

Yes, I called this a match.  As far as I’m concerned, it’s a confirmed ancestor.  How much more confirmed can you get?

Some clusters have as many as 25 confirmed triangulated members.

chr 13 group

Others took issue with this conclusion because it included small segment data.  This seems like the perfect opportunity in which to take a look at how small segments do, or don’t stand up to scrutiny.  So, let’s do just that.  I also did the same type of matching comparison in a situation with 2 siblings and a known cousin, here.

To Trash…or Not To Trash

Some genetic genealogists discard small segments entirely, generally under either 5 or 7cM, which I find unfortunate for several reasons.

  1. If a person doesn’t work with small segments, they really can’t comment on the lack of results, and they’ll never have a success because the small segments will have been discarded.
  2. If a person doesn’t work with small segments, they will never notice any trends or matches that may have implications for their ancestry.
  3. If a person doesn’t work with small segments, they can’t contribute to the body of evidence for how to reasonably utilize these segments.
  4. If a person doesn’t work with small segments, they may well be throwing the baby out with the bathwater, but they’ll never know.
  5. They encourage others to do the same.

The Sarah Hickerson article was not meant as a proof article for anything – it was meant to be an article encouraging people to utilize genetic genealogy for not only finding their ancestor and proving known connections, but breaking down brick walls.  It was pointing the way to how I found Sarah Hickerson.  It was one of my 52 Ancestors Series, documenting my ancestors, not one of the specifically educational articles.  This article is different.

If you are only interested in the low hanging fruit, meaning within the past 5 or 6 generations, and only proving your known pedigree, not finding new ancestors beyond that 5-6 generation level, then you can just stop reading now – and you can throw away your small segments.  But if you want more, then keep reading, because we as a community need to work with small segment data in order to establish guidelines that work relative to utilizing small segments and identifying the small segments that can be useful, versus the ones that aren’t.

I do not believe for one minute that small segments are universally useless.  As Israel said, if his family did not receive those segments from a common family member, then where did they all get those matching segments?

In fact, utilizing triangulated and proven DNA relationships within families is how adoptees piece together their family trees, piggybacking off of the work of people with known pedigrees that they match genetically.  My assumption had been that the adoptee community utilized only large DNA segments, because the larger the matching segments, generally the closer in time the genealogy match – and theoretically the easier to find.

However, I discovered that I was wrong, and the adoptee community does in fact utilize small segments as well.  Here’s one of the comments posted on my Chromosome Browser War blog article.

“Thanks for the well thought out article, Roberta, I have something to add from the folks at DNAadoption. Adoptees are not just interested in the large segments, the small segments also build the proof of the numerous lines involved. In addition, the accumulation of surnames from all the matches provides a way to evaluate new lines that join into the tree.”

Diane Harman-Hoog (on behalf of the 6 million adoptees in this country, many of who are looking for information on medical records and family heritage).

Diane isn’t the only person who is working with small segment data.  Tim Janzen works with small segments, in particular on his Mennonite project, and discusses small segments on the ISOGG WIKI Phasing page.  Here is what Tim has to say:

“One advantage of Family Finder is that FF has a 1 cM threshold for matching segments. If a parent and a child both have a matching segment that is in the 2 to 5 cM range and if the number of matching SNPs is 500 or more then there is a reasonably high likelihood that the matching segment is IBD (identical by descent) and not IBS (identical by state).”

The same rules for utilizing larger segment data need to be applied to small segment data to begin with.

Are more guidelines needed for small segments?  I don’t know, but we’ll never know if we don’t work with many individual situations and find the common methods for success and identify any problematic areas.

Why Do Small Segments Matter?

In some cases, especially as we work beyond the 6 generation level, small segments may be all we have left of a specific ancestor.  If we don’t learn to recognize and utilize the small segments available to us, those ancestors, genetically speaking, will be lost to us forever.

As we move back in time, the DNA from more distant ancestors will be divided into smaller and smaller segments, so if we ever want the ability to identify and track those segments back in time to a specific ancestor, we have to learn how to utilize small segment data – and if we have deleted that data, then we can’t use it.

In my case, I have identified all of my 5th generation ancestors except one, and I have a strong lead on her.  In my 6th generation, however, I have lots of walls that need to be broken through – and DNA may be the only way I’ll ever do that.

Let’s take a look at what I can expect when trying to match people who also descend from an ancestor 5 generations back in time.  If they are my same generation, they would be my fourth cousins.

Based on the autosomal statistics chart at ISOGG, 4th cousins, on the average, would expect to share about 13.28 cM of DNA from their common ancestor.  This would not be over the match threshold at FTDNA of approximately 20 cM total, and if those segments were broken into three pieces, for example, that cousin would not show as a match at either FTDNA or 23andMe, based on the vendors’ respective thresholds.

% Shared DNA Expected Shared cM Relationship
0.781% 53.13 Third cousins, common ancestor is 4 generations back in time
0.391% 26.56 Third cousins once removed
20 cm Family Tree DNA total cM Threshold
0.195% 13.28 Fourth cousins, common ancestor is 5 generations back in time
7 cM 23andMe individual segment cM match threshold
0.0977% 6.64 Fourth cousins once removed
0.0488% 3.32 Fifth cousins, common ancestor is 6 generations back in time
0.0244 1.66 Fifth cousins once removed

If you’re lucky, as I was with Hickerson, you’ll match at least some relative who carries that ancestral DNA line above the threshold, and then they’ll match other cousins above the threshold, and you can build a comparison network, linking people together, in that fashion.  And yes you may well have to utilize GedMatch for people testing at various different vendors and for those smaller segment comparisons.

For clarification, I have never “called” a genealogy match without supporting large segment data.  At the vendors, you can’t even see matches if they don’t have larger segments – so there is no way to even know you would match below the threshold.

I do think that we may be able to make calls based on small segments, at least in some instances, in the future.  In fact, we have to figure out how to do this or we will rarely be able to move past the 5th or 6th generation utilizing genetics.

At the 5th generation, or third cousins, one expects to see approximately 26 cM of matching DNA, still over the threshold (if divided correctly), but from that point further back in time, the expected shared amount of DNA is under the current day threshold.  For those who wonder why the vendors state that autosomal matches are reliable to about the 5th or 6th generation, this is the answer.

I do not discount small segments without cause.  In other words, I don’t discount small segments unless there is a reason.  Unless they are positively IBS by chance, meaning false, and I can prove it, I don’t disregard them.  I do label them and make appropriate notes.  You can’t learn from what’s not there.

Let me give you an example.  I have one area of my spreadsheet where I have a whole lot of segments, large and small, labeled Acadian.  Why?  Because the Acadians are so intermarried that I can’t begin to sort out the actual ancestor that DNA came from, at least not yet…so today, I just label them “Acadian.”

This example row is from my master spreadsheet.  I have my Mom’s results in my spreadsheet, so I can see easily if someone matches me and Mom both. My rows are pink.  The match is on Mom’s side, which I’ve color coded purple.  I don’t know which ancestor is the most recent common ancestor, but based on the surnames involved, I know they are Acadian.  In some cases, on Acadian matches, I can tell the MRCA and if so, that field is completed as well.

Me Mom acadian

As a note of interest, I inherited my mother’s segment intact, so there was no 50% division in this generation.

I also have segments labeled Mennonite and Brethren.  Perhaps in the future I’ll sort through these matches and actually be able to assign DNA segments to specific ancestors.  Those segments aren’t useless, they just aren’t yet fully analyzed.  As more people test, hopefully, patterns will emerge in many of these DNA groupings, both small and large.

In fact, I talked about DNA patterns and endogamous populations in my recent article, Just One Cousin.

For me, today, some small segment matches appear to be central European matches.  I say “appear to be,” because they are not triangulated.  For me this is rather boring and nondescript – but if this were my African American client who is trying to figure out which line her European ancestry came from, this could be very important.  Maybe she can map these segments to at least a specific ancestral line, which she would find very exciting.

Learning to use small segments effectively has the potential to benefit the following groups of people:

  • People with colonial ancestry, because all that may be left today of colonial ancestors is small segments.
  • People looking to break down brick walls, not just confirm currently known ancestors.
  • People looking for minority ancestors more than 5 or 6 generations back in their trees.
  • Adoptees – although very clearly, they want to work with the largest matches first.
  • People working with ethnic identification of ancestors, because you will eventually be able to track ethnicity identifying segments back in time to the originating ancestor(s).

Conversely, people from highly endogamous groups may not be helped much, if at all, by small segments because they are so likely to be widely shared within that population as a group from a common ancestor much further back in time.  In fact, the definition of a “small segment” for people with fully endogamous families might be much larger than for someone with no known endogamy.

However, if we can identify segments to specific populations, that may help the future accuracy of ethnicity testing.

Let’s go back and take a look at the Hickerson data using the same format we have been using for the comparisons so far.

Small Segment Examples

These Hickerson/Vannoy examples do not utilize random small segment matches, but are utilizing the same matching rules used for larger matches in conjunction with known, triangulated cousin groups from a known ancestor.  Many cousins, including 2 brothers and their uncle all carry this same DNA.  Like in Israel’s case, where did they get that same DNA if not from a common ancestor?

In the following examples, I want to stress that all of the people involved DO HAVE LARGER SEGMENT MATCHES on other chromosomes, which is how we knew they matched in the first place, so we aren’t trying to prove they are a match.  We know they are.  Our goal is to determine if small segments are useful in the same situation, proving matches, as with larger segments.  In other words, do the rules hold true?  And how do we work with the data?  Could we utilize these small segment matches if we didn’t have larger matching segments, and if so, how reliable would they be?

There is a difference between a single match and a triangulated group:

  • Matches between two people are suggestive of a common ancestor but could be IBS by chance or population..
  • Multiple matches, such as with the 6 different Hickersons who descend from Charles Hickerson and Mary Lytle, both in the Ancestry DNA Circle and at Family Tree DNA, are extremely suggestive of a specific common ancestor.
  • Only triangulated groups are proof of a common ancestor, unless the people are  closely related known relatives.

In our Hickerson/Vannoy study, all participants match at least to one other (but not to all other) group members at Family Tree DNA which means they match over the FTDNA threshold of approximately 20 cM total and at least one segment over 7.7cM and 500 SNPs or more.

In the example below, from the Hickerson article, the known Vannoy cousins are on the left side and the Hickerson matches to the Vannoy cousins are across the top.  We have several more now, but this gives you an idea of how the matching stacked up initially.  The two green individuals were proven descendants from Charles Hickerson and Mary Lytle.

vannoy hickerson higginson matrix

The goal here is to see how small data segments stack up in a situation where the relationship is distant.  Can small segments be utilized to prove triangulation?  This is slightly different than in the Just One Cousin article, where the relationship between the individuals was close and previously known.  We can contrast the results of that close relationship and small segments with this more distant connection and small segments.

Sarah Hickerson and Daniel Vannoy

The Vannoy project has a group of about a dozen cousins who descend from Elijah Vannoy who have worked together to discover the identify of Elijah’s parents.  Elijah’s father is one of 4 Vannoy men, all sons of the same man, found in Wilkes County, NC. in the late 1700s.  Elijah Vannoy is 5 generations upstream from me.

What kind of evidence do we have?  In the paper genealogy world, I have ruled out one candidate via a Bible record, and probably a second via census and tax records, but we have little information about the third and fourth candidates – in spite of thoroughly perusing all existent records.  So, if we’re ever going to solve the mystery, short of that much-wished-for Vannoy Bible showing up on e-Bay, it’s going to have to be via genetic genealogy.

In addition to the dozen or so Vannoy cousins who have DNA tested, we found 6 individuals who descend from Sarah Hickerson’s parents, Charles Hickerson and Mary Lytle who match various Vannoy cousins.  Additionally, those cousins match another 21 individuals who carry the Hickerson or derivative surnames, but since we have not proven their Hickerson lineage on paper, I have not utilized any of those additional matches in this analysis.  Of those 26 total matches, at Family Tree DNA, one Hickerson individual matches 3 Vannoy cousins, nine Hickerson descendants match 2 Vannoy cousins and sixteen Hickerson descendants match 1 Vannoy cousin.

Our group of Vannoy cousins matching to the 6 Charles Hickerson/Mary Lytle descendants contains over 60 different clusters of matching DNA data across the 22 chromosomes.  Those 6 individuals are included in 43 different triangulated groups, proving the entire triangulation group shares a common ancestor.  And that is BEFORE we add any GedMatch information.

If that sounds like a lot, it’s not.  Another recent article found 31 clusters among siblings and their first cousin, so 60 clusters among a dozen known Vannoy cousins and half a dozen potential Hickerson cousins isn’t unusual at all.

To be very clear, Sarah Hickerson and Daniel Vannoy were not “declared” to be the parents of Elijah Vannoy, born in 1784, based on small segment matches alone.  Larger segment matches were involved, which is how we saw the matches in the first place.  Furthermore, the matches triangulated.  However, small segments certainly are involved and are more prevalent, of course, than large segments.  Some cousins are only connected by small segments.  Are they valid, and how do we tell?  Sometimes it’s all we have.

Let me give you the classic example of when small segments are needed.

We have four people.  Person A and B are known Vannoy cousins and person C and D are potential Hickerson cousins.  Potential means, in this case, potential cousins to the Vannoys.  The Hickersons already know they both descend from Charles Hickerson and Mary Lytle.

  • Person A matches person C on chromosome 1 over the matching threshold.
  • Person B matches person D on chromosome 2 over the matching threshold.

Both Vannoy cousins match Hickerson cousins, but not the same cousin and not on the same segments at the vendor.  If these were same segment matches, there would be no question because they would be triangulated, but they aren’t.

So, what do we do?  We don’t have access to see if person C and D match each other, and even if we did, they don’t match on the same segments where they match persons A and B, because if they did we’d see them as a match too when we view A and B.

If person A and B don’t match each other at the vendor, we’re flat out of luck and have to move this entire operation to GedMatch, assuming all 4 people have or are willing to download their data.

a and b nomatch

If person A and B match each other at the vendor, we can see their small segment data as compared to each other and to persons C and D, respectively which then gives us the ability to see if A matches C on the same small segment as B matches D.

a and b match

If we are lucky, they will all show a common match on a small segment – meaning that A will match B on a small segment of chromosome 3, for example, and A will match C on that same segment.  In a perfect world, B will also match D on that same segment, and you will have 4 way triangulation – but I’m happy with the required 3 way match to triangulate.

This is exactly what happened in the article, Be Still My H(e)art.  As you can see, three people match on chromosomes 1 and 8, below – two of whom are proven cousins and the third was the wife surname candidate line.

Younger Hart 1-8

The example I showed of chromosome 2 in the Hickerson article was where all participants of the 5 individuals shown on the chromosome browser were matching to the Vannoy participant.  I thought it was a good visual example.  It was just one example of the 60+ clusters of cousin matches between the dozen Vannoy cousins and 6 Hickerson descendants.

This example was criticized by some because it was a small segment match.  I should probably have utilized chromosome 15 or searched for a better long segment example, but the point in my article was only to show how people that match stack up together on the chromosome browser – nothing more.   Here’s the entire chromosome, for clarity.

hickerson vannoy chr 2

Certainly, I don’t want to mislead anyone, including myself.  Furthermore, I dislike being publicly characterized as “wrong” and worse yet, labeled “irresponsible,” so I decided to delve into the depths of the data and work through several different examples to see if small segment data matching holds in various situations.  Let’s see what we found.

Chromosome 15

I selected chromosome 15 to work with because it is a region where a lot of Vannoy descendants match – and because it is a relatively large segment.  If the Hickersons do match the Vannoys, there’s a fairly good change they might match on at least part of that segment.  In other words, it appears to be my best bet due to sheer size and the number of Elijah Vannoy’s descendants who carry this segment.  In addition to the 6 individuals above who matched on chromosome 15, here are an additional 4.  As you can see, chromosome 15 has a lot of potential.

Chrom 15 Vannoy

The spreadsheet below shows the sections of chromosome 15 where cousins match.  Green individuals in the Match column are descendants of Charles Hickerson and Mary Lytle, the parents of Sarah Hickerson.  The balance are Vannoys who match on chromosome 15.

chr 15 matches ftdna v4

As you can see, there are several segments that are quite large, shown in yellow, but there are also many that are under the threshold of 7cM, which are all  segments that would be deleted if you are deleting small segments.  Please also note that if you were deleting small segments, all of the Hickerson matches would be gone from chromosome 15.

Those of you with an eagle eye will already notice that we have two separate segments that have triangulated between the Vannoy cousins and the Hickerson descendants, noted in the left column by yellow and beige.  So really, we could stop right here, because we’ve proven the relationship, but there’s a lot more to learn, so let’s go on.

You Can’t Use What You Can’t See

I need to point something out at this point that is extremely important.

The only reason we see any segment data below the match threshold is because once you match someone on a larger segment at Family Tree DNA, over the threshold, you also get to view the small segment data down to 1cM for your match with that person. 

What this means is that if one person or two people match a Hickerson descendant, for example you will see the small segment data for their individual matches, but not for anyone that doesn’t match the participant over the matching threshold.

What that means in the spreadsheet above, is that the only Hickerson that matches more than one Vannoy (on this segment) is Barbara – so we can see her segment data (down to 1cM ) as compared to Polly and Buster, but not to anyone else.

If we could see the smaller segment data of the other participants as compared to the Hickerson participants, even though they don’t match on a larger segment over the matching threshold, there could potentially be a lot of small segment data that would match – and therefore triangulate on this segment.

This is the perfect example of why I’ve suggested to Family Tree DNA that within projects or in individuals situations, that we be allowed to reduce the match threshold – especially when a specific family line match is suspected.

This is also one of the reasons why people turn to GedMatch, and we’ll do that as well.

What this means, relative to the spreadsheet is that it is, unfortunately, woefully incomplete – and it’s not apples to apples because in some cases we have data under the match threshold, and in some, we don’t.  So, matches DO count, but nonmatches where small segment data is not available do NOT count as a non-match, or as disproof.  It’s only negative proof IF you have the data AND it doesn’t match.

The Vannoys match and triangulate on many segments, so those are irrelevant to this discussion other than when they match to Hickerson DNA.  William (H), descends from two sons of Charles Hickerson and Mary Lytle.  Unfortunately, he only matches one Vannoy, so we can only see his small segments for that one Vannoy individual, William (V).  We don’t know what we are missing as compared to the rest of the Vannoy cousins.

To see William (H)’s and William (V)’s DNA as compared to the rest of the Vannoy cousins, we had to move to GedMatch.

Matching Options

Since we are working with segments that are proven to be Vannoy, and we are trying to prove/disprove if Daniel Vannoy and Sarah Hickerson are the parents of Elijah through multiple Hickerson matches, there are only a few matching options, which are:

  1. The Hickerson individuals will not triangulate with any of the Vannoy DNA, on chromosome 15 or on other chromosomes, meaning that Sarah Hickerson is probably not the mother of Elijah Vannoy, or the common ancestor is too far back in time to discern that match at vendor thresholds.
  2. The Hickerson individuals will not triangulate on this segment, but do triangulate on other segments, meaning that this segment came entirely from the Vannoy side of the family and not the Hickerson side of the family. Therefore, if chromosome 15 does not triangulate, we need to look at other chromosomes.
  3. The Hickerson individuals triangulate with the Vannoy individuals, confirming that Sarah Hickerson is the mother of Elijah Vannoy, or that there is a different common unknown ancestor someplace upstream of several Hickersons and Vannoys.

All of the Vannoy cousins descend from Elijah Vannoy and Lois McNiel, except one, William (V), who descends from the proven son of Sarah Hickerson and Daniel Vannoy, so he would be expected to match at least some Hickerson descendants.  The 6 Hickerson cousins descend from Charles Hickerson and Mary Lytle, Sarah’s parents.

hickerson vannoy pedigree

William (H), the Hickerson cousin who descends from David, brother to Sarah Hickerson, is descended through two of David Hickerson’s sons.

I decided to utilize the same segment “mapping comparison” technique with a spreadsheet that I utilized in the phasing article, because it’s easy to see and visualize.

I have created a matching spreadsheet and labeled the locations on the spreadsheet from 25-100 based on the beginning of the start location of the cluster of matches and the end location of the cluster.

Each individual being compared on the spreadsheet below has a column across the top.  On the chart below, all Hickerson individuals are to the right and are shown with their cells highlighted yellow in the top row.

Below, the entire colorized chart of chromosome 15 is shown, beginning with location 25 and ending with 100, in the left hand column, the area of the Vannoy overlap.  Remember, you can double click on the graphics to enlarge.  The columns in this spreadsheet are not fully expanded below, but they are in the individual examples.

entire chr 15 match ss v4

I am going to step through this spreadsheet, and point out several aspects.

First, I selected Buster, the individual in the group to begin the comparison, because he was one of the closest to the common ancestor, Elijah Vannoy, genealogically, at 4 generations.  So he is the person at Family Tree DNA that everyone is initially compared against.

Everyone who matches Buster has their matching segments shown in blue.  Buster is shown furthest left.

When participants match someone other than Buster, who they match on that segment is typed into their column.  You can tell who Buster matches because their columns are blue on matching locations.  Here’s an example.

Me Buster match

You can see that in my column, it’s blue on all segments which means I match Buster on this entire region.  In addition, there are names of Carl, Dean, William Gedmatch and Billie Gedmatch typed into the cell in the first row which means at that location, in addition to Buster, I also match Carl and Dean at Family Tree DNA and William (descended from the son of Daniel Vannoy and Sarah Hickerson) at Gedmatch and Billie (a Hickerson) at Gedmatch.  Their name is typed into my column, and mine into theirs.  Please note that I did not run everyone against everyone at GedMatch.  I only needed enough data to prove the point and running many comparisons is a long, arduous process even when GedMatch isn’t experiencing problems.

On cells that aren’t colorized blue, the person doesn’t match Buster, but may still match other Vannoy cousin segments.  For example, Dean, below, matches Buster on location 25-29, along with some other cousins.  However, he does not match Buster on location 30 where he instead matches Harold and Carl who also don’t match Buster at that location. Harold, Carl and Dean do, however, all descend from the same son of Elijah so they may well be sharing DNA from a Vannoy wife at this location, especially since no one who doesn’t share that specific wife’s line matches those three at this location.

Me Buster Dean match

Remember, we are not working with random small data segments, but with a proven matching segment to a common Vannoy ancestor, with a group of descendants from a possible/probable Hickerson ancestor that we are trying to prove/disprove.  In other words, you would expect either a lot of Hickerson matches on the same segments, if Hickerson is indeed a Vannoy ancestral family, or virtually none of them to match, if not.

The next thing I’d like to point out is that these are small segments of people who also have larger matching segments, many of whom do triangulate on larger segments on other chromosomes.  What we are trying to discern is whether small segment matches can be utilized by employing the same matching criteria as large segment matching.  In other words, is small segment data valid and useful if it meets the criteria for an IBD match?

For example, let’s look at Daniel.  Daniel’s segments on chromosome 15, were it not for the fact that he matches on larger segments on other chromosomes, would not be shown as matches, because they are not individually over the match threshold.

Look at Daniel’s column for Polly and Warren.

Daniel matches 2

The segments in red show a triangulated group where Daniel and Warren, or Daniel, Warren and Polly match.  The segments where all 3 match are triangulated.

This proves, unquestionably, that small segments DO match utilizing the normal prescribed IBD matching criteria.  This spreadsheet, just for chromosome 15, is full of these examples.

Is there any reason to think that these triangulated matches are not identical by descent?  If they are not IBD, how do all of these people match the same DNA? Chance alone?  How would that be possible?  Two people, yes, maybe, but 3 or more?  In some cases, 5 or 6 on the same segment?  That is simply not possible, or we have disproven the entire foundation that autosomal DNA matching is based upon.

The question will soon be asked if small segments that triangulate can be useful when there are no larger matching segments to put the match over the initial vendor threshold.

Triangulated Groups

As you can see, most of the people and segments on the spreadsheet, certainly the Elijah descendants, are heavily triangulated, meaning that three or more people match each other on the same locations.  Most of this matching is over the vendor threshold at Family Tree DNA.

You can see that Buster, Me, Dean, Carl and Harold all match each other on the same segments, on the left half of the spreadsheet where our names are in each other’s columns.

triangulated groups

Remember when I said that the spreadsheet was incomplete?  This is an example.  David and Warren don’t match each other at a high enough total of segments to get them over the matching threshold when compared to each other, so we can’t see their small segment data as compared to each other.  David matches Buster, but Warren doesn’t, so I can’t even see them both in relationship to a common match.  There are several people who fall into this category.

Let’s select one individual to use as an example.

I’ve chosen the Vannoy cousin, William(V), because his kit has been uploaded to Gedmatch, he has Vannoy matches and because William is proven to descend from Sarah Hickerson and Daniel Vannoy through their son Joel – so we expect some Hickerson DNA to match William(V).

If William (V) matches the Hickersons on the same DNA locations as he matches to Elijah’s descendants, then that proves that Elijah’s descendant’s DNA in that location is Hickerson DNA.

At GedMatch, I compared William(V) with me and then with Dean using a “one to one” comparison at a low threshold, simply because I wanted as much data as I could get.  Family Tree DNA allows for 1 cM and I did the same, allowing 100 SNPs at GedMatch.  Family Tree DNA’s lowest SNP threshold is 500.

In case you were wondering, even though I did lower the GedMatch threshold below the FTDNA minimum, there were 45 segments that were above 1cM and above 500 SNPs when matching me to William(V), which would have been above the lowest match threshold at FTDNA (assuming we were over the initial match threshold.)  In other words, had we not been below the original match threshold (20cM total, one segment over 7.7cM), these segments would have been included at FTDNA as small segments.  As you can see in the chart below, many triangulated.

I colorized the GedMatch matches, where there were no FTDNA matches, in dark red text.  This illustrates graphically just how much is missed when the small segments are ignored in cases with known or probable cousins.  In the green area, the entry that says “Me GedMatch” could not be colorized red (because you can’t colorize only part of the text of a cell) so I added the Gedmatch designation to differentiate between a match through FTDNA and one from GedMatch.  I did the same with all Gedmatch matches, whether colorized or not.

Let’s take a look and see how small segments from GedMatch affect our Hickerson matching.  Note that in the green area, William (V) matches William (H), the Hickerson descendant, and William (V) matches to me and Dean as well.  This triangulates William (V)’s Hickerson DNA and proves that Elijah’s descendants DNA includes proven Hickerson segments.

William (V) gedmatch matches v2

In this next example, I matched William (H), the Hickerson cousin (with no Vannoy heritage) against both Buster and me.

William (H) gedmatch me buster

Without Gedmatch data, only two segments of chromosome 15 are triangulated between Vannoy and Hickerson cousins, because we can’t see the small data segments of the rest of the cousins who don’t match over the threshold.

You can see here that nearly the entire chromosome is triangulated using small segments.  In the chart below, you can see both William(V) and William (H) as they match various Vannoy cousins.  Both triangulate with me.

William V and William H

I did the same thing with the Hickerson descendant, Billie, as compared to both me and Dean, with the same type of results.

The next question would be if chromosome 15 is a pileup area where I have a lot of IBS matches that are really population based matches.  It does not appear to be.  I have identified an area of my chromosomes that may be a pileup area, but chromosome 15 does not carry any of those characteristics.

So by utilizing the small segments at GedMatch for chromosome 15 that we can’t otherwise see, we can triangulate at least some of the Hickerson matches.  I can’t complete this chart, because several individuals have not uploaded to GedMatch.

Why would the Hickerson descendant match so many of the Vannoy segments on chromosome 15?  Because this is not a random sample.  This is a proven Vannoy segment and we are trying to see which parts of this segment are from a potential Hickerson mother or the Vannoy father.  If from the Hickerson mother, then this level of matching is not unexpected.  In fact, it would be expected.  Since we cheated and saw that chromosome 15 was already triangulated at Family Tree DNA, we already knew what to expect.

In the spreadsheet below, I’ve added the 2 GedMatch comparisons, William (V) to me and Dean, and William (H) to me and Buster.  You can see the segments that triangulate, on the left.  We could also build “triangulated groups,” like GedMatch does.  I started to do this, but then stopped because I realized most cells would be colored and you’d have a hard time seeing the individual triangulated segments.  I shifted to triangulating only the individuals who triangulate directly with the Hickerson descendant, William(H), shown in green.  GedMatch data is shown in red.

chr 15 with gedmatch

I would like to make three points.

1.  This still is not a complete spreadsheet where everyone is compared to everyone.  This was selectively compared for two known Hickerson cousins, William (V) who descends from both Vannoys and Hickersos and William (H) who descends only from Hickersons.

2. There are 25 individually triangulated segments to the Hickerson descendant on just this chromosome to the various Vannoy cousins.  That’s proof times 25 to just one Hickerson cousin.

3.  I would NEVER suggest that you select one set of small segments and base a decision on that alone.  This entire exercise has assembled cumulative evidence.  By the same token, if the rules for segment matching hold up under the worst circumstances, where we have an unknown but suspected relationship and the small segments appear to continue to follow the triangulation rules, they could be expected to remain true in much more favorable circumstances.

Might any of these people have random DNA matches that are truly IBS by chance on chromosome 15?  Of course, but the matching rules, just like for larger segments, eliminates them.  According to triangulation rules, if they are IBS by chance, they won’t triangulate.  If they do triangulate, that would confirm that they received the same DNA from a common ancestor.

If this is not true, and they did not receive their common DNA from a common ancestor, then it disproves the fundamental matching rule upon which all autosomal DNA genetic genealogy is based and we all need to throw in the towel and just go and do something else.

Is there some grey area someplace?  I would presume so,  but at this point, I don’t know how to discern or define it, if there is.  I’ve done three in-depth studies on three different families over the past 6 weeks or so, and I’ve yet to find an area (except for endogamous populations that have matches by population) where the guidelines are problematic.  Other researchers may certainly make different discoveries as they do the same kind of studies.  There is always more to be discovered, so we need to keep an open mind.

In this situation, it helps a lot that the Hickerson/Vannoy descendants match and triangulate on larger segments on other chromosomes.  This study was specifically to see if smaller segments would triangulate and obey the rules. We were fortunate to have such a large, apparently “sticky” segment of Vannoy DNA on chromosome 15 to work with.

Does small segment matching matter in most cases, especially when you have larger segments to utilize?  Probably not. Use the largest segments first.  But in some cases, like where you are trying to prove an ancestor who was born in the 1700s, you may desperately need that small segment data in order to triangulate between three people.

Why is this important – critically important?  Because if small segments obey all of the triangulation rules when larger segments are available to “prove” the match, then there is no reason that they couldn’t be utilized, using the same rules of IBD/IBS, when larger segments are not available.  We saw this in Just One Cousin as well.

However, in terms of proof of concept, I don’t know what better proof could possibly be offered, within the standard genetic genealogy proofs where IBD/IBS guidelines are utilized as described in the Phasing article.  Additional examples of small segment proof by triangulation are offered in Just One Cousin, Lazarus – Putting Humpty Dumpty Together Again, and in Demystifying Autosomal DNA Matching.

Raising Elijah Vannoy and Sarah Hickerson from the Dead

As I thought more about this situation, I realized that I was doing an awful lot of spreadsheet heavy lifting when a tool might already be available.  In fact, Israel’s mention of Lazarus made me wonder if there was a way to apply this tool to the situation at hand.

I decided to take a look at the Lazarus tool and here is what the intro said:

Generate ‘pseudo-DNA kits’ based on segments in common with your matches. These ‘pseudo-DNA kits’ can then be used as a surrogate for a common ancestor in other tests on this site. Segments are included for every combination where a match occurs between a kit in group1 and group2.

It’s obvious from further instructions that this is really meant for a parent or grandparent, but the technique should work just the same for more distant relatives.

I decided to try it first just with the descendants of Elijah Vannoy.  At first, I thought that recreated Elijah would include the following DNA:

  • DNA segments from Elijah Vannoy
  • DNA segments from Elijah Vannoy’s wife, Lois McNiel
  • DNA segments that match from Elijah’s descendants spouse’s lines when individuals come from the same descendant line. This means that if three people descend from Joel Vannoy and Phoebe Crumley, Elijah’s son and his wife, that they would match on some DNA from Phoebe, and that there was no way to subtract Phoebe’s DNA.

After working with the Lazarus tool, I realized this is not the case because Lazarus is designed to utilize a group of direct descendants and then compare the DNA of that group to a second group of know relatives, but not descendants.

In other words, if you have a grandson of a man, and his brother.  The DNA shared by the brother and the grandson HAS to be the DNA contributed to that grandson by his grandfather, from their common ancestor, the great grandfather.  So, in our situation above, Phoebe’s DNA is excluded.

The chart below shows the inheritance path for Lazarus matching.

Lazarus inheritance

Because Lazarus is comparing the DNA of Son Doe with Brother Doe – that eliminates any DNA from the brother’s wives, Sarah Spoon or Mary – because those lines are not shared between Brother Doe and Son Doe.  The only shared ancestors that can contribute DNA to both are Father Doe and Methusaleh Fisher.

The Lazarus instructions allow you to enter the direct descendants of the person/couple that you are reconstructing, then a second set of instructions asks for remaining relatives not directly descended, like siblings, parents, cousins, etc. In other words, those that should share DNA through the common ancestor of the person you are recreating.

To recreate Elijah, I entered all of the Vannoy cousins and then entered William (V) as a sibling since he is the proven son of Daniel Vannoy and Sarah Hickerson.

Here is what Lazarus produced.

lazarus elijah 1

Lazarus includes segments of 4cM and 500 SNPs.

The first thing I thought was, “Holy Moly, what happened to chromosome 15?”  I went back and looked, and sure enough, while almost all of the Elijah descendants do match on chromosome 15, William (V), kit 156020, does not match above the Lazarus threshold I selected.  So chromosome 15 is not included.  Finding additional people who are known to be from this Vannoy line and adding them to the “nondescendant” group would probably result in a more complete Elijah.

lazarus elijah 2

Next, to recreate Sarah Hickerson, I added all of the Vannoy cousins plus William (V) as descendants of Sarah Hickerson and then I added just the one Hickerson descendant, William, as a sibling.  William’s ancestor is proven to be the sibling of Sarah.

I didn’t know quite what to expect.

Clearly if the DNA from the Hickerson descendant didn’t match or triangulate with DNA from any of the Vannoy cousins at this higher level, then Sarah Hickerson wasn’t likely Elijah’s mother.  I wanted to see matching, but more, I wanted to see triangulation.

lazarus elijah 3

I was stunned.  Every kit except two had matches, some of significant size.

lazarus elijah 4

lazarus elijah 5 v2

Please note that locations on chromosomes 3, 4 and 13, above, are triangulated in addition to matching between two individuals, which constitutes proof of a common ancestor.  Please also note that if you were throwing away segments below 7cM, you would lose all of the triangulated matches and all but two matches altogether.

Clearly, comparing the Vannoy DNA with the Hickerson DNA produced a significant number of matches including three triangulated segments.

lazarus elijah 6

Where Are We?

I never have, and I never would recommend attempting to utilize random small match segments out of context.  By out of context, I mean simply looking at all of your 1cM segments and suggesting that they are all relevant to your genealogy.  Nope, never have.  Never would.

There is no question that many small segments are IBS by chance or identical by population.  Furthermore, working with small segments in endogamous populations may not be fruitful.

Those are the caveats.  Small segments in the right circumstances are useful.  And we’ve seen several examples of the right circumstances.

Over the past few weeks, we have identified guidelines and tools to work with small segments, and they are the same tools and guidelines we utilize to work with larger segments as well.  The difference is size.  When working with large segments, the fact that they are large serves an a filter for us and we don’t question their authenticity.  With all small segments, we must do the matching and analysis work to prove validity.  Probably not worthwhile if you have larger segments for the same group of people.

Working with the Vannoy data on chromosome 15 is not random, nor is the family from an endogamous population.  That segment was proven to be Vannoy prior to attempts to confirm or disprove the Hickerson connection.  And we’ve gone beyond just matching, we’ve proven the ancestral link by triangulation, including small segments.  We’ve now proven the Hickerson connection about 7 ways to Sunday.  Ok, maybe 7 is an exaggeration, but here is the evidence summed up for the Vannoy/Hickerson study from multiple vendors and tools:

  • Ancestry DNA Circle indicating that multiple Hickerson descendants match me and some that don’t match me, match each other. Not proof, but certainly suggestive of a common ancestor.
  • A total of 26 Hickerson or derivative family name matches to Vannoy cousins at Family Tree DNA. Not proof, but again, very suggestive.
  • 6 Charles Hickerson/Mary Lytle descendants match to Vannoy cousins at Family Tree DNA. Extremely suggestive, needs triangulation.
  • Triangulation of segments between Vannoy and Hickerson cousins at Family Tree DNA. Proof, but in this study we were only looking to determine whether small segment matches constituted proof.
  • Triangulation of multiple Hickerson/Vannoy cousins on chromosome 15 at GedMatch utilizing small segments and one to one matching. More proof.
  • Lazarus, at higher thresholds than the triangulation matching, when creating Sarah Hickerson, still matched 19 segments and triangulated three for a total of 73.2cM when comparing the Hickerson descendant against the Vannoy cousins. Further proof.

So, can small segment matching data be useful? Is there any reason NOT to accept this evidence as valid?

With proper usage, small segment data certainly looks to provide value by judiciously applying exactly the same rules that apply to all DNA matching.  The difference of course being that you don’t really have to think about utilizing those tools with large segment matches.  It’s pretty well a given that a 20cM match is valid, but you can never assume anything about those small segment matches without supporting evidence. So are larger segments easier to use?  Absolutely.

Does that automatically make small segments invalid?  Absolutely not.

In some cases, especially when attempting to break down brick walls more than 5 or 6 generations in the past, small segment data may be all we have available.  We must use it effectively.  How small is too small?  I don’t know.  It appears that size is really not a factor if you strictly adhere to the IBD/IBS guidelines, but at some point, I would think the segments would be so small that just about everyone would match everyone because we are all humans – so the ultimate identical by population scenario.

Segments that don’t match an individual and either or both parents, assuming you have both parents to test, can safely be disregarded unless they are large and then a look at the raw data is in order to see if there is a problem in that area.  These are IBS by chance.  IBS segments by chance also won’t triangulate further up the tree.  They can’t, because they don’t match your parents so they cannot come from an ancestor.  If they don’t come from an ancestor, they can’t possibly match two other people whose DNA comes from that ancestor on that segment.

If both parents aren’t available, or your small segments do match with your parents, I would suggest that you retain your small segments and map them.

You can’t recognize patterns if the data isn’t present and you won’t be able to find that proverbial needle in the haystack that we are all looking for.

Based on what we’ve seen in multiple case studies, I would conclude that small segment data is certainly valid and can play a valid role in a situation where there is a known or suspected relationship.

I would agree that attempting to utilize small segment data outside the context of a larger data match is not optimal, at least not today, although I wish the vendors would provide a way for us to selectively lower our thresholds.  A larger segment match can point the way to smaller segment matches between multiple people that can be triangulated.  In some situations, like the person A, B, C, D Hickerson-Vannoy situation I described earlier in this article, I would like to be able to drop the match threshold to reveal the small segment data when other matches are suggestive of a family relationship.

In the Hickerson situation, having the ability to drop the matching thresholds would have been the key to positively confirming this relationship within the vendor’s data base and not having to utilize third party tools like GedMatch – which require the cooperation of all parties involved to download their raw data files.  Not everyone transferred their data to Gedmatch in my Vannoy group, but enough did that we were able to do what we needed to do.  That isn’t always the case.  In fact, I have an nearly identical situation in another line but my two matches at Ancestry have declined to download their data to Gedmatch.

This not the first time that small segment data has played a successful role in finding genealogy solutions, or confirming what we thought we knew – although in all cases to date, larger segments matched as well – and those larger segment matches were key and what pointed me to the potential match that ultimately involved the usage of the small segments for triangulation.

Using larger data segments as pointers probably won’t be the case forever, especially if we can gain confidence that we can reliably utilize small segments, at least in certain situations.  Specifically, a small segment match may be nothing, but a small segment triangulated match in the context of a genealogical situation seems to abide by all of the genetic genealogy DNA rules.

In fact, a situation just arose in the past couple weeks that does not include larger segments matching at a vendor.

Let’s close this article by discussing this recent scenario.

The Adoptee

An adoptee approached me with matching data from GedMatch which included matches to me, Dean, Carl and Harold on chromosome 15, on segments that overlap, as follows.

adoptee chr 15

On the spreadsheet above, sent to me by the adoptee, we can see some matches but not all matches. I ran the balance of these 4 people at GedMatch and below is the matching chart for the segment of chromosome 15 where the adoptee matches the 4 Vannoy cousins plus William(H), the Hickerson cousin.

  Me Carl Dean Harold Adoptee
Me NA FTDNA FTDNA GedMatch GedMatch
Carl FTDNA NA FTDNA FTDNA GedMatch
Dean FTDNA FTDNA NA FTDNA GedMatch
Harold GedMatch FTDNA FTDNA NA GedMatch
Adoptee GedMatch GedMatch GedMatch GedMatch NA
William (H) GedMatch GedMatch GedMatch GedMatch GedMatch

I decided to take the easy route and just utilize Lazarus again, so I added all of the known Vannoy and Hickerson cousins I utilized in earlier Lazarus calculations at Gedmatch as siblings to our adoptee.  This means that each kit will be compared to the adoptees DNA and matching segments will be reported.  At a threshold of 300 SNPs and 4cM, our adoptee matches at 140cM of common DNA between the various cousins.

adoptee vannoy match

Please note that in addition to matching several of the cousins, our adoptee also triangulates on chromosomes 1, 11, 15, 18, 19 and 21.  The triangulation on chromosome 21 is to two proven Hickerson descendants, so he matches on this line as well.

I reduced the threshold to 4cM and 200 SNPs to see what kind of difference that would make.

adoptee vannoy match low threshold

Our adoptee picked up another triangulation on chromosome 1 and added additional cousins in the chromosome 15 “sticky Vannoy” cluster and the chromosome 18 cluster.

Given what we just showed about chromosome 15, and the discussions about IBD and IBS guidelines and small matching segments, what conclusions would you draw and what would you do?

  1. Tell the adoptee this is invalid because there are no qualifying large match segments that match at the vendors.
  2. Tell the adoptee to throw all of those small segments away, or at least all of the ones below 7cM because they are only small matching segments and utilizing small matching segments is only a folly and the adoptee is only seeing what he wants to see – even though the Vannoy cousins with whom he triangulates are proven, triangulated cousins.
  3. Check to see if the adoptee also matches the other cousins involved, although he does clearly already exceeds the triangulation criteria to declare a common ancestor of 3 proven cousins on a matching segment. This is actually what I did utilizing Lazarus and you just saw the outcome.

If this is a valid match, based on who he does and doesn’t match in terms of the rest of the family, you could very well narrow his line substantially – perhaps by utilizing the various Vannoy wives’ DNA, to an ancestral couple.  Given that our adoptee matches both the Vannoys and the Hickersons, I suspect he is somehow descended from Daniel Vannoy and Sarah Hickerson.

In Conclusion

What is the acceptable level to utilize small segments in a known or suspected match situation?

Rather than look for a magic threshold number, we are much better served to look at reliable methods to determine the difference between DNA passed from our ancestors to us, IBD, and matches by chance.  This helps us to establish the reliability of DNA segments in individual situations we are likely to encounter in our genealogy.  In other words, rather that throw the entire pile of wheat away because there is some percentage of chaff in the wheat, let’s figure out how to sort the wheat from the chaff.

Fortunately, both parental phasing and triangulation eliminate the identical by chance segments.

Clearly, the smaller the segments, even in a known match situation, the more likely they are identical by population, given that they triangulate.  In fact, this is exactly how the Neanderthal and Denisovan genomes have been reconstructed.

Furthermore, given that the Anzick DNA sample is over 12,000 years old, Identical by population must be how Anzick is matching to contemporary humans, because at least some of these people do clearly share a common ancestor with Anzick at some point, long ago – more than 12,000 years ago.  In my case, at least some of the Anzick segments triangulate with my mother’s DNA, so they are not IBS by chance.  That only leaves identical by population or identical by descent, meaning within a genealogical timeframe, and we know that isn’t possible.

There are yet other situations where small segment matches are not IBS by chance nor identical by population.  For example, I have a very hard time believing that the adoptee situation is nothing but chance.  It’s not a folly.  It’s identical by descent as proven by triangulation with 10 different cousins – all on segments below the vendor matching thresholds.

In fact, it’s impossible to match the Vannoy cousins, who are already triangulated individually, by chance.  While the adoptee match is not over the vendor threshold, the segments are not terribly small and they do all triangulate with multiple individuals who also triangulate with larger segments, at the vendors and on different chromosomes.

This adoptee triangulated match, even without the Hickerson-Vannoy study disproves the blanket statement that small segments below 5cM cannot be used for genealogy.  All of these segments are 7.1cM or below and most are below 5.

This small segment match between my mother and her first cousins also disproves that segments under 5cM can never be used for genealogy.

Two cousins combined

This small segment passed from my mother to me disproves that statement too – clearly matching with our cousin, Cheryl.  If I did not receive this from my mother, and she from her parent, then how do we match a common cousin???

me mother small seg

More small segment proof, below, between my mother and her second cousin when Lazarus was reconstructing my mother’s father.

2nd cousin lazarus match

And this Vannoy Hickerson 4 cousin triangulated segment also disproves that 5cM and below cannot be used for genealogy.

vannoy hickerson triang

Where did these small segments come from if not a common ancestor, either one or several generations ago?  If you look at the small segment I inherited from my mother and say, “well, of course that’s valid, you got it from your mother” then the same logic has to apply that she inherited it from her parent.  The same logic then applies that the same small segment, when shared by my mother’s cousin, also came from the their common grandparents.  One cannot be true without the others being true.  It’s the same DNA. I got it from my mother.  And it’s only a 1.46cM segment, shown in the examples above.

Here are my observations and conclusions:

  • As proven with hundreds of examples in this and other articles cited, small segments can be and are inherited from our ancestors and can be utilized for genetic genealogy.
  • There is no line in the sand at 7cM or 5cM at which a segment is viable and useful at 5.1cM and not at 4.9cM.
  • All small segment matches need to be evaluated utilizing the guidelines set forth for IBD versus IBS by chance versus identical by population set forth in the articles titled How Phasing Works and Determining IBD Versus IBS Matches and Demystifying Autosomal DNA Matching.
  • When given a choice, large segment matches are always easier to use because they are seldom IBS by chance and most often IBD.
  • Small segment matches are more likely to be IBS by chance than larger matches, which is why we need to judiciously apply the IBD/IBS Guidelines when attempting to utilize small segment matches.
  • All DNA matches, not just small segments, must be triangulated to prove a common ancestor, unless they are known close relatives, like siblings, first cousins, etc.
  • When working in genetic genealogy, always glean the information from larger matches and assemble that information.  However, when the time comes that you need those small segments because you are working 5, 6 or 7 generations back in time, remember that tools and guidelines exist to use small segments reliably.
  • Do not attempt to use small segments out of context.  This means that if you were to look only at your 1cM matches to unknown people, and you have the ability to triangulate against your parents, most would prove to be IBS by chance.  This is the basis of the argument for why some people delete their small segments.  However, by utilizing parental phasing, phasing against known family members (like uncles, aunts and first cousins) and triangulation, you can identify and salvage the useable small segments – and these segments may be the only remnants of your ancestors more than 5 or 6 generations back that you’ll ever have to work with.  You do not have to throw all of them away simply because some or many small segments, out of context, are IBS by chance.  It doesn’t hurt anything to leave them just sit in your spreadsheet untouched until the day that you need them.

Ultimately, the decision is yours whether you will use small segments or not – and either decision is fine.  However, don’t make the decision based on the belief that small segments under some magic number, like 5cM or 7cM are universally useless.  They aren’t.

Whether small segments are too much work and effort in your individual situation depends on your personal goals for genetic genealogy and on factors like whether or not you descend from an endogamous population.  People’s individual goals and circumstances vary widely.  Some people test at Ancestry and are happy with inferential matching circles and nothing more.  Some people want to wring every tidbit possible out of genealogy, genetic or otherwise.

I hope everyone will begin to look at how they can use small segment data reliably instead of simply discarding all the small segments on the premise that all small segment data is useless because some small segments are not useful.  All unstudied and discarded data is indeed useless, so discarding becomes a self-fulfilling prophecy.

But by far, the worst outcome of throwing perfectly good data away is that you’ll never know what genetic secrets it held for you about your ancestors.  Maybe the DNA of your own Sarah Hickerson is lurking there, just waiting for the right circumstances to be found.

______________________________________________________________

Disclosure

I receive a small contribution when you click on some of the links to vendors in my articles. This does NOT increase the price you pay but helps me to keep the lights on and this informational blog free for everyone. Please click on the links in the articles or to the vendors below if you are purchasing products or DNA testing.

Thank you so much.

DNA Purchases and Free Transfers

Genealogy Services

Genealogy Research

Demystifying Autosomal DNA Matching

dna word cluster4

What, exactly, is an autosomal DNA match?

Answer:  It’s Relative

I’m sorry, I just had to say that.

But truthfully, it is.

I know this sounds like a very basic question, and it is, but the answer sometimes isn’t as straightforward as we would like for it to be.

Plus, there are differences in quality of matches and types of matches.  If you want to sigh right about now, it’s OK.

We’ve talked a lot about matching in various recent articles.  I have several people who follow this blog religiously, and who would rather read this than, say, do dishes (who wouldn’t).  One of our regulars recently asked me the question, “what, exactly, is a match and how do I tell?”

Darned good question and I wish someone had explained this to me so I wouldn’t have had to figure it out.

In the computer industry, where I spent many years, we have what we call flow charts or wernier diagrams which in essence are logic paths that lead to specific results or outcomes depending on the answers at different junctions.

flow chart

I had a really hard time deciding whether to use the beer decision-making flow chart or the procrastinator flow chart, but the procrastinator flow chart was just one big endless loop, so I decided on the beer.

What I’m going to do is to step you through the logic path of finding and evaluating a match, determining whether it’s valid, identical by descent or chance, when possible, and how to work with your matches and what they mean.

Let me also say that while I use and prefer Family Tree DNA, these matching techniques are universal and apply to results from 23andMe as well, but not for Ancestry who gives you no browser or tools to compare your DNA to anyone else.  So, you can’t compare your results at Ancestry.

Comparing DNA results is the lynchpin of genetic genealogy.  You’re dead in the water without it.  If you have tested at Ancestry, you can always transfer your results to Family Tree DNA, where you do have tools, and to GedMatch as well.  You’re always better, in terms of genealogy, to fish in as many ponds as possible.

Before we talk about how to work with matches, for those who need to figure out how to find matches at Family Tree DNA and 23andMe, I wrote about that in the Chromosome Browser War article.  This article focuses on working with matching DNA after you have found that you are a match to someone – and what those matches might mean.

Matching Thresholds

All autosomal DNA vendors have matching thresholds.  People who meet or exceed those thresholds will be shown on your match list.  People who do not meet the initial threshold will not be considered as a match to you, and therefore will not be on your match list.

Currently, at Family Tree DNA, their match threshold to be shown as a match is about 20cM of total matching DNA and a single segment of about 7.7cM with 500 SNPs or over. The words “about” are in there because there is some fuzziness in the rules based on certain situations.

After you meet that criteria and you are shown as a match to an individual, when you download your matching data, your matches to them on each chromosome will be shown to the 1cM and 500 SNP level

At 23andMe, the threshold is 7cMs/700 SNPs for the first segment.  However, 23andMe has an upper limit of people who can match you at about 1000 matches.  This can be increased by the number of people you are communicating or sharing with.  However, your smallest matches will be dropped from your list when you hit your threshold.  This means that it’s very likely that at least some of your matches are not showing if you have in excess of 1000 matches total.  This means that your personal effective cM/SNP match threshold at 23andMe may be much higher.

Step 1 – Downloading Your Matching Segments

For this comparison, I’m starting with two fresh files from Family Tree DNA, one file of my own matches and one of my mother’s matches.  My mother died before autosomal DNA testing was available, so her results are only at Family Tree DNA (and now downloaded to GedMatch,) because her DNA was archived there.  Thank you Family Tree DNA, 100,000 times thank you!!!

At Family Tree DNA, the option to download all matches with segment information is on the chromosome browser tab, at the top, at the right, shown below.

ftdna download button

If you have your parents DNA available to test and it hasn’t been tested, order a kit for them today.  If either or both parents have been tested, download their results into the same spreadsheet with yours and color code them in a way you will understand.

In my case, I only have my mother’s results, and I color coded my matches pink, because I’m the daughter.  However, if I had both parents, I might have colored coded Mother pink and Dad blue.

Whatever color coding you do, it’s forever in your master spreadsheet, so make a note of what it is.  In my case, it’s part of the match column header.  Why is it in my column header?  Because I screwed up once and reversed them in a download.

Step 2 – Preparing and Sorting Your Spreadsheet

In my master DNA spreadsheet, I have the following columns,

dna master header

The green cell matches are matches to me from 23andMe.  My cousin, Cheryl also tested at 23andMe before autosomal testing was offered at Family Tree DNA.

The Source column, in my spreadsheet, means any source other than FTDNA.  The Ignore column is an extraneous number generated at one time by downloads.  I could delete that column now.

The “Side” column is which side the match is from, Mom or Dad.  Mom’s I can identify easily, because I have her DNA to compare to.  I don’t identify a match as Dad’s without having identified an ancestral line, because I don’t have his DNA to compare to.

And no, you can’t just assume that if it doesn’t match Mom, it’s an automatic match to Dad because you may have some IBS, identical by chance, matches.

The Common Ancestors/Comments column is just that.  I include things like when I e-mailed someone, if the match is triangulated and if so, with whom, etc.

In my master spreadsheet, the first “name” column (of who tested) is deleted, but I’ve left it in the working spreadsheet (below) with my mother for illustration purposes.  That way, neither of us has to remember who is pink!

Step 3 – Reviewing IBD and IBS Guidelines

If you need a refresher on, phasing, IBD, identical by descent, IBS which can mean either identical by chance or identical by population, it would be a good time to read or reread the article titled How Phasing Works and Determining IBD Versus IBS Matches.

Let’s briefly review the IBD vs IBS guidelines, because we’ll be applying them in this article.

Identical by Chance – Can be determined if an individual you match does not match to one of your parents, if parents are available.  If parents are not available for matching, IBS by chance segments won’t triangulate with other known genealogical matches on a common segment.

Identical by Descent – Can be suggested if a common ancestor (or ancestral line) can be determined between any two people who are not known relatives. If the two people are known close relatives, and their DNA matches, identical by descent is proven.  IBD can be proven with previously unknown family or genealogical matches when any three people descending from that same ancestor or ancestral line all match each other on the same segment of DNA.  Three way matching is called triangulation.

Identical by Population – Can be determined when multiple people triangulate with you on a specific segment of DNA, but the triangulated groups are from proven different lineages and are not otherwise related.  This is generally found in smaller segments from similar regions of the world.  Identical by population is identical by descent, but the ancestors are so far back in time that they cannot be determined and may contribute the same DNA to multiple lineages.  This is particularly evident in Jewish genealogy and other endogamous groups.

Step 4 – Determining Parental Side and IBS by Chance

The first thing to do, if you have either or both parents, is to determine whether your matches phase to your parents or are IBS by chance.

In this context, phasing means determining whether a particular match is to your father’s side of the family or to your mother’s side of the family.

Remember, at every address in your DNA, you will have two valid matches to different lines, one from your mother and one from your father.  The address on your DNA consists of the chromosome number which equates to the street name, and then the start and end locations, which consists of a range of addresses on that street.  Think of it as the length of your property on the street.

First, let’s look at my situation with only my mother’s DNA for comparison.

It’s easy to tell one of three things.

  1. Do mother and I both match the person? If so, that means that DNA match is from mother’s side of the family. Mark it as such. They are green, below.
  2. If the individual does not match me and mother, both, and only matches me, then the match is either on my father’s side or it’s IBS by chance. Those matches are blue below. Because I don’t have my father’s DNA, I can’t tell any more at this step.
  3. Notice the matches that are Mom’s but not to me. That means that I did not receive that DNA from Mom, or I received a small part, but it’s not over the lowest matching threshold at Family Tree DNA of 1cM and 500 SNPs.

match mom

In this next scenario, you can see that mother and I both match the same individual, but not on all segments.  I selected this particular match between me, my mother and Alfred because it has some “problems” to work through.

match mom2

The segments shown in green above are segments that Mom carries that I don’t.  This means that I didn’t receive them from mother.  This also means they could be  matching to Alfred legitimately, or are IBS by chance.  I can’t tell anything more about them at this point, so I’ve just noted what they are.  I usually mark these as “mother only” in my master spreadsheet.

match mom3

The first of the two green rows above show a match but it’s a little unusual.  My segment is larger than my mothers.  This means that one of five things has happened.

  1. Part of this segment is a valid match.  At the end, where we don’t match, the match extends IBS by chance a bit at the end, in my case, when matching Alfred. The valid match portion would end where my mother’s segment ends, at 16,100,293
  2. There is a read error in one of the files.
  3. The boundary locations are fuzzy, meaning vendor calculations like ‘healing’ for no calls, etc..
  4. I also match to my father’s line.
  5. Recombination has occurred, especially possible in an endogamous population, reconnecting identical by population segments between me and Alfred at the end of the segment where I don’t match my mother’s segment, so from 16,100,293 to 16,250,884.

Given that this is a small segment, the most likely scenario would be the first, that this is partly valid and partly IBS by chance.  I just make the note by that row.

The second green segment above isn’t an exact match, but if my segment “fits within” the boundaries of my mother’s segments, then we know I inherited the entire segment from her.  Once again, my boundaries are off a bit from hers, but this time it’s the beginning.  The same criteria applies as in 1-5, above.

match mom4

The green segments above are where I match Alfred, but my mother does not.  This means that these segments are either IBS by chance or that they will match my father.  I don’t know which, so I simply label them.  Given that they are all small segments, they are likely IBS by chance, but we don’t know that.  If we had my father’s DNA, we would be able to phase against him, too, but we don’t.

Now, if I was to leave this discussion here, you might have the impression that all small segment matches have problems, but they don’t.  In fact, here’s a much more normal “rea life” situation where mother and I are both matching to our cousin, Cheryl, Mom’s first cousin.  These matches include both large and small segments.  Let’s take a look and see what we can tell about our matches.

match mom complete

Roberta and Barbara have a total of 83 DNA matches to Cheryl.

Some matches will be where Barbara matches Cheryl and Roberta doesn’t.  That’s normal, Barbara is Roberta’s mother and Roberta only inherits half of Barbara’s DNA.  These rows where only Barbara, the mother, matches Cheryl are not colorized in the Start, End, cM and SNP columns, so they show as white.

Some matches will be exact matches.  That too is normal.  In some cases, Barbara passes all of a particular segment of DNA to Roberta.  These matches are colored purple.

Some of these matches are partial matches where Roberta inherited part of the segment of DNA from Barbara.  These are colored green. There are two additional columns at right where the percentage of DNA that Roberta inherited from Barbara on these segments is calculated, both for cM and SNPs.

Some of the matches are where Roberta matches Cheryl and Barbara doesn’t.  Cheryl is not known to be related to Roberta on her father’s side, so assuming that statement is correct, these matches would be IBS, identical by state, meaning identical by chance and can be disregarded at legitimate matches.  These are colored rust.  Note that most of these are small segments, but one segment is 8.8cM and 2197 SNPs.  In this case, if this segment becomes important for any reason, I would be inclined to look at the raw data file of Barbara to see if there were no calls or a problem with reads in this region that would prevent an otherwise legitimate match.

Let’s look at how these matches stack up.

Number Percent (rounded) Comment
Exact Matches 26 31 100% of the DNA
Barbara Only 20 24 0% of the DNA
Partial Matches 29 35 11-98% of the actual DNA matches
Roberta Only (IBS by chance) 7 8 Not a valid match

I think it’s interesting to note that while, on the average, 50% of the DNA of any segment is passed to the child, in actuality, in this example of partial inheritance, meaning the green rows, inheritance was never actually 50%.  In fact, the SNP and cM percentages inherited for the same segment varied, and the actual amounts ranged from 11-98% of the DNA of the parent being inherited by the child.  The average of these events was 54.57143 (cM) and 54.21429 (SNPs) however.

On top of that, in 13 (26 rows) instances, Roberta inherited all of Barbara’s DNA in that sequence, and in 20 cases, Roberta inherited none of Barbara’s DNA in that sequence.

This illustrates that while the average of something may be 50%, none of the actual individual values may be 50% and the values themselves may include the entire range of possibilities.  In this case, 11-98% were the actual percentage ranges for partial matches.

Matching Both Parents

I don’t have my father’s DNA, but I’m creating this next example as if I did.

match both parents

Matches to mother are marked in green.

I have two matches where I match my father, so we can attribute those to his side, which I’ve done and marked in orange.

The third group of matches to me, at the bottom, to Julio, Anna, Cindy and George don’t match either parent, so they must be IBS by chance.

I label IBS by chance segments, but I don’t delete them because if I download again, I’ll have to go through this same analysis process if I don’t leave them in my spreadsheet

Step 5 – How Much of the DNA is a Match?

One person asked, “exactly how do I tell how much DNA is matching, especially between three people.”  That’s a very valid question, especially since triangulation requires matching of three people, on the same segment, proven to a common ancestral line.

Let’s look at the match of both me and my mother to Don, Cheryl and Robin.

match mom part

In this example, we know that Don, Cheryl and Robin all match me on my mother’s side, because they all three match me and my mother, both on the same segment.

How do we determine that we match on the same segment?

I have sorted this spreadsheet in order of end location, then start location, then chromosome number so that the entire spreadsheet is in chromosome order, then start location, then end location.

We can see that both mother and I match Cheryl partially on this segment of chromosome 1, but not exactly.  The start location is slightly different, but the end location matches exactly.

The area where we all three match, meaning me, Mom and Cheryl, begins at 176,231,846 and ends at the common endpoint of 178,453,336

On the chart below, you can see that mother and I also both match Don, Cheryl’s brother, on part of this same segment, but not all of the same segment.

match mom part2

The common matching areas between me, Mom and Don begins at 176,231,846 and ends at 178,453,336.

Next, let’s look at the third person, Robin.

Mom and I both match Robin on part of this same overlapping segment as well.  Note that my segment extends beyond Mom’s, but that does not invalidate the portion that does match between Robin, Mom and I.

match mom part3

Our common match area begins at the same location, but ends at 178,453,336, the same location as the common end area with Don and Cheryl

Step 6 – What Do Matches Mean? IBD vs IBS in Action

So, let’s look at various types of matches and what they tell us.

match mom example

Looking at our matching situation above, let’s apply the various IBD/IBS rules and guidelines and see what we have

1. Are these matches identical by chance?  No.  How do we know?

a. Because they all match both me and a parent.

2. Are these matches identical by descent? Yes. How do we know?

a. Because we all match each other on this segment, and we know the common ancestor of Cheryl, Don, Barbara and me is Hiram Ferverda and Evaline Miller.  We know that Robin descends from the same ancestral Miller line.

3. Are these matches identical by population.  We don’t know, but there is no reason at this point to think so. Why?

a. Because looking at my master spreadsheet, I see no evidence that these segments are also assigned to other lineages. These individuals are also triangulated on a large number of other, much larger, segments as well.

4. Are these matches triangulated, meaning they are proven to a common ancestor? Yes. How do we know?

a. Documented genealogy of Hiram Ferverda and Evaline Miller. Don, Barbara, Cheryl and me are known family since birth.
b. Documented genealogy of Robin to the same ancestral family, even though Robin was previously unknown before DNA matching.
c. Even without the documented genealogy, Robin matches a set of two triangulation groups of people documented to the same ancestral line, which means she has to descend from that same line as well.

In our case, clearly these individuals share a common ancestor and a common ancestral line.  Even though these are small segments on chromosome 1, there are much larger matching segments on other chromosomes, and the same rules still apply.  The difference might be at some point smaller segments are more likely to be identical by population than larger segments.  Larger segments, when available, are always safer to use to draw conclusions.  Larger groups of matching individuals with known common genealogy on the same segments are also the safest way to draw conclusions.

Step 7 – Matching With No Parents

Sometimes you’re just not that lucky.  Let’s say both of your parents have passed and you have no DNA from them.

That immediately eliminates phasing and the identical by chance test by comparing to your parents, so you’ll have to work with your matches, including your identical by chance segments.

A second way to “phase” part of your DNA to a side of your family is by matching with known cousins or any known family member.

In the situation above, matching to Cheryl, Don and Robin, let’s remove my mother and see what we have.

match no mom

In this case, I still match to both of my first cousins, once removed, Cheryl and Don.  Given that Cheryl and Don are both known cousins, since forever, I don’t feel the need for triangulation proof in this case – although the three of us are triangulated to our common ancestor.  In other words, the fact that my mother does match them at the expected 1st cousin level is proof enough in and of itself if we only had one cousin to test.  We know our common ancestor is Cheryl and Don’s grandparents, who are my great-grandparents, Hiram Ferverda and Evaline Miller.

When I looked at Robin’s pedigree chart and saw that Robin descended from Philip Jacob Miller and wife Magdalena, I knew that this segment was a Miller side match, not a Ferverda match.

Therefore, matching with someone whose genealogy goes beyond the common ancestor of Cheryl, Don and me proves this line through 4 more generations.  In other words, this DNA segment came through the following direct line to reach Me, Mother, Cheryl and Don.

  • Philip Jacob Miller and Magdalena
  • Daniel Miller
  • David Miller
  • John David Miller
  • Evaline Louise Miller who married Hiram Ferverda

Clearly, we know from the earlier chart that my mother carried this DNA too, but even if we didn’t know that, she obviously had to have carried this segment or I would not carry it today.

So, even though in this example, our parents aren’t directly available for IBS testing and elimination, we can determine that anyone who matches both me and Cheryl or me and Don will have also matched mother on that segment, so we have, in essence, phased those people by triangulation, not by direct parental matching.

Step 8 – Triangulation Groups

What else does this match group tell us?

It tells us that anyone else who matches me and any one of our triangulation group on that segment also descends from the Miller descendant clan, one way or another.

Why do they have to match me AND one of the triangulation group members on that segment?  Because I have two sides to my DNA, my Mom’s side and my Dad’s side.  Matching me plus another person from the triangulation group proves which side the match is on – Mom’s or Dad’s.

We were able to phase to eliminate any identical by chance segments people on Mom’s side, so we know matches to both of us are valid.

On Dad’s side, there are some IBS by chance people (or segments) thrown in for good measure because I don’t have my Dad’s DNA to eliminate them out of the starting gate.  Those IBS segments will have to be removed in time by not triangulating with proven triangulated groups they should triangulate with, if they were valid matches.

When you map matches on your chromosome spreadsheet, this is what you’re doing.  Over time, you will be able to tell when you receive a new match by who they match and where they fall on your spreadsheet which ancestral line they descend from.

GedMatch also includes a triangulation utility.  It’s a great tool, because it produces trios of people for your top 400 matches.  The results are two kits that triangulate to the third person whose kit number you are matching against.

The output, below, shows you the chromosome number followed by the two kit numbers (obscured) that triangulate at this location, and then the start and end location followed by the matching cMs.  The result is triangulation groups that “slide to the right.”

gedmatch triang group3

In the example above, all of the triangulation matches to me above the red arrow include either Mother, my Ferverda cousins or the Miller group that we discussed in the Just One Cousin article.  In other words they are all related via a common ancestor.

You can tell a great deal about triangulation groups by who is, and isn’t in them using deductive reasoning.  And once you’ve figured out the key to the group, you have the key to the entire group.

In this case, Mom is a member of the first triangulation group, so I know this group is from her side and not Dad’s side.  Both Ferverda cousins are there, so I know it’s Mom’s Dad’s side of the family.  The Miller cousins are there, so I know it’s the Miller side of Mom’s Dad’s side of the family.

Please also note that while this entire group triangulates within itself, that the group manages to slide right and the first triangulated group of 3 in the list may not overlap the DNA of the last triangulated group of 3.  In fact, because you can see the start and end points, you can tell that these two triangulated groups don’t overlap.  The multiple triangulation groups all do match some portion of the group above and below them (in this case,) and as a composite group, they slide to the right. Because each group overlaps with the group above and below them, they all connect together in a genetic chain.  Because there is an entire group that are triangulated together, in multiple ways, we know that it is one entire group.

This allows me to map that entire segment on my Mom’s side of my DNA, from 10,369,154 to 41,685,667 to this group because it is contiguously connected to me, triangulated and unbroken.  The most distant ancestor listed will vary based upon the known genealogy of the three people being triangulated  For example, part of this segment, may come from Philip Jacob Miller himself, the line’s founder,, but another part could come from his son’s wife, who is also my ancestor.  Therefore, the various pieces of this group segment may eventually be attributed to different ancestors from this particular line based upon the oldest common ancestor of the three people who have triangulated.

In our example above, the second group starts where the red arrow is pointing.  I have absolutely no idea which ancestor this second group comes from – except – I know it does not come from my mother’s side because her kit number isn’t there.

Neither are any of my direct line Estes or Vannoy relatives, so it’s probably not through that line either.  My Bolton cousins are also missing, so we’ve probably eliminated several possible lines, 3 of 4 great grandparents, based on who is NOT in the match group.  See the value of testing both close and distant cousins?  In this case, the family members not only have to test, they also have to upload their results to GedMatch.

Conversely, we could quickly identify at least a base group by the presence in the triangulation groups of at least one my known cousins or people with whom I’ve identified my common ancestor.  Two from the same line would be even better!!!

Endogamy

The last thing I want to show you is an example of what an endogamous group looks like when triangulated.

gedmatch endogamy

This segment of chromosome 9 is an Acadian matching group to my Mom – and the list doesn’t stop here – this is just the size of the screen shot.  These matches continue for pages.

How do I know this group is Acadian?  In part, because this group also triangulates with my known Lore cousin who also descends from the same Acadian ancestor, Antoine Lore, son of Honore Lore and Marie Lafaille.  Additionally, I’ve worked with some of these people and we have confirmed Honore Lore and Marie Lafaille as our common ancestor as well.  In other cases, we’ve confirmed upstream ancestors.

Unfortunately, the Acadians are so intermarried that it’s very difficult to sort through the most distant genetic ancestor because there tend to be multiple most distant ancestors in everyone’s trees.  There is a saying that if you’re related to one Acadian, you’re related to all Acadians and it’s the truth.  Just ask my cousin Paul who I’m related to 137 different ways.

Matches to endogamous groups tend to have very, very long lists of matches, even triangulated, which means proven, matches.

Oh, and by the way, just for the record, this lengthy group includes some of my proven Acadian matches that were trimmed, meaning removed, from my match list when Ancestry did their big purge due to their new and improved phasing.  So if there was ever any doubt that we did in fact lose at least some valid matches, the proof lies right here, in the triangulation of those exact same people at GedMatch

Summary

I hope this step by step article has helped take the Greek, or maybe the geek, out of matching.  Once you think of it in a step by step logical basis, it makes a lot of sense and allows you to reasonably judge the quality of your matches.

The rule of thumb has been that larger matches tend to be “legitimate” and smaller matches are often discarded en masse because they might be problematic.  However, we’ve seen situations where some larger matches may not be legitimate and some smaller matches clearly are.  In essence, the 50% average seldom applies exactly and rules of thumb don’t apply in individuals situations either.  Your situation is unique with every match and now you have tools and guidelines to help you through the matching maze.

And hey, since we made it to the end, I think we should celebrate with that beer!!!

beer

______________________________________________________________

Disclosure

I receive a small contribution when you click on some of the links to vendors in my articles. This does NOT increase the price you pay but helps me to keep the lights on and this informational blog free for everyone. Please click on the links in the articles or to the vendors below if you are purchasing products or DNA testing.

Thank you so much.

DNA Purchases and Free Transfers

Genealogy Services

Genealogy Research