This article is Part 4 of a series about mitochondrial DNA. I suggest you read these earlier articles in order before reading this one:
- Mitochondrial DNA: Part 1 – Overview
- Mitochondrial DNA: Part 2 – What Do Those Numbers Mean?
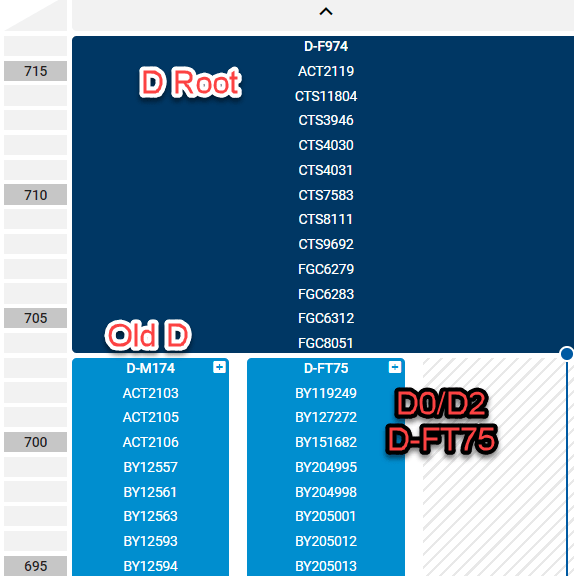
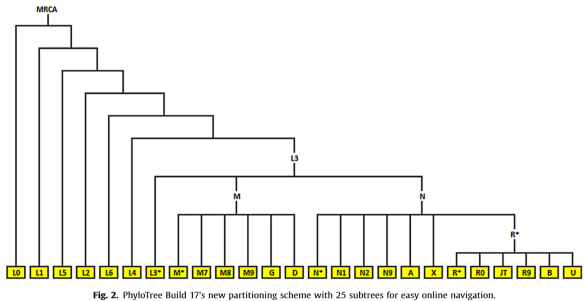
- Mitochondrial DNA: Part 3 – Haplogroups Unraveled
This article builds on the information presented in parts 1, 2 and 3.
Hellooooo – Is Anyone Home?
One of the most common complaints about ALL DNA matches is the lack of responses. When using Y DNA, which follows the paternal line directly, passed from father to son, hopefully along with the surname, you can often discern hints from your matches’ surnames.
Not so with mitochondrial DNA because the surname changes with each generation when the female marries. In fact, I often hear people say, “but I don’t recognize those names.” You won’t unless the match is from very recent generations and you know who the daughters married to the present generation.
Therefore, genealogists really depend on information from other genealogists when working with mitochondrial DNA.
Recently, I experimented at Family Tree DNA to see what I could do to improve the information available. Family Tree DNA is the only vendor that provides full sequence testing combined with matching.
This exercise is focused on mitochondrial DNA matches, but you can use the same techniques for Y DNA as well. These are easy step-by-step instructions!
Let’s get started and see what you can do. You’ll be surprised. I was!
Your Personal Page at Family Tree DNA
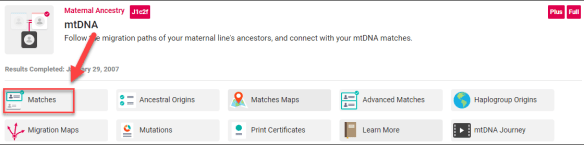
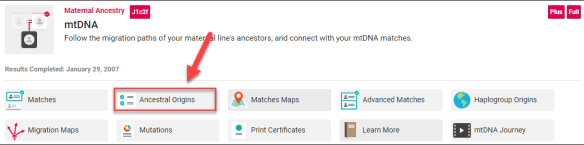
On your personal page, under mtDNA, click on Matches.
Matches
You’ll be viewing your match list of the people who match you at some level.
You’ll see several fields on your match list that you’ll want to use. Many of the bullet points in this article refer to the fields boxed in red or red arrows.

You can click this image to enlarge.
Let’s review why each piece of information is important.
- Be sure you’re using viewing your matches for the HVR1, HVR2 and Coding region in the red box at the top. Those are your most relevant matches. That’s not to say that you shouldn’t also view your HVR1+HVR2 matches, and your HVR1 matches, because you literally never know what might be there. However, start with the HVR1+HVR2+Coding Region.
- Focus on your Genetic Distance of 0 matches. Those are exact matches, meaning you have no mutations that don’t match each other. A genetic distance of 1 means that you have one mutation that doesn’t match each other. You can read about Genetic Distance here.
- Be sure you’re looking at the match results for the entire data base or the project you want to be viewing. For example, if I’m a member of the Acadian AmerIndian project and have Acadian ancestry on my direct matrilineal line, knowing who I match within that project may be extremely beneficial, especially if I need to narrow my results to known Acadian families.
- Look at the earliest known ancestor (EKA) information. Don’t just let your eyes gloss over it, really look at it. There may be secrets hidden here that are critical for solving your puzzle. The mother of Lydia Brown was discovered by a cousin recently after I had (embarrassingly) ignored an EKA in plain sight for years. You can read about that discovery here.
- Click on the little blue pedigree icon on your match to view trees that go hand in hand with the earliest known ancestor (EKA) information. Some people provide more information in either the EKA or the tree, so be sure to look at both for hints.

- If your match’s pedigree icon is grey, they haven’t uploaded their tree. You can always drop them an email explaining how useful trees are and ask them if they will upload theirs.
Utilizing Other Resources
Many people don’t have both trees and an EKA at Family Tree DNA. Don’t hesitate to check Ancestry, MyHeritage or FamilySearch trees with the earliest known ancestor information your match provides if they don’t have a tree, or even if they do to expand their tree. We think nothing of building out trees for autosomal matches – do the same for your matches’ mitochondrial lines.
Finding additional information about someone’s ancestor is also a great ice-breaker for an email conversation. I mean, what genealogist doesn’t want information about their ancestors?
For example, if you match me and I’ve only listed my earliest known ancestor as Ellenore “Nora” Kirsch, you can go to Ancestry and search for her name where you will find several trees, including mine that includes several more generations. Most genealogists don’t limit themselves to one resource, testing company or tree repository.

WikiTree includes a descendants link for each ancestor that provides a list of people who have DNA tested, including mtDNA. Here’s an example for my ancestor, Curtis B. Lore.

Unfortunately, no one from that line has tested their mitochondrial DNA, but looking at the descendants may provide me with some candidates that descend from his sisters through all females to the current generation, which can be male.
You can do that same type of thing at Geni if you have a tree by viewing that ancestor and clicking on “view a list of living people.”

While trees at FamilySearch, Ancestry and MyHeritage don’t tell you which lines could be tested for mitochondrial DNA, it’s not difficult to discern. Mitochondrial DNA is passed on by females to the current generation where males can test too – because they received their mitochondrial DNA from their mother.
Family Tree DNA Matches Profiles
Your matches’ profiles are a little used resource as many people don’t realize that additional information may be provided there. You can click on your match’s name to show their profile card.

Be sure to check their “about me” section where I typed “test” as well as their email address which may give you a clue about where the match lives based on the extension. For example, .de is Germany and .se is Sweden.
You can also google their email address which may lead to old Rootsweb listings among other useful genealogical information.
Matches Map

Next, click on your Matches Map. Your match may have entered a geographical location for their earliest known ancestor. Beware of male names because sometimes people don’t realize the system isn’t literally asking for the earliest known ancestor of ANY line or the oldest ancestor on their mother’s side. The system is asking for the most distant known ancestor on the matrilineal line. A male name entered in this field invalidates the data, of course.
My Matches Map is incredibly interesting, especially since my EKA (earliest known ancestor) is from Germany in 1655.
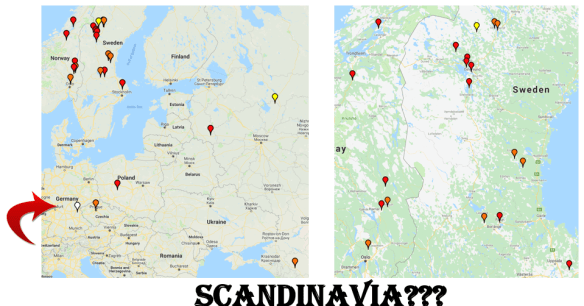
The white pin shows the location of my ancestor in Germany. The red pins are exact matches, orange are genetic distance of 1, yellow of 2 and so forth.
Note that the majority of my matches are in Scandinavia.
The first question you should be asking is if I’m positive of my genealogical research – and I am. I have proofs for every single generation. The question of paternity is not relevant to mitochondrial DNA, since the identity of the mother is readily apparent, especially in small villages of a few hundred people where babies are baptized by clergy who knows the families well.
Adoptions might be another matter of course, but adoptions as we know them have only taken place in the past hundred years or so. Generally, the child was still baptized with the parents’ names given before the 1900s. Who raised the child was another matter entirely.
Important Note: Your matches map location does NOT feed from your tree. You must go to the Matches Map page and enter that information at the bottom of that page. Otherwise your matches map location won’t show when viewed by your matches, and if they don’t do the same, theirs won’t show on your map.

I KNOW nobody really wants to do this, but you may just have to email as a last resort. The little letter icon on your match’s profile sends an email, or you can find their email in their profile as well.
DON’T email an entire group of people at once as that’s perceived as spam and is unlikely to receive a response from anyone.
Compose a friendly email with a title something like “Mitochondrial DNA Match at Family Tree DNA to Susan Smith.” Many people manage several kits and if you provide identifying information in the title, you’re more likely to receive a response
I always provide my matches with some information too, instead of just asking for theirs.
Advanced Matching

Click on the advanced matching link on your personal page.
The Advanced Matches tool allows you to compare multiple types of tests. When looking at your match list, notice if your matches have also taken a Family Finder (FF) test. If so, then the advanced matching tool will show you who matches you on multiple types of tests, assuming you’ve taken the Family Finder test as well or transferred autosomal results to Family Tree DNA.
For example, Advanced Matches will show you who matches you on BOTH the mtDNA and the Family Finder tests. This is an important tool to help determine how closely you might be related to someone who matches you on a mitochondrial DNA test – although here is no guarantee that your autosomal match is through the same ancestor as your mitochondrial DNA match.

On the advanced matching page, select the tests you want to view, together, meaning you only want to see results for people who match you on BOTH TESTS. In this case, I’ve selected the full mitochondrial sequence (FMS) and the Family Finder, requested to show only people I match on both tests, and for the entire database. I could select a specific project that I’ve joined if I want to narrow the matches.
Note that if you don’t click the “yes” button you’ll see everyone you match on both tests INDIVIDUALLY, not together. So if you match 50 people on mtDNA and 1000 on Family Finder, you would show 1050 people, not the people who match you on BOTH tests, which is what you want. You might match a few or none on both tests.
Note that if you select “all mtDNA” that means you must match the person on the HVR1, HVR2 and coding region, all 3. That may not be at all what you want either. I select each one separately and run the report. So first, FMS and Family Finder, then HVR2 and Family Finder, etc.
When you’ve made your selection, click on the red button to run the report.
Family Finder Surnames
Another hint you might overlook is Family Finder surnames.

Go to your Family Finder match list and enter the surname of your matches EKA in the search box to see if you match anyone with that same ancestor. Of course, if it’s Smith or Jones, I’m sorry.

Entering Kirsch in my Family Finder match list resulting in discovering a match that has Kirsh from Germany in their surname list, but no tree. Using the ICW (in common with) tool, I can then look to see if they match known cousins from the Kirsch line in common with me.
Putting Information to Work
OK, now we’ve talked about what to do, so let’s apply this knowledge.
Your challenge is to go to your Full Sequence match page in the lower right hand corner and download your match list into a spreadsheet by clicking the CSV button.

Column headings when downloaded will be:
- Genetic Distance
- Full Name
- First Name
- Middle Name
- Last Name
- Earliest Known Ancestor
- mtDNA Haplogroup
- Match Date
I added the following columns:
- Country
- Location (meaning within the country)
- Ancestral Surname
- Year (meaning their ancestor’s birth/death year)
- Map (meaning do they have an entry on the matches map)
- Tree (do they have a tree)
- Profile (did I check their profile and what did it say)
- Comment (anything I can add)
This spreadsheet is now a useful tool.
Our goal is to expand this information in a meaningful way.
Data Mining Steps
Here are the steps in checklist format that you’ll complete for each match to fill in additional information on your spreadsheet.
- EKA (earliest known ancestor)
- Matches Map
- Tree
- Profile
- Advanced matching
- Family Finder surname list
- Email, as a last resort
- Ancestry, MyHeritage, FamilySearch, WikiTree, Geni to search for information about their EKA
Doubling My Match Information
I began with 32 full sequence matches. Of those, 13 had an entry on the Matches Map and another 6 had something in the EKA field, but not on the Matches Map.
| 32 matches | Map | Additional EKA | Nothing Useful |
| Begin | 13 on Matches Map | 6 but not mapped | 13 |
| End | 29 remapped on Google | 5 improved info | 3 |
When I finished this exercise, only 3 people had no usable information (white rows), 29 could be mapped, and of the original 13 (red rows), 5 had improved information (yellow cells.)

Please note that I have removed the names of my matches for privacy reasons, but they appear as a column on my original spreadsheet instead of the Person number.
Google Maps
I remapped my matches from the spreadsheet using free Google Maps.

Purple is my ancestor. Red are the original Matches Map ancestors of my matches. Green are the new people that I can map as a result of the information gleaned.
The Scandinavian clustering is even more mystifying and stronger than ever.
Add History
Of course, there’s a story here to be told, but what is that story? My family records are found in Germany in 1655, and before that, there are no records, at least not where my ancestors were living.
Clearly, from this map and also from comparing the mutations of my matches that answered my emails, it’s evident that the migration path was from Scandinavia to Germany and not vice-versa.
How did my ancestor get from Scandinavia to Germany?
When and why?
Looking at German history, there’s a huge hint – the Thirty Years’ War which occurred from 1618-1648. During that war, much of Germany was entirely depopulated, especially the Palatinate.
Looking at where my ancestor was found in 1655 (purple pin), and looking at the Swedish troop movements, we see what may be a correlation.

In the first few generations of church records, there were several illegitimate births and the mother was referred to as a servant woman.
It’s possible that my Scandinavian ancestor came along with the Swedish army and she was somehow left behind or captured.
The Challenge!
Now, it’s your turn. Using this article as a guideline, what can you find? Let me know in a comment. If you utilize additional resources I haven’t found, please mention those too!
What’s Next?
Please join me for the next article in this series, Mitochondrial DNA: Part 5 – Joining Projects.
______________________________________________________________
Disclosure
I receive a small contribution when you click on the link to one of the vendors in my articles. This does NOT increase the price you pay but helps me to keep the lights on and this informational blog free for everyone. Please click on the links in the articles or to the vendors below if you are purchasing products or DNA testing.
Thank you so much.
DNA Purchases and Free Transfers
- Family Tree DNA
- MyHeritage DNA only
- MyHeritage DNA plus Health
- MyHeritage FREE DNA file upload
- AncestryDNA
- 23andMe Ancestry
- 23andMe Ancestry Plus Health
- LivingDNA
Genealogy Services
Genealogy Research
- Legacy Tree Genealogists for genealogy research