Recently, Family Tree DNA introduced their new ethnicity tool, myOrigins as part of their autosomal Family Finder product. This means that all of the major players in this arena using chip based technology (except for the Genographic project) have now updated their tools. Both 23andMe and Ancestry introduced updated versions of their tools in the fall of 2013. In essence, this is the second generation of these biogeographical or ethnicity products. So lets take a look and see how the vendors are doing.
In a recent article, I discussed the process for determining ethnicity percentages using biogeographical ancestry, or BGA, tools. The process is pretty much the same, regardless of which vendor’s results you are looking at. The variant is, of course, the underlying population data base, it’s quality and quantity, and the way the vendors choose to construct and name their regions.
I’ve been comparing my own known and proven genealogy pedigree breakdown to the vendors results for some time now. Let’s see how the new versions stack up to a known pedigree.
The paper, Revealing American Indian and Minority Heritage Using Y-line, Mitochondrial, Autosomal and X Chromosomal Testing Data Combined with Pedigree Analysis was published in the Fall 2010 issue of JoGG, Vol. 6 issue 1.
The pedigree analysis portion of this document begins about page 8. My ancestral breakdown is as follows:
| Geography |
Pedigree Percent |
| Germany |
23.8041 |
| British Isles |
22.6104 |
| Holland |
14.5511 |
| European by DNA |
6.8362 |
| France |
6.6113 |
| Switzerland |
0.7813 |
| Native American |
0.2933 |
| Turkish |
0.0031 |
This leaves about 25% unknown.
Let’s look at each vendor’s results one by one.
23andMe

My results using the speculative comparison mode at 23andMe are shown in a chart, below.
| 23andMe Category |
23andMe Percentage |
| British and Irish |
39.2 |
| French/German |
15.6 |
| Scandinavian |
7.9 |
| Nonspecific North European |
27.9 |
| Italian |
0.5 |
| Nonspecific South European |
1.6 |
| Eastern European |
1.8 |
| Nonspecific European |
4.9 |
| Native American |
0.3 |
| Nonspecific East Asian/Native American |
0.1 |
| Middle East/North Africa |
0.1 |
At 23andMe, if you have questions about what exact population makes up each category, just click on the arrow beside the category when you hover over it.
For example, I wasn’t sure exactly what comprises Eastern European, so I clicked.

The first thing I see is sample size and where the samples come from, public data bases or the 23andMe data base. Their samples, across all categories, are most prevalently from their own data base. A rough add shows about 14,000 samples in total.
Clicking on “show details” provides me with the following information about the specific locations of included populations.

Using this information, and reorganizing my results a bit, the chart below shows the comparison between my pedigree chart and the 23andMe results. In cases where the vendor’s categories spanned several of mine, I have added mine together to match the vendor category. A perfect example is shown in row 1, below, where I added France, Holland, Germany and Switzerland together to equal the 23andMe French and German category. Checking their reference populations shows that all 4 of these countries are included in their French and German group.
| Geography |
Pedigree Percent |
23andMe % |
| Germany, Holland, Switzerland & France |
45.7451 |
15.6 |
| France |
6.6113 (above) |
Combined |
| Germany |
23.8014 (above) |
Combined |
| Holland |
14.5511 (above) |
Combined |
| Switzerland |
0.7813 (above) |
Combined |
| British Isles |
22.6104 |
39.2 |
| Native American |
0.2933 |
0.4 (Native/East Asian) |
| Turkish |
0.0031 |
0.1 (Middle East/North Africa) |
| Scandinavian |
|
7.9 |
| Italian |
|
0.5 |
| South European |
|
1.6 |
| East European |
|
1.8 |
| European by DNA |
6.8362 |
4.9 (nonspecific European) |
| Unknown |
25 |
27.9 (North European) |
I can also change to the Chromosome view to see the results mapped onto my chromosomes.

The 23andMe Reference Population
According to the 23andMe customer care pages, “Ancestry Composition uses 31 reference populations, based on public reference datasets as well as a significant number of 23andMe members with known ancestry. The public reference datasets we’ve drawn from include the Human Genome Diversity Project, HapMap, and the 1000 Genomes project. For these datasets as well as the data from 23andMe, we perform filtering to ensure accuracy.
Populations are selected for Ancestry Composition by studying the cluster plots of the reference individuals, choosing candidate populations that appear to cluster together, and then evaluating whether we can distinguish the groups in practice. The population labels refer to genetically similar groups, rather than nationalities.”
Additional detailed information about Ancestry Composition is available here.
Ancestry.com

Ancestry is a bit more difficult to categorize, because their map regions are vastly overlapping. For example, the west Europe category is shown above, and the Scandinavian is shown below.

Both categories cover the Netherlands, Germany and part of the UK.
My Ancestry percentages are:
| Ancestry Category |
Ancestry Percentage |
| North Africa |
1 |
| America |
<1 |
| East Asia |
<1 |
| West Europe |
79 |
| Scandinavia |
10 |
| Great Britain |
4 |
| Ireland |
2 |
| Italy/Greece |
2 |
Below, my pedigree percentages as compared to Ancestry’s categories, with category adjustments.
| Geography |
Pedigree Percent |
Ancestry % |
| West European |
52.584 (combined from below) |
79 |
| Germany |
23.8041 |
Combined |
| Holland |
14.5511 |
Combined |
| European by DNA |
6.8362 |
Combined |
| France |
6.6113 |
Combined |
| Switzerland |
0.7813 |
Combined |
| British Isles |
22.6104 |
6 |
| Native American |
0.2933 |
~1 incl East Asian |
| Turkish |
0.0031 |
1 (North Africa) |
| Unknown |
25 |
|
| Italy/Greece |
|
2 |
| Scandinavian |
|
10 |
Ancestry’s European populations and regions are so broadly overlapping that almost any interpretation is possible. For example, the Netherlands could be included in several categories – and based up on the history of the country, that’s probably legitimate.
At Ancestry, clicking on a region, then scrolling down will provide additional information about that region of the world, both their population and history.
The Ancestry Reference Population
Just below your ethnicity map is a section titled “Get the Most Out of Your Ethnicity Estimate.” It’s worth clicking, reading and watching the video. Ancestry states that they utilized about 3000 reference samples, pared from 4245 samples taken from people whose ethnicity seems to be entirely from that specific location in the world.

You can read more in their white paper about ethnicity prediction.
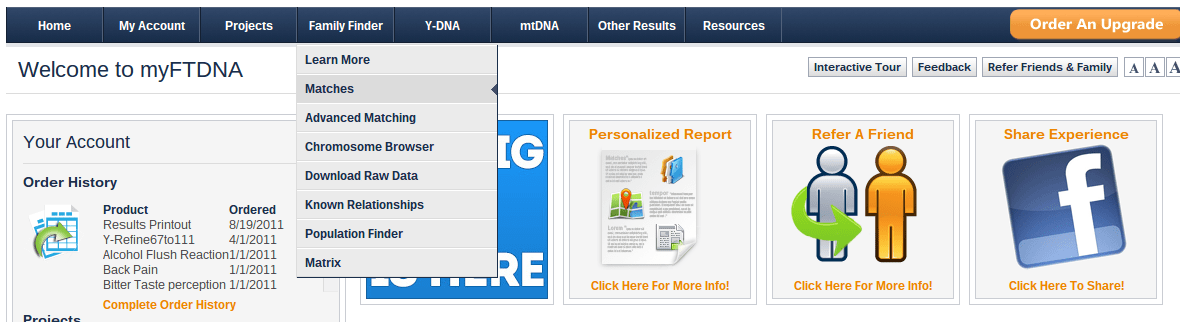
Family Tree DNA’s myOrigins
I wrote about the release of my Origins recently, so I won’t repeat the information about reference populations and such found in that article.

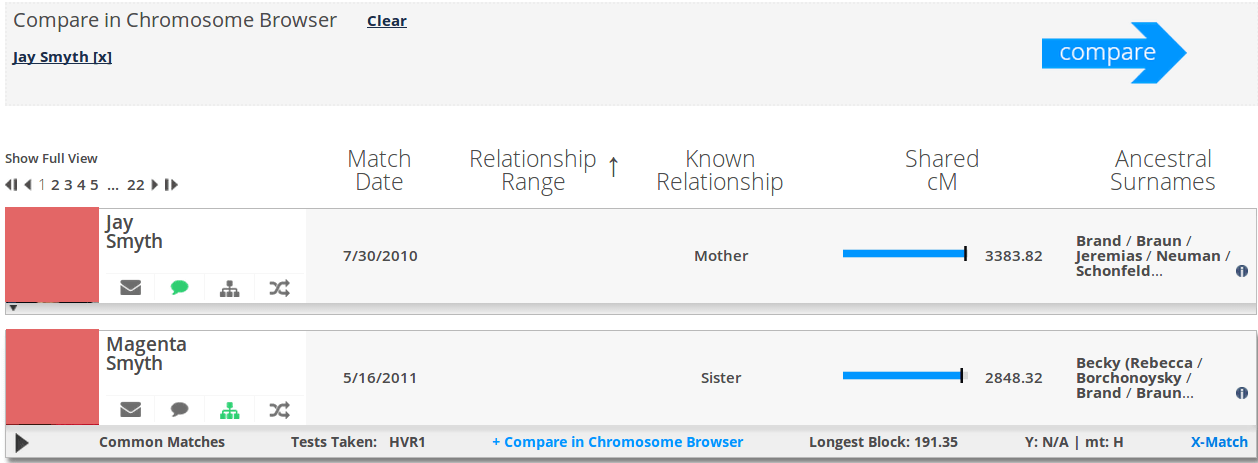
Family Tree DNA shows matches by region. Clicking on the major regions, European and Middle Eastern, shown above, display the clusters within regions. In addition, your Family Finder matches that match your ethnicity are shown in highest match order in the bottom left corner of your match page.
Clicking on a particular cluster, such as Trans-Ural Peneplain, highlights that cluster on the map and then shows a description in the lower left hand corner of the page.

Family Tree DNA shows my ethnicity results as follows.
| Family Tree DNA Category |
Family Tree DNA Percentage |
| European Coastal Plain |
68 |
| European Northlands |
12 |
| Trans-Ural Peneplain |
11 |
| European Coastal Islands |
7 |
| Anatolia and Caucus |
3 |
Below, my pedigree results reorganized a bit and compared to Family Tree DNA’s categories.
| Geography |
Pedigree Percent |
Family Tree DNA % |
| European Coastal Plain |
45.7478 |
68 |
| Germany |
23.8041 |
Combined above |
| Holland |
14.5511 |
Combined above |
| France |
6.6113 |
Combined above |
| Switzerland |
0.7813 |
Combined above |
| British Isles |
22.6104 |
7 (Coastal Islands) |
| Turkish |
0.0031 |
3 (Anatolia and Caucus) |
| European by DNA |
6.8362 |
|
| Native American |
0.2933 |
|
| Unknown |
25 |
|
| Trans-Ural Peneplain |
|
11 |
| European Northlands |
|
12 |
Third Party Admixture Tools
www.GedMatch.com is kind enough to include 4 different admixture utilities, contributed by different developers, in their toolbox. Remember, GedMatch is a free, meaning a contribution site – so if you utilize and enjoy their tools – please contribute.
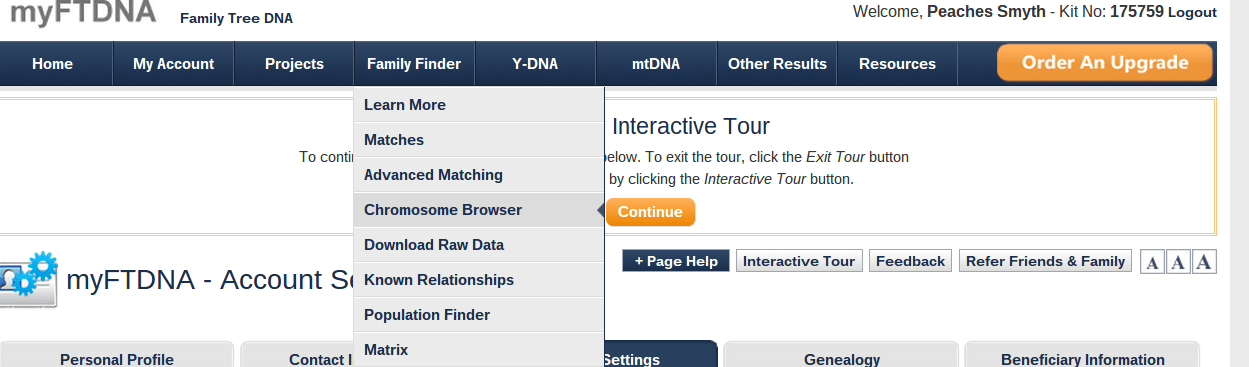
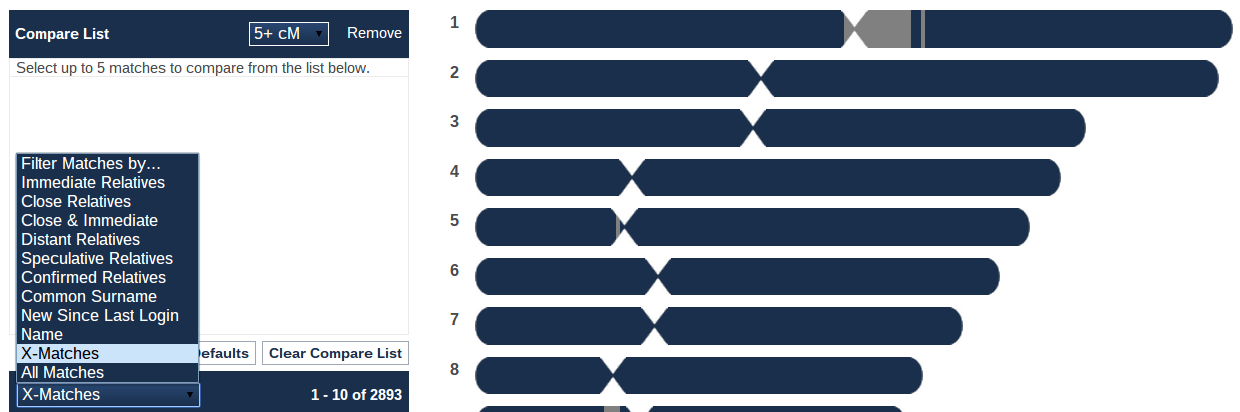
On their main page, after signing in and transferring your raw data files from either 23andMe, Family Tree DNA or Ancestry, you will see your list of options. Among them is “admixture.” Click there.

Of the 4 tools shown, MDLP is not recommended for populations outside of Europe, such as Asian, African or Native American, so I’ve skipped that one entirely.

I selected Admixture Proportions for the part of this exercise that includes the pie chart.
The next option is Eurogenes K13 Admixture Proportions. My results are shown below.
Eurogenes K13

Of course, there is no guide in terms of label definition, so we’re guessing a bit.
| Geography |
Pedigree Percent |
Eurogenes K13% |
| North Atlantic |
75.19 |
44.16 |
| Germany |
23.8041 |
Combined above |
| British Isles |
22.6104 |
Combined above |
| Holland |
14.5511 |
Combined above |
| European by DNA |
6.8362 |
Combined above |
| France |
6.6113 |
Combined above |
| Switzerland |
0.7813 |
Combined above |
| Native American |
0.2933 |
2.74 combined East Asian, Siberian, Amerindian and South Asian |
| Turkish |
0.0031 |
1.78 Red Sea |
| Unknown |
25 |
|
| Baltic |
|
24.36 |
| West Med |
|
14.78 |
| West Asian |
|
6.85 |
| Oceanian |
|
0.86 |
Dodecad K12b
Next is Dodecad K12b
According to John at GedMatch, there is a more current version of Dodecad, but the developer has opted not to contribute the current or future versions.

By the way, in case you’re wondering, Gedrosia is an area along the Indian Ocean – I had to look it up!
| Geography |
Pedigree Percent |
Dodecad K12b |
| North European |
75.19 |
43.50 |
| Germany |
23.8041 |
Combined above |
| British Isles |
22.6104 |
Combined above |
| Holland |
14.5511 |
Combined above |
| European by DNA |
6.8362 |
Combined above |
| France |
6.6113 |
Combined above |
| Switzerland |
0.7813 |
Combined above |
| Native American |
0.2933 |
3.02 Siberian, South Asia, SW Asia, East Asia |
| Turkish |
0.0031 |
10.93 Caucus |
| Gedrosia |
|
7.75 |
| Northwest African |
|
1.22 |
| Atlantic Med |
|
33.56 |
| Unknown |
25 |
|
Third is Harappaworld.
Harappaworld

Baloch is an area in the Iranian plateau.
| Geography |
Pedigree Percent |
Harappaworld % |
| Northeast Euro |
75.19 |
46.58 |
| Germany |
23.8041 |
Combined above |
| British Isles |
22.6104 |
Combined above |
| Holland |
14.5511 |
Combined above |
| European by DNA |
6.8362 |
Combined above |
| France |
6.6113 |
Combined above |
| Switzerland |
0.7813 |
Combined above |
| Native American |
0.2933 |
2.81 SE Asia, Siberia, NE Asian, American, Beringian |
| Turkish |
0.0031 |
10.27 |
| Unknown |
25 |
|
| S Indian |
|
0.21 |
| Baloch |
|
9.05 |
| Papuan |
|
0.38 |
| Mediterranean |
|
28.71 |
The wide variety found in these results makes me curious about how my European results would be categorized using the MDLP tool, understanding that it will not pick up Native, Asian or African.
MDLP K12

The Celto-Germanic category is very close to my mainland European total – but of course, many Germanic people settled in the British Isles.
Second Generation Report Card
Many of these tools picked up my Native American heritage, along with the African. Yes, these are very small amounts, but I do have several proven lines. By proven, I mean both by paper trail (Acadian church and other records) and genetics, meaning Yline and mtDNA. There is no arguing with that combination. I also have other Native lines that are less well proven. So I’m very glad to see the improvements in that area.
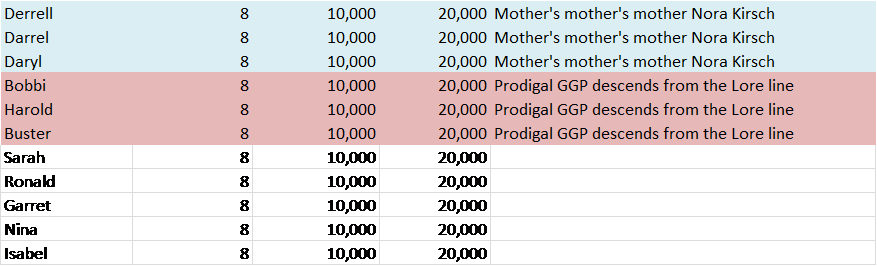
Recent developments in historical research and my mitochondrial DNA matches show that my most distant maternal ancestral line in Germany have some type of a Scandinavian connection. How did this happen, and when? I just don’t know yet – but looking at the map below, which are my mtDNA full sequence matches, the pattern is clear.

Could the gene flow have potentially gone the other direction – from Germany to Scandinavia? Yes, it’s possible. But my relatively consistent Scandinavian ethnicity at around 10% seems unlikely if that were the case.
Actually, there is a second possibility for additional Scandinavian heritage and that’s my heavy Frisian heritage. In fact, most of my Dutch ancestors in Frisia were either on or very near the coast on the northernmost part of Holland and many were merchants.
I also have additional autosomal matches with people from Scandinavia – not huge matches – but matches just the same – all unexplained. The most notable of which, and the first I might add, is with my friend, Marja.
It’s extremely difficult to determine how distant the ancestry is that these tests are picking up. It could be anyplace from a generation ago to hundreds of generations ago. It all depends on how the DNA was passed, how isolated the population was, who tested today and which data bases are being utilized for comparison purposes along with their size and accuracy. In most cases, even though the vendors are being quite transparent, we still don’t know exactly who the population is that we match, or how representative it is of the entire population of that region. In some cases, when contributed data is being used, like testers at 23andMe, we don’t know if they understood or answered the questions about their ancestry correctly – and 23andMe is basing ethnicity results on their cumulative answers. In other words, we can’t see beneath the blanket – and even if we could – I don’t know that we’d understand how to interpret the components.
So Where Am I With This?
I knew already, through confirmed paper sources that most of my ancestry is in the European heartland – Germany, Holland, France as well as in the British Isles. Most of the companies and tools confirm this one way or another. That’s not a surprise. My 35 years of genealogical research has given me an extremely strong pedigree baseline that is invaluable for comparing vendor ethnicity results.
The Scandinavian results were somewhat of a surprise – especially at the level in which they are found. If this is accurate, and I tend to believe it is present at some level, then it must be a combined effect of many ancestors, because I have no missing or unknown ancestors in the first 5 generations and only 11 of 64 missing or without a surname in generation 6. Those missing ancestors in generation 6 only contribute about 1.5% of my DNA each, assuming they contribute an average of 50% of their DNA to offspring in each subsequent generation.
Clearly, to reach 10%, nearly all of my missing ancestors, in the US and Germany, England and the Netherlands would have to be 100% Scandinavian – or, alternately, I have quite a bit scattered around in many ancestors, which is a more likely scenario. Still, I’m having a difficult time with that 10% number in any scenario, but I will accept that there is some Scandinavian heritage one way or another. Finding it, however, genealogically is quite another matter.
However, I’m at a total loss as to the genesis of the South European and Mediterranean. This must be quite ancient. There are only two known possible ancestors from these regions and they are many generations back in time – and both are only inferred with clearly enough room to be disproven. One is a possible Jewish family who went to France from Spain in 1492 and the other is possibly a Roman soldier whose descendants are found within a few miles of a Roman fort site today in Lancashire. Neither of these ancestors could have contributed enough DNA to influence the outcome to the levels shown, so the South European/Mediterranean is either incorrect, or very deep ancestry.
The Eastern European makes more sense, given my amount of German heritage. The Germans are well known to be admixed with the Magyars and Huns, so while I can’t track it or prove it, it also doesn’t surprise me one bit given the history of the people and regions where my ancestors are found.
What’s the Net-Net of This?
This is interesting, very interesting. There are tips and clues buried here, especially when all of the various tools, including autosomal matching, Y and mtDNA, are utilized together for a larger picture. Alone, none of these tools are as powerful as they are combined.
I look forward to the day when the reference populations are in the tens of thousands, not hundreds. All of the tools will be far more accurate as the data base is built, refined and utilized.
Until then, I’ll continue to follow each release and watch for more tips and clues – and will compare the various tools. For example, I’m very pleased to see Family Tree DNA’s new ethnicity matching tool incorporated into myOrigins.
I’ve taken the basic approach that my proven pedigree chart is the most accurate, by far, followed by the general consensus of the combined results of all of the vendors. It’s particularly relevant when vendors who don’t use the same reference populations arrive at the same or similar results. For example, 23andMe uses primarily their own clients and Nat Geo of course, although I did not include them above because they haven’t released a new tool recently, uses their own population sample results.
National Geographic’s Geno2
Nat Geo took a bit of a different approach and it’s more difficult to compare to the others. They showed my ethnicity as 43% North European, 36% Mediterranean and 18% Southwest Asian.

While this initially looks very skewed, they then compared me to my two closest populations, genetically, which were the British and the Germans, which is absolutely correct, according to my pedigree chart. Both of these populations are within a few percent of my exact same ethnicity profile, shown below.

The description makes a lot of sense too. “The dominant 49% European component likely reflects the earliest settlers in Europe, hunter-gatherers who arrived there more than 35,000 years ago. The 44% Mediterranean and the 17% Southwest Asian percentages arrived later, with the spread of agriculture from the Fertile Crescent in the middle East, over the past 10,000 years. As these early farmers moved into Europe, they spread their genetic patterns as well.”

So while individually, and compared to my pedigree chart, these results appear questionable, especially the Mediterranean and Southwest Asian portions, in the context of the populations I know I descend from and most resemble, the results make perfect sense when compared to my closest matching populations. Those populations themselves include a significant amount of both Mediterranean and Southwest Asian. Looking at this, I feel a lot better about the accuracy of my results. Sometimes, perspective makes a world of difference.
It’s A Wrap
Just because we can’t exactly map the ethnicity results to our pedigree charts today doesn’t mean the results are entirely incorrect. It doesn’t mean they are entirely correct, either. The results may, in some cases, be showing where population groups descend from, not where our specific ancestors are found more recently. The more ancestors we have from a particular region, the more that region’s profile will show up in our own personal results. This explains why Mediterranean shows up, for example, from long ago but our one Native ancestor from 7 or 8 generations ago doesn’t. In my case, it would be because I have many British/German/Dutch lines that combine to show the ancient Mediterranean ancestry of these groups – where I have many fewer Native ancestors.
Vendors may be picking up deep ancestry that we can’t possible know about today – population migration. It’s not like our ancestors left a guidebook of their travels for us – at least – not outside of our DNA – and we, as a community, are still learning exactly how to read that! We are, after all, participants on the pioneering, leading edge of science.
Having said that, I’ll personally feel a lot better about these kinds of results when the underlying technology, data bases and different vendors’ tools mature to the point where there the differences between their results are minor.
For today, these are extremely interesting tools, just don’t try to overanalyze the results, especially if you’re looking for minority admixture. And if you don’t like your results, try a different vendor or tool, you’ll get an entirely new set to ponder!
______________________________________________________________
Disclosure
I receive a small contribution when you click on some of the links to vendors in my articles. This does NOT increase the price you pay but helps me to keep the lights on and this informational blog free for everyone. Please click on the links in the articles or to the vendors below if you are purchasing products or DNA testing.
Thank you so much.
DNA Purchases and Free Transfers
Genealogy Services
Genealogy Research


