If you’re going to swim in the pool, then by all means, get the most out of the experience!
In the genetic genealogy community, we have beaten Ancestry to death about what they don’t do (chromosome browser), and what they have and haven’t done (deleted the Y and mtDNA data bases), but there are some things that Ancestry does really well. Records, for example, are one of those things, and I love those. And hints. Shakey leaves.
If I’m going to be an Ancestry customer, I want to get the most out of the combination of those tools as possible, so I’m going to walk through some tricks I learned for how to do that with AncestryDNA
Before I even start, let me say I’m fully aware of the shortcomings, some caused by Ancestry themselves, and some by the actions of their customers – meaning faulty trees, no trees and locked trees. I’m not happy about those as a consumer, but the sheer size and magnitude of the Ancestry data base overcomes part of those shortcomings. In other cases, we’re just going to work around the situation as best we can. One thing is for sure, throwing the baby out with the bath water doesn’t benefit us one bit. And I’ve already spent the money for the DNA test, and my subscription, so I want as much as I can possibly squeeze out of the experience.
Trees Matter… and So Does Size
Before Ancestry DNA, I was a no-tree person. Yep, I’m coming out of the closet. The reason doesn’t really matter, because different people have different reasons and the bottom line is that they get to make their own decision regardless of whether the rest of us like it or not.
In my case, my reluctance to put a tree on Ancestry was because I did not want to upload the tree I have. My tree has been “under construction” for, literally, decades now and I know there are things that are incorrect. I would like to go in and work on every branch and “fix it”, but let’s face it, that’s just not going to happen.
However, DNA testing at Ancestry without having a tree is analogous to flying blind. The best thing about the Ancestry DNA and tree matching is that they do the heavy lifting for you by showing you which people match your DNA AND have a common ancestor showing in a tree. Those are the shakey leaf DNA hints. Of course, that doesn’t automatically mean that your shared DNA comes from that ancestor, but it’s a great research starting point.

Of my 3800 DNA matches at Ancestry, today I have 112 shakey leaf matches, or about 3%.
Of course, this dual DNA match and pedigree match suggests a line that may be a genetic match, but as we saw in the article, Secondary Genealogical and Genetic Lines, there may be a second line contributing to the DNA match or even entirely responsible for the match. So, while this is a great “shakey leaf” hint, as Ancestry says, that’s all it is – a hint.
However, that’s really not so terribly different than the rest of Ancestry’s tools. They show you shakey leafs for possible matching documents and trees and it’s up to you to use common sense and your knowledge of your family to figure out which hints are relevant to your situation, and which are not.
With no tree at Ancestry, I obviously had no shakey leafs, because Ancestry had nothing to compare too.
I wasn’t about to upload my entire file, so instead, I decided to create a bare bones tree at Ancestry, just for the DNA data base. That’s actually not a bad idea, because it allows you to “touch” and fine tune each entry and utilize Ancestry’s matching strengths and avoid any problem areas.
So, I clicked on “Family Trees” on the toolbar and started a new tree with me, the tester, I added 4 generations. That’s only 30 people. Not too much to type and I only added the birth and death dates and locations.

That is the total number of ancestors shown on Ancestry’s first page when your tree is displayed pedigree style, and I figured it would “catch” most of the DNA matches which I figured would be in the first few generations, especially since Ancestry’s rather harsh tree pruning.
Just so you know, I was wrong.
When I completed this tree, I waited until the next day and I checked my shakey leaves. Ancestry told us when we visited in October 2014 that they run a data base update every 4 hours, but waiting until the next day assured that I had given them ample time.
I had a total of 41 shakey leaves. I was pretty happy. For awhile. Until I started thinking, “what if?”
Ancestry provides matching shakey leaves up to 10 generations, with you counted as generation one, so I began to wonder what adding another few generations would provide.
I didn’t expect much, actually, since I figured that I had gathered the majority of what was to be gleaned already.
Again, I was wrong. This is beginning to sound like a chorus from a Country song isn’t it!
I added another 4 generations, or at least as much as I could.

My shakey leaves jumped to 48 immediately, so they had increased by 7. I was happy and that’s about what I expected, so imagine my surprise when the next morning I checked and noticed that I had 95 shakey leaf matches.
95 – Wow!
That’s double what I had before.
At first that didn’t make sense, because I thought surely most of those matches would be caught in earlier generations, until I actually looked at one of the “older” matches.
For example, Moses Estes – my match with Moses descends from Moses through a different child than my line – so there was no “common ancestor” in our trees before Moses. And the further back you go in time, the longer they have had to have more descendants to test – so while the DNA segments become smaller as they are divided in each generation – there are also more people testing, so the odds of finding someone whom you match increases, up to a point.
So….you know what I did then….right???
I added two more generations where I had the information, and sure enough, the next day, I had 112 shakey leaves.
So, by going from 4 generations (plus me) to 10 generations (plus me) I also went from 41 shakey leaf matches to 112. Granted, some of these are private trees and one has no tree, but 99 of the matches are visible to me.
Tree Hints
When creating your bare bones DNA tree, don’t overdo the bare bones part. In order to actually help Ancestry help you, which is the goal here – you have to give them something to work with.
Ancestry uses a combination of matching factors, but here are a few dos and don’ts based on my experience and some experimenting. Remember, this is not your life work….this is about making the tree most likely to catch fish – so don’t be terribly fussy.
Don’t
- Don’t use words in names other than names. Don’t say John “the Miller” Jones. The extraneous characters don’t allow matching. Same for parenthesis. In this case, just say John Jones. Ancestry will use other criteria to determine if it’s a match, like location, dates, spouse, etc.
- Don’t add a string of pseudo names like “Sarah Sally Sary” Jones. That tends to confuse the software too, as do commas and other punctuation.
- Don’t add two surname spellings like “Muncey or Munsey” or anything with a slash like “Muncey/Munsey”.
- Don’t be too wordy with locations, like “Estes Holler, Claiborne County, TN” as a birth location. Stick with just “Claiborne County, TN.”
Do
- Provide locations, even if they are general, like a state. That helps in terms of matching and also helping people see if an alternate lineage might also match.
- Provide dates as estimates, even if you’re not exactly sure. In cases where you have a date range, like 1840-1850, you can either enter that as a range or you can just use a date like 1845. The absolute date won’t disqualify the match, but I know Ancestry uses a variety of factors to see if it’s a viable match. In other words, you won’t be matched with Sarah Jones married to Jeff Smith born in the 1900s if yours was born in the 1600s.
- Use the most common surname spelling. You can easily do a quick edit and change this from time to time to see if it makes a difference in who you “catch” in the net.
If you already have a tree at Ancestry that you are using, you might want to take a look at the first few generations with DNA matching in mind and perhaps groom it a bit.
DNA Circles
Ironically, nothing I did affected my circles or the number of circles I have. DNA Circles and how they come and go mystifies me. I have some circles that have been added since circles began, but I also have some circles that were present that are now gone. Of course, it takes a minimum of 3 people to create a circle, and if one person in the group of 3 makes their tree private – poof – the entire Circle is gone. The hint here is to check your Ancestry DNA page daily for new circles and new matches – because they may not be there tomorrow!
Ancestry creates DNA Circles back to 7 generations (with you counted as generation one1), not the 10 generations of tree matching, which may be why the addition of common ancestors, in my case, did not cause new circles to be created. Ancestry does plan to expand the circles to 10 generation in the future.
Today, I have 13 circles. Circles are a combination of people who match you on DNA and share an ancestor, and people who match each other, but not your DNA, and share that same ancestor creating a sort of human/pedigree/DNA chain to that ancestor, at least theoretically.
Even though DNA Circles aren’t proof of a genetic connection to that ancestor in question, they certainly provide some amount of evidence of common DNA and ancestry, especially if you and the other Circle members descend from different children from the same ancestor.
My circles have from 3 to 12 members, only some of which are shown below.

However, how I do or don’t match to people within the circles is vastly different.
 For example, in the Jacob Lentz circle, I match the DNA of two individuals. I do not match the DNA of the other two individuals, but they match the DNA of other circle members. Of course, we all share the same ancestor in our pedigree chart.
Again, without a chromosome browser this does not constitute proof, but it does constitute evidence.
When I look at the trees of my DNA matches, I noticed that we also descend through three different children of Jacob Lentz. This is an important piece of evidence, because it means that we aren’t all three working from the same bad tree.
What I mean by this is that if one person published a bad tree that included my ancestral link to Jacob Lentz, and everyone copied it, then all of our trees would be “bad” in the same way and it could well appear like the DNA match confirms a “bad tree.” Garbage in, garbage out.
So, descent from different children of a common ancestor is one of the things I look for in matches trees and DNA Circles to suggest that it might be a valid piece of evidence.
In one of my trees, Joel Vannoy, I am a DNA and tree match to every individual in the circle. In a different tree, Nicholas Speaks, I am only a DNA match directly to one person. So, hopefully that one person doesn’t make their tree private or my link to that circle will be gone.
Ok, now that we’ve reviewed trees, matches and circles, let’s look at strategies to make Ancestry work harder for us.
Experimental Branches
I have to tell you, I’m just sure lightning is going to strike me for this one. But darn, it works.
One of the main reasons I didn’t want to publish a tree on Ancestry originally was that I was concerned about the quality and accuracy of what was in my tree, especially since cut and paste seems to be a favorite mode of operation which makes wrong information “forever information” after it’s cut and pasted from the source tree.
So what I’m about to suggest runs against every fiber of my being. And if it didn’t work so well, I wouldn’t even be telling you about it….but it does. So the purist in me is just having to get over herself because the curious genealogist is winning out over the purist.
I have several situations where I’m just not positive about something in my tree, so let me tell you what I’ve done to help solve the mystery.
Sarah Hickerson
Let’s start with Sarah Hickerson. I’ve written about this several times in various ways, but to summarize, we didn’t know the identity of the parents of Elijah Vannoy, born in 1786. We did know they were one of 4 men in Wilkes County, all 4 the sons of one John Vannoy. We also knew who all 4 sons married.
I decided to try an experiment and enter the most likely parents of Elijah Vannoy and see what happened. I knew that the key to this mystery would be to prove the wife’s DNA, because the 4 Vannoy men were brothers.
Elijah’s most likely parents were Daniel Vannoy and Sarah Hickerson. Furthermore, I knew the parents of Sarah Hickerson to be Charles Hickerson and Mary Lytle (Little.) I entered this information, not expecting much, when to my surprise, a DNA Circle appeared linking me with descendants of Charles Hickerson and Mary Lytle. There was no DNA circle for Francis Vannoy and Sarah Hickerson.
I made contact with the people I matched at Ancestry and then found additional Hickerson matches at Family Tree DNA. The rest, as they say, is history, but we proved the connection through triangulation techniques.
Without having entered the experimental couple of Daniel Vannoy and Sarah Hickerson, plus Sarah’s parents, we would never have been able to do this. It wasn’t Sarah herself in the tree that made the difference, but the addition of her parents.
Nabby Hall
After that success, I noticed another “maybe” on my tree where I had the names of the potential ancestor’s parents as well.
I had Joseph Hill and his wife Nabby, with Nabby’s parents probably being Gershom Hall and Dorcas Richardson. I entered Hall as Nabby’s surname, then entered her parents, and voila, next day, I had two matches to descendants of Gershom Hall and Dorcas Richardson through two different siblings. So, between the three of us, we have matches through their 2 proven siblings and my suspected sibling.
There is no DNA Circle, so these are direct matches. Unfortunately, my two matches have not downloaded their information to either GedMatch or Family Tree DNA. I looked in the trees at Family Tree DNA, but I have been unable to find descendants of Gershom Hall and Dorcas Richardson, so I can’t prove this genetic connection just yet.
However, I know that it’s just a matter of time now until enough people test that someone will match and download their results to GedMatch or people from that family line will test at Family Tree DNA.
So, if you descend from this Hall line out of Tolland County, CT, please test at Family Tree DNA (where we have chromosome browser tools) or if you have tested at Ancestry, please transfer your results!!! But mostly, please contact me!
Nancy Mann
I’ve been working with a cousin, Pam, for several months now to solve the mystery of the parents of Nancy Mann. Our common ancestor is Henry Bolton and Nancy Mann, through different sons.
Through paper genealogy and mitochondrial DNA, we had narrowed Nancy’s line of descent to the Irish Mann family instead of the German Mann family in Botetourt County, VA. However, the paper trail ran out for us, and I thought we were done.
Between Pam and I, we have more than 20 cousins who have tested. Pam, noticed repeated matches in the cousins to specific surnames and she set about using those repeated names to reconstruct a tree.
She did, amazingly, and sent me an e-mail suggesting that I enter the tree as an experiment and see what happens. Here is the experimental tree that Pam reconstructed which connects to Nancy Mann.
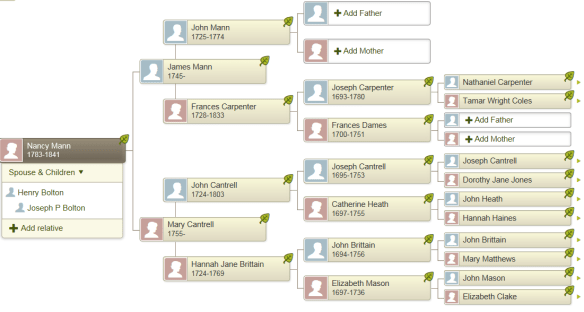
I entered this tree as Nancy’s ancestors, feeling very guilty as it was unproven, and was utterly amazed at the results.
I have 9 shakey leaf matches within the group of potential ancestors: 1 to John Cantrell, 4 to John Cantrell and Hannah Brittain, 1 to Joseph Cantrell and Catherine Heath and 3 to Joseph Carpenter and Frances Dames. You’ll notice that these are Nancy’s mother’s and father’s lines, both. All but 2 are through different children.
I don’t match my cousin Pam, nor many of our other cousins, especially in her line, but when she looked at my matches compared to theirs, every match was in both of our lists except one. Why don’t we have DNA Circles? I have no idea. We should have at least one even with the 7 generation limit. Like I said, Circles and how they are created mystify me.
We are still in the process of confirming this at Family Tree DNA and/or Gedmatch. Convincing this many people to download results is no trivial matter.
This possible tree growth spurt also needs to be worked backwards genealogically, via old-fashioned paper, if possible, to prove that Nancy Mann did in fact descend from James Mann and Mary Cantrell. Sometimes if you know where to work “from to current” it’s much easier than trying to work backwards blindly.
Have I mentioned that my cousin is an amazing genealogist with an incredible eye for detail???
The Campbells
Encouraged by this apparent success, I decided to try another possible couple. This one didn’t work nearly so well.
Based on deeds, we believe John and George Campbell of Claiborne County, TN to be the sons of Charles Campbell who died in 1825 in Hawkins County, TN. Unfortunately, the Hawkins County records are incomplete and the proof documents we need are nonexistent or missing. Oh, and there are no other known children so there is no one out there to match that knows they connect to Charles.
Family lore tells us a different story, that John and George are the sons of James Campbell, son of Robert Campbell and Letitia Crocket that also lived and died in Hawkins County, TN, albeit on the other end of the county in a different mountain range. I have found no records to support that story, but also none to outright refute it.
I noticed that a couple of my matches on other surnames also had matches to this line, so I decided to remove Charles and enter James and his wife and parents. No luck at all, not one match. Now, I don’t know if this means that not enough people have tested or if I’m barking up the wrong tree. We are not beyond the 10 generation matching limit.
It’s not like we can see how many other people have this individual in their tree AND have DNA tested that we don’t match.
Success Strategy
First, create a tree with the idea of making it useful for catching DNA matches. This is not a masterpiece, but a tool for you. You don’t need siblings or collateral lines. The only thing Ancestry is going to look for are direct ancestors.
Think differently about experimenting with your tree than you did in the past. Allow yourself to experiment with different surname spellings, possible parents, reconstructing segments of trees based on multiple matches and anything else that might lead to a breakthrough. Think outside the box. Actually, throw the box away.
Keep in mind the 10 generation matching limit and the (current) 7 generation DNA Circles limit. In both cases, you count as the first generation.
If you find information you think is useful to pursue genetically, then move, in whatever way you can, to a platform that has tools for you to use to triangulate your match, either at Family Tree DNA or at Gedmatch, or preferably both.
This “new tree strategy” is about finding evidence that you can use to further your paper genealogy or prove a genetic match. It’s about utilizing Ancestry’s system to gather information in a bit of a different way to build an evidential case. You may not be able to do everything at Ancestry, but utilize their strong points combined with your tree to increase the odds of finding your ancestors.
Those shakey leaves really are useful! Make them dance for you.
Happy Hunting!!!
______________________________________________________________
Disclosure
I receive a small contribution when you click on some of the links to vendors in my articles. This does NOT increase the price you pay but helps me to keep the lights on and this informational blog free for everyone. Please click on the links in the articles or to the vendors below if you are purchasing products or DNA testing.
Thank you so much.
DNA Purchases and Free Transfers
Genealogy Services
Genealogy Research