Why Are My Predicted Cousin Relationships Wrong?

The answer is, because inherited DNA segments do not always follow the 50% rule.  I guess maybe no one told them???

Many times, when we receive our autosomal DNA results, we wonder why predicted relationships, particularly distant ones, aren’t accurate.  Sometimes people estimated to be 3rd cousins, or maybe 2nd to 4th cousins, turn out to be 6th cousins, for example.  This happens because genetic predictions must use math models and averages, but our actual DNA doesn’t follow those rules.

Dr. Steve Mount is an Associate Professor of Cell Biology and Molecular Genetics at the University of Maryland.  In February 2011, he wrote an article about his experience submitting his DNA to 23andMe and his experiences matching his cousins.  More specifically, he became interested in one particular segment of DNA trackable to a specific ancestor.

He shares these insights.

  • Distant relatives (4th cousins and beyond) often share no genetic material at all.
  • It is possible to share a segment with very distant relatives.
  • Sometimes, more distant relationships are more likely.
  • Most of your relatives may be descended from a small fraction of your ancestors.

In genetic genealogy, people who deal with autosomal DNA spend a lot of time trying to figure out which segments are IBD vs IBS – Identical by Descent versus Identical by State.  In laymen’s terms, identical by descent means that you do in fact share a common ancestor in a timeframe in which you might be able to identify them.  Identical by state really implies, technically, that you just happen to have the same DNA due to spontaneous mutations, not because you share a common ancestor.  In reality, it’s taken to mean that you descend from a common population –  in other words, you do share a common ancestor but the segment is so small that it implies that the ancestor is so far back in time that you can’t possibly identify them.  Some people call these matches “false positives” which really isn’t accurate.

Far from being useless, these small segments are very useful in identifying different ethnic populations found in your ancestral tree and can, often in conjunction with larger segments also be useful in identifying ancestral lines.  Discounting small segments, especially if you share a common ancestor, is akin to throwing away pennies because they aren’t as useful and are more difficult to manage than quarters or dollars.  Furthermore, small segments may be our only way of identifying ancestors that are many generations back in our tree.  After all, we inherited all of our DNA from some ancestor, no matter how small the segments are today.

Because we have no better rule of thumb (or statistical model), we utilize the theory that one inherits about 50% of the DNA of each ancestor in each generation.  We know this is absolutely true between Mom and Dad, but you don’t receive exactly 25% of each of your grandparents’ DNA.  However, the mixture of what and how much of your grandparents’ DNA you do inherit is approximately 25% and appears to be random, like a card shuffle.  If it’s not random, we don’t know what the rules of inheritance are.

In the past few years, as we’ve come to work more closely with autosomal results, we have learned that while the rules of thumb about how much DNA you inherit from specific ancestors are useful, they are not absolute.  In other words, it’s certainly possible to inherit a very large chunk of DNA from a very specific distant ancestor when the rules of probability and the rule of thumb of 50% would indicate that you should not.

This is shown clearly in the Vannoy project where 5 cousins who descend from Elijah Vannoy born in 1786 (5 generations removed) share a very significant portion of chromosome 15.  These people are all 5 generations or more distantly related from the common ancestor, (approximate 4th cousins) and should share less than 1% of their DNA in total, and certainly no large, unbroken segments.   As you can see, below, that’s not the case.  We don’t know why or how some DNA clumps together like this and is transmitted in complete (or nearly complete) segments, but they obviously are.  We often call these “sticky segments” for lack of a better term.

cousin 1

I downloaded this information into a spreadsheet where I can sort it by chromosome.  Below you can see the segments on chromosome 15 where these cousins match me.  Note that Buster is also a cousin from a second ancestor.

cousin 2

Given these incidental discoveries and the very large amount of DNA I share with these cousins on chromosome 15, I was quite interested in Dr. Mount’s following commentary:

“The probability that fourth cousins share at least one IBD [identical by descent] segment is 77%, and the expected length of this segment is 10 cM.” Now consider the next step. There is a 50% chance that that one shared segment will not be transmitted at all, but a 90% chance that if it is transmitted it will be just as big as it was (the same 10 cM.). What this means for genealogy on 23andMe is that for two people sharing one segment identical by descent there is no way to reliably estimate how far back the common ancestor was. Furthermore, no improvement in software can possibly change that, because the limitation is imposed by the genetics itself.”

Well, there goes the 50% rule – flying right out the window.  The 50% rule of thumb says that in any given transmission, there is a 50% chance that it will be transmitted (so good so far) and that if it is transmitted, roughly half of it would be transmitted, or approximately 5 cM..  That’s obviously not what is happening.

Dr. Mount goes on to say that, “No matter how far back you go, every nucleotide of one’s genome is derived from some ancestor, and even going back 20 generations, the chance that the bit which has been inherited is part of a block 5 cM. or greater is still appreciable. In fact, even for 19th cousins, there is a real chance (13%) that any segment of DNA they have inherited in common will be 5 cM. or greater. Of course, as mentioned above, there is very little chance that two 19th cousins will share any IBD segments at all, but this is offset if one has many 19th cousins, which is often the case.”

5cM is the line-in-the-sand cutoff number many genetic genealogists use to determine whether DNA segments are IBD or IBS.

What this really means is that the more distant, or 19th, cousins that you have, the greater the chance that one or more of them will test and will indeed share a piece of DNA large enough to be identified by the testing companies as relevant.  The software companies will then apply their relationship estimating software to the size of the match and number of SNPs.  The results are often inaccurate, as Dr. Mount says.  Not inaccurate in that the match is incorrect, but the estimated relationship is incorrect because the DNA did not divide in half as the mathematical model says it should.  The “problem” is not in the software, but in the DNA itself.

“23andMe reports a “predicted relationship” (e.g. “4th cousin”) and a “relationship range” (e.g. “3rd to 7th cousin”). However, these ranges are likely to be wildly inaccurate, because the likely distance to a common ancestor, given only the information that two people share a single IBD segment, can vary enormously, based largely on how many relatives one has.”

And I will add, it will also vary by how and how much the DNA has or has not divided in every generation.

Dr. Mount goes on to provide the math and probability formulas for these various calculations, and explains what they mean, in English, then he summarizes by saying, “

“Thus, if you have many more distant cousins, as would be expected if your ancestors had large families, then someone who shares a single IBD segment is more likely to be a distant cousin, because you have so many more distant cousins. The point where the increase in the number of cousins outweighs the loss of shared segments is five children per family. This is not extremely uncommon.”

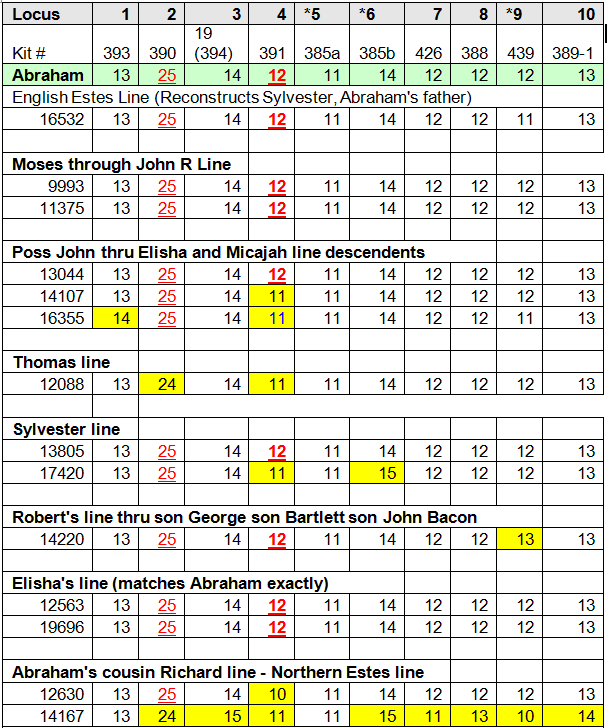
This actually makes a lot of sense when I look at my results.  One of my ancestors, Abraham Estes (1647-1720) had at least 12 children of which 11 reproduced and had very large families.  This line was extremely prolific.  Many of my autosomal matches include Estes descendants.  Some of my other lines where my ancestor was one of just a few children have far fewer matches, likely because there are far fewer people out there descended from them.

Dr. Mount confirms this by saying that, “If one family among [your] 32 [great-great-great-grandparents] had five children and their descendants did as well, while others in the family reproduced at replacement rates (two children per family), then your more prolific ancestors (the parents of just one of your 31 great-great-grandparents) would account for over 3/4 of your fourth cousins.”

So what is the take away message to us from all of this?

  • The autosomal testing companies are doing the best they can predicting your cousin-level relationships with what they have to work with.
  • Real life genetic transmission does not follow the 50% rule of thumb beyond the first generation (parent-child).
  • The predictions get more uncertain and therefore unreliable the more distant they are.
  • Based on the unmeasureable randomness of the genetic transmission involved, there is no way for the testing companies to improve their predictions.
  • Expect more matches to your more prolific lines, and less to lines who had fewer children.
  • Beyond about the first or second cousin level, understand that predictions are only suggestions based on math.  Given that you understand why and how reality can vary, you can then utilize this information when analyzing your matches.
  • Drawing an arbitrary cM line for IBS vs IBD and utilizing only the segments above that threshold may eliminate the small segments you need to identify ancestors many generations removed.
  • Endogamous populations throw a monkey wrench into estimates and calculations, because population members are likely related many times over in unknown ways.  This makes the estimate of relatedness of two people appear closer than it is genealogically.  At least one of the testing companies, Family Tree DNA, attempts to correct for this mathematically when they are aware of the situation, such as in Jewish families.

You can read Dr. Mount’s article including his mathematical proofs, here.

______________________________________________________________

Disclosure

I receive a small contribution when you click on some of the links to vendors in my articles. This does NOT increase the price you pay but helps me to keep the lights on and this informational blog free for everyone. Please click on the links in the articles or to the vendors below if you are purchasing products or DNA testing.

Thank you so much.

DNA Purchases and Free Transfers

Genealogy Services

Genealogy Research

Determining Ethnicity Percentages

Recently, as a comment to one of my blog postings, someone asked how the testing companies can reach so far back in time and tell you about your ancestors.  Great question.

The tests that reliably reach the furthest back, of course, are the direct line Y-Line and mitochondrial DNA tests, but the commenter was really asking about the ethnicity predictions.  Those tests are known as BGA, or biogeographical ancestry tests, but most people just think of them or refer to them as the ethnicity tests.

Currently, Family Tree DNA, 23andMe and Ancestry.com all provide this function as a part of their autosomal product along with the Genographic 2.0 test.  In addition, third party tools available at www.gedmatch.com don’t provide testing, but allow you to expand what you can learn with their admixture tools if you upload your raw data files to their site.  I wrote about how to use these ethnicity tools in “The Autosomal Me” series.  I’ve also written about how accurate ethnicity predictions from testing companies are, or aren’t, here, here and here.

But today, I’d like to just briefly review the 3 steps in ethnicity prediction, and how those steps are accomplished.  It’s simple, really, in concept, but like everything else, the devil is in the details.devil

There are three fundamental steps.

  • Creation of the underlying population data base.
  • Individual DNA extraction.
  • Comparison to the underlying population data base.

Step 1:  Creation of the underlying population data base.

Don’t we wish this was as simple as it sounds.  It isn’t.  In fact, this step is the underpinnings of the accuracy of the ethnicity predictions.  The old GIGO (garbage in, garbage out) concept applies here.

How do researchers today obtain samples of what ancestral populations looked like, genetically?  Of course, the evident answer is through burials, but burials are not only few and far between, the DNA often does not amplify, or isn’t obtainable at all, and when it is, we really don’t have any way to know if we have a representative sample of the indigenous population (at that point in time) or a group of travelers passing through.  So, by and large, with few exceptions, ancient DNA isn’t a readily available option.

The second way to obtain this type of information is to sample current populations, preferably ones in isolated regions, not prone to in-movement, like small villages in mountain valleys, for example, that have been stable “forever.”  This is the approach the National Geographic Society takes and a good part of what the Genograpic Geno 2.0 project funding does.  Indigenous populations are in most cases our most reliable link to the past.  These resources, combined with what we know about population movement and history are very telling.  In fact, National Geographic included over 75,000 AIMs (Ancestrally Informative Markers) on the Geno 2.0 chip when it was released.

The third way to obtain this type of information is by inference.  Both Ancestry.com and 23andMe do some of this.  Ancestry released its V2 ethnicity updates this week, and as a part of that update, they included a white paper available to DNA participants.  In that paper, Ancestry discusses their process for utilizing contributed pedigree charts and states that, aside from immigrant locations, such as the United States and Canada, a common location for 4 grandparents is sufficient information to include that individuals DNA as “native” to that location.  Ancestry used 3000 samples in their new ethnicity predictions to cover 26 geographic locations.  That’s only 115 samples, on average, per location to represent all of that population.  That’s pretty slim pickins.  Their most highly represented area is Eastern Europe with 432 samples and the least represented is Mali with 16.  The regions they cover are shown below.

ancestry v2 8

Survey Monkey, a widely utilized web survey company, in their FAQ about Survey Size For Accuracy provides guidelines for obtaining a representative sample.  Take a look.  No matter which calculations you use relative to acceptable Margin of Error and Confidence Level, Ancestry’s sample size is extremely light.

23andMe states in their FAQ that their ethnicity prediction, called Ancestry Composition covers 22 reference populations and that they utilize public reference datasets in addition to their clients’ with known ancestry.

23andMe asks geographic ancestry questions of their customers in the “where are you from” survey, then incorporates the results of individuals with all 4 grandparents from a particular country.  One of the ways they utilize this data is to show you where on your chromosomes you match people whose 4 grandparents are from the same country.  In their tutorial, they do caution that just because a grandparent was born in a particular location doesn’t necessarily mean that they were originally from that location.  This is particularly true in the past few generations, since the industrial revolution.  However, it may still be a useful tool, when taken with the requisite grain of salt.

23andme 4 grandparents

The third way of creating the underlying population data base is to utilize academically published information or information otherwise available.  For example, the Human Genome Diversity Project (HGDP) information which represents 1050 individuals from 52 world populations is available for scrutiny.  Ancestry, in their paper, states that they utilized the HGDP data in addition to their own customer database as well as the Sorenson data, which they recently purchased.

Academically published articles are available as well.  Family Tree DNA utilizes 52 different populations in their reference data base.  They utilize published academic papers and the specific list is provided in their FAQ.

As you can see, there are different approaches and tools.  Depending on which of these tools are utilized, the underlying data base may look dramatically different, and the information held in the underlying data base will assuredly affect the results.

Step 2:  Your Individual DNA Extraction

This is actually the easy part – where you send your swab or spit off to the lab and have it processed.  All three of the main players utilize chip technology today.  For example, 23andMe focuses on and therefore utilizes medical SNPs, where Family Tree DNA actively avoids anything that reports medical information, and does not utilize those SNPs.

In Ancestry’s white paper, they provide an excellent graphic of how, at the molecular level, your DNA begins to provide information about the geographic location of your ancestors.  At each DNA location, or address, you have two alleles, one from each parent.  These alleles can have one of 4 values, or nucleotides, at each location, represented by the abbreviations T, A, C and G, short for Thymine, Adenine, Cytosine and Guanine.  Based on their values, and how frequently those values are found in comparison populations, we begin to fine correlations in geography, which takes us to the next step.

ancestry allele snps

Step 3:  Comparison to Underlying Population Data Base

Now that we have the two individual components in our recipe for ethnicity, a population reference set and your DNA results, we need to combine them.

After DNA extraction, your individual results are compared to the underlying data base.  Of course, the accuracy will depend on the quality, diversity, coverage and quantity of the underlying data base, and it will also depend on how many markers are being utilized or compared.

For example, Family Tree DNA utilizes about 295,000 out of 710,000 autosomal SNPs tested for ethnicity prediction.  Ancestry’s V1 product utilized about 30,000, but that has increased now to about 300,000 in the 2.0 version.

When comparing your alleles to the underlying data set one by one, patterns emerge, and it’s the patterns that are important.  To begin with, T, A, C and G are not absent entirely in any population, so looking at the results, it then becomes a statistics game.  This means that, as Ancestry’s graphic, above, shows, it becomes a matter of relativity (pardon the pun), and a matter of percentages.

For example, if the A allele above is shown is high frequencies in Eastern Europe, but in lower frequencies elsewhere, that’s good data, but may not by itself be relevant.  However if an entire segment of locations, like a street of DNA addresses, are found in high percentages in Eastern Europe, then that begins to be a pattern.  If you have several streets in the city of You that are from Eastern Europe, then that suggests strongly that some of your ancestors were from that region.

To show this in more detailed format, I’m shifting to the third party tool, GedMatch and one of their admixture tools.  I utilized this when writing the series, “The Autosomal Me” and in Part 2, “The Ancestor’s Speak,” I showed this example segment of DNA.

On the graph below, which is my chromosome painting of one a small part of one of my chromosomes on the top, and my mother’s showing the exact same segment on the bottom, the various types of ethnicity are colored, or painted.

The grid shows location, or address, 120 on the chromosome and each tick mark is another number, so 121, 122, etc.   It’s numbered so we can keep track of where we are on the chromosome.

You can readily see that both of us have a primary ethnicity of North European, shown by the teal.  This means that for this entire segment, the results are that our alleles are found in the highest frequencies in that region.

Gedmatch me mom

However, notice the South Asian, East Asian, Caucus, and North Amerindian. The important part to notice here, other than I didn’t inherit much of that segment at 123-127 from her, except for a small part of East Asian, is that these minority ethnicities tend to nest together.  Of course, this makes sense if you think about it.  Native Americans would carry Asian DNA, because that is where their ancestors lived.  By the same token, so would Germans and Polish people, given the history of invasion by the Mongols. Well, now, that’s kind of a monkey-wrench isn’t it???

This illustrates why the results may sometimes be confusing as well as how difficult it is to “identify” an ethnicity.  Furthermore, small segments such as this are often “not reported” by the testing companies because they fall under the “noise” threshold of between about 5 and 7cM, depending on the company, unless there are a lot of them and together they add up to be substantial.

In Summary

In an ideal world, we would have one resource that combines all of these tools.  Of course, these companies are “for profit,” except for National Geographic, and they are not going to be sharing their resources anytime soon.

I think it’s clear that the underlying data bases need to be expanded substantially.  The reliability of utilizing contributed pedigrees as representative of a population indigenous to an area is also questionable, especially pedigrees that only reach back two generations.

All of these tools are still in their infancy.  Both Ancestry and Family Tree DNA’s ethnicity tools are labeled as Beta.  There is useful information to be gleaned, but don’t take the results too seriously.  Look at them more as establishing a pattern.  If you want to take a deeper dive by utilizing your raw data and downloading it to GedMatch, you can certainly do so. The Autosomal Me series shows you how.

Just keep in mind that with ethnicity predictions, with all of the vendors, as is particularly evident when comparing results from multiple vendors, “your mileage may vary.”  Now you know why!

______________________________________________________________

Disclosure

I receive a small contribution when you click on some of the links to vendors in my articles. This does NOT increase the price you pay but helps me to keep the lights on and this informational blog free for everyone. Please click on the links in the articles or to the vendors below if you are purchasing products or DNA testing.

Thank you so much.

DNA Purchases and Free Transfers

Genealogy Services

Genealogy Research

Why Don’t I Match My Cousin?

no cousin

I receive this question regularly from people who have taken one of the autosomal DNA tests and who expected to match a cousin, but don’t.

Of course, the Jeff Foxworthy in me wants to say, “Because he’s not your cousin,” but fortunately, I never let my inner Jeff Foxworthy out in public.

Actually, that’s often their biggest fear – that they are uncovering a very unpleasant family secret – but Jeff Foxworthy aside – that’s generally not the case.

Let’s take a look at why.

According to Family Tree DNA’s FAQ on the subject, combined with the percentage of DNA shared with each type of cousin, we find the following.

Relationship to You Likelihood of a Match % of DNA Shared
1st Cousin (common grandparents) 100% 7-13
2nd Cousin (common great-grandparents) >99% 3-5
3rd Cousin (common great-great grandparents >90% .3-2
4th Cousin (common ggg grandparents) >50% <1%
5th Cousin (common gggg grandparents) >10% Sometimes none detectable at match threshold
6th Cousin (common ggggg grandparents) <2% Often none detectable at match threshold

If you don’t match your first cousin, then you need to start thinking about Jeff Foxworthy or you’re simply extremely lucky, or unlucky, depending on your perspective.  Buy a lottery ticket. 

In all seriousness, if you don’t match a first cousin, consider having your sibling (or parent) or your cousin’s sibling or relevant parent test as well.  In some cases, two people simply inherit different DNA and even though they don’t match each other, they do match other people in the same family. 

However, if you’re going to go down this path, be prepared that the answer may be that you really aren’t genetic cousins.  By the time you get to this point, you’ve already peeked into Pandora’s box though, so it’s kind of hard to shut the crack and pretend you never looked. 

Another option for determining whether or not you really match that cousin is to download both of your results to GedMatch.  The testing companies have pre-set match thresholds that determine what is and is not a match.  That’s a good thing, but what if your match is just slightly under that threshold, and there aren’t other relatives to test?  GedMatch allows you to match at very small segment levels that would generally be considered population matches and not genealogy matches.  

Judy Russell had the perfect example of just this situation in her Widen the Net blog.  Her mismatch was with a 3rd cousin.  According to this the chart above, she stood a greater than 90% change of matching, but she didn’t, so she’s in the special 10%.  And that 10% gets left wondering.  Fortunately, Judy had tested aunts, uncles and another first cousin, and her cousin who did not match her did match them. 

The moral of this story is:

  • Ignore Jeff Foxworthy when he starts to whisper in your ear, at least initially
  • Test as many family members as you can
  • Don’t jump to conclusions
  • Utilize third party tools like GedMatch if necessary
  • Understand that if you test enough family lines, you will eventually find an undocumented adoption someplace

______________________________________________________________

Disclosure

I receive a small contribution when you click on some of the links to vendors in my articles. This does NOT increase the price you pay but helps me to keep the lights on and this informational blog free for everyone. Please click on the links in the articles or to the vendors below if you are purchasing products or DNA testing.

Thank you so much.

DNA Purchases and Free Transfers

Genealogy Services

Genealogy Research

Black, White or Red – Changing Colors

henry finding your roots

The Root recently published the article, “Did My White Ancestor Become Black?”, written by Henry Louis Gates Jr. and Eileen Pironti.  We all know who Henry is from his PBS Series, Finding Your Roots.

America is the great mixing bowl of the world, with Native American, European and African people living in very close proximity for the past 400 years.  Needless to say, on the subject of admixture and race, things are not always what they seem.

Henry Gates sums it up quite well in his article, regardless of what your ancestor looked like, or your family looks like today, “the only way to ascertain the ethnic mixture of your own ancestry is to take an admixture test from Family Tree DNA, 23andMe or Ancestry.com.”

Interestingly enough, in an earlier issue of The Root, Henry talks about how black are Black Americans.

In that article, Henry provides this information.

* According to Ancestry.com, the average African American is 65 percent sub-Saharan African, 29 percent European and 2 percent Native American.

* According to 23andme.com, the average African American is 75 percent sub-Saharan African, 22 percent European and only 0.6 percent Native American.

* According to Family Tree DNA.com, the average African American is 72.95 percent sub-Saharan African, 22.83 percent European and 1.7 percent Native American.

* According to National Geographic’s Genographic Project, the average African American is 80 percent sub-Saharan African, 19 percent European and 1 percent Native American.

The message is, of course, that you never know.  Jack Goins, Hawkins County, Tennessee archivist,  is the perfect example.  Jack is the patriarch of Melungeon research.  His Goins family was Melungeon, from Hawkins County, Tennessee.  Jack founded the Melungeon DNA projects several years ago which resulted in a paper, co-authored by Jack (along with me, Janet Lewis Crain and Penny Ferguson), cited by Henry Louis Gates in his above article along with an associated NPR interview, titled “Melungeons, A Multiethnic Population.”

jack goins melungeon

Jack, shown above with the photo of his Melungeon ancestors, looks white today.  His family claimed both Portuguese and Indian heritage.  His ancestors and family members in the 1840s were prosecuted for voting, given that they were “people of color.”

But Jack’s Y DNA, providing us with his paternal link to his Goins male lineage, is African.  No one was more shocked at this information than Jack.  Jack’s autosomal DNA testing confirms his African heritage, along with lots of European and a smidgen of Native in some tests.

When in doubt, test your DNA and that of selected relatives to document your various lines, creating your own DNA pedigree chart.  For a broad spectrum picture of your DNA and ethnicity across of all of your heritage, autosomal DNA testing is the way to go.  Without all of these tools, neither Jack nor Henry would ever have known their own personal truth.

______________________________________________________________

Disclosure

I receive a small contribution when you click on some of the links to vendors in my articles. This does NOT increase the price you pay but helps me to keep the lights on and this informational blog free for everyone. Please click on the links in the articles or to the vendors below if you are purchasing products or DNA testing.

Thank you so much.

DNA Purchases and Free Transfers

Genealogy Services

Genealogy Research

Autosomal DNA, Ancient Ancestors, Ethnicity and the Dandelion

 dandelion 1

Understanding our own ancient DNA is a little different than contemporary DNA that we use for genealogy, but it’s a continuum between the two with a very long umbilical cord between them, then, and now.  And just when you think you’re about to understand autosomal DNA transmission and how it works, the subject of ancient DNA comes up.  This is particularly perplexing when all you wanted in the first place was a simple answer to the question, “who am I and who were my ancestors?”  Well, as you’re probably figured out by now, there is no simple answer.

Inheritance

In a nutshell – we know that every generation gets divided by 50% when we’re talking about autosomal DNA transmission.

So you inherit 50% of the DNA of each of your parents.  They inherited 50% of the DNA of each of their parents, so you inherit ABOUT 25% of the DNA of each of your grandparents.

Did you see that word, about?  It’s important, because while you do inherit exactly 50% of the DNA of each parent, you don’t inherit exactly 25% of the DNA of each grandparent.  You can inherit a little less or a little more from either grandparent as your parents 50% that you’re going to receive is in the mixer.

This is also true for the 12.5% of each of your great-grandparents, and the 6.25% of each of your great-great-grandparents, and so forth, on up the line.

The chart below shows the percentages that you share from each generation.

Relationship to You Approximate % Of Their DNA You Share
Parents Exactly 50%
Grandparents 25
Great-grandparents 12.5
Great-great-grandparents 6.25
Great-great-great-grandparents 3.125
Great-great-great-great-grandparents 1.5625

Ethnicity

So, here’s the question posed by people trying to understand their ethnicity.

If I have 3% Melanesian (or Middle Eastern, Indo-Tibetan or fill-in-the-blank ethnicity), doesn’t that mean that one of my great-great-great-grandparents was Melanesian?

There are really two answers to this question.  (I can hear you groaning!!!)

If the amount is 25% (for example) and not very small amounts, then the answer would be yes, that is very likely what this is telling you.  Or maybe it’s telling you that you have two different great-grandparents who have 12.5 each – but those relatives are fairly close in time due to the amount of DNA that came from that region.  See, that was easy.

However, the answer changes when we’re down in the very small percentages, below 5%, often in the 1 and 2% range.  This answer isn’t nearly as straightforward.

The Dandelion – Your Ancestor

The answer is the dandelion.

dandelion 2

The dandelion is one of your ancestors who lived in the Middle East, let’s say, 20,000 years ago, maybe 30,000 years ago.  In case you’re counting generations, that is 800 to 1200 generations ago.  The percentage of DNA you would carry from a single ancestor who lived 20,000 years ago, assuming you only descended from that ancestor 1 time, is infinitesimally small.  There are more zeroes following that decimal point than I have patience to type.  Let’s call that ancestor Xenia and let’s say she is a female.

However, you did inherit DNA from many of your ancestors who lived 20,000 years ago, thousands of them, because all of them, through their descendants, make up the DNA you carry today.  So infinitesimally small or not, you do carry some of the DNA of some of those ancestors.  It’s just broken into extremely small pieces today and their individual contributions to you may be extremely small.  You don’t carry any DNA from some of them, actually, probably most of them, due to the recombination event, dividing their DNA in half, happening 800 times, give or take.

Now, given that your ancestors’ DNA is divided in every generation by approximately half, and we know there are about 3 billion base pairs on all of your chromosomes combined, this means that by generation 32 or 33, on average, you carry 1 segment from this ancestor.  By generation 45, you carry, on average, .00017 segments of this ancestor’s DNA.  And for those math aficionados among us, this is the mathematical notation for how much of our ancestor’s DNA we carry after 800 generations: 4.4991E-232.

But, we also know that this dividing in half, on the average, doesn’t always work exactly that way in reality, because some of those ancestors from 20,000 years ago did in fact pass their DNA to you, despite the infinitesimal odds against that happening.  Some of their DNA was passed intact generation after generation, to you, and you carry it today.  The DNA contributed by any one ancestor from 800 generations ago is probably limited to one or two locations, or bases, but still, it’s there, and it’s the combined DNA of those ancient ancestors that make us who we are today.

The autosomal DNA of any specific ancestor from long ago is probably too small and fragmented to recognize as “theirs” and attribute to them.  Of course, the beauty of Y DNA and mitochondrial is that it is passed in tact for all of those generations.  But for autosomal DNA and genealogy, we need hundreds of thousands of DNA pieces in a row from a particular ancestor to be recognizable as “theirs.”  When we measure DNA for genealogy, what we are measuring is both centiMorgans, a measure of distance between chromosome positions (length) and the number of contiguous SNP (Single Nucleotide Polymorphism) base locations that match (quantity).  The values from these calculations tells us how closely we are related to people, because remember, DNA is divided in each generation so there is a mathematically predictable amount we will share with specific relatives.

Here is an example from a Family Finder comparison table showing both centiMorgans and matching SNPs with a second cousin.

family finder table

The matching threshold for genealogical significance is either 5 or 7 cM depending on which of the major companies you are using.  At Family Tree DNA, if you match above the threshold, then you can view down to 1cM, which is the case above.  Another match criteria is the number of SNPs, or locations, matching contiguously.  Anything below about 500-800 is considered to be a population match, not a genealogical match, unless you also have a significant number of genealogical matches at higher cMs and segments with this person.

OK, where is all of this going?

Dispersion

Think of your ancestor 20,000 years ago as the dandelion.  Now, blow.

dandelion 3

Xenia lived in the Middle East.  Where might her descendants land, over time, with every new generation?  In Europe?  In Asia?  In India?  In America via the Native Americans through Asia?  In North Africa?  Where?

So let’s say that groups of descendants settle across the globe.  Let’s say that her mitochondrial haplogroup is X.  Yes, haplogroup X is found both in Europe and in Asia and in the Native Americans, so this is actually a good example.  So Xenia carried mitochondrial haplogroup X and we know for sure via mitochondrial DNA testing that indeed, Xenia’s seeds were scattered to all of the winds.  The only place we haven’t found Xenia’s children is in Subsaharan Africa and the Australian archipelago, at least not yet.

Ok, so now that we know where her children and their children went, let’s go back to ancient DNA.

Predictive DNA

The way ethnicity is determined is by studying the frequency with which a specific allele or group of alleles is found in any particular population.  Two “pure” examples come to mind.

The first example is the Duffy Null allele that is only found in the Subsaharan African populations.  Currently this marker is found in about 68% of American blacks and in 88-100% of African blacks.  If you have the Duffy Null allele, you have African heritage.  Of course, you don’t know which line or which ancestor it came from, or how far back in time, but it assures you that you do in fact have African heritage.  It could have been from an ancestor long ago.  It could have been very recent.  This is one of the factors considered when determining percentage of ethnicity.

A second example is the STR marker known as D9S919 which is present in about 30% of the Native American people.  The value of 9 at this marker is not known to be present in any other ethnic group, so this mutation occurred after the Native people migrated across Beringia into the Americas, but long enough ago to be present in many descendants.  There is also no other known marker that is only found only among Native Americans, although I expect as we move into full genome sequencing we will discover more.  You can test this marker individually at Family Tree DNA, which is the only lab that offers this test.  If you have the value of 9 at this marker, it confirms Native heritage, but if you don’t carry 9, it does NOT disprove Native heritage.  After all, many Native people don’t carry it.  Again, you don’t know how long ago this marker was introduced into your ancestry.

These two examples are very unique because the markers are found only in certain groups.  Generally, with the rest of the DNA values, they are found in different amounts, or frequencies, in different parts of the world and ethnic groups.

So, if you’re trying to determine the ethnicity of an individual, you’re going to compile a huge data base of percentages of DNA values found of Ancestrally Informative Markers (AIMs) in different parts of the world.

So, you would compare the participant’s values against your data base and you will come up with those regions or ethnicities that are present most often in your comparison.  This is exactly what the products and services that provide you with your ethnicity percentages do – and how accurate the results are depend highly on the data base itself, the amount of data, and the quality of data.  Dare I mention Ancestry’s issue that they’ve had since they first began offering their autosomal product over a year ago where everyone seems to have Scandinavian ancestry?  Ancestry doesn’t share with us their sources, so as a community we have no idea how they have come up with these numbers.

You can easily compare your autosomal results in nauseating detail at both 23andMe and Family Tree DNA by testing with both companies, or by testing with either 23andMe or Ancestry and transferring your autosomal results to Family Tree DNA.  All 3 of these companies will give you a somewhat different result, but they should be in the same ballpark.  You can also then download your raw data file from any of those vendors and upload it to www.gedmatch.com where you can then do ethnicity comparisons using a variety of tools.  These tools, an example shown below, will have much more variance and detail than the vendor’s tools or results.  And because of that, they tend to be more confusing as well.

gedmatch example

Many people with small amounts of minority admixture are disappointed with the results through the vendors, especially if their Native American admixture doesn’t show.  I wrote extensively about this in my series, The Autosomal Me, so I won’t rehash it here, but using the GedMatch tools is very enlightening, as you can see above with my results.  And do I really have Indo-Tibetan and Indo-Iranian ancestors?

Where’s Xenia?

Back to Xenia and her descendants.  Let’s say that Xenia’s descendants settled in four primary locations.  One is in the Middle East – they never left home.  One is in Asia and from there, to the Americans to become the Native Americans and lastly, to Europe.  Now let’s say there is a pocket of them in the Altai region of Asia and a pocket in France.  The Altai is the ancestral home of the Native Americans and could explain the Indo-Tibet result, above.  We’ll call that Central Asia.  And France is where my Acadian ancestors were from.  Hmmm….this is getting confusing.  To make matters even more confusing, I might well descend from both groups, who originally descended from Xenia.

Let’s say that I do in fact carry small segments of Xenia’s DNA.  Now let’s say that this same DNA is found in a group of people in Central Asia, maybe in Tibet, it’s published in an obscure journal someplace, and it finds its way into a data base.  Voila – there you go – I now have a match in Central Asia in a place called Indo-Tibet.  But do I really?

Does this mean that my ancestor was from Central Asia?  Not necessarily.  And if so, maybe not recently, but the people from that location for some reason share some of the DNA that I carry.  The question of course is why, how and when?

What this really means to you is a matter of degrees.  If you have a few matches from obscure regions, along with very small percentages, it is likely a result of the dandelion’s dispersion.  If you have a lot of matches, meaning a high percentage hit rate, from a particular region, pay attention, it probably has some genealogical significance.

It’s no wonder people are confused by this!  Now, just think how many dandelions you have.  In 15 generations, you have 32,768 ancestors.  In fact, this is how we know for sure that we all descend from the same ancestor multiple times.  Our number of ancestors quickly exceeds the world population.  In 30 (25 years) generations, in about the year 1263, we reach about 1 billion ancestors.  In 1750, there were 791 million people on Earth, in 1600, 580 million, in 1500, 458 million and in 1000, 310 million.

Ancestors - Years

We know that we very likely descend several times from a much smaller group of ancestors from isolated local populations.  However, just looking at the 32,000+ ancestors in 15 generations, it’s still an entire dandelion field!!!

???????????????????????????????????????????????????????????????????????

______________________________________________________________

Disclosure

I receive a small contribution when you click on some of the links to vendors in my articles. This does NOT increase the price you pay but helps me to keep the lights on and this informational blog free for everyone. Please click on the links in the articles or to the vendors below if you are purchasing products or DNA testing.

Thank you so much.

DNA Purchases and Free Transfers

Genealogy Services

Genealogy Research

Combining Tools – Autosomal Plus Y-DNA, mtDNA and the X Chromosome

Sometimes, there’s nothing worse than a little bit of knowledge to get us into trouble.  If you need proof of that, I can show you a picture of one of my first quilts which has thankfully disappeared someplace and was known semi-affectionately as “The Ugly Quilt.”  I even entered it in an “Ugly Quilt” contest and it wasn’t even good enough, or is that bad enough, to win that!!  Fortunately, things have improved!  I’ve learned a lot.

Combine a little knowledge with people who desperately want answers, and you have a situation ripe for mistakes, misinterpretation and misunderstanding.

That’s what sometimes happens when you combine the results of two different genetic genealogy tools and you don’t really understand their differences, their application to the specific problem at hand, or what the results are really telling you.

I’m talking about combining autosomal testing with haplogroup based testing, both Y DNA and mitochondrial DNA.  This comes in two flavors; generic and specific.

Generic Matching – 23andMe

At 23andMe, your match results are displayed in a list along with information which may or may not be relevant to you and your match.  Shown below are my 8 top matches at 23andMe.  I know who these people are – they are my relatives, so there is no question of interpretation here.  Let’s take a look at the information provided.

combining 23andme

I have omitted the name column which is first.  The second column is their relationship to me.  The top row is me.  Everyone has the option to enter geographic (blue tab) and surname information (green tabs,) which I have done.  Not everyone does that as you can see by the information shown for the others.

Note the different haplogroups here.   For mitochondrial (pink tab), you have 7 different haplogroups out of 8.  That’s because these people, other than my son and I, don’t share a common maternal line.  If they did share a haplogroup, it would be coincidence, or very far back in time, because we know the pedigree charts of all of these people and they do not share a known maternal ancestor.

Looking at the Y DNA haplogroups, you’ll notice that there are 4 men and of those 4, three share the same haplogroup.  That is because, in this case, they are cousins who also share the same surname.  If I was an adoptee and made this discovery, I’d be in 7th Heaven, because this would be a very large hint.  However, if these men shared a haplogroup but didn’t share a common surname, again, it could be coincidence or a common ancestor very far back in time.

I put those words in bold because recently I’ve seen the tendency to jump to conclusions about the relevance of common haplogroup information related to autosomal testing.

Let’s use an example. At 23andMe, you are provided with what is considered an extended haplogroup.  Most of the time, these are correct except when the haplogroup designation involves insertions and deletions or reversions which can’t be detected reliably by this type of testing, only by full sequence or SNP testing.  Let’s not go there and let’s presume these are absolutely accurate for purposes of this illustration.  I happen to know my haplogroup listed at 23andMe is out of date.  It is listed as J1c2 and it is actually J1c2f, but that actually enhances the point I’m about to make.

Using the Behar paper supplement to “A Copernican Reassessment of the Human Mitochondrial Tree From its Root,”  the common ancestor for haplogroup J1c2 lived approximately 9700 years ago (plus or minus 2010 years standard deviation).  Therefore, my common ancestor with anyone sharing this haplogroup is anyplace from the current generation (my children or parents) to nearly 10,000 years ago – clearly not relevant for genealogy.  However, looking at my extended haplogroup, not determined by 23andMe, but found in my Family Tree DNA full sequence information, the common ancestor of J1c2f lived about 1900 years ago (plus or minus 3100 years standard deviation).  Clearly that makes about an 8000 year difference, which narrows the window, but it still isn’t necessarily genealogically relevant.

Furthermore, at 23andMe, haplogroup information is provided, but personal mutations are not, for either Y DNA or mitochondrial.  This is why I referred to this type of match at “generic.”  For specific Y DNA or mitochondrial matching, you’ll need to go to Family Tree DNA.

Specific Matching – Family Tree DNA

At Family Tree DNAY DNA, mitochondrial DNA and autosomal results require different tests.  The results are shown on different tabs on your personal page.

combining ftdna

Each tab provides you with a significant number of pages of information about each test and displays your results in different ways.

For both Y DNA and mitochondrial (mtDNA), one of the options is “Matches” which shows you your personal matches at several levels.  For mtDNA, the levels are HVR1, HVR1+HVR2 and Coding Region, which equate to the three levels of tests that you can take – basically introductory, intermediate and advanced.  For Y DNA, the levels are 12, 25, 37, 67 and 111 markers.

My match results are shown below, again, with the first column, names, removed.

combining mt matches

SmartMatching is important here, because Family Tree DNA has already done you the favor of removing anyone who is not a “true match.”  Notice that the first column shown here includes the envelope icon, a notes icon, a pedigree chart icon, and following that, the level of testing taken by this person.  I’m showing my full sequence matches here, so everyone has taken the FMS or full mitochondrial sequence test.

These are the people who also share the extended haplogroup of J1c2f.  This means our common ancestor lived sometime between now and about 2000 years ago (plus or minus the standard deviation.)  When you look at the oldest ancestors and the matches map that goes along with this test at Family Tree DNA, you can see how widely spread these “most distant” ancestors are.  You can also see that one person has listed their grandfather, which means they were confused.  A most distant mitochondrial, maternal, ancestor cannot be a grandfather – so this also calls into question the accuracy of their geographic information as well, shown in the Czech Republic, below.

Combining map

Two thousand years ago (give or take) the common ancestor of all of these people was one person, and their direct descendants, their children, all lived in the same place initially.  You can travel a long way in 2000 years.  My oldest ancestor, the white balloon is found in German and my closest match is found in Norway.

To understand how to use combined tools, you have to understand each individual tool first.

Family Tree DNA does provide a combined matching tool called “Advanced Matching” for Y DNA, mtDNA and autosomal (Family Finder) tests.

Advanced Matching

Advanced matching allows you to combine test types and filter on specific fields.

combining advanced options

The most common advanced matching for autosomal DNA is the combination of the Family Finder test plus either mtDNA or Y DNA results.

As they say, “your mileage may vary” and much of this variance will depend on two things.  First, how many people tested at which testing level of the mtDNA and Y DNA tests and second, the relative rareness of your haplogroup.  Said another way, if your mtDNA haplogroup is H and/or if your Y DNA haplogroup is R, you’re very likely to have a lot, many, low level matches because those haplogroups make up about half of the European population, respectively.  However, if your haplogroup is J1c2f, meaning that your base haplogroup is much less common than H and that you’ve taken the full sequence test, you’re going to get a lot fewer and a lot more meaningful matches.

At the haplogroup H level, which is the most common HVR1 results, your common ancestor lived between 12,000 and 30,000 years ago, depending on whose estimates you use.  Compare that to J1c2f’s 1900 years.  Big difference.  But is it big enough?  It’s a clue, just like any other clue.

What Matches Don’t Mean

Let’s say that on the advanced menu you selected two tests, the Family Finder and the FMS (full mitochondrial sequence) test.  The result is no matches.  IF you had a match at this level, it does NOT mean that your common autosomal match is on the maternal, mitochondrial line.  This is a very common mistake in logic.  It means that you should continue to include this line in your search and maybe you want to focus there.

Let’s look at why.  Autosomal testing reaches back in time to recent ancestors and measures how much of their DNA you share.  In the past 5 or 6 generations, you likely share some DNA from all of your ancestors.  After that, some of your ancestors DNA gets so diluted that it becomes in effect, washed out, or is present in such small quantities that we can’t effectively attribute it’s source.  Mitochondrial DNA however, is never admixed or divided.  Therefore time in terms of recent generations, unless we’re talking about when mutations occurred, like the mutation that set apart haplogroup J1c2f some 2000 years ago, is irrelevant.  Mitochondrial and Y DNA both measure back in time to your earliest ancestor in that line.

The best use of both mtDNA and Y DNA with autosomal is to eliminate possible lines.

What Matches Do Mean

Let’s say I select Family Finder and the HVR1 level and show only people I match in both tests.

At this point, especially if you are haplogroup H, you’re going to get a long list of matches and people get very excited at this point. Don’t.

combining mt no match

Above is an example list.  Here’s also the problem.

Problem 1 – Most people only tested at the HVR1 level.  For haplogroup J, this means the common ancestor lived about 35,000 years ago, plus or minus 5,000.  What this really means is that if these people were to take the full sequence test, chances are they would no longer match you.  There are more than 100 subgroups of haplogroup J and chances are very good that the tester would fall into one of them.

Problem 2 – Some people have tested at the HVR2 level or the FMS level and don’t match you at that level, even though they matched you at the HVR1 level.  Look at the first result, the second column, the X.  This means they did test and they don’t match you.  This means that you’ve just eliminated this direct maternal line as a possible autosomal match, barring a mutation in the past few generations which is not impossible but extremely unlikely.

However, when people are desperate for any shred of evidence, they interpret this as “I match on the HVR1 level so this must be my common line with this person.”  That is flawed logic and is outright wrong in the situation where the person has tested at a higher level and does NOT match.  In fact, it’s just the opposite, you’ve just disproven this line.  Now I think this is a good thing, because that means you can focus elsewhere.

This same logic holds for Y DNA matching as well.  Finding someone you match with at the 12 marker level in haplogroup R, especially R1b1a2 (M269) is quite common.  Finding someone you match at 67 or 111 markers and autosomally might be quite another matter.

A Third, Neglected Tool

There is a third tool that can be added to the mix here, but it’s not nearly as convenient as Advanced Matching.

Both 23andMe and Family Tree DNA test your X chromosome when they do their autosomal testing.

The X chromosome has a unique inheritance path which is different for men and women.  If you recall, women inherit an X from both Mom and Dad, but males only inherit an X from Mom.  They get the Y from Dad which makes them male.  If you match someone on the X chromosome, or you don’t, that too is powerful information.

Blaine Bettinger originally published some wonderful X inheritance charts on his blog, The Genetic Genealogist, in December 2008 and January 2009 documenting how to use the X chromosome for genealogy.

The chart below shows the male inheritance path for the X chromosome via the colored locations.  Because males and females both inherit the X from their mother, the maternal inheritance path of the X chromosome, the right half of this chart, is the same for men and women.  In this case, we’re particularly interested in the mitochondrial DNA path as well, which is the furthest right pink line on the chart, shown with the arrows along the edge.

combined x match

Including the X chromosome matching, here are your three possible outcomes.

  • If you match autosomally, you match at the deepest (full sequence) haplogroup level and you match on the X chromosome, you may indeed have a solid lead in the direct maternal line.  It’s a lead, nothing more.  It’s not confirmation of a common autosomal ancestor in that line.
  • If you match autosomally, you do not match at the haplogroup level, but you do match on the X chromosome, then you know it’s NOT the direct maternal line but it IS one of the other lines where you share an X chromosome.
  • If you match autosomally and you do not match at either the haplogroup level or on the X chromosome, you know that you can eliminate the direct maternal line and your match is probably on a line where you don’t share the X.  I say probably because like any other DNA that is shared in an autosomal fashion, meaning divided by approximately 50% in every generation, it’s possible after several generations to not show as a match on the X but to still be descended from those lines.

Jim Turner created some nice X chromosome inheritance pedigree charts that are easily printable which you can find here.

Take Away

What’s the take-away in all of this?  These are very powerful tools, but they only tools and they provide clues.  Some clues eliminate possible connections, some clues suggest them.  It’s only through multiple tools like triangulation and old-fashioned genealogy research that we confirm them.

We’ve gotten spoiled with the relatively easy Y DNA answers.  A man tests and if he matches other men with the same surname with few mutations, we call it family and all is good.  Women don’t have that luxury and neither do adoptees, although male adoptees clearly have the advantage of a potential solid Y match.  Other types of DNA testing and analysis just aren’t as straightforward or easy, but that doesn’t mean the answer isn’t there.  Perseverance is key.  Common sense, understanding the tools and removing emotion, as much as possible, from the equation are critical.  If you’re in doubt, get help.  It’s a lot better to pay for an hour or two of consulting than to make a critical error in logic that can introduce errors into your family tree or cause you to waste time chasing the wrong lines.

Unraveling the secrets your DNA has to tell you is much like that game of Clue that we played as kids – accumulating pieces of information that, cumulatively, hopefully, lead to an answer.  Miss Scarlet did it in the ballroom with Professor Plum.  Or was it Colonel Mustard, or Reverend Green?

combined clue

______________________________________________________________

Disclosure

I receive a small contribution when you click on some of the links to vendors in my articles. This does NOT increase the price you pay but helps me to keep the lights on and this informational blog free for everyone. Please click on the links in the articles or to the vendors below if you are purchasing products or DNA testing.

Thank you so much.

DNA Purchases and Free Transfers

Genealogy Services

Genealogy Research

Mitochondrial DNA Smartmatching – The Rest of the Story

Sometimes, a match is not a match.  I know, now I’ve gone and ruined your day…

One of the questions that everyone wants the answer to when looking at matches, regardless of what kind of DNA testing we’re talking about, is “how long ago?”  How long ago did I share a common ancestor with my match?  Seems like a pretty simple question doesn’t it?

The answer, especially with mitochondrial DNA is not terribly straightforward.  A perfect example of this fell into my lap this week, and I’m sharing it with you.

Mitochondrial DNA – A Short Primer

There are three regions that are tested in mitochondrial DNA testing for genealogy.  The HVR1 and HVR2 regions are tested at most testing companies, and at Family Tree DNA, the rest of the mitochondria, called the coding region, is tested as well with the full mitochondrial sequence test.  This is the mitochondrial equivalent of Paul Harvey’s “the rest of the story,” and of course we all know that the real story is always in “the rest of the story” or he wouldn’t be telling us about it!

Many times, the rest of the story is critically important.  In mitochondrial DNA, it’s the only way to obtain your full haplogroup designation.  If you don’t want to just be haplogroup J or A or H, you can test the coding region by taking the full sequence test and find out that you’re J1c2 or A2 or H21, and discover the story that goes with that haplogroup.  Guaranteed, it’s a lot more specific than the one that goes with simple J, A or H.  Often it’s the difference between where your ancestor was 2000 years ago and 20,000 years ago – and they probably covered a lot of territory in 18,000 years!

Let’s take a quick look at mitochondrial DNA.

To begin with, the HVR1 and HVR2 regions are called HVR for a reason – it’s short for hypervariable.  And of course, that means they vary, or mutate, a lot more rapidly, as compared to the coding region of the mitochondrial DNA.

In layman’s terms, think of a clock.  No, not a digital clock, an old-fashioned alarm clock.

alarm clock

The entire mitochondrial DNA has 16,569 locations.  The HVR1 and HVR2 regions take up the space on the clock face from 5 till until 5 after the hour.   The rest is the coding region – the mitochondrial “rest of the story.”  The coding region mutates much slower than the two HVR regions.

Just to be sure we’re on the same page, let’s talk for just a minute about how mitochondrial haplogroup assignments work.  For a detailed discussion of haplogroup assignments and how they are done, see Bill Hurst’s discussion here.

Generally a base haplogroup can be reasonably assigned by HVR1 region testing, but not always.  Sometimes they change with full sequence testing – so what you think you know may not be the end result.

My full haplogroup is J1c2f.  My base haplogroup is J.  I’m on the first branch of J, J1.  On branch J1, I’m on the third stick, c, J1c.  On the third stick J1c, I’m on the second twig, J1c2.  On the second twig, J1c2, I’m leaf f, or J1c2f.  Each of these branches of haplogroup J is determined by a specific mutation that happened long ago and was then passed to all of that person’s offspring, between them and me today.  The question is always, how long ago?

Mutation Rates – How Long Ago is Long Ago?

While we have a tip calculator at Family Tree DNA for Y-line DNA to predict how long ago 2 Y-line matches shared a most recent common ancestor, we don’t have anything similar for mitochondrial DNA, partly because of the great variation in the mutation rates for the various regions of mitochondrial DNA.  Family Tree DNA does provide guidelines for the HVR1 region, but they are so broad as to be relatively useless genealogically.  For example, at the 50th percentile, you are likely to have a common ancestor with someone whom you match exactly on the HVR1 mutations in 52 generations, or about 1300 years ago, in the year 713.  Wait, I know just who that is in my family tree!

These estimates do not take into account the HVR2 or coding regions.

I did some research jointly with another researcher not long ago attempting to determine the mutation rate for those regions, and we found estimates that ranged from 500 years to several thousand years per mutation occurrence and it wasn’t always clear in the publications whether they were referring to the entire mitochondria or just certain portions.  And then there are those pesky hot-spots that for some reason mutate a whole lot faster than other locations.  We’re not even going there.  Suffice it to say there is a wide divergence in opinion among academics, so we probably won’t be seeing any type of mito-tip calculator anytime soon.

Enter SmartMatching

Family Tree DNA does their best to make our matches useful to us and to eliminate matches that we know aren’t genealogically relevant.

For example, this week, I was working on a client’s DNA Report.  Let’s call him Joe.  Joe is haplogroup J1c2.  I am haplogroup J1c2f.  J1c2f has one additional haplogroup defining mutation, in the coding region, that J1c2 does not have.

Joe and I did not show as matches at Family Tree DNA, even though our HVR1 and HVR2 regions are exact matches.  Now, for a minute, that gave me a bit of a start.  In fact, I didn’t even realize that we were exact matches until I was working with his results at MitoSearch and recognized my own User ID.

I had to think for a minute about why we would not be considered matches at Family Tree DNA, and I was just about ready to submit a bug report, when I realized the answer was my extended haplogroup.  This, by the way, is the picture-perfect example of why you need full sequence testing.

Family Tree DNA knows that we both tested at the full sequence level.  They know that with a different haplogroup, we don’t share a common ancestor in hundreds to thousands of years, so it doesn’t matter if we match exactly on the HVR1 and HVR2 levels, we DON’T match on a haplogroup defining mutation, which, in this case, happens to be in the coding region, found only with full sequence testing.  Even if we have only one mismatch at the full sequence level, if it’s a haplogroup defining marker, we are not considered matches.  Said a different way, if our only difference was location 9055 and 9055 was NOT a haplogroup defining mutation, we would have been considered a match on all three levels – exact matches at the HVR1 and HVR2 levels and a 1 mutation difference at the full sequence level.  So how a mutation is identified, whether it’s haplogroup defining or not, is critical.

In our case, I carry a mutation at marker 9055 in the coding region that defines haplogroup J1c2f.  Joe doesn’t have this mutation, so he is not J1c2f, just J1c2.  So we don’t match.

So – How Long Ago for Me and Joe?

Dr. Behar in his “Copernican Reassessment of the Mitochondrial DNA Tree,” which has become the virtual Bible of mitochondrial DNA, estimates that the J1c2f haplogroup defining mutation at location 9055 occurred about 2000 years ago, plus or minus another 3000 years, which means my ancestor who had that mutation could have lived as long ago as 5000 years.

The mutations that define haplogroup J1c2 occurred about 9800 years ago, plus or minus another 2000.  So we know that Joe and I share a common ancestor about 7,800 – 11,800 years ago and our lines diverged sometime between then and 2,000 – 5,000 years ago.  So, in round numbers our common ancestor lived between 2,000 and 9,800 years ago.  Not much chance of identifying that person!

The ability to eliminate “near-misses” where the HVR1+HVR2 matches but the people aren’t in the same haplogroup, which is extremely common in haplogroup H, is actually a very useful feature that Family Tree DNA nicknamed SmartMatching.  With over 1000 matches at the HVR1 level, more than 200 at the HVR1+HVR2 level and another 50+ at the full sequence level, Joe certainly didn’t need to have any “misleading” matches included that could have been eliminating by a logic process.

So while Joe and I match, technically, if you only look at the HVR1 and HVR2 levels, we don’t really match, and that’s not evident at MitoSearch or at Ancestry or anyplace else that does not take into consideration both full sequence AND haplogroup defining mutations.  Family Tree DNA is the only company that does this.

It’s interesting to think about the fact that 2 people can match exactly at the HVR1+HVR2 levels, but the distance of the relationship can be vastly different.  I also match my mother on the HVR1+HVR2 levels, exactly, and our common ancestor is her.  So the distance to a common ancestor with an exact HVR1+HVR2 match can be anyplace from one generation (Mom) to thousands of years (Joe), and there is no way to tell the difference without full sequence testing and in this case, SmartMatching.

And that, my friends, is the rest of the story!

Triangulation for Autosomal DNA

In our last article, Triangulation for Y DNA, we covered triangulation for the Y chromosome, how it works, and how it can help a genetic genealogist.

In this article, we’re going to cover triangulation for autosomal DNA.

Triangulation for autosomal DNA is kind of a chicken and egg thing.  The goal is to associate and identify specific DNA segments to specific ancestors.  The easiest way to do this, or to begin the process, is with known relatives.  This gets you started identifying “family segments.”  From that point, you can use the known family segments, along with some common sense tools, to identify other people that are related through those common ancestors.  Through those matches with other people, you can continue to break down your DNA into more and more granular family lines.  This is easiest to visualize thinking about your 4 grandparents.

Triangulation is easiest if you have parents or grandparents living, and you can test them.  Yes, all of them.  Their DNA will give your immediate pointers when you have matches to which side of the family you share with your matches.  If you can test your 4 grandparents, you immediately know which of those 4 lines someone who matches you descends through, because they will also match one, and hopefully only one, of your 4 grandparents.  However, for some of us, testing even one parents is simply not possible, so first, let’s look at some examples of triangulation without your parents DNA results.

I’m fortunate that one of my cousins has given a lot of focus to our Vannoy line.  Vannoy was the surname of my great-grandmother, Elizabeth Vannoy (1846-1918) who married Lazarus Estes (1845-1919).  The Vannoy line has a mystery we’ve been trying to solve for decades now called, “Who Was Elijah Vannoy’s Father?”.  Elijah was Elizabeth’s grandfather.  Your family probably has a similar mystery, and these tools hold the potential to answer those questions.  They also have the potential to introduce more questions.  But then again, isn’t that the way of genealogy?  For every ancestor we find, we get two more questions.

Several of the Vannoy cousins are interested in solving this mystery as well, so they have taken the autosomal Family Finder test at Family Tree DNA.

We know how they are related, and the men have all been proven to be Vannoy via Y-line testing.  By doing this, we’ve assured no undocumented adoptions, also known as NPEs (NonParental Events) in the Vannoy line.

We expect our cousins to match, and indeed they do.  This is my test result showing my three cousins who match me.

In my family mystery, “Who Was Elijah Vannoy’s Father?”, there are 4 candidates, all brothers who lived in Wilkes County, NC in the late 1700s.  Elijah was born in 1786.  We have the wives surnames.  Hickerson is our primary candidate surname, so I wanted to see everyone who matches me on my match list who also shows the Hickerson surname.  I enter that surname in the “ancestral surname” box, and click on “run report.”  The matches returned will all carry the Hickerson surname, which you can see by scrolling for the highlighted names. Turns out, it was only my Vannoy cousins – today – but tomorrow might be different.

Vannoy match 1

Now for the triangulation tool.

I want to see if these three people share common DNA not just with me, but with each other.  If we all share a common segment of DNA, then that confirms a common ancestor and attributes the DNA at that address on that chromosome to that specific ancestral family.  This is the fundamental concept on which triangulation is based.

In my case, the known ancestral family is Vannoy, not Hickerson, at least not yet, so let’s look at the Vannoy cousins as compared to me.

vannoy match 2

Each of the participants results are color coded.  On the page below, you can see that each matching segment of the chromosomes is colored.  It turns out that all of us share a fairly large segment on Chromosome 15.  So now we can attribute that segment to Elijah Vannoy, our oldest proven ancestor in that line.  You can also see some areas where one or two of my cousins match my DNA, but not all of us.  Those can also be attributed to Elijah Vannoy’s line since we share no other (known) common ancestors.

vannoy match 3

This cousin match is simple because the men share the same surname, but if this was 3 women with different surnames, the matching would still work.  The challenge of course would be to find the common ancestor.  In this case, if all 3 women had Elijah Vannoy in their tree, we could still tell that this segment of Chromosome 15 was attributed to the Vannoy family because they all matched me and matched each other as well on the same DNA segment.

Eliminating False Matches

Now let’s move to the “what ifs.”  When my kids were young, I just hated sentences that started with “what if.”

What if I have a fourth match, Jane, with unknown ancestry who matches me on these segments, but does not match any of my cousins?

To determine this you would also have to look at your cousin’s matches or ask Jane if she also matches those cousins.  Remember that half of your DNA is that of your mother and the other half is that of your father.  You will have people that match you, and potentially on the same segments as your known relatives match you, but are not related to both you and your relatives.  This means they are matching you on the other half of your DNA.  In this case, if Jane didn’t match my Vannoy cousins too on that same segment of chromosome 15, then we would know that Jane’s match would be from my mother’s side.

To illustrate this point, let’s move to my results at 23andMe.

Let’s use Family Inheritance Advanced to see an example of two people who match me on the same segment, but are from opposite sides of my family.  My cousins Stacy and Cheryl are from Dad’s and Mom’s side of the family, respectively.  We know they don’t share common ancestry, but look, they both match me on four of the same segments.

cheryl stacy match

How is this possible, you ask.  Remember, I have two halves of each chromosome, one from Mom and one from Dad.  It just so happens that Cheryl and Stacy both match me on the same segment, but they are actually matching two different sides of my chromosome.  For this reason, these are called HIRs, or Half Identical Regions.

Now let’s prove this to the doubting Thomas’s out there.

cheryl stacy match 2

Here is the comparison of Cheryl and Stacy directly to each other.  They do have one small matching segment, 6 cM, so on the small side.  But they don’t match each other on any of the segments where I match both of them.

If they did match each other and me on the same locations, it would mean that we three have common ancestry.

The fact that they match each other on one segment could also mean they have distant common ancestry, which could be from one of our common lines or a line that I don’t share with them, or it could mean they have an identical by state (IBS) segment, meaning they come from a common population someplace hundreds to thousands of years ago.

The real message here is that you can never, ever, assume.  We all know about assume, and if you do, it will.  In this case, assuming would have been easy if you didn’t delve into the big picture, because both of these family lines contain Millers from Ohio living in close proximity in the 1800s.  However these Miller lines have been proven not to be the same lines (via Yline testing) and therefore, any assumptions would have been incorrect, despite the suggestive location and in-common names. Furthermore, cousin Stacy’s Miller line married into her line after our common ancestor, so is not blood related to me.  But conclusions are easy to jump to, especially for excited or inexperienced genetic genealogists.  It’s tempting even for those of us who are fairly seasoned now, but after you’ve been burned a few times, you do learn some modicum of restraint!

So, what’s next?

Color your Chromosomes

In my article, “The Autosomal Me – the Holy Grail – Identifying Native Genealogy Lines,” I described in detail the process of downloading your DNA information from either 23andMe or Family Tree DNA and then utilizing that information in a spreadsheet to look at matches – not 3 or 4 matches at a time, but chromosome by chromosome.

In my case, I was fortunate to have my mother’s DNA results at Family Tree DNA before she passed away, and I was equally as fortunate that they were still viable for the Family Finder test.  Believe me, I held my breath.

Because I have her results, I can tell immediately if my matches are from her side or from my father’s side.  If the person matches both Mom and me, then it’s from her side.  See how easy triangulation is.

Let’s take a look at Chromosome 15 with all of those Vannoy matches on my spreadsheet and see what kind of information we can glean.

vannoy table 1

On my master spreadsheet, my Mother’s matches have been copied in and are color coded, but since none of these people match Mother, I have eliminated that aspect here to avoid unnecessary confusion.

The people identified as “Dad” mean that I know they are genealogically related on my father’s side.  People who match Mother genetically are labeled Mom.  There aren’t any on this segment of chromosome 15, in our example above.  The blank cells in that column, by inference, match Dad’s DNA, since they don’t match Mom.  When I confirm genealogically how we’re related, I’ll enter “Dad” in that column, but not until then.

I’d like to comment on information gleaned from the spreadsheet.  Every DNA segment has a story to tell.

Cousin Estes

First, Cousin Estes, with yellow highlighting, is one of my closest Estes relatives.  He is a third cousin on the Estes side and also descends from Lazarus Estes and Elizabeth Vannoy.  He matches me on the segment from 26 (million) to 58 (million). My Vannoy group of matches, shaded green, extend from 33 to 58, so this tells me that the area from 26 to 33 where I match Cousin Estes, and not any Vannoys, is probably from an Estes ancestor, and not the Vannoy line.

Unfortunately, I don’t have any other matches on this segment, so I can’t figure out which line it comes from, just yet.

The green areas are common between me, cousin Estes and the Vannoy cousins.  If we could find a Hickerson match on these same segments, we could then solve the family mystery AND attribute part of this DNA to the Hickerson line.  But so far, no dice.  This is why it’s important to continue to look and to reach out to people you match, especially those who don’t enter their family surnames or post a GEDCOM file.  The answer may be waiting for you.

The Insanity Factor

The pink segment labeled Cousin Younger is making me insane, so let me share some insanity with you.

The Younger line descends through the Estes line, significantly upstream. The Y DNA of Marcus Younger, who had 1 son who had 1 son, does not match the expected Younger DNA line in Halifax County, Va.  Cousin Younger’s only solid Y match also doesn’t match his expected family line, so we’re fish out of water on the Y-line.  Two undocumented adoption cases that match each other, but no one else.  Great, just great.  These are the things genetic genealogy nightmares are made of.

Mary Younger, daughter of Marcus Younger, married George Estes who fought in the Revolutionary War.  Their son John R. Estes married Nancy Ann Moore in Halifax County and they settled in Claiborne County, TN about 1820 where the Vannoy family is found as well, having migrated from Wilkes Co., NC.  John Y. Estes, son of John R. Estes had son Lazarus Estes who married Elizabeth Vannoy.  Here’s the generational progression:

  1. Marcus Younger – wife unknown, Y DNA doesn’t match Younger line
  2. Mary Younger married George Estes, Halifax Co., VA
  3. John R. Estes married Nancy Ann Moore, moved to Claiborne Co, TN
  4. John Y. Estes married Rutha Dodson
  5. Lazarus Estes married Elizabeth Vannoy
  6. George Estes married Ollie Bolton
  7. My father, William Sterling Estes

And of course, there’s a monkey-wrench, so let’s throw it in.  Marcus Younger’s grandson, ancestor of Cousin Younger, married a Moore woman in Halifax County, VA.  We believe we know who her parents are, but we’re not positive.  If they are who we believe, Y-line DNA tests say the 2 Moore families, living within sight of each other, aren’t the same Moore line….but they interact closely and my Moore line doesn’t match any Moores upstream anyplace.  So, we have another unknown ingredient in the soup.

So, from me, Marcus Younger is 7 generations upstream.  I should carry about 1.5% of his DNA.  I was pleased to see that my Younger cousin and I matched.

However, and this is a BIG however, the Vannoy line should not be related to the Younger line.  We know that both of these cousins are matching on my father’s side, not just because of the genealogy, but because neither matches my mother.  But they are somehow related, as Cousin Younger is matching the Vannoy group big as life on chromosome 15.  Could this be an IBS (identical by state) segment?  Yes, it’s small – but I’m not comfortable relegating it to IBS because it’s genealogically “inconvenient,” at least not yet.

So, something may well be wrong, amiss or unknown in the genealogy, either in Tennessee, which is doubtful as we have that fairly solidly nailed down, especially in recent generations, or in Virginia where there is at least one known disconnect and possibly two taking into consideration the Moore monkeywrench.  Still, the Vannoy family was not living in the same state as the Younger family and came from New Jersey to North Carolina, not from Virginia.  Maybe the connection is in one of the unknown wives lines.

So, you can see my reason for being perplexed.  One thing is sure.  DNA doesn’t lie.  It’s up to us to figure out the message it is conveying and which ancestor it is from.

Powerful Tools

I hope you can see what a powerful tool we have at our disposal.  Of course, it can reveal who your ancestors are, along with some surprises.  I don’t mind the surprises.  I view them as gifts from the ancestors.  It’s those crazy-making half-surprises that bother me.  I swear, the ancestors have a sense of humor.

______________________________________________________________

Disclosure

I receive a small contribution when you click on some of the links to vendors in my articles. This does NOT increase the price you pay but helps me to keep the lights on and this informational blog free for everyone. Please click on the links in the articles or to the vendors below if you are purchasing products or DNA testing.

Thank you so much.

DNA Purchases and Free Transfers

Genealogy Services

Genealogy Research

Triangulation for Y DNA

Based on the number of questions I’m receive about triangulation, it’s time to write an article.

There are two kinds of triangulation that we use in genetic genealogy.  One type is for the Y chromosome and it’s to determine the original values of the DNA of the common ancestor.  The second type of triangulation is for autosomal DNA and it’s to determine if you share a common ancestor with someone and what the DNA of that ancestor looked like.

This article is about the first type, for Y DNA.

Why would you want to use triangulation?

Sometimes in order to know if a particular line has descended from an ancestor, you need to know what that ancestor’s Y DNA marker values were.

For example, if you have an ancestor born in the 1600s, and he had two sons whose descendants tested today, each line could have 4 mutations each, or 6, which could put the matching software over the threshold – meaning they might not be reported as matches.  We have this situation in one of the Estes lines that seems to be particularly prone to mutate.

Family Tree DNA has set up match thresholds.  For someone to be listed as your match, they need to have no more than the following total number of mutations difference from your results.

Markers in Panel Tested Maximum Number of Mutations Allowed

12

0 unless in a common project, then 1

25

2

37

4

67

7

111

10

So you can see that if you have a high number of mutations in the first panel or two, you might not show as a match.

But if you know what the original ancestors Y-line DNA looks like, then it’s easy to tell that they really are matches and that both lines have simply had several mutations.

It’s much more accurate to compare everyone to the original ancestor instead of trying to compare them to each other.

Let’s take a look at the Estes project by way of example.

Abraham Estes, the progenitor of the Southern Estes line was born in 1647 in Nonington, Kent, England.  He immigrated to Virginia in 1683 and began begetting shortly thereafter.  His wife was Barbara, and although the internet is full of family trees that say her last name is Brock, there is not one shred of evidence to support that.  In any case, Abraham and Barbara had a total of 8 sons who lived and the sons had about 42 sons, so we have a good number of Estes families throughout the US today, mostly descending from Abraham.  There is also a northern line founded by Abraham’s cousin, Richard Estes although they don’t have nearly as many descendants.

triangulation Y dna

This chart shows the results of DNA testing through 7 different Estes lines, 6 of which are Abraham’s sons and one of which is a descendant of the Northern line.

The green row at the top is Abraham’s reconstructed DNA, and now, everyone in the project gets compared to Abraham on my spreadsheet.

It’s easy to see how this is done.  For each marker, beginning with 393, we determine what the normal value is for the family.  For marker 393, all lines carry a value of 13.  One line, John through Elisha, shows a mutation to a value of 14 which would signal a line marker mutation for this particular line.  This is quite useful, because when we see someone who carries a value of 14 at this location, especially in conjunction with any other line marker mutations that might exist in that line, like a value of 11 at marker 391, we know where to look genealogically to find the tester’s place in the family.  Line marker mutations are great guideposts.

So, marker by marker, I’ve reconstructed Abraham, shown at the top in green.

Marker Frequency

You might wonder why the value of 25 at 390 is red and underscored and 12 at 391 is bolded, red and underscored.

One of the things I do for each of my family lines, and for clients who order Personalized DNA Reports, is to determine which of their markers carry rare values.  In this case, the value of 25 at 390 is found in only 16% of haplogroup R1b1a2.  The value of 12 at 391 is found in only 4% of the haplogroup R1b1a2 population.  My threshold for rare markers is less than 25% and for very rare, 6% or less.  Bold red indicates very rare, red indicates rare and the underscore is present so that people printing in black and white can see the difference

Why and how does this make a difference?  In a situation where you’re trying to decide if someone really does match the Estes line, this information can be a big help.

The last kit on the chart does carry the Estes surname, but does not match the Estes line genetically.  This is obvious by looking at all the yellow squares, which are mismatches to Abraham, but let’s say that this person tested at 12 markers and he matched the Estes DNA on all of our rare markers, but mismatches a couple on the more common markers.  This is more likely a true Estes match than if they mismatch us on all of our rare markers.  The Estes rare markers combined create a type of family genetic fingerprint.  This is particularly important for adoptees.

And yes, to answer the next question, a Marker Frequency Table can be purchased separately for those who want their marker frequencies through 111 markers, but don’t want a Personalized DNA Report, by purchasing a Quick Consult.  A marker frequency table looks like this but extended, of course, through all of your markers:

Frequency table

Now, we know what the original Abraham Estes’s DNA looked like.  We also know which of our markers are unique.  This can also help us when comparing to other surnames we may be related to before the advent of surnames.  There is family history to be gleaned from those matches as well.

And lastly, because we also have cousin Richard’s DNA signature, we can use that information to reconstruct the common ancestor of Abraham Estes and Richard Estes, which is the grandfather of both men, Robert Estes, born 1555 in Ringwould, Kent, England.  Not bad for genetic technology, reaching back more than 450 years in time and telling us what our ancestor’s DNA looked like, and all without even reaching for a shovel.

______________________________________________________________

Disclosure

I receive a small contribution when you click on some of the links to vendors in my articles. This does NOT increase the price you pay but helps me to keep the lights on and this informational blog free for everyone. Please click on the links in the articles or to the vendors below if you are purchasing products or DNA testing.

Thank you so much.

DNA Purchases and Free Transfers

Genealogy Services

Genealogy Research

Projects, Administrators and Expectations

projects fireside

One of the reasons  I wanted to start a blog was to be able to chat about genetic genealogy topics that interest people.  I can tell what’s on your mind by the questions I receive.  For some reason, I’ve received several questions and some complaints about projects and administrators recently, and I think a fireside chat might clarify things a lot.

A few questions arrived in my in-box this past week that I’d like to paraphrase and address.  The first question is from a male and the second from a female.

Question 1 –  I’m in a number of projects.  One of the administrators contacted me and suggested I do some additional SNP testing.  But my surname project administrator has never said anything about this.  If I needed more testing, why wouldn’t my surname project administrator tell me about this?  Is this legitimate?

Question 2 – I’m so upset.  I tried to join the XYZ surname project and the administrator told me that I couldn’t.  Why can’t they be more flexible and realize I’m related to that family?  This project is listed by Family Tree DNA as one I should join, but the administrator won’t let me.

I see confusion, misunderstanding and frustration in both of these questions, for both the participants and the administrators.  I’d like to talk a little bit about projects, why they are formed, administrators, participants and expectations.

Projects

There are four types of projects at Family Tree DNA.

1.  Surname Projects – The earliest projects formed were surname projects.  Those are based on surnames, like Estes, and typically focus on the paternal lines and the Y chromosome and only that specific surname.  Herein lies the first point of confusion.  Because these projects were formed to sort out male family lines of a particular surname, they are typically restricted to males who carry that surname, or sometimes males who match that surname through adoptions of some sort.

Question 2 relates to this problem.  From her perspective, she “should be” allowed to join, because she is related.  But from a scientific perspective, there is no benefit for a female to join a male focused project.  However, from a public relations perspective, it won’t hurt to let her join.  Because women’s surnames change every generations, she could theoretically join all the surname projects for all of her ancestors.  None of it would benefit her for matching etc., but it won’t hurt anything either.

From an administrator’s perspective, having people in a project that can’t advance the goals of the project is simply clutter.  Not only that, but we have to do something with them, categorize them somehow, or leave them ungrouped.  It’s also confusing to people looking at a Y-line project to see other surnames and apparently unrelated or unconnected people.  Conversely, I want people to be happy with genetic genealogy and since she is related and very interested, perhaps she can contribute something in the way of research.angel devil

If this sounds a bit like the angel and devil, one on each shoulder talking to each other…..well, that’s because it is and there is no one right answer.

There is an exception, of course, to what I just said.  It seems there is always an exception to everything.

Family Finder

Recently with the Family Finder tests, more and more administrators are including people in their surname projects who are related to that family but who do not carry the surname because it’s the only way we have today of including Family Finder participants and grouping them.  I have begun to do this myself as a project administrator.

The alternative to this is to begin lineage projects, such as the Johann Michael Miller Descendants project, just for descendants who have taken the Family Finder test.  This is a way to know who they are, to group them so that you can work with their results.  The challenge is that projects are not set up to function this way.  They are set up to display Yline (males) and mitochondrial DNA results, only, or both for a kit, and in this case, the Yline and mitochondrial DNA results are both irrelevant and misleading if they are displayed as valid results.  Administrators are trying to figure out the best way to deal with this.

The work-around I’ve implemented is a grouping within the surname project labeled Family Finder where those who are related but don’t carry the particular surname are grouped.  I am actively recruiting descendants for these groupings as Family Finder holds great promise in finding those elusive unidentified wives, unnamed children…..but I digress.

Here’s what my Crumley project looks like.  You can see that the grouping of Family Finder is entirely irrelevant to the rest of the project, but it’s the best we can do under the current project structure.

Projects 1

2.  Haplogroup Projects – The second type of project formed was haplogroup projects.  These are for both Y-line and mitochondrial.  Some haplogroups have only one project, like mitochondrial haplogroup K, for example.  Others, like mitochondrial haplogroup H or Y-line R have many subprojects.  These projects are a function of who wants to study what – and who is willing to do the work.

Haplogroup projects, by and large, are research projects.  This means that they are arranged quite differently than surname projects.  Surname projects are generally arranged by family and within family, by line, when possible.  Haplogroup projects aren’t concerned with surnames, but with deep ancestry and location, and they are arranged by haplogroup and sub-haplogroup.

A great deal of the progress in understanding haplogroups, their history, migration patterns and the discovery of subgroups has come from the haplogroup projects.  They are very important, make no mistake.  Family Tree DNA is the only place in the world where there are groups of people grouped by haplogroup in public projects.  This is citizen science at it’s best.

The haplogroup Q project had made significant scientific contributions.  You can see that participants are grouped by haplogroup, meaning by SNP.  In some cases, administrators also group participants by the tests needed to further refine their haplogroups.  When you refine your haplogroup with further testing, you also refine your personal story and contribute to science as well.

projects 2

Haplogroup Q groups participants by their haplogroup, above, but when they need additional testing, they are grouped with others who need that test, below.  Why do they need additional testing?  That’s how we learn about haplogroups.  Every additional SNP that you test positive or negative for tells us more about migrations, about where your ancestors lived and what they did.  The power of this isn’t just in one test, but in many tests combined that write the story of our ancestors.

Projects 3

To illustrate the power of many versus one, the mapping function comes to mind.  Each project administrator can enable or disable mapping.  Mapping can be very useful to surname projects, but it’s crucial to haplogroup projects.

Here’s the map for all of haplogroup Q.   Interesting, but all that this really tells us is that it’s pretty universal.  It’s one of two Native American haplogroups, but sub-groups are found throughout Asia and Europe as well.  Want to know if you’re Native?  Then you’ll have to do SNP testing.

Projects 4

The map below shows the oldest known ancestors for those who carry SNP M25.  Looking at this map tells you immediately that these people aren’t Native American.  But if you live in the US and you’re looking for Native ancestry, and you don’t test to this level, you can be left with the erroneous impression that your haplogroup Q result IS Native when it isn’t.

Projects 5

Ah, the power of maps.  Most project administrators enable maps.

The administrators of haplogroup projects are focused very differently than surname project administrators.  This explains the confusion in question 1 about why the surname admin didn’t suggest SNP testing, but the haplogroup project admin did.

Administrators Are Different People

Ok, stop laughting!

This introduces a bit of a different topic and that is what motivates haplogroup administrators.  I mean, let’s face it, why WOULD you volunteer for this?  The answer is simple – passion combined with a smidgen of insanity!

Surname administrators are most often the family genealogist.  We all know them.  We probably are them.  It’s what attracted us to genetic genealogy in the first place.  They may or may not be terribly familiar with the science of genetics, with SNPs, and may or may not be aware of the benefits of SNP testing.  They can, however, recite the details of the original immigrant who arrived in Virginia in 1683 and all their children!

Haplogroup project administrators tend to be scientists.  I’m very fortunate that my co-admin on the haplogroup E1b1a project is a population geneticist.  Yes, they are interested in their surname family, but they are also very focused on their ancient ancestry too – in making that connection between the two and unraveling their story.  To them, haplogroup projects represent opportunities not otherwise available.

This brings us to the third and fourth kinds of projects, lineage and geographic projects, whose administrators are passionate about their project’s subject.

3.  Lineage Projects – Not many of these exist today and most that do are maternal (mitochondrial) DNA lineage projects, such as the descendants of Jane Doe, but I expect as we sort through how to best address lineage with Family Finder tests, lineage projects will become more widely utilized.

4.  Geographic projects, the fourth type of project, are all projects other than above.  These include many special interest projects, such as the Hatteras Island project, the Cumberland Gap project, the Mothers of Acadia project, the Lumbee project, the Lost Colony project, and many more.

These projects are as different as the people who founded them.  Some projects are research projects and some are what I term courtesy projects.

My Cumberland Gap Project is a courtesy project.  This means I formed it to allow people from a particular region to interact and to share.  There is an associated Yahoo group that is very active. I do not have to approve membership. It’s open for all

The Lost Colony projects (and there are three, Y-line, mitochondrial and Family) are research projects.  This means that the membership is restricted to people with specific qualifications.  I don’t do this to be mean, it’s critical to the research goals of the project.  Let me illustrate.  The goal of the Lost Colony Y-line project is to test people with a specific set of surnames (the Lost Colonists surnames) who are found in very early eastern North Carolina counties.  The project description says this and so does the FAQ.  However, 99% of the requests to join the projects say something like this: “I want to compare my results with that of the Lost Colonists.”  Well, guess what folks…..we’re trying to figure out what the Lost Colonists’ DNA looks like too.

Right now, the people in the Lost Colony Y-line project are good candidates to be descended from the colonists.  We’re working to find the colonist families in England to confirm.  However, if I let everyone who wants to compare their DNA to these people into the project, how would we ever know who is a true colonist candidate and who is just a comparer???

People get really upset when I explain this to them.  And I have to say this…I can’t resist….had they read the project background and goals in the first place….they could have saved themselves and me both some time because they would have known that they don’t qualify, and why.  They can support the project in other ways if they are interested.

As a project administrator, my largest frustration by far is with people who don’t read what is available for them.

I finally set up the Lost Colony Family project as a courtesy project for everyone who wants to test and compare their results to each other.  Now there is a place for the frustrated people who can’t join the Lost Colony Y-line or mitochondrial projects.

Some geographic (and surname) projects require pedigree charts and a specific genealogy to join.  For example, both the Lumbee and Cherokee projects have this requirement.  Of course, for a Y-line or mtDNA project, your connection must be through either the paternal line or the maternal line.  We receive requests to join daily from people who are connected, but not by Y-line or mtDNA, and they are terribly frustrated and sometimes quite angry when they are told they aren’t qualified to join.  It’s not a judgment, it’s the way DNA works.

Project administrators are the gatekeepers to be sure the project retains focus and stays on track, which is only fair to the people hoping to learn and gain information by being project members.  Project administrators are not there to simply be difficult to random applicants.  Most of us really dislike having to decline a join request, even if we do explain.  We know that some people simply won’t understand and will be upset or angry with us personally.  Not fun.

This begs the question of why people are trying to join projects that aren’t good fits for them anyway???

Picking the Right Project

The good news and the bad news is that Family Tree DNA tries to help people find relevant projects.  Unfortunately, it’s easy to misinterpret this if you don’t understand the source of this information.  Below is an example.  I’ve entered my surname, Estes, and these are the “associated projects” that are shown.  Many people interpret these to be “recommended” by Family Tree DNA, and they join each and every one of them.  That’s not the goal, nor are all projects appropriate for everyone.

Projects 6

Since I’m a female, none of the Y projects are relevant to me, and neither is the Estes surname project, generally.  However, a new person wouldn’t have the experience to know this, so administrators need to help educate people.  I wrote about this in the article, “What Project Do I Join?”

These projects are on this list because their administrator included the surname in their project profile, meaning they are interested in attracting people, or at least some people, with that surname.  However, they may not be interested in attracting all people with that surname.  If your surname is Estes and your family never set foot in America, then obviously the Cumberland Gap group, focused on the convergence of states Kentucky, Tennessee and Virginia, is not likely to be of interest to you.  Since it is a courtesy project, you can join if you want, but if it was a project like the Lost Colony projects, then you would need to provide some evidence that your family fits the criteria for those the project is seeking.

Ok, so now we’ve talked about the four kinds of projects and how to select the right one for you.  Let’s talk a little bit about what you can expect from an administrator and what they expect from you.

Administrators

First of all, administrators are volunteers.  They receive no compensation of any sort, no discounts, nothing, except they are eligible to attend the annual DNA Conference in Houston.  Eligible to attend does not mean the conference is free.  I don’t bring this up as a complaint, it’s just that there has been a persistent rumor that refuses to entirely die that administrators receive some percentage of sales or compensation of some sort for running projects.  They don’t and never have.

Because they are volunteers, their administration and personal communication styles vary widely.  Many don’t have any co-administrators so have no backup or assistance.  Some are prompt at answering e-mails, some not.  Genetic genealogy and projects are now more than 10 years old.  People age, they die, they get distracted and some just haven’t kept up.  This field moves very rapidly.  If you see a project in trouble, consider offering to help.  If that doesn’t work, notify Family Tree DNA.

There are published guidelines for administrators.  Mostly these deal with privacy and what they can and can’t do.  Most of this is intuitive, but maybe not to everyone so it is in writing.

A good project administrator:

  • Communicates with members, especially if contacted
  • Keeps the project groups current
  • Assists members equally and fairly
  • Is honest, but sensitive, especially in difficult situations like undocumented adoptions (NonParental Events)
  • Is courteous

Sounds kind of like the scouts doesn’t it?

Every project is different.  As an administrator, every time I send group messages to large projects, my e-mail address gets blacklisted as a spammer.  So I set up a Yahoo group for each of these projects, plus have provided my blog address.  Every person receives this information when they join in an automated e-mail which explains explicitly how to join the Yahoo groups and subscribe to my blog.  Still, last week, someone left one of these projects with the comment “no communication.”  Sigh.  Remember what I said about reading???

A few very poorly run projects do exist.  In one case, the administrator does not use Family Tree DNA’s public website, nor a private one, and the only way you can obtain project information is by signing up with My Family.  In another case, the administrator keeps the results private, much like above, but wrote a book about the surname a couple years ago.  That seems to call into question the motivation for the project.  These are sad and frustrating experiences for the participants.

Project admins cannot:

  • Charge a fee to join a project
  • Share or change private information (in fact, the Family Tree DNA website blocks that for admins)
  • Share the identity or personal information of participants without permission
  • Move members from one project to another
  • Use member information for any commercial purpose without authorization
  • Use member information and e-mails for spamming, etc.
  • Use a DNA project to advocate a personal or political agenda

Notify family tree DNA is you feel something is wrong or you have a concern.  Consider offering to help if you notice a project languishing.

Project Members

We’ve talked about projects, why they are different and what you can expect from an administrator, but what do they expect from you as a participant, or potential participant?

1. Courtesy – I’ve met many lovely people through genetic genealogy, but I’ve also met my share of real dooseys.  I see increasingly more “entitlement attitude” relative to projects with join criteria.  In the words of one person who did not meet the criteria, “I deserve to be in this project.  I have the right.”  I strongly suspect that only the nice people who want to learn will have gotten this far in this article, so I won’t expound further:)  For you folks, I don’t need to!

2. READ – Please, please read what is provided relative to the project goals and join criteria.  Now this is a double edged sword, because it means the admin needs to be sure to provide this information and keep it current.  Maybe I need to look at my project verbiage to see if it needs to be bolded, highlighted or in red!

3. Information – If information is requested, especially in a specific format, please comply as best you can.  There is generally a reason for the request.  Most admins don’t want to make extra work for you or themselves.  Not all projects require information.  I ask for a pedigree chart for everyone in my surname projects, and you would be amazed at how many people join the project and then never reply to any of my e-mails – probably about 50%.  This is why some admins have gone to requiring a pedigree chart of some sort before people are allowed to join. And providing a pedigree chart does not mean sending a link to your tree at Ancestry.  At Ancestry, all the admin can do is write everything down, by hand, IF they can find your line of the family in the chart.  Remember, current and recent generations are “private” at Ancestry, so finding the right family line is almost impossible without additional information.  I provide a mini-genealogy form for my project members that has them complete only the direct line directly back from them.  Here’s the one for mitochondrial and the one for Y-line is the same except the word mother is changed to father.

Projects 7

Our Fireside Chat

I hope this has helped dispel some of the confusion surrounding projects, administrators, participants and expectations.  This field started out to be quite simple, with only Y surname projects, but as the field has developed and evolved over the last decade, so have projects and with that has come some level of complexity.  Joining the correct projects for you, your family and your DNA can be one of the most beneficial aspects of genetic genealogy, allowing you to find family and collaborate your research efforts with others.

______________________________________________________________

Disclosure

I receive a small contribution when you click on some of the links to vendors in my articles. This does NOT increase the price you pay but helps me to keep the lights on and this informational blog free for everyone. Please click on the links in the articles or to the vendors below if you are purchasing products or DNA testing.

Thank you so much.

DNA Purchases and Free Transfers

Genealogy Services

Genealogy Research