Ralph Dean Long (1922-1994), My Stepfather, 52 Ancestors #36

dad1

It was 20 years ago this weekend that he slipped away…this man I loved so much.  Well, slipped away isn’t exactly the right word for it.  He removed his own life support because the family was not united in their decision of what should be done.  So, he somehow rallied the strength and did it himself.  He was one of the bravest men I ever knew…in a very quiet, unassuming, homey type of way.  His final act of bravery only surprised me in that he was able to somehow find the physical strength to do it.

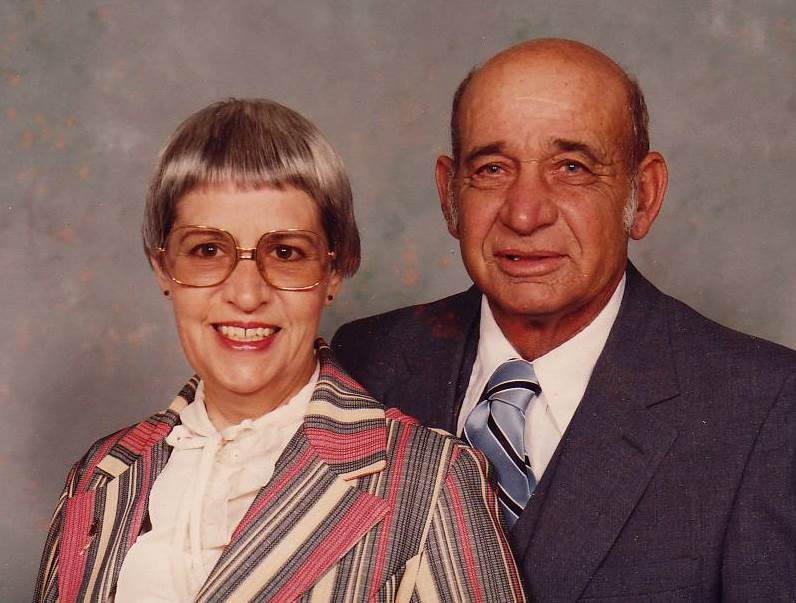
When I think of him, which is often, I think of him in his blue denim overalls.  He was a farmer, a Hoosier with a bit of a lisp and a definite Hoosier drawl, and a breathy, raspy laugh that was interjected between his words many times, like he got his own joke part way through and he just had to laugh before he could continue.  His sentences were full of laughter pauses and punctuations.  But when he was serious, he was dead serious and a man of very, very few words.  God help anyone who hurt someone, human or animal, that he loved.

Dean, as he was called, was born on December 26th, 1922 in Howard County, Indiana to Harley Clinton Long (1878-1949) and Lottie Bell Lee (1881-1962), the youngest of 12 or 13 children.  I never knew his parents.  I did, however, know several of his siblings.

Two of his siblings, Arnold and Wilma, never married.  They lived on the old family farmstead their entire lives.  Another sister, Verma, married but never had children.  She was the eternal sourpuss, and it was the family joke that her husband died to get away from her.  Wilma, on the other hand was the loving sweet aunt and Arnold, well, I’d describe him as a lecherous old man.  My Dad told him once that if he put his hands on me, or my mother, again, he’s kill him – and I do believe he meant it.  More importantly, Arnold believed it.

Dean was married initially to Martha Mae Alexander and they had two children, my step-brother, Gary, and a daughter, Linda who died as an infant.  Linda was born with what appeared from pictures to be Down’s syndrome.  When my daughter was born, Dean gave me Linda’s baby blanket.  I was extremely moved but I could never use it. It’s still safely tucked away.

Dean was grief-stricken when his daughter died at 18 months of age, the day after his birthday and two days after Christmas in 1959, but his heart-ache was only beginning.  His wife had a disease that was, at that time, impossible to diagnose. It was progressive, debilitating and fatal.  I don’t remember the name of the disease, but he carried a newspaper article in his billfold about it, and there were only a handful of known cases at the time.  It took her a decade to die, all while fighting an unknown foe to live and raise her son.

The aunts were Dean’s salvation during this time, because they stepped in and helped take care of Gary while Dean tended to his wife through her many hospitalizations.  This was before the days of handicapped accessibility, but he modified the house with all kinds of aids for her.  Many of which remained long after he and my mother were married simply because they were useful.

After Martha’s death, in 1968, Gary, by then a teenager, began manifesting symptoms of mental illness and was institutionalized episodically for many years.  We always wondered if Gary’s illness was in some way caused in utero by the beginnings of his mother’s horrible illness.

Through all of this, Dean continued to farm, because that was what he did – and if you’re a farmer, you have to farm whether you feel like it or not. He also developed chronic ulcers, had 7 or 8 surgeries to stop the bleeding over the years.  The family was “called in” more than once because he wasn’t expected to survive.  His abdomen looked like a railroad track.

But he did survive, because he had to – he had a family to take care of who needed him desperately.

By the time I met Dean, about 1969, he had joined Parents Without Partners and he was the “fix it” guy for all of the ladies in the group.  He would visit those who needed something fixed, in exchange for dinner or coffee and a doughnut maybe.  Everyone loved Dean.

For a man with so much grief and loss in his life, he was always warm, smiling, friendly and funny.  Nobody didn’t like Dean.  Well, except my Mom.

You see, Dean “took a shine” to her.  Yep, our stuff got fixed first, and he came “calling” complete with flowers wearing his only suit.  My Mom wasn’t interested in a farmer, because she grew up on a chicken farm, hated every minute, and swore she would never go back.  I recall vividly the day that Dean dropped in unexpectedly, carrying flowers and a box of Dunkin Doughnuts, in his ill-fitting too-big light blue suit.  He walked up the driveway hill, smiling and hopeful with a spring in his step carrying the box and flowers carefully, like the crown jewels.  He rang the doorbell.  Mom didn’t want company.  She had worked all day and was tired, plus, she wasn’t interested in a farmer.  I was happy to see Dean and headed to answer the door

Mother stopped me and told me not to answer the door.  He knocked and knocked, long after any hope of an answer disappeared.  Then he turned and walked slowly down the driveway hill, to his car, his shoulders slumped, head down and the flowers hanging forlornly from his hand.  He looked back at the house one more time and there was no smile.  He got in his car and drove away.  I cried and cried, not for myself, but for the oh-so-evident sadness, disappointment and terrible loneliness of that man in the ill-fitting blue suit.  Mother felt terrible and I told her she should.

Apparently something changed, because the door never went unanswered again and Dean became a regular part of our lives.

Then one day he asked me if he could marry my mother.  He and mother went to visit Gary and asked his blessing too.  We began planning a country wedding in a small white church.  Life was glorious for everyone.

dad2

The biggest challenge was introducing our cat to his dog.

I loved life on the farm and I became Dad’s shadow.  One of my biggest joys was to help Dad with the chores – driving the tractor, birthing hogs, whatever.  A few things I didn’t like and Dad was just grateful for any help he had.  Gary wasn’t there much and when he was, didn’t much care for farm work.  My mother fit right in, and was grateful Dad didn’t raise chickens.

I had been without a father since my own father’s death in 1963, so I was extremely grateful to have a father.  Dean became Dad someplace along the line and if you didn’t know I wasn’t his biological daughter, you would never have known.  I always joked with him.  Anything “bad” I told him was his fault and I inherited from him.

One day, he walked in from the barn, walked over to me sitting at the kitchen table, thunked me on the head with his thumb, which was his special gesture of affection, looked at me and said, “Hey, when I married your mother, I got my daughter back.”  His eyes welled up with tears, and then he just walked out of the room like he had told me nothing more important than that the soybeans were sprouting.  He was just that way, a man of very few words but deep commitment and undying love.

Now let’s just say I wasn’t the most well-behaved teenager in the world and I gave my mother multiple episodes of heartburn – and that’s probably putting it very mildly and quite understated.  She, however, got very even with me by wishing that awful mother curse upon me – “May your children be 10 times worse than you are.”  She removed said curse and apologized profusely many years later, but it was too late and the damage was already done.

But Dad, well, he was always the encouraging one.  He told me I could do anything I wanted to do, and that I could be anything I wanted to be…and growing up poor, on a farm, had nothing to do with it.  He looked at me one day, walking past the metal swing outside as we were snapping beans and said, “Bobbi, if anyone changes the world, it will be you,” and just continued walking.

I was dumbstruck, and remember looking at his back walking away after he dropped that bombshell on me.  I wondered what he meant.  But those rare words from Dad sunk in and hit home, and I’ve never forgotten them.

I remember vividly, oh so vividly, when Jim and I were at the National Geographic Society for a DNA Conference in 2005.  As we walked down the huge marble Explorer’s Hall – I looked at Jim and said, “Wouldn’t Dad he surprised?”  Jim said, “Not at all.”  I kind of laughed, because it’s a very long way from the hog farm in Indiana to the Explorer’s Hall in Washington DC.  Dad would have been proud.  However, little that I did ever surprised Dad.  He was the eternal optimist in spite of the horrible challenges he had weathered.

For some reason, possibly because he had lost his only daughter and I had lost my much-beloved father, we formed a special bond.  In fact, a bond so special it transcended his lifetime.  A year or so after his passing, I was sleeping, alone in my house.  Suddenly, in the middle of the night, someone woke me up.  I woke up with a start, sat straight upright, confused and terrified, because I was, supposedly, alone in the house.  I had just a few seconds to think about it, because a fireball suddenly exploded into the bedroom door from the hallway.  The house was on fire, and had I not been awake, I would have perished, trapped in that bedroom.  Yes, it was Dad who woke me up.

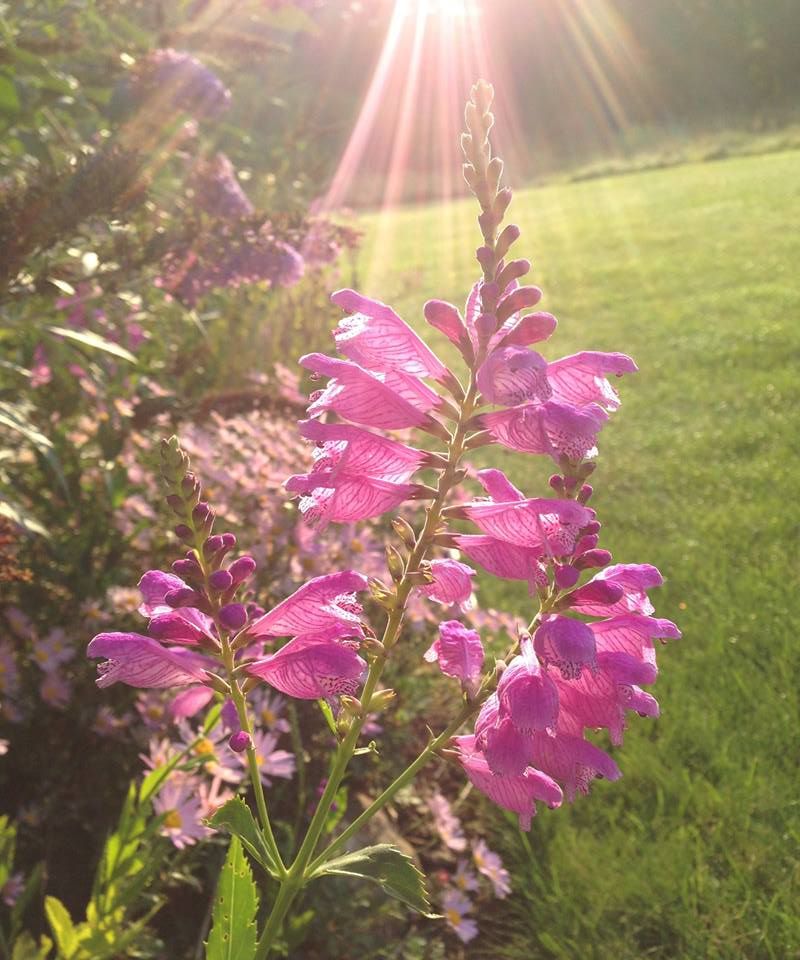
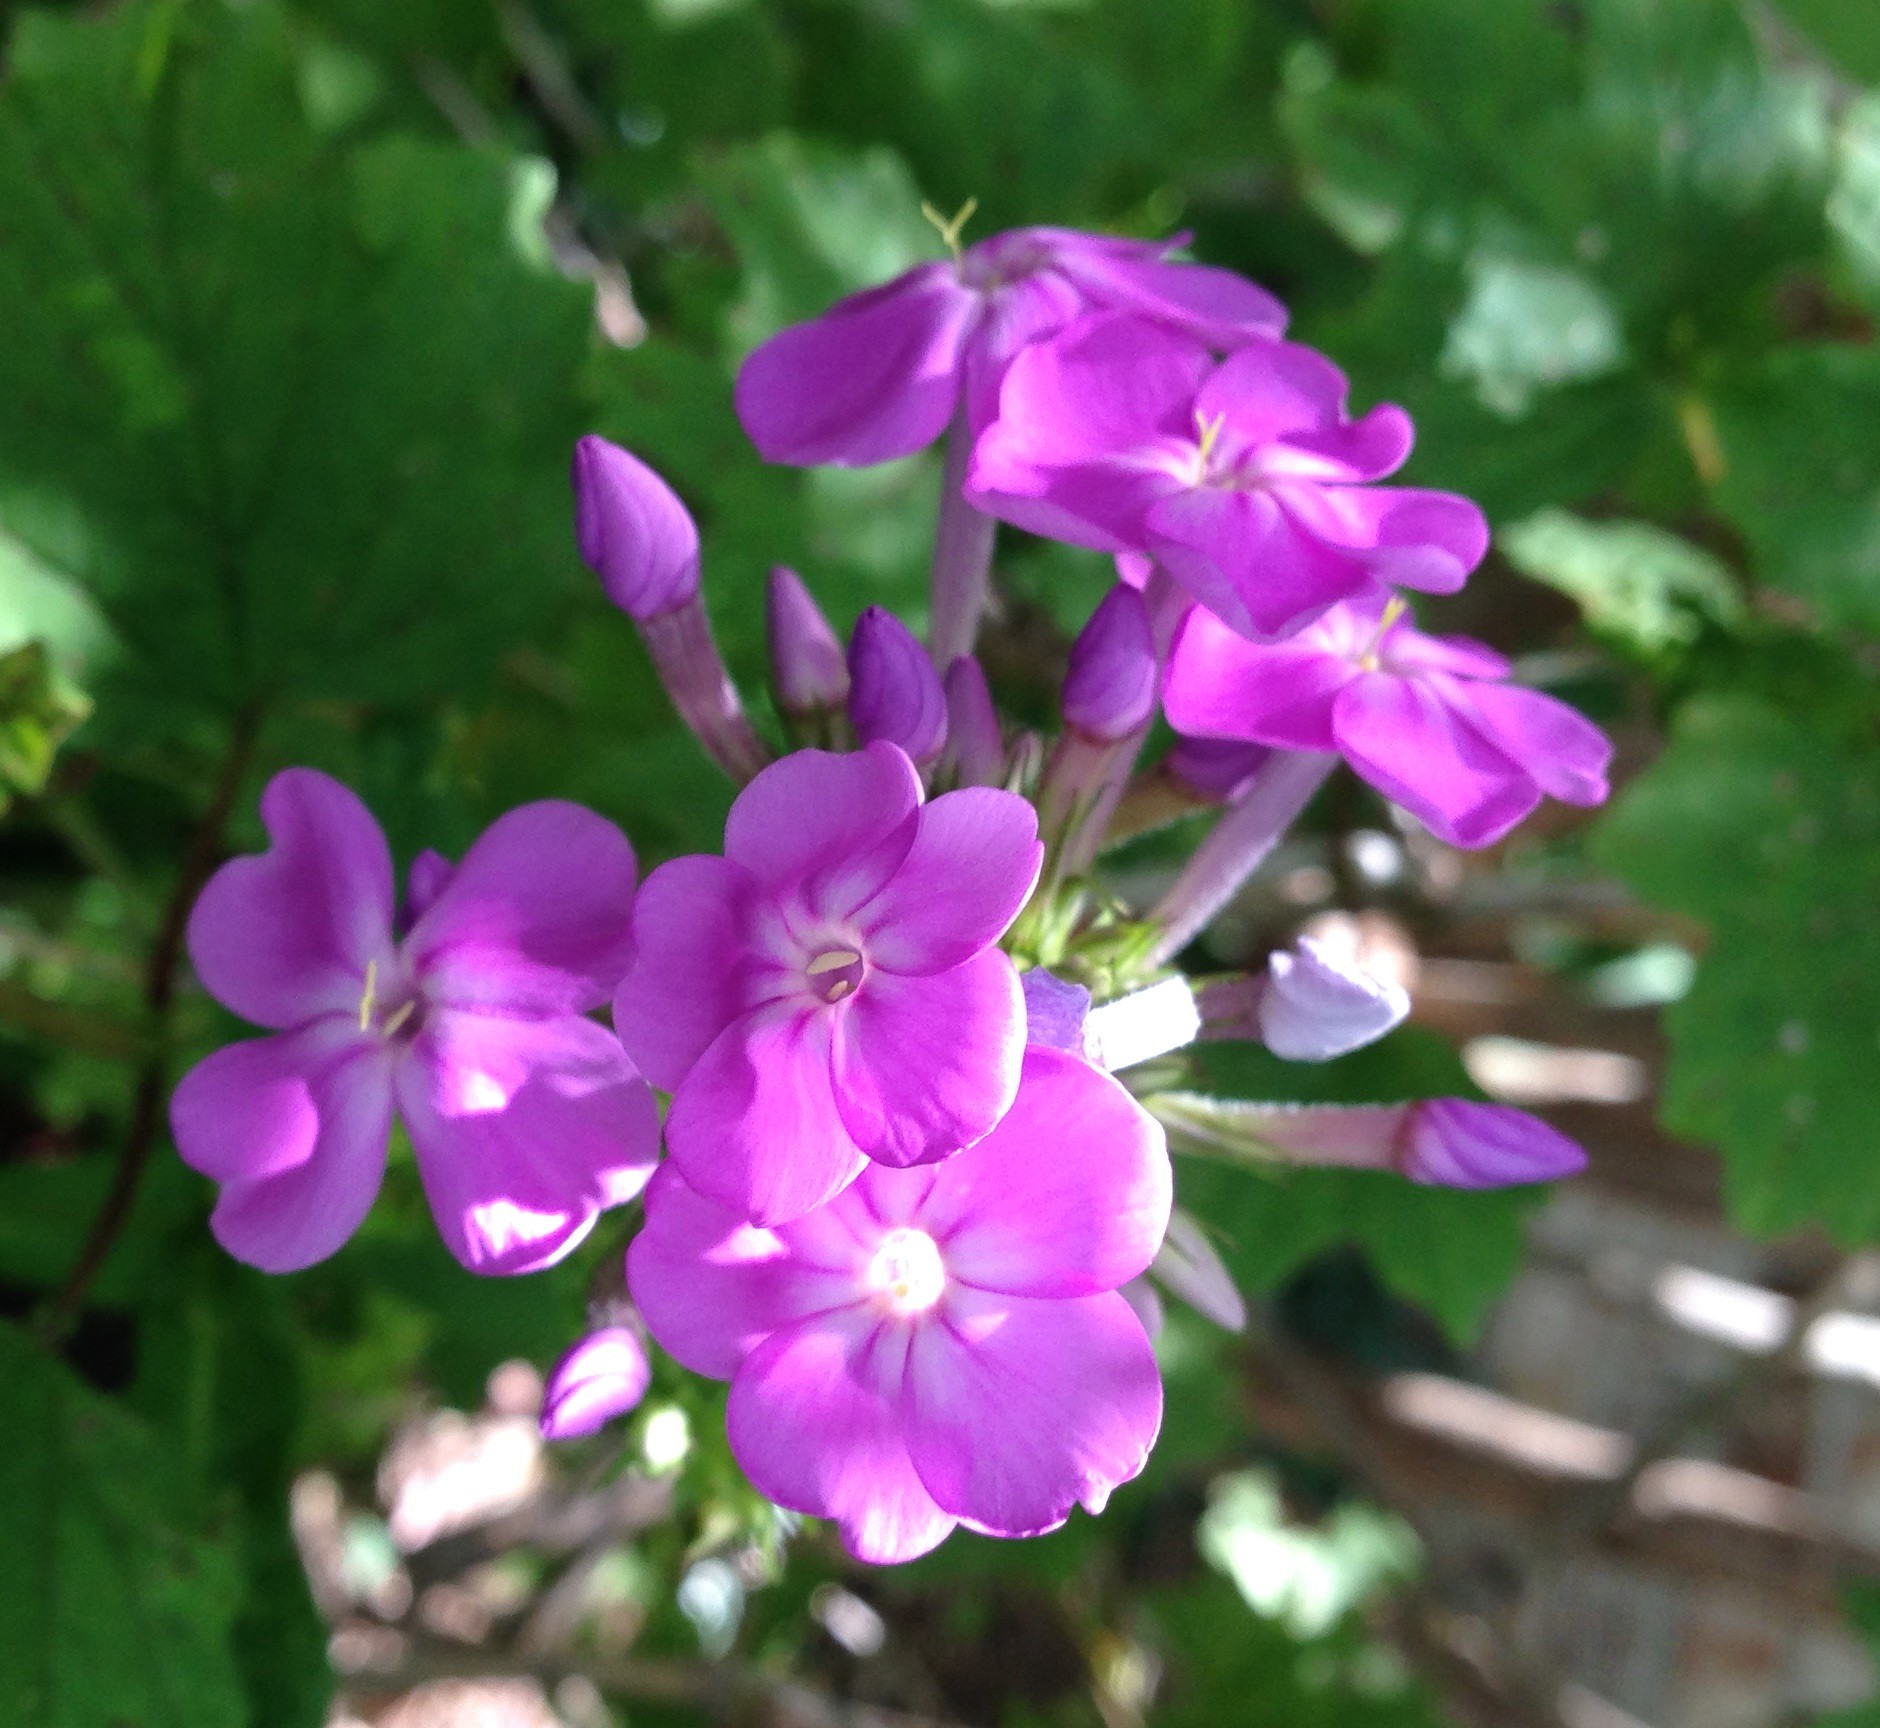
So, when I took this picture in my garden this weekend, I wondered where those rays came from.  I certainly didn’t see them when I was taking the photo. Then, I realized that it was indeed 20 years to the day since Dad’s passing.  Leave it up to Dad to say hello like this.  He was such a beautiful soul.

dad3

Mom has joined him now, as has Gary.

Losing Dad happened far too soon, and in large part due to his own choices regarding smoking.  That saddened me and to some extent, angered me, because neither Mom nor I, nor my kids, were ready for him to go.  Mom grieved his death horribly.  It’s also testimony however to how powerful nicotine addiction is – you’ll do it in the face of sure and certain death.  The fact that Dad wanted to, and couldn’t, overcome it saddens me even more.

While losing Dad was terrible, I have so many wonderful memories of him.  And he was such a kind, gentle and funny man.  His quiet demeanor belied his love of humor and a good prank, and I think he was always pondering one in the back of his mind

One of the favorite family stories was when, as a teenager, he stuffed the school heat ducts full of chicken feathers.  When the heat came on in the fall, not only did some of them manage to catch on fire and stink to high heavens, but the rest of them blew out all of the ducts into the classrooms. Of course, he “knew nothing about that,” (chuckle, chuckle) and neither did his brothers, but for some reason, that was a family favorite story for the duration of the lives of the brothers and sisters.  The sisters mostly rolled their eyes.

dad4
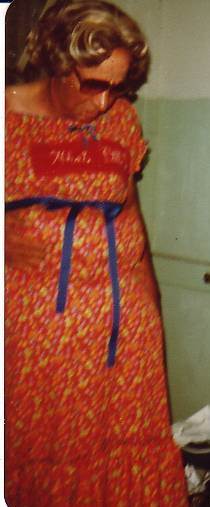
Another time, Dad dressed up as a pregnant woman for some event – probably a fundraiser for something – likely on a dare.  I had to help him with his dress and bra and teach him how to walk pregnant, in high heels.

dad5

I don’t think he ever got the hang of that.  Mom strapped a pillow on him before he went to the event.  Good thing he didn’t get stopped in this truck.  The local cops would have been talking about that forever.

His baldness was also a topic of conversation and of eternal, unending jokes.  He was not sensitive about it, so it was never off limits.  One time, we bought him a hairbrush for bald men, with no bristles.  I have absolutely no idea when this photo was taken, but he was clearly wearing a wig.

dad6 crop

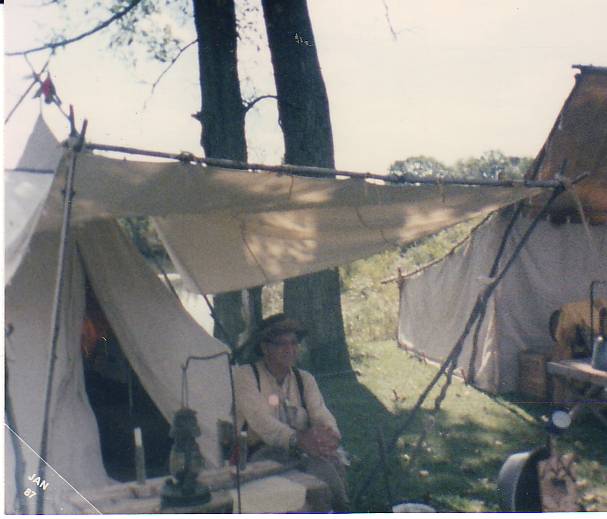
He loved to Rendezvous and he was a mountain man.

dad7

Those Rendezvous men were all the epitome of pranksters.  One time, when I went to visit, he was fictitiously being “tried” for molesting a ground hog.

To add to things, I got him a “doll” on a couch one year to take along with him.  The doll was wearing something red and black and she reclined on her fainting couch.  She was, perhaps slightly suggestive, a little risqué perhaps, nothing more. That doll on her 3 foot couch was kidnapped immediately and was held for ransom, passed around from camp to camp and tent to tent and appeared here and there, for years.  One time her stockings appeared tied to Dad’s top tent pole like a flag.

dad8

Dad’s Rendezvous nickname was “Hoot” and I don’t think it had to do entirely with an owl either, although clearly a double entendre.  He was, indeed, a hoot.

dad9

Even this younger picture, as a teenager, with Verma, reflects his sense of humor.  They were in Indianapolis and whatever was going on , she was not amused.  She was never amused.  He was always amused.

dad10

He always had stories to tell too, some true and some, well, in the flavor and honor of Rendezvousing.  I have no idea about the red eye in the skull, but I’m sure there was some wonderful story about that, perhaps tailored to the listener.  I do know that he had a very unique turtle shell with vulture feet and a vulture head with feathers for a tail and a variety of stories about how that happened, depending on the audience at hand.

In later years, Dad spent a lot of time with school kids showing them old timey ways to do things.  He would set up his “camp” at the schools in the yard someplace and the classes would come out one by one.

Dad was always making an outfit or something for his encampment out of castoffs.

dad11

He turned just about anything and everything into something useful for his encampment.  I made a lot of his Rendezvous clothes for him.  He made things like buttons out of wood and bone.  Mom and I used to go and visit him when he went “camping.”  He loved that.  Sometimes I would go in period costume too and generally caused some kind of ruckus, which was, of course, the entire point.

One time I announced to everyone that he had gotten my mother pregnant.  At the time, most of them didn’t know I wasn’t his biological child, so it was a tongue in cheek accusation, meant, of course, to give them something to “talk about” over the weekend.  He might have been tried for that too, for all I know.  Couldn’t be worse than molesting a groundhog.  I think he was sentenced to hang for that one, but was rescued by some Indian.  There was always some twist or subplot spontaneously evolving and all in great fun and joviality.  How he always looked forward to the next encampment, which was, of course, the next chapter in a continually unfolding drama with no script.

After Dad passed away, I went to the encampment the next summer in Burlington, his “home” Rendezvous location where they had a memorial, in Rendezvous tradition, to say goodbye to him.  His camp was set up “empty” and on Saturday night, the men all gathered around his campfire.  They all told stories about him and the good times they all shared, like that time he nearly got hung for molesting that groundhog.  I said to them that he could not have been a better father had he been mine biologically.  They got really quiet, then one of them said, “We didn’t know that he wasn’t your father.  We knew that one of you kids was a step-child, but based on how close you were to your Dad, we thought you were the biological child.”  To him, I was his child, pure and simple.

I miss Dad. He could have had another 10 or maybe even 20 years with us.

After his passing, I brought some of his phlox home from the farm and planted it here, along with some of his ferns that grew so thickly along the north side of the farmhouse.

dad12

The purple phlox grows tall here and thrives.  I moved it from my other house when I built this one, along with several ferns.

dad13

Today, I went outside to find the phlox blooming with, and shedding onto, the white Rose of Sharon.  I think of Dad every time I see the phlox blooming and that makes me feel good, just like seeing the ferns unfold their beautiful spikes in rebirth does every spring.  But today, this beautiful combination of the white flower and the purple bloom spoke to me of the purity of love and eternity, and how those that are gone are really still here – forever.  The phlox may have shed its bloom, but it is obviously still quite beautiful.

dad14

I will miss Dad forever, and I will grieve his passing forever, because I will love him forever.  But I will also honor his life by smiling and living with humor, honor and dignity.  I strive to cultivate the qualities in myself I so admired in him and found so inspirational and discovered were my bedrock, and hope to pass them on to my children, by example.  What better legacy could I leave him?

You may wonder why I included this story in my DNA blog.  Well, pure and simple, I inherited a wonderful legacy from Dad, my step-father, and my life was greatly enriched by his presence.  Sometimes, inheritance has nothing, absolutely nothing, to do with DNA.  He was as much my Dad, and in some ways more so, than my biological father.  A hundred or two hundred years ago, everyone would have thought I was his daughter and today, we would somehow discover that now dissolved fact and it would be considered a NPE or an undocumented adoption.  It wasn’t a surprise to us, it was just life as we lived it day by day.  It was only a surprise to those who didn’t know, which, 100 years later, would have been everyone.  Think about the fact that in his lifetime, even many of his close friends didn’t realize.

dad15

______________________________________________________________

Disclosure

I receive a small contribution when you click on some of the links to vendors in my articles. This does NOT increase the price you pay but helps me to keep the lights on and this informational blog free for everyone. Please click on the links in the articles or to the vendors below if you are purchasing products or DNA testing.

Thank you so much.

DNA Purchases and Free Transfers

Genealogy Services

Genealogy Research

Generational Inheritance

Autosomal DNA testing has opened up the brave new world for genealogists.  Along with that opportunity comes some amount of frustration and sometimes desperation to wring every possible tidbit of information out of autosomal results, sometimes resulting in pushing the envelope of what the technology and DNA can tell us.

I often have clients who want me to take a look at DNA results from people several generations removed from each other and try to determine if the ancestors are likely to be brothers, for example.  While that’s fairly feasible in the first few generations, the further back in time one goes, the less reliably we can say much of anything about how DNA is transmitted.  Hence, the less we can say, reliably, about relationships between people.

The best we can ever do is to talk in averages.  It’s like a coin flip.  Take a coin out right now and flip it 10 times.  I just did, and did not get 5 heads and 5 tails, which the average would predict.  But averages are comprised of a large number of outcomes divided by the actual number of events.  That isn’t the same thing as saying if one repeats the event 10 times that you will have 5 heads and 5 tails, or the average.  Each of those 10 flips are entirely independent, so you could have any of 11 different outcomes:

  • 0 heads 10 tails
  • 1 head 9 tails
  • 2 heads 8 tails
  • 3 heads 7 tails
  • 4 heads 6 tails
  • 5 heads 5 tails
  • 6 heads 4 tails
  • 7 heads 3 tails
  • 8 heads 2 tails
  • 9 heads 1 tail
  • 10 heads 0 tails

What the average does say is that in the end, you are most likely to have an average of 5 heads and 5 tails – and the larger the series of events, the more likely you are to reach that average.

My 10 single event flips were 4 heads and 6 tails, clearly not the average.  But if I did 10 series of coin flips, I bet my average would be 5 and 5 – and at 100 flips, it’s almost assured to be 50-50 – because the population, or number of events, has increased to the point where the average is almost assured.

You can see above, that while the average does indeed map to 5-5, or the 50-50 rule, the results of the individual flips are no respecter of that rule and are not connected to the final average outcome.  For example, if one set of flips is entirely tails and one set of flips is entirely heads, the average is still 50/50 which is not at all reflective of the actual events.

And so it goes with inheritance too.

However, we have come to expect that the 50% rule applies most of the time.  We knowriffle shuffle that it does, absolutely, with parents.  We do receive 50% of our DNA from each parent, but which 50%?.  From there, it can vary, meaning that we don’t necessarily get 25% of each grandparent’s DNA.  So while we receive 50% in total from each parent, we don’t necessarily receive every other segment or location, so it’s not like a rifle card shuffle where every other card is interspersed.

If one parents DNA sequence is:

TACGTACGTACG

A child cannot be presumed to receive every other allele, shown in red below.

TACGTACGTACG

The child could receive any portion of this particular segment, all of it, or none of it.

So, if you don’t receive every other allele from a parent, then how do you receive your DNA and how does that 50% division happen?  The bottom line is that we don’t know, but we are learning.  This article is the result of a learning experience.

Over time, genetic genealogists have come to expect that we are most likely to receive 25% of our DNA from each grandparent – which is statistically true when there are enough inheritance events.  This reflects our expectation of the standard deviation, where about 2/3rds of the results will be within the closest 25% in either direction of the center.  You can see expected standard deviation here.

This means that I would expect an inheritance frequency chart to look like this.

expected inheritance frequency

In this graph above, about half of the time, we inherit 50% of the DNA of any particular segment, and the rest of the time we inherit some different amount, with the most frequently inherited amounts being closer to the 50% mark and the outliers being increasingly rare as you approach 0% and 100% of a particular segment.

But does this predictability hold when we’re not talking about hundreds of events….when we’re not talking about population genetics….but our own family genetics, meaning one transmission event, from parent to child?  Because if that expected 50% factor doesn’t hold true, then that affects DRAMATICALLY what we can say about how related we are to someone 5 or 6 generations ago and how can we analyze individual chromosome data.

I have been uncomfortable with this situation for some time now, and the increasing incidence of anecdotal evidence has caused me to become increasingly more uncomfortable.

There are repeated anecdotal instances of significant segments that “hold” intact for many generations.  Statistically, this should not happen.  When this does happen, we, as genetic genealogists, consider ourselves lucky to be one of the 1% at the end of spectrum, that genetic karma has smiled upon us.  But is that true?  Are we at the lucky 1% end of the spectrum?

This phenomenon is shown clearly in the Vannoy project where 5 cousins who descend from Elijah Vannoy born in 1786 share a very significant portion of chromosome 15.  These people are all 5 generations or more distantly related from the common ancestor, (approximate 4th cousins) and should share less than 1% of their DNA in total, and certainly no large, unbroken segments.   As you can see, below, that’s not the case.  We don’t know why or how some DNA clumps together like this and is transmitted in complete (or nearly complete) segments, but they obviously are.  We often call these “sticky segments” for lack of a better term.

cousin 1

I downloaded this chromosome 15 information into a spreadsheet where I can sort it by chromosome.  Below you can see the segments on chromosome 15 where these cousins match me.

cousin 2

Chromosome 15 is a total of 141 cM in length and has 17,269 SNPs.  Therefore, at 5 generations removed, we would expect to see these people share a total of 4.4cM and 540 SNPs, or less for those more distantly related.  This would be under the matching threshold at either Family Tree DNA or 23andMe, so they would not be shown as matches at all.  Clearly, this isn’t the case for these 5 cousins.  This DNA held together and was passed intact for a total of 25 different individual inheritance events (5 cousins times 5 events, or  generations, each.)  I wrote about this in the article titles “Why Are My Predicted Cousin Relationships Wrong?”

Finally, I had a client who just would not accept no for an answer, wanted desperately to know the genetically projected relationship between two men who lived in the 1700s, and I felt an obligation to look into generational inheritance further.

About this same time, I had been working with my own matches at 23andMe.  Two of my children have tested there as well, a son and a daughter, so all of my matches at 23andMe obviously match me, and may or may not match my children.  This presented the perfect opportunity to study the amount of DNA transmitted in each inheritance event between me and both children.

Utilizing the reports at www.dnagedcom.com, I was able to download all of my matches into a spreadsheet, but then to also download all of the people on my match list that all of my matches match too.

I know, that was a tongue twister.  Maybe an example will help.

I match John Doe.  My match list looks like this and goes on for 353 lines.

match list

I only match John Doe on one chromosome at one location.  But finding who else on my match list of 353 people that John Doe matches is important because it gives me clues as to who is related to whom and descends from the same ancestor.  This is especially true if you recognize some of the people that your match matches, like your first cousin, for example.  This suggests, below that John Doe is related to me through the same ancestor as my first cousin, especially if John matches me with even more people who share that ancestor.   If my cousin and I both match John Doe on the same segment, that is strongly suggestive that this segment comes from a common ancestor, like in the previous Vannoy example.

Therefore, I methodically went through and downloaded every single one of my matches matches (from my match list) to see who was also on their list, and built myself a large spreadsheet.  That spreadsheet exercise is a topic for another article.  The important thing about this process is that how much DNA each of my children match with John Doe tells me exactly how much of my DNA each of my children inherited from me, versus their father, in that segment of DNA.

match comparison

In the above example, I match John Doe on Chromosome 11 from 37,000,000-63,000,000.  Looking at the expected 50% inheritance, or normal distribution, both of my children should match John Doe at half of that.  But look at what happened.  Both of my children inherited almost exactly all of the same DNA that I had to give.  Both of them inherited just slightly less in terms of genetic distance (cM) and also in terms of the number of SNPs.

It’s this type of information that has made me increasingly skeptical about the 50% bell curve standard deviation rule as applied to individual, not population, genetics.  The bell curve, of course, implies that the 50% percentile is the most likely even to occur, with the 49th being next most likely, etc.

This does not seem to be holding true.  In fact, in this one example alone, we have two examples of nearly 100% of the data being passed, not 50% in each inheritance event.  This is the type of one-off anecdotal evidence that has been making me increasingly uncomfortable.

I wanted something more than anecdotal evidence.  I copied all of the match information for myself and my children with my matches to one spreadsheet.  There are two genetic measures that can be utilized, centimorgans (cM) or total SNPs. I am using cM for these examples unless I state otherwise.

In total, there were 594 inheritance events shown as matches between me and others, and those same others and my children.

Upon further analysis of those inheritance events, 6 of them were actually not inheritance events from me.  In other words, those people matched me and my children on different chromosomes.  This means that the matches to my children were not through me, but from their father’s side or were IBS, Inherited by State.

son daughter comparison

This first chart is extremely interesting.  Including all inheritance events, 55% of the time, my children received none of the DNA I had to give them.  Whoa Nellie.  That is not what I expected to see.  They “should have” received half of my DNA, but instead, half of the time, they received none.

The balance of the time, they received some of my DNA 23% of the time and all of my DNA 21% of the time.  That also is not what I expected to see.

Furthermore, there is only one inheritance event in which one of my children actually inherited exactly half of what I had to offer, so significantly less than 1% at .1%.  In other words, what we expected to see actually happened the least often and was vanishingly rare when not looking at averages but at actual inheritance events.

Let’s talk about that “none” figure for a minute.  In this case, none isn’t really accurate, but I can’t be more accurate.  None means that 23andMe showed no match.  Their threshold for matching is 7cM (genetic distance) and 700 SNPS for the first matching segment, and then 5cM and 700 SNPS for secondary matching segments.  However, if you have over 1000 matches, which I do, matches begin to “fall off,” the smallest ones first, so you can’t tell what the functional match threshold is for you or for the people you match.  We can only guess, based on their published thresholds.

So let’s look at this another way.

Of the 329 times that my children received none of my DNA, 105 of those transmissions would be expected to be under the 700cM threshold, based on a 50% calculation of how many cMs I matched with the individual.  However, not all of those expected events were actually under the threshold, and many transmissions that were not expected to be under that threshold, were.  Therefore, 224, or 68% of those “none” events were not expected if you look at how much of my DNA the child would be expected to inherit at 50%.

Another very interesting anomaly that pops right up is the number of cases where my children inherited more than I had to give them.  In the example below, you can see that I match Jane Doe with 15.2cM and 2859 SNPs, but my daughter matches Jane with 16.3cM and 2960 on the same chromosome.

spreadsheet layout

There are a few possibilities to explain this:

  • My daughter also matches this person on her father’s side at this transition point.
  • My daughter matches this person IBS at this point.
  • The 23andMe matching software is trying to compensate for misreads.
  • There are misreads or no calls in my file.

There of course may be a combination of several of these factors, but the most likely is the fact that she is IBS at this location and the matching software is trying to be generous to compensate for possible no-calls and misreads.  I suggest this because they are almost uniformly very small amounts.

Therefore when my children match me at 100% or greater, I simply counted it as an exact match.  I was surprised at how many of these instances there were.  Most were just slightly over the value of 2 in the “times expected” column.  To explain how this column functions, a value of 1 is the expected amount – or 50% of my DNA.  A value of 2 means that the child inherited all of the DNA I had to offer in that location.  Any value over 2 means that one or more of the bulleted possibilities above occurred.

Between both of my children, there were a total of 75, or 60% with values greater than 2 on cMs and 96, or 80%, on SNPs, meaning that my children matched those people on more DNA at that location than I had to offer.  The range was from 2 to 2.4 with the exception of one match that was at 3.7.  That one could well be a valid transition (other parent) match.

There has been a lot of discussion recently about X chromosome inheritance.  In this case, the X would be like any other chromosome, since I have two Xs to recombine and give to my children, so I did not remove X matches from these calculations.  The X is shown as chromosome 99 here and 23 on the graphs to enable correct column sorting/graphing.

In the chart below, inheritance events are charted by chromosome.  The “Total” columns are the combined events of both my son and daughter.  The blue and pink columns are the inheritance events for both of them, which equal the total, of course.

The “none” column reflects transmissions on that chromosome where my children received none of my DNA.  The “some” column reflects transmission events where my children received some portion of my DNA between 0 (none) and 100% (all).  The “all” column reflects events where my children received all of the DNA that I had to offer.

chromosomal comparison

I graphed these events.

total inheritance graph

The graph shows the total inheritance events between both of my children by chromosome.  Number 23 in these charts is the X chromosome.

son inheritance graph

daughter inheritance graph

These inheritance numbers cause me to wonder what is going on with chromosome 5 in the case of both my daughter and son, and also chromosome 6 with my son.  I wonder if this would be uniform across families relative to chromosome 5, or if it is simply an anomaly within my family inheritance events.  It seems odd that the same anomaly would occur with both children.

son daughter inheritance graph

What this shows is that we are not dealing with a distribution curve where the majority of the events are at the 50% level and those that are not are progressively nearer to the 50% level than either end.  In other words, the Expected Inheritance Frequency is not what was found.

expected inheritance frequency

The actual curve, based on the inheritance events observed here, is shown below, where every event that was over the value of 2, or 100%, was normalized to 2.  This graph is dramatically different than the expected frequency, above.

actual inheritance frequency

Looking at this, it becomes immediately evident that we inherit either all of nothing of our parents DNA segments 85% of the time, and only about 15% of the time we inherit only a portion of our parents DNA segments.  Very, very rarely is the portion we inherit actually 50%, one tenth of one percent of the time.

Now that we understand that individual generational inheritance is not a 50-50 bell curve event, what does this mean to us as genetic genealogists?

I asked fellow genetic genealogist, Dr. David Pike, a mathematician to look this over and he offered the following commentary:

“As relationships get more distant, the number of blocks of DNA that are likely to be shared diminishes greatly.  Once down to one block, then really there are three outcomes for subsequent inheritance:  either the block is passed intact, no part of it is passed on, or recombination happens and a portion of it is passed on.  If we ignore this recombination effect (which should rarely affect a small block) then the block is either passed on in an “all or nothing” manner.  There’s essentially no middle ground with small blocks and even with lots of examples it doesn’t really make sense to expect an average of 50%.  As an analogy, consider the human population:  with about half of us being female and about half of us being male, the “average” person should therefore be androgynous, and yet very few people are indeed androgynous.”

In other words, even if you do have a segment that is 10 cMs in length, it’s not 10 coin flips, it’s one coin flip and it’s going to either be all, nothing or a portion thereof, and it’s more than 6 times more likely to be all or nothing than to be a partial inheritance.

So how do we resolve the fact that when we are looking at the 700,000 or so locations tested at Family Tree DNA and the 600,000 locations tested at 23andMe, that we can in fact use the averages to predict relationships, at least in closely related individuals, but we can’t utilize that same methodology in these types of individual situations?  There are many inheritance events being taken into consideration, 600,000 – 700,000, an amount that is mathematically high enough to over overcome the individual inheritance issues.  In other words, at this level, we can utilize averages.  However, when we move past the larger population model, the individual model simply doesn’t fit anymore for individual event inheritance – in other words, looking at individual segments.

Dr. Pike was kind enough to explain this in mathematical terms, but ones that the rest of us can understand:

“I think that part of what is at stake is the distinction between continuous versus discrete events.  These are mathematical terms, so to illustrate with an example, the number line from 0 to 10 is continuous and includes *all* numbers between them, such 2.55, pi, etc.  A discrete model, however, would involve only a finite number of elements, such as just the eleven integers from 0 to 10 inclusive.  In the discrete model there is nothing “in between” consecutive elements (such as 3 and 4), whereas in the continuous model there are infinitely elements between them.

It’s not unlike comparing a whole spectrum against a finite handful of a few options.  In some cases the distinction is easily blurred, such as if you conduct a survey and ask people to rate a politician on a discrete scale of 0 to 10… in this case it makes intuitive sense to say that the politician’s average rating was 7.32 (for example) even though 7.32 was not one of the options within the discrete scale.

In the realm of DNA, suppose that cousins Alice and Bob share 9 blocks of DNA with each other and we ask how many blocks Alice is likely to share with Bob’s unborn son.  The answer is discrete, and with each block having a roughly 50/50 chance we expect that there will likely be 4 or 5 blocks shared by Alice and Bob Jr., although the randomness of it could result in anywhere from 0 to 9 of the blocks being shared.  Although it doesn’t make practical sense to say that “four and a half” blocks will likely be shared [well, unless we allow recombination to split a block and thereby produce a shared “half block”], there is still some intuitive comfort in saying that 4.5 is the average of what we would expect, but in reality, either 4 or 5 blocks are shared.

But when we get to the extreme situation of there being only 1 block, for which the discrete options are only 0 or 1 block shared, yes or no, our comfortable familiarity with the continuous model fails us.  There are lots of analogies here, such as what is the average of a coin toss, what is the average answer to a True/False question, what the average gender of the population, etc.

Discrete models with lots of options can serve as good approximations of continuous situations, and vice-versa, which is probably part of what’s to blame for confusion here.

Really DNA inheritance is discrete, but with very many possible segments [such as if we divided the genome up into 10 cM segments and asked how many of Alice’s paternal segments will be inherited by one of her children, we can get away with a continuous model and essentially say that the answer is roughly 50%.  Really though, if there are 3000 of these blocks, the actual answer is one of the integers:  0, 1, 2, …, 2999, 3000.  The reality is discrete even though we like the continuous model for predicting it.

However, discrete situations with very few options simply cannot be modelled continuously.”

Back to our situation where we are attempting to determine a relationship of 2 men born in the 1700s whose descendants share fragments of DNA today.  When we see a particularly large fragment of DNA, we can’t make any assumptions about age or how long it has been in existence by “reverse engineering” it’s path to a common ancestor by doubling the amount of DNA in every generation.  In other words, based on the evidence we see above, it has most likely been passed entirely intact, not divided.  In the case of the Vannoy DNA, it looks like the ends have been shaved a few times, but the majority of the segment was passed entirely intact.  In fact, you can’t double the DNA inherited by each individual 5 times, because in at least one case, Buster, doubling his total matching cM, 100, even once would yield a number of cM greater the size of chromosome 15 at 141 cM.

Conversely, when we see no DNA matches, for example, in people who “should be” distant cousins, we can’t draw any conclusions about that either.  If the DNA didn’t get passed in the first generation – and according to the numbers we just saw – 58% doesn’t get passed at all, and 26% gets passed in its entirety, leaving only about 15% to receive some portion of one parent’s DNA, which is uniformly NOT 50% except for one instance in almost 1000 events (.1%) – then all bets for subsequent generations are off – they can’t inherit their half if their half is already gone or wasn’t half to begin with.

Based on mathematical model, Probability of Recombination, Dr. Pike has this to say:

If I’m reading this right, a 10 cM block has a 10% chance of being split into parts during the recombination process of a single conception. Although 10% is not completely negligible, it’s small enough that we can essentially consider “all” or “nothing” as the two dominant outcomes.

This is the fundamental underlying reason why testing companies are hesitant to predict specific relationships – they typically predict ranges of relationships – 1st to 3rd cousin, for example, based on a combination of averages – of the percentages of DNA shared, the number of segments, the size of segments, the number of SNPs etc.  The testing company, of course, can have no knowledge of how our individual DNA is or was actually passed, meaning how much ancestral DNA we do or don’t receive, so they must rely on those averages, which are very reliable as a continuous population model, and apparently, much less so as discrete individual events.

I would suggest that while we certainly have a large enough sample of inheritance events between me and my two children to be statistically relevant, it’s not large enough study to draw any broad sweeping conclusions. It is, after all, only 3 people and we don’t know how this data might hold up compared to a much larger sample of family inheritance events.  I’d like to see 100 or 1000 of these types of studies.

I would be very interested to see how this information holds up for anyone else who would be willing to do the same type of information download of their data for parent/multiple sibling inheritance.  I will gladly make my spreadsheet with the calculations available as a template to anyone who wants to do the same type of study.

I wonder if we would see certain chromosomes that always have higher or lower generational inheritance factors, like the “none” spike we see on chromosome 5.  I wonder if we would see a consistent pattern of male or female children inheriting more or less (all or none) from their parents.  I wonder what other kinds of information would reveal itself in a larger study, and if it would enable us to “weight” match information by chromosome or chromosome/gender, further refining our ability to understand our genetic relationships and to more accurately predict relationships.

I want to thank Dr. David Pike for reviewing and assisting with this article and in particular, for being infinitely patient and making the application of the math to genetics understandable for non-mathematicians.  If you would like to see an example of Dr. Pike’s professional work, here is one of his papers.  You can find his personal web page here and his wonderful DNA analysis tools here.

______________________________________________________________

Disclosure

I receive a small contribution when you click on some of the links to vendors in my articles. This does NOT increase the price you pay but helps me to keep the lights on and this informational blog free for everyone. Please click on the links in the articles or to the vendors below if you are purchasing products or DNA testing.

Thank you so much.

DNA Purchases and Free Transfers

Genealogy Services

Genealogy Research

Neanderthal Genome Further Defined in Contemporary Eurasians

DNA X

A new study released by Howard Hughes Medical Institute at Harvard Medical School on January 29th titled “When Populations Collide” provides some interesting insights about Neanderthal DNA in modern humans.  This study compared the full Neanderthal genome to that of 1004 living individuals.

In general, people in East Asia carry more Neanderthal than Europeans who carry 1-3%, and Africans carry none or very little.  It appears, according to David Reich, that Neanderthal DNA is not proportionately represented in contemporary humans, meaning that some areas of Neanderthal DNA are commonly found and others not at all.  Some Neanderthal genes are carried by more than 60% of Europeans or Asians, most often associated with skin and hair color, or keratin.  Reich’s thought is that people exiting Africa assimilated with Neanderthals and selected for these genes that gave them an adaptive and survival advantage in the cooler non-African climate.

One particularly big Neanderthal genetic desert is the X chromosome, a phenomenon called hybrid sterility.  Reich suggests that this means that when Neanderthals and humans exiting from Africa interbred, they were on the cusp of being unable to reproduce successfully.  Reich explains that “when two populations are distantly related, genes related to fertility inherited on the X chromosome can interact poorly with genes elsewhere in the genome and that interference can render males, who carry only one X, sterile.”

Given the recent discussions about the X chromosome and the possibility that it may be inherited in an all-or-nothing manner more often than the other chromosomes, I had to wonder how they determined that this was hybrid sterility and not an case of absence of recombination.

Reich’s team apparently had the same question, so they evaluated the genes related to the function of the testes, confirming they too had a particularly low inheritance frequency of Neanderthal DNA.  These, combined, would eventually cause the X to be present in very small quantities in the genome of descendants since the Neanderthal X could only be inherited from women and then would cause the resulting males to be sterile.  So in essence, only females could pass the X on and only their daughters would pass it further.  Males carrying that X not only wouldn’t pass the X, they wouldn’t pass anything at all due to sterility.

If, in addition to this, the X has unusual recombination features, that could exacerbate the situation.  Conversely, if the X is inherited intact more often than not at all, it could increase the likelihood of the X being brought forward in the population.

Reich says his team is now focused on looking at Neanderthal DNA and human disease genes.  He says that his new study revealed that lupus, diabetes and Crohn’s Disease likely originate from Neanderthals.

Another study, published the same day in Science titled “Resurrecting Surviving Neandertal Lineages from Modern Human Genomes,” reaches the same conclusions about the Neanderthal inherited traits related to skin color.  This study compared the full genomes of 379 East Asians and 286 Europeans to Neanderthal genomes and discovered that they could map about 20% of the Neanderthal DNA in those individuals today.  This, conversely, means that 80% of the Neanderthal genome is missing, so either truly missing or simply missing in the people whose DNA they sequenced.  It will be interesting to see what is found as more contemporary genetic sequences are compared against Neanderthal, and as more Neanderthal DNA is found and sequenced.

Fortunately, recent advances in dealing with contaminated ancient DNA hold a great deal of promise in terms of increasing our ability to sequence DNA that was previously thought to be useless.  This report is described in the article “Separating endogenous ancient DNA from modern day contamination in a Siberian Neanderthal” and was used in the sequencing and analysis of the Neanderthal toe bone found in Siberia.

To better understand the legacy of Neanderthals, Dr. Reich and his colleagues are collaborating with the UK Biobank, which collects genetic information from hundreds of thousands of volunteers. The scientists will search for Neanderthal genetic markers, and investigate whether Neanderthal genes cause any noticeable differences in anything from weight to blood pressure to scores on memory tests.

“This experiment of nature has been done,” says Dr. Reich, “and we can study it.”

______________________________________________________________

Disclosure

I receive a small contribution when you click on some of the links to vendors in my articles. This does NOT increase the price you pay but helps me to keep the lights on and this informational blog free for everyone. Please click on the links in the articles or to the vendors below if you are purchasing products or DNA testing.

Thank you so much.

DNA Purchases and Free Transfers

Genealogy Services

Genealogy Research

That Unruly X….Chromosome That Is

Iceberg

Something is wrong with the X chromosome.  More specifically, something is amiss with trying to use it, the way we normally use recombinant chromosomes for genealogy.  In short, there’s a problem.

If you don’t understand how the X chromosome recombines and is passed from generation to generation, now would be a good time to read my article, “X Marks the Spot” about how this works.  You’ll need this basic information to understand what I’m about to discuss.

The first hint of this “problem” is apparent in Jim Owston’s “Phasing the X Chromosome” article.  Jim’s interest in phasing his X, or figuring out where it came from genealogically, was spurred by his lack of X matches with his brothers.  This is noteworthy, because men don’t inherit any X from their father, so Jim’s failure to share much of his X with his brothers meant that he had inherited most of his X from just one of his mother’s parents, and his brothers inherited theirs from the other parent.  Utilizing cousins, Jim was able to further phase his X, meaning to attribute portions to the various grandparents from whence it came.  After doing this work, Jim said the following”

“Since I can only confirm the originating grandparent of 51% my X-DNA, I tend to believe (but cannot confirm at the present) that my X-chromosome may be an exact copy of my mother’s inherited X from her mother. If this is the case, I would not have inherited any X-DNA from my grandfather. This would also indicate that my brother Chuck’s X-DNA is 97% from our grandfather and only 3% from our grandmother. My brother John would then have 77% of his X-DNA from our grandfather and 23% from our grandmother.”

As a genetic genealogist, at the time Jim wrote this piece, I was most interested in the fact that he had phased or attributed the pieces of the X to specific ancestors and the process he used to do that.  I found the very skewed inheritance “interesting” but basically attributed it to an anomaly.  It now appears that this is not an anomaly.  It was, instead the tip of the iceberg and we didn’t recognize it as such.  Let’s look at what we would normally expect.

Recombination

The X chromosome does recombine when it can, or at least has the capacity to do so.  This means that a female who receives an X from both her father and mother receives a recombined X from her mother, but receives an X that is not recombined from her father.  That is because her father only receives one X, from his mother, so he has nothing to recombine with.  In the mother, the X recombines “in the normal way” meaning that parts of both her mother’s and her father’s X are given to her children, or at least that opportunity exists.  If you’re beginning to see some “weasel words” here or “hedge betting,” that’s because we’ve discovered that things aren’t always what they seem or could be.

The 50% Rule

In the statistical world of DNA, on the average, we believe that each generation receives roughly half of the DNA of the generations before them.  We know that each child absolutely receives 50% of the DNA of both parents, but how the grandparents DNA is divided up into that 50% that goes to each offspring differs.  It may not be 50%.  I am in the process of doing a generational inheritance study, which I will publish soon, which discusses this as a whole.

However, let’s use the 50% rule here, because it’s all we have and it’s what we’ve been working with forever.

In a normal autosomal, meaning non-X, situation, every generation provides to the current generation the following approximate % of DNA:

Autosomal % chart

Please note Blaine Bettinger’s X maternal inheritance chart percentages from his “More X-Chromosome Charts” article, and used with his kind permission in the X Marks the Spot article.

Blaine's maternal X %

I’m enlarging the inheritance percentage portion so you can see it better.

Blaine's maternal X % cropped

Taking a look at these percentages, it becomes evident that we cannot utilize the normal predictive methods of saying that if we share a certain percentage of DNA with an individual, then we are most likely a specific relationship.  This is because the percentage of X chromosome inherited varies based on the inheritance path, since men don’t receive an X from their fathers.  Not only does this mean that you receive no X from many ancestors, you receive a different percentage of the X from your maternal grandmother, 25%, because your mother inherited an X from both of her parents, versus from your paternal grandmother, 50%, because your father inherited an X from only his mother.

The Genetic Kinship chart, below, from the ISOGG wiki, is the “Bible” that we use in terms of estimating relationships.  It doesn’t work for the X.

Mapping cousin chart

Let’s look at the normal autosomal inheritance model as compared to the maternal X chart fan chart percentages, above, and similar calculations for the paternal side.  Remember, the Maternal Only column applies only to men, because in the very first generation, men’s and women’s inheritance percentages diverge.  Men receive 100% of their X from their mothers, while women receive 50% from each parent.

Generational X %s

Recombination – The Next Problem

The genetic genealogy community has been hounding Family Tree DNA incessantly to add the X chromosome matching into their Family Finder matching calculations.

On January 2, 2014, they did exactly that.  What’s that old saying, “Be careful what you ask for….”  Well, we got it, but “it” doesn’t seem to be providing us with exactly what we expected.

First, there were many reports of women having many more matches than men.  That’s to be expected at some level because women have so many more ancestors in the “mix,” especially when matching other women.

23andMe takes this unique mixture into consideration, or at least attempts to compensate for it at some level.  I’m not sure if this is a good or bad thing or if it’s useful, truthfully.  While their normal autosomal SNP matching threshold is 7cM and 700 matching SNPs within that segment, for X, their thresholds are:

  • Male matched to male – 1cM/200 SNPs
  • Male matched to female – 6cM/600 SNPs
  • Female matched to female – 6cM/1200 SNPs

Family Tree DNA does not use the X exclusively for matching.  This means that if you match someone utilizing their normal autosomal matching criteria of approximately 7.7cM and 500 SNPs, and you match them on the X chromosome, they will report your X as matching.  If you don’t match someone on any chromosome except the X, you will not be reported as a match.

The X matching criteria at Family Tree DNA is:

  • 1cM/500 SNPs

However, matching isn’t all of the story.

The X appears to not recombine normally.  By normally, I don’t mean something is medically wrong, I mean that it’s not what we are expecting to see in terms of the 50% rule.  In essence, we would expect to see approximately half of the X of each parent, grandfather and grandmother, passed on to the child from the mother in the maternal line where recombination is a possibility.  That appears to not be happening reliably.  Not only is this not happening in the nice neat 50% number, the X chromosome seems to be often not recombining at all.  If you think the percentages in the chart above threw a monkey wrench into genetic genealogy predictions, this information, if it holds up in a much larger test, in essence throws our predictive capability, at least as we know it today, out the window.

The X Doesn’t Recombine as Expected

In my generational study, I noticed that the X seemed not to be recombining.  Then I remembered something that Matt Dexter said at the Family Tree DNA Conference in November 2013 in Houston.  Matt has the benefit of having a full 3 generation pedigree chart where everyone has been tested, and he has 5 children, so he can clearly see who got the DNA from which of their grandparents.

I contacted Matt, and he provided me with his X chromosomal information about his family, giving me permission to share it with you.  I have taken the liberty of reformatting it in a spreadsheet so that we can view various aspects of this data.

Dexter table

First, note that I have sorted these by grandchild.  There are two females, who have the opportunity to inherit from 3 grandparents.  The females inherited one copy of the X from their mother, who had two copies herself, and one copy of the X from her father who only had his mother’s copy.  Therefore, the paternal grandfather is listed above, but with the note “cannot inherit.”  This distinguishes this event from the circumstance with Grandson 1 where he could inherit some part of his maternal grandfather’s X, but did not.

For the three grandsons, I have listed all 4 grandparents and noted the paternal grandmother and grandfather as “cannot inherit.”  This is of course because the grandsons don’t inherit an X from their father.  Instead they inherit the Y, which is what makes them male.

According to the Rule of 50%, each child should receive approximately half of the DNA of each maternal grandparent that they can inherit from.  I added the columns, % Inherited cM and % Inherited SNP to illustrate whether or not this number comes close to the 50% we would expect.  The child MUST have a complete X chromosome which is comprised of 18092 SNPs and is 195.93cM in length, barring anomalies like read errors and such, which do periodically occur.  In these columns, 1=100%, so in the Granddaughter 1 column of % Inherited cM, we see 85% for the maternal grandfather and about 15% for the maternal grandmother.  That is hardly 50-50, and worse yet, it’s no place close to 50%.

Granddaughter 1 and 2 must inherit their paternal grandmother’s X intact, because there is nothing to recombine with.

Granddaughter 2 inherited even more unevenly, with about 90% and 10%, but in favor of the other grandparent.  So, statistically speaking, it’s about 50% for each grandparent between the two grandchildren, but it is widely variant when looking at them individually.

Grandson 1, as mentioned, inherited his entire X from his maternal grandmother with absolutely no recombination.

Grandsons 2 and 3 fall much closer to the expected 50%.

The problem for most of us is that you need 3 or 4 consecutive generations to really see this happening, and most of us simply don’t have data that deep or robust.

A recent discussion on the DNA Genealogy Rootsweb mailing list revealed several more of these documented occurrences, among them, two separate examples where the X chromosome was unrecombined for 4 generations.

Robert Paine, a long-time genetic genealogy contributor and project administrator reported that in his family medical/history project, at 23andMe, 25% of his participants show no recombination on the X chromosome.  That’s a staggering percentage.  His project consists of  21 people in with 2 blood lines tested 5 generations deep and 2 bloodlines tested at 4 generations

One woman’s X matches her great-great-grandmother’s X exactly.  That’s 4 separate inheritance events in a row where the X was not recombined at all.

The graphic below, provided by Robert,  shows the chromosome browser at 23andMe where you can see the X matches exactly for all three participants being compared.

The screen shot is of the gg-granddaughter Evelyn being compared to her gg-grandmother, Shevy, Evelyn’s g-grandfather Rich and Evelyn’s grandmother Cyndi. 23andme only lets you compare 3 individuals at a time so Robert did not include Evelyn’s mother Shay, who is an exact match with Evelyn.

Paine X

Where Are We?

So what does this mean to genetic genealogy?  It certainly does not mean we should throw the baby out with the bath water.  What it is, is an iceberg warning that there is more lurking beneath the surface.  What and how big?  I can’t tell you.  I simply don’t know.

Here’s what I can tell you.

  • The X chromosome matching can tell you that you do share a common ancestor someplace back in time.
  • The amount of DNA shared is not a reliable predictor of how long ago you shared that ancestor.
  • The amount of DNA shared cannot predict your relationship with your match.  In fact, even a very large match can be many generations removed.
  • The absence of an X match, even with someone closely related whom you should match does not disprove a descendant relationship/common ancestor.
  • The X appears to not recombine at a higher rate than previously thought, the previous expectation being that this would almost never happen.
  • The X, when it does recombine appears to do so in a manner not governed by the 50% rule.  In fact, the 50% rule may not apply at all except as an average in large population studies, but may well be entirely irrelevant or even misleading to the understanding of X chromosome inheritance in genetic genealogy.

The X is still useful to genetic genealogists, just not in the same way that other autosomal data is utilized.  The X is more of an auxiliary chromosome that can provide information in addition to your other matches because of its unique inheritance pattern.

Unfortunately, this discovery leaves us with more questions than answers.  I found it incomprehensible that this phenomenon has never been studied in humans, or in animals, for that matter, at least not that I could find.  What few references I did find indicated that the X seems to recombine with the same frequency as the other autosomes, which we are finding to be untrue.

What is needed is a comprehensive study of hundreds of X transmission events at least 3 generations deep.

As it turns out, we’re not the only ones confused by the behavior of the X chromosome.  Just yesterday, the New York Times had an article about Seeing the X Chromosome in a New Light.  It seems that either one copy of the X, or the other, is disabled cell by cell in the human body.  If you are interested in this aspect of science, it’s a very interesting read.  Indeed, our DNA continues to both amaze and amuse us.

A special thank you to Jim Owston, Matt Dexter, Blaine Bettinger and Robert Paine for sharing their information.

Additional sources:

Polymorphic Variation in Human Meiotic
Recombination (2007)
Vivian G. Cheung
University of Pennsylvania
http://repository.upenn.edu/cgi/viewcontent.cgi?article=1102&context=be_papers

A Fine-Scale Map of Recombination Rates and Hotspots Across the Human Genome, Science October 2005, Myers et al
http://www.sciencemag.org/content/310/5746/321.full.pdf
Supplemental Material
http://www.sciencemag.org/content/suppl/2005/10/11/310.5746.321.DC1

______________________________________________________________

Disclosure

I receive a small contribution when you click on some of the links to vendors in my articles. This does NOT increase the price you pay but helps me to keep the lights on and this informational blog free for everyone. Please click on the links in the articles or to the vendors below if you are purchasing products or DNA testing.

Thank you so much.

DNA Purchases and Free Transfers

Genealogy Services

Genealogy Research

One Chromosome, Two Sides, No Zipper – ICW and the Matrix

ZipperThe questions I’ve received most often since the release of the new Family Finder Matrix from Family Tree DNA has to do with matches.  Specifically, what the “In Common With” feature is telling you versus what the Family Finder “Matrix” is telling you and how to utilize all of this information together.  At the bottom of this confusion is often a fundamental lack of understanding of how matching occurs and what it means in different contexts.

Let’s talk about this, step by step.

The “in common with” function (called triangulation for a few weeks, but now labeled “run common matches” ) shows you every person that you and one of your matches, match with in common.  I’ll be running this option for my matches with cousin David, shown below.

zipper 1

Here’s an example of my matches in common with my cousin, David.

Zipper 2

The Family Finder Matrix takes this information a bit further and shows you whether or not the people involved with this match, match each other as well.

In this case, I happen to know that my cousins Harold, Carl and Dean will match each other on my father’s side, as will my cousin David.  Warren doesn’t have firm genealogy, but from this, we can tell that he is indeed connected to this family group because he matches me, David, Harold and Carl, but not Dean and not Nova.  We have no idea how Nova connects to this line, if she does.  Notice that Nova does not match any of the other people in this group in the matrix below.  That means that my and David’s common ancestor with her is likely not from this same ancestral line shared by Harold, Carl and Dean.

zipper 3

From this point forward, I would drop back to my trusty downloaded full match spreadsheet that I maintain to see if indeed any of these people match me and my known cousins on the same segments.  If so, that confirms a family/ancestor relationship.   On the snipped from my spreadsheet below, you can see that Warren indeed matches both Buster and David and I, but not on the same segments.  Nova didn’t match any grouping on the same segments.  However, Buster and David both match me on the same portion of chromosome 19, so this confirms that we do share a common ancestor.  In this case, we also know, from our genealogy that the common ancestor is Lazarus Estes and wife, Elizabeth Vannoy.  Based on our multiple cousin matches, we can say that Warren is somehow connected to this line, but we can’t say how.

Zipper 4

I’ve had comments like “I have everything I need on my spreadsheet – I can see where all of my matches match me.”  And indeed, you can, but it’s not everything you need.  Here’s why.

Without additional information, you can’t tell, by just looking at your spreadsheet whether two people who match you on the same segment are matching on your Mom or Dad’s side.  For example, above, I know that both David and Buster are from my Dad’s line, but if I didn’t know that, one of them could be from Mom’s line and one could be from Dad’s, and while they are both related to me, on the same chromosome, they would, in that case, not be related to each other.  So, my spreadsheet of matches tells me clearly THAT people match me, and where, but it doesn’t tell me HOW or on which side.  For that, I need additional tools like ICW, the Matrix and plain old genealogy research.

This is the fundamental concept of matching and in a nutshell, why it’s so difficult.

Every Chromosome Has Two Sides

There are two sides to every chromosome, Mom’s side and Dad’s side.  Except nature has played a cruel trick on us and not installed a zipper.  There are no Mom and Dad labels.  There is no dividing that DNA or those matches in half magically, except by determing who they match, and how they do or don’t match each other.

When we match ourselves against our parents, for example, we then know immediately which half of our DNA came from which parent, but if you don’t have any parents available to match against, then you have to use genealogy or cousin matches to figure that out.

I talk about that in the Chromosome Mapping aka Ancestor Mapping article.

I’m going to use spreadsheets as examples here.  It think they are easier to see and understand, plus, I can manipulate them easily to reflect different situations.

Example 1 – The Very Basics of Matching

At each DNA location, or address, you have two alleles, one from each parent.  These alleles can have one of 4 values, or nucleotides, at each location, represented by the abbreviations T, A, C and G, short for Thymine, Adenine, Cytosine and Guanine.  That’s it, you’re done with all the science words now, so keep reading:)

On any given chromosome, from locations 1-20, you have the following DNA, in our example.

From Mom, you received all As and from Dad, all Cs.  You know that because I’m telling you, but remember, the matching software doesn’t know that because there is no zipper in your DNA.  All the software sees are that you have both an A and an C in location 1 and either an A or C is considered a match.

Zipper 5

In fact, this is what the software sees.  Be aware that in this case, AC=CA.

Zipper 6

Easy so far, right?

Example Two – Mom’s Known Cousin and Dad’s Known Cousin

Now you have two cousins, Mary and Myrtle.  You know, from having known them all of your life and sharing lots of Thanksgiving turkey that they are your family and you know clearly which side of your family they descend from.  Both of your cousins, Mary and Myrtle match you at the same locations on this chromosome, from 5-15.

But Mary is your mother’s cousin, and Myrtle is your Dad’s cousin.  So even though they both match you on the same exact chromosome and the same location, they do not match each other.  Well, let’s put it this way, if they also match each other, then you have an entirely different family genetic genealogy problem, called endogamy, and yes, you might be your own grandpa…but I digress.  But we’re going to assume for this discussion that your mother and father are not related to each other and do not share common ancestors.

Zipper 7

Still easy, right?

Example Three – An Unknown Cousin

Next, we have Martha.  You don’t know Martha, and you don’t know how she is related, but she obviously is.  Martha matches you, but she does not match Myrtle at all, and she doesn’t match Mary on enough overlapping chromosomes to be considered a match to her.  You can see their common match here between Mary and Martha in location 5.  In this case, as it turns out, Martha IS a cousin to Mary on Mom’s side, but we can’t tell that from this information because they don’t match in enough common locations to be above the matching threshold.  With this information, you can’t draw any conclusions.  You will have to wait to see who else Martha matches and look on your spreadsheet to see if Martha matches any of your known cousins and you on common segments which would confirm a common ancestor.  Your download spreadsheet will contain much more detailed information because once you match on any segment above the match threshold of about 7.7cM (plus a few other factors,) all matching segments of 1cM or above are downloaded – so you have a lot of information to work with.

But using both the ICW and matrix tools, Mary might cluster with other cousins on Mom’s side which would provide us with clues as to her relationship.  In fact, the first thing I’d do is to run an ICW with Mary and then utilize the Matrix tool to further define those relationships.

Zipper 8

Still not difficult.

Example Four – A “False Match”

Next we have Jeremy who is also a match to you.

Zipper 9

If you look at how Jeremy matches, you can see that he is actually matching on both sides, Mom’s and Dad’s side, but randomly.  Technically, he is a match to you, because he does match one or the other of your nucleotides at each location, A or C, but without a zipper, we have no idea HOW that DNA is divided in you between Mom and Dad.  In other words, the software doesn’t know that Mom was all A and Dad was all C, unless we’ve phased the data against your parents AND the software knows how to utilize that information.

However, if your parents are one of your matches, you can immediately see which side the match falls on, if either.  In this case, Jeremy doesn’t fall on either side because he is simply a circumstantial match, also known as a match my convergence or a false match.  This is also called IBS, or identical by state, as opposed to IBD, identical by descent.  The smaller the segment you show as a match, especially if there is no clustering, the more likely the match is to be IBS instead of the genealogically desirable IBD.

When people ask how someone can match a child but not a parent, this is the answer.  He matches you on 11 segments, circumstantially, but he only matches your parents on 5 and 6 segments, respectively, which often (but not always) puts him under the matching threshold.  Jeremy may also match Mary, depending on the thresholds.

This is also how someone can match in the “in common with” tool, but not be a match to anyone on the match list in the Matrix.  In fact, this is the power of these multiple tools.

This also doesn’t mean this match is entirely useless, because you DO match.  It may simply not be relevant genealogically.  In “The Autosomal Me” series, I’ve utilized very small match segments that in fact very probably ARE reflective of a common population and not of recent ancestry.  In my Native American research, this is exactly what I was looking for.  You may not be able to utilize this information today, but don’t entirely discount it either.  Just set it aside and move on to a more productive match.

Example Five – Common Matches, Different Ancestors

This situation provides clues, but no proof.

Mary and Joyce both match me on Mom’s segments, but they do not match each other.  They don’t match me on the same segments, so this indicates that they are probably from different ancestors in my Mother’s lines.  As more matches appear, the clusters of people and their genealogy will make this more apparent.

In order to determine which ancestors, I’ll need to work on the genealogy of both Mary and Joyce and see who else they also match on the same segments.  Sometimes the secret of the genealogy match is in the genealogy research or descent of your matches.

Zipper 10

Example Six – Clusters of Cousins

In this example, no one matches Dad, so he’s just out for now.  Susie and Mary match mom on the same segment, which proves that the three of these people share a common ancestor.  Mom and Joyce match each other too, but Joyce doesn’t match Mary and Susie, so they won’t cluster together on the matrix.  However, on the ICW tool, all three women, Joyce, Mary and Susie will match me and Mom.

Using the ICW tool if I were to ICW with Mom, you would see this list:

  • Joyce
  • Mary
  • Susie

The question then becomes, are Joyce, Mary and Susie related to each other, or not.  If so, and to me and Mom, then that indicates a common ancestor within the match group, like me, Joyce and Mom.  The second group doesn’t match the first group – me, Mary, Mom and Susie.  Using these tools together, these people clearly fall into two match groups, the green and blue on the spreadsheet below.  But remember, the match routine doesn’t know which side your As and Cs came from.  All it knows is that you match these people.  But based on these groups and my download spreadsheet common segment matches, I can tell that I’m working with two ancestral lines.

Zipper 11

My matrix for these people would look like this:

Zipper 12

My master matching spreadsheet would now look like this.

zipper 13

When we started, all I would have been able to see is that all of these people matched Mom and Dad and I on the same segments. By utilizing the various tools, I was able to sort into groups and eventually, subgroups.

In fact, you can see below that within Mom’s pink group, there is also the smaller cluster of Mary, Susie, me and Mom.

Zipper 14

For Jeremy and Martha, we can’t do any more right now, so I’ve recorded what we do know and set them aside.

Here, you can see the matches sorted by chromosome, start and end segment.

zipper 16

It looks a lot different than where we started, shown below, when all we had was a list of people who matched each other with no additional information.  We’ve added a lot!

zipper 17

In Summary – Creating the Zipper

So, where are we with this?

By utilizing all of the tools at your disposal, including the ICW tool, the Family Finder Matrix, your matching spreadsheet and your genealogical information, you’re in essence creating that zipper that divides half of your DNA into Mom’s side and Dad’s side.  Then into grandma’s and grandpa’s side, and on up the pedigree chart.

Each of these tools can tell you something unique and important.

The ICW tool tells you who matches you and another person, in common.  It doesn’t tell you if they also match each other.  This tool can provide extremely important clustering information.  For example, if I see unknown cousin Martha clustered with a whole group of known Estes descendants, then that’s a pretty good clue about how I’m related to Martha.  If, on the other hand, I find Martha clustered with people from both sides of my family, well, my Mom and Dad just might be related to each other or their ancestors went to or came from the same places.

By utilizing the Matrix tool, I can tell which of my matches are actually matching each other too, so that puts Martha in a much smaller group, or maybe eliminates her from certain groups.

By then utilizing my downloaded match spreadsheet, on which I record every known tidbit of genealogy information, even generalities like, “family from NC” if that’s the best I can get, I can then see where Martha matches me and others on the same segments, and based on the information in the ICW and the Matrix and my genealogy info, I may be able to slot Martha into a family group.  On a great day – I’ll be able to be more specific and tell her which family group – like we were able to do with my newly found cousin, Loujean.

So, I hope you’ve enjoyed learning how to install a chromosome zipper.  Now you can happily go about unzipping all of that genealogy information held in your DNA, that piece by piece, we’re slowing revealing.

zipper final

______________________________________________________________

Disclosure

I receive a small contribution when you click on some of the links to vendors in my articles. This does NOT increase the price you pay but helps me to keep the lights on and this informational blog free for everyone. Please click on the links in the articles or to the vendors below if you are purchasing products or DNA testing.

Thank you so much.

DNA Purchases and Free Transfers

Genealogy Services

Genealogy Research

2013 Family Tree DNA Conference Day 2

ISOGG Meeting

The International Society of Genetic Genealogy always meets at 8 AM on Sunday morning.  I personally think that 8AM meeting should be illegal, but then I generally work till 2 or 3 AM (it’s 1:51 AM now), so 8 is the middle of my night.

Katherine Borges, the Director speaks about current and future activities, and Alice Fairhurst spoke about the many updates to the Y tree that have happened and those coming as well.  It has been a huge challenge to her group to keep things even remotely current and they deserve a huge round of virtual applause from all of us for the Y tree and their efforts.

Bennett opened the second day after the ISOGG meeting.

“The fact that you are here is a testament to citizen science” and that we are pushing or sometimes pulling academia along to where we are.

Bennett told the story of the beginning of Family Tree DNA.  “Fourteen years ago when the hair that I have wasn’t grey,” he began, “I was unemployed and tried to reorganize my wife’s kitchen and she sent me away to do genealogy.”  Smart woman, and thankfully for us, he went.  But he had a roadblock.  He felt there was a possibility that he could use the Y chromosome to solve the roadblock.  Bennett called the author of one of the two papers published at that time, Michael Hammer.  He called Michael Hammer on Sunday morning at his home, but Michael was running out the door to the airport.  He declined Bennett’s request, told him that’s not what universities do, and that he didn’t know of anyplace a Y test could be commercially be done.  Bennett, having run out of persuasive arguments, started mumbling about “us little people providing money for universities.”  Michael said to him, “Someone should start a company to do that because I get phone calls from crazy genealogists like you all the time.”  Let’s just say Bennett was no longer unemployed and the rest, as they say, is history.  With that, Bennett introduced one of our favorite speakers, Dr. Michael Hammer from the Hammer Lab at the University of Arizona.

Bennett day 2 intro

Session 1 – Michael Hammer – Origins of R-M269 Diversity in Europe

Michael has been at all of the conferences.  He says he doesn’t think we’re crazy.  I personally think we’ve confirmed it for him, several times over, so he KNOWS we’re crazy.  But it obviously has rubbed off on him, because today, he had a real shocker for us.

I want to preface this by saying that I was frantically taking notes and photos, and I may have missed something.  He will have his slides posted and they will be available through a link on the GAP page at FTDNA by the end of the week, according to Elliott.

Michael started by saying that he is really exciting opportunity to begin breaking family groups up with SNPs which are coming faster than we can type them.

Michael rolled out the Y tree for R and the new tree looks like a vellum scroll.

Hammer scroll

Today, he is going to focus on the basic branches of the Y tree because the history of R is held there.

The first anatomically modern humans migrated from Africa about 45,000 years ago.

After last glacial maximum 17,000 years ago, there was a significant expansion into Europe.

Neolithic farmers arrived from the near east beginning 10,000 years ago.

Farmers had an advantage over hunter gatherers in terms of population density.  People moved into Northwestern Europe about 5,000 years ago.

What did the various expansions contribute to the population today?

Previous studies indicate that haplogroup R has a Paleolithic origin, but 2 recent studies agree that this haplogroup has a more recent origin in Europe – the Neolithic but disagree about the timing of the expansion.

The first study, Joblin’s study in 2010, argued that geographic diversity is explained by single Near East source via Anaotolia.

It conclude that the Y of Mesololithic hunger-gatherers were nearly replaced by those of incoming farmers.

In the most recent study by Busby in 2012 is the largest study and concludes that there is no diversity in the mapping of R SNP markers so they could not date lineage and expansion.  They did find that most basic structure of R tree did come from the near east.  They looked at P311 as marker for expansion into Europe, wherever it was.  Here is a summary page of Neolithic Europe that includes these studies.

Hammer says that in his opinion, he thought that if P311 is so frequent and widespread in Europe it must have been there a long time.  However, it appears that he and most everyone else, was wrong.

The hypothesis to be tested is if P311 originated prior to the Neolithic wave, it would predict higher diversity it the near east, closer to the origins of agriculture.  If P311 originated after the expansion, would be able to see it migrate across Europe and it would have had to replace an existing population.

Because we now have sequences the DNA of about 40 ancient DNA specimens, Michael turned to the ancient DNA literature.  There were 4 primary locations with skeletal remains.  There were caves in France, Spain, Germany and then there’s Otzi, found in the Alps.

hammer ancient y

All of these remains are between 6000-7000 years old, so prior to the agricultural expansion into Europe.

In France, the study of 22 remains produced, 20 that were G2a and 2 that were I2a.

In Spain, 5 G2a and 1 E1b.

In Germany, 1I G2a and 2 F*.

Otzi is haplogroup G2a2b.

There was absolutely 0, no, haplogroup R of any flavor.

In modern samples, of 172 samples, 94 are R1b.

To evaluate this, he is dropping back to the backbone of haplogroup R.

hammer backbone

This evidence supports a recent spread of haplogroup R lineages in western Europe about 5K years ago.  This also supports evidence that P311 moved into Europe after the Neolithic agricultural transition and nearly displaced the previously existing western European Neolithic Y, which appears to be G2a.

This same pattern does not extrapolate to mitochondrial DNA where there is continuity.

What conferred advantage to these post Neolithic men?  What was that advantage?

Dr. Hammer then grouped the major subgroups of haplogroup R-P3111 and found the following clusters.

  • U106 is clustered in Germany
  • L21 clustered in the British Isles
  • U152 has an Alps epicenter

hammer post neolithic epicenters

This suggests multiple centers of re-expansion for subgroups of haplogroup R, a stepwise process leading to different pockets of subhaplogroup density.

Archaeological studies produce patterns similar to the hap epicenters.

What kind of model is going on for this expansion?

Ancestral origin of haplogroup R is in the near east, with U106, P312 and L21 which are then found in 3 European locations.

This research also suggests thatG2a is the Neolithic version of R1b – it was the most commonly found haplogroup before the R invasion.

To make things even more interesting, the base tree that includes R has also been shifted, dramatically.

Haplogroup K has been significantly revised and is the parent of haplogroups P, R and Q.

It has been broken into 4 major branches from several individual lineages – widely shifted clades.

hammer hap k

Haps R and Q are the only groups that are not restricted to Oceana and Southeast Asia.

Rapid splitting of lineages in Southeast Asia to P, R and Q, the last two of which then appear in western Europe.

hammer r and q in europe

R then, populated Europe in the last 4000 years.

How did these Asians get to Europe and why?

Asian R1b overtook Neolithic G2a about 4000 years ago in Europe which means that R1b, after migrating from Africa, went to Asia as haplogroup K and then divided into P, Q and R before R and Q returned westward and entered Europe.  If you are shaking your head right about now and saying “huh?”…so were we.

Hammer hap r dist

Here is Dr. Hammer’s revised map of haplogroup dispersion.

hammer haplogroup dispersion map

Moving away from the base tree and looking at more recent SNPs, Dr. Hammer started talking about some of the findings from the advanced SNP testing done through the Nat Geo project and some of what it looks like and what it is telling us.

For example, the R1bs of the British Isles.

There are many clades under L 21.  For example, there is something going on in Scotland with one particular SNP (CTS11722?) as it comprises one third of the population in Scotland, but very rare in Ireland, England and Wales.

New Geno 2.0 SNP data is being utilized to learn more about these downstream SNPs and what they had to say about the populations in certain geographies.

For example, there are 32 new SNPs under M222 which will help at a genealogical level.

These SNPs must have arisen in the past couple thousand years.

Michael wants to work with people who have significant numbers of individuals who can’t be broken out with STRs any further and would like to test the group to break down further with SNPs.  The Big Y is one option but so is Nat Geo and traditional SNP testing, depending on the circumstance.

G2a is currently 4-5% of the population in Europe today and R is more than 40%.

Therefore, P312 split in western Eurasia and very rapidly came to dominate Europe

Session 2 – Dr. Marja Pirttivaara – Bridging Social Media and DNA

Dr. Pirttivaara has her PhD in Physics and is passionate about genetic genealogy, history and maps.  She is an administrator for DNA projects related to Finland and haplogroup N1c1, found in Finland, of course.

marja

Finland has the population of Minnesota and is the size of New Mexico.

There are 3750 Finland project members and of them 614 are haplogroup N1c1.

Combining the N1c1 and the Uralic map, we find a correlation between the distribution of the two.

Turku, the old capital, was full or foreigners, in Medieval times which is today reflected in the far reaching DNA matches to Finnish people.

Some of the interest in Finland’s DNA comes from migration which occurred to the United States.

Facebook and other social media has changed the rules of communication and allows the people from wide geographies to collaborate.  The administrator’s role has also changed on social media as opposed to just a FTDNA project admin.  Now, the administrator becomes a negotiator and a moderator as well as the DNA “expert.”

Marja has done an excellent job of motivating her project members.  They are very active within the project but also on Facebook, comparing notes, posting historical information and more.

Session 3 – Jason Wang – Engineering Roadmap and IT Update

Jason is the Chief Technology Officer at Family Tree DNA and recently joined with the Arpeggi merger and has a MS in Computer Engineering.

Regarding the Gene by Gene/FTDNA partnership, “The sum of the parts is greater than the whole.”  He notes that they have added people since last year in addition to the Arpeggi acquisition.

Jason introduced Elliott Greenspan, who, to most of us, needed no introduction at all.

Elliott began manually scoring mitochondrial DNA tests at age 15.  He joined FTDNA in 2006 officially.

Year in review and What’s Coming

4 times the data processed in the past year.

Uploads run 10 times faster.  With 23andMe and Ancestry autosomal uploads, processing will start in about 5 minutes, and matches will start then.

FTDNA reinvented Family Finder with the goal of making the user experience easier and more modern.   They added photos, profiles and the new comparison bars along with an advanced section and added push to chromosome browser.

Focus on users uploading the family tree.  Tools don’t matter if the data isn’t there.  In order to utilize the genealogy aspect, the genealogy info needs to be there.   Will be enhancing the GEDCOM viewer.  New GEDCOMs replace old GEDCOMs so as you update yours, upload it again.

They are now adding a SNP request form so that you can request a SNP not currently available.  This is not to be confused with ordering an existing SNP.

They currently utilize build 14 for mitochondrial DNA.  They are skipping build 15 entirely and moving forward with 16.

They added steps to the full sequence matches so that you can see your step-wise mutations and decide whether and if you are related in a genealogical timeframe.

New Y tree will be released shortly as a result of the Geno 2.0 testing.  Some of the SNPs have mutated as much as 7 times, and what does that mean in terms of the tree and in terms of genealogical usefulness.  This tree has taken much longer to produce than they expected due to these types of issues which had to be revised individually.

New 2014 tree has 6200 SNPS and 1000 branches.

  • Commitment to take genetic genealogy to the next level
  • Y draft tree
  • Constant updates to official tree
  • Commitment to accurate science

If a single sample comes back as positive for a SNP, they will put it on the tree and will constantly update this.

If 3 or 4 people have the same SNP that are not related it will go directly to the tree.  This is the reason for the new SNP request form.

Part of the reason that the tree has taken so long is that not every SNP is public and it has been a huge problem.

When they find a new SNP, where does it go on the tree?  When one SNP is found or a SNP fails, they have run over 6000 individual SNPs on Nat Geo samples to vet to verify the accuracy of the placement.  For example, if a new SNP is found in a particular location, or one is found not to be equivalent that was believe to be so previously, they will then test other samples to see where the SNP actually belongs.

X Matching

Matching differential is huge in early testing.  One child may inherit as little as 20% of the X and another 90%.  Some first cousins carry none.

X matching will be an advanced feature and will have their own chromosome browser.

End of the year – January 1.  Happy New Year!!!

Population Finder

It’s definitely in need of an upgrade and have assigned one person full time to this product.

There are a few contention points that can be explained through standard history.

It’s going to get a new look as well and will be easily upgradeable in the future.

They cannot utilize the National Geographic data because it’s private to Nat Geo.

Bennett – “Committed to an engineering team of any size it takes to get it done.  New things will be rolling out in first and second quarter of next year.”  Then Bennett kind of sighed and said “I can’t believe I just said that.”

Session 4 – Dr. Connie Bormans – Laboratory Update

The Gene by Gene lab, which of course processes all of the FTDNA samples is now a regulated lab which allows them to offer certain regulated medical tests.

  • CLIA
  • CAP
  • AABB
  • NYSDOH

Between these various accreditations, they are inspected and accredited once yearly.

Working to decrease turn-around time.

SNP request pipeline is an online form and is in place to request a new SNP be added to their testing menu.

Raised the bar for all of their tests even though genetic genealogy isn’t medical testing because it’s good for customers and increases quality and throughput.

New customer support software and new procedures to triage customer requests.

Implement new scoring software that can score twice as many tests in half the time.  This decreases turn-around time to the customer as well.

New projects include improved method of mtDNA analysis, new lab techniques and equipment and there are also new products in development.

Ancient DNA (meaning DNA from deceased people) is being considered as an offering if there is enough demand.

Session 5 – Maurice Gleeson – Back to Our Past, Ireland

Maurice Gleeson coordinated a world class genealogy event in Dublin, Ireland Oct. 18-20, 2013.  Family Tree DNA and ISOGG volunteers attended to educate attendees about genetic genealogy and DNA. It was a great success and the DNA kits from the conference were checked in last week and are in process now.  Hopefully this will help people with Irish ancestry.

12% of the Americans have Irish ancestry, but a show of hands here was nearly 100% – so maybe Irish descendants carry the crazy genealogist gene!

They developed a website titled Genetic Genealogy Ireland 2013.  Their target audience was twofold, genetic genealogy in general and also the Irish people.  They posted things periodically to keep people interested.  They also created a Facebook page.  They announced free (sponsored) DNA tests and the traffic increased a great deal.  Today ISOGG has a free DNA wiki page too.  They also had a prize draw sponsored by the Ireland DNA and mtdna projects. Maurice said that the sessions and the booth proximity were quite symbiotic because when y ou came out of the DNA session, the booth was right there.

2000-5000 people passed by the booth

500 people in the booth

Sold 99 kits – 119 tests

45 took Y 37 marker tests

56 FF, 20 male, 36 female

18 mito tests

They passed out a lot of educational material the first two days.  It appeared that the attendees were thinking about things and they came back the last day which is when half of the kits were sold, literally up until they threatened to turn the lights out on them.

They have uploaded all of the lectures to a YouTube channel and they have had over 2000 views.  Of all of the presentation, which looked to be a list of maybe 10-15, the autosomal DNA lecture has received 25% of the total hits for all of the videos.

This is a wonderful resource, so be sure to watch these videos and publicize them in your projects.

Session 6 – Brad Larkin – Introducing Surname DNA Journal

Brad Larkin is the FTDNA video link to the “how to appropriately” scrape for a DNA test.  That’s his minute or two of fame!  I knew he looked familiar.

Brad began a peer reviewed genetic genealogy journal in order to help people get their project stories published.  It’s free, open access, web based and the author retains the copyright..  www.surnamedna.com

Conceived in 2012, the first article was published in January 2013.  Three papers published to date.

Encourage administrators to write and publish their research.  This helps the publication withstand the test of time.

Most other journals are not free, except for JOGG which is now inactive.  Author fees typically are $1320 (PLOS) to $5000 (Nature) and some also have subscription or reader fees.

Peer review is important.  It is a critical review, a keen eye and an encouraging tone.  This insures that the information is evidence based, correct and replicable.

Session 7 – mtdna Roundtable – Roberta Estes and Marie Rundquist

This roundtable was a much smaller group than yesterday’s Y DNA and SNP session, but much more productive for the attendees since we could give individual attention to each person.  We discussed how to effectively use mtdna results and what they really mean.  And you just never know what you’re going to discover.  Marie was using one of her ancestors whose mtDNA was not the haplogroup expected and when she mentioned the name, I realized that Marie and I share yet another ancestral line.  WooHoo!!

Q&A

FTDNA kits can now be tested for the Nat Geo test without having to submit a new sample.

After the new Y tree is defined, FTDNA will offer another version of the Deep Clade test.

Illumina chip, most of the time, does not cover STRs because it measures DNA in very small fragments.  As they work with the Big Y chip, if the STRs are there, then they will be reported.

80% of FTDNA orders are from the US.

Microalleles from the Houston lab are being added to results as produced, but they do not have the data from the older tests at the University of Arizona.

Holiday sale starts now, runs through December 31 and includes a restaurant.com $100 gift card for anyone who purchases any test or combination of tests that includes Family Finder.

That’s it folks.  We took a few more photos with our friends and left looking forward to next year’s conference.  Below, left to right in rear, Marja Pirttivaara, Marie Rundquist and David Pike.  Front row, left to right, me and Bennett Greenspan.

Goodbyes

See y’all next year!!!

______________________________________________________________

Disclosure

I receive a small contribution when you click on some of the links to vendors in my articles. This does NOT increase the price you pay but helps me to keep the lights on and this informational blog free for everyone. Please click on the links in the articles or to the vendors below if you are purchasing products or DNA testing.

Thank you so much.

DNA Purchases and Free Transfers

Genealogy Services

Genealogy Research

2013 Family Tree DNA Conference Day 1

This article is probably less polished than my normal articles.  I’d like to get this information out and to you sooner rather than later, and I’m still on the road the rest of this week with little time to write.  So you’re getting a spruced up version of my notes.  There are some articles here I’d like to write about more indepth later, after I’m back at home and have recovered a bit.

Max Blankfield and Bennett Greenspan, founders, opened the conference on the first day as they always do.  Max began with a bit of a story.

13 years ago Bennett started on a quest….

Indeed he did, and later, Bennett will be relating his own story of that journey.

Someone mentioned to Max that this must be a tough time in this industry.  Max thought about this and said, really, not.  Competition validates what you are doing.

For competition it’s just a business opportunity – it was not and is not approached with the passion and commitment that Family Tree DNA has and has always had.

He said this has been their best year ever and great things in the pipeline.

One of the big moves is that Arpeggi merged into Family Tree DNA.

10th Anniversary Pioneer Awards

Quite unexpectedly, Max noted and thanked the early adopters and pioneers, some of which who are gone now but remain with us in spirit.

Max and Bennett recognized the administrators who have been with Family Tree DNA for more than 10 years.  The list included about 20 or so early adopters.  They provided plaques for us and many of us took a photo with Max as the plaques were handed out.

Plaque Max and Me 2013

I am always impressed by the personal humility and gratitude of Max and Bennett, both, to their administrators.  A good part of their success is attributed, I’m sure, to their personal commitment not only to this industry, but to the individual people involved.  When Max noted the admins who were leaders and are no longer with us, he could barely speak.  There were a lot of teary eyes in the room, because they were friends to all of us and we all have good memories.

Thank you, Max and Bennett.

The second day, we took a group photo of all of the recipients along with Max and Bennett.

With that, it was Bennett’s turn for a few remarks.

Bennett remarks

Bennett says that having their own lab provides a wonderful environment and allows them to benchmark and respond to an ever changing business environment.

Today, they are a College of American Pathologists certified lab and tomorrow, we will find out more about what is coming.  Tomorrow, David Mittleman will speak about next generation sequencing.

The handout booklet includes the information that Family Tree DNA now includes over 656,898 records in more than 8,700 group projects. These projects are all managed by volunteer administrators, which in and of itself, is a rather daunting number and amount of volunteer crowd-sourcing.

Session 1 – Amy McGuire, PhD, JD – Am I My Brother’s Keeper?

Dr. McGuire went to college for a very long time.  Her list of degrees would take a page or so.  She is the Director of the Center for Medical Ethics and Health Policy at Baylor College of Medicine.

Thirteen years ago, Amy’s husband was sitting next to Bennett’s wife on an airplane and she gave him a business card.  Then two months ago, Amy wound up sitting next to Max on another airplane.  It’s a very small world.

I will tell you that Amy said that her job is asking the difficult questions, not providing the answers.  You’ll see from what follows that she is quite good at that.

How is genetic genealogy different from clinical genetics in terms of ethics and privacy?  How responsible are we to other family members who share our DNA?

What obligations do we have to relatives in all areas of genetics – both clinical, direct to consumer that related to medical information and then for genetic genealogy.

She referenced the article below, which I blogged about here.  There was unfortunately, a lot of fallout in the media.

Identifying Personal Genomes by Surname Inference – Science magazine in January 2013.  I blogged about this at the time.

She spoke a bit about the history of this issue.

Mcguire

In 2004, a paper was published that stated that it took only 30 to 80 specifically selected SNPS to identify a person.

2008 – Can you identify an individual from pooled or aggregated or DNA?  This is relevant to situations like 911 where the DNA of multiple individuals has been mixed together.  Can you identify individuals from that brew?

2005 – 15 year old boy identifies his biological father who was a sperm donor.  Is this a good thing or a bad thing?  Some feel that it’s unethical and an invasion of the privacy of the father.  But others feel that if the donor is concerned about that, they shouldn’t be selling their sperm.

Today, for children conceived from sperm donors, there are now websites available to identify half-siblings.

The movement today is towards making sure that people are informed that their anonymity may not be able to be preserved.  DNA is the ultimate identifier.

Genetic Privacy – individual perspectives vary widely.  Some individuals are quite concerned and some are not the least bit concerned.

Some of the concern is based in the eugenics movement stemming from the forced sterilization (against their will) of more than 60,000 Americans beginning in 1907.  These people were considered to be of no value or injurious to the general population – meaning those institutionalized for mental illness or in prison.

1927 – Buck vs Bell – The Supreme court upheld forced sterilization of a woman who was the third generation institutionalized female for retardation.  “Three generations of imbeciles is enough.”  I must say, the question this leaves me with is how institutionalized retarded women got pregnant in what was supposed to be a “protected” environment.

Hitler, of course, followed and we all know about the Holocaust.

I will also note here that in my experience, concern is not rooted in Eugenics, but she deals more with medical testing and I deal with genetic genealogy.

The issues of privacy and informed consent have become more important because the technology has improved dramatically and the prices have fallen exponentially.

In 2012, the Nonopore OSB Sequencer was introduced that can sequence an entire genome for about $1000.

Originally, DNA data was provided in open access data bases and was anonymized by removing names.  The data base from which the 2013 individuals were identified removed names, but included other identifying information including ages and where the individuals lived.  Therefore, using Y-STRs, you could identify these families just like an adoptee utilizes data bases like Y-Search to find their biological father.

Today, research data bases have moved to controlled access, meaning other researchers must apply to have access so that their motivations and purposes can be evaluated.

In a recent medical study, a group of people in a research study were informed and educated about the utility of public data bases and why they are needed versus the tradeoffs, and then they were given a release form providing various options.  53% wanted their info in public domain, 33 in restricted access data bases and 13% wanted no data release.  She notes that these were highly motivated people enrolled in a clinical study.  Other groups such as Native Americans are much more skeptical.

People who did not release their data were concerned with uncertainly of what might occur in the future.

People want to be respected as a research participant.  Most people said they would participate if they were simply asked.  So often it’s less about the data and more about how they are treated.

I would concur with Dr. McGuire on this.  I know several people who refused to participate in a research study because their results would not be returned to them personally.  All they wanted was information and to be treated respectfully.

What  the new genetic privacy issues are really all about is whether or not you are releasing data not just about yourself, but about your family as well.  What rights or issues do the other family members have relative to your DNA?

Jim Watson, one of the discoverers of DNA, wanted to release his data publicly…except for his inherited Alzheimer’s status.  It was redacted, but, you can infer the “answer” from surrounding (flanking regions) DNA.  He has two children.  How does this affect his children?  Should his children sign a consent and release before their father’s genome is published, since part of it is their sequence as well? The academic community was concerned and did not publish this information.  Jim Watson published his own.

There is no concrete policy about this within the academic community.

Dr McGuire then referenced the book, “The Immortal Life of Henrietta Lacks”.  Henrietta Lacks was a poor African-American woman with ovarian cancer.  At that time, in the 1950s, her cancer was considered “waste” and no release was needed as waste could be utilized for research.  She was never informed or released anything, but then they were following the protocols of the time.  From her cell line, the HeLa cell line, the first immortal cell line was created which ultimately generated a great deal of revenue for research institutes. The family however, remained impoverished.  The genome was eventually fully sequenced and published.  Henrietta Lacks granddaughter said that this was private family information and should never have been published without permission, even though all of the institutions followed all of the protocols in place.

So, aside from the original ethics issues stemming from the 1950s – who is relevant family?  And how does or should this affect policy?

How does this affect genetic genealogy?  Should the rules be different for genetic genealogy, assuming there are (will be) standard policies in place for medical genetics?  Should you have to talk to family members before anyone DNA tests?  Is genetic information different than other types of information?

Should biological relatives be consulted before someone participates in a medical research study as opposed to genetic genealogy?  How about when the original tester dies?  Who has what rights and interests?  What about the unborn?  What about when people need DNA sequencing due to cancer or another immediate and severe health condition which have hereditary components.  Whose rights trump whose?

Today, the data protections are primarily via data base access restrictions.

Dr. Mcguire feels the way to protect people is through laws like GINA (Genomic Information Nondiscrimination Act) which protects people from discrimination, but does not reach to all industries like life insurance.

Is this different than people posting photos of family members or other private information without permission on public sites?

While much of Dr. McGuire’s focus in on medical testing and ethics, the topic surely is applicable to genetic genealogy as well and will eventually spill over.  However, I shudder to think that someone would have to get permission from their relatives before they can have a Y-line DNA test.  Yes, there is information that becomes available from these tests, including haplogroup information which has the potential to make people uncomfortable if they expected a different ethnicity than what they receive or an undocumented adoption is involved.  However, doesn’t the DNA carrier have the right to know, and does their right to know what is in their body override the concerns about relatives who should (but might not) share the same haplogroup and paternal line information?

And as one person submitted as a question at the end of the session, isn’t that cat already out of the bag?

Session 2 – Dr. Miguel Vilar – Geno 2.0 Update and 2014 Tree

Dr. Vilar is the Science manager for the National Geographic’s Genographic Project.

“The greatest book written is inside of us.”

Miguel is a molecular anthropologist and science writer at the University of Pennsylvania. He has a special interest in Puerto Rico which has 60% Native mitochondrial DNA – the highest percentage of Native American DNA of any Caribbean Island.

The Genographic project has 3 parts, the indigenous population testing, the Legacy project which provides grants back to the indigenous community and the public participation portion which is the part where we purchase kits and test.

Below, Dr. Vilars discussed the Legacy portion of the project.

Villars

The indigenous population aspect focuses both on modern indigenous and ancient DNA as well.  This information, cumulatively, is used to reconstruct human population migratory routes.

These include 72,000 samples collected 2005-2012 in 12 research centers on 6 continents.  Many of these are working with indigenous samples, including Africa and Australia.

42 academic manuscripts and >80 conference presentations have come forth from the project.  More are in the pipeline.

Most recently, a Science paper was published about the spread of mtDNA throughout Europe across the past 5000 years.  More than 360 ancient samples were collected across several different time periods.  There seems to be a divide in the record about 7000 years ago when several disappear and some of the more well known haplogroups today appear on the scene.

Nat Geo has funded 7 new scientific grants since the Geno 2.0 portion began for autosomal including locations in Australia, Puerto Rico and others.

Public participants – Geno 1.0 went over 500,000 participants, Geno 2.0 has over 80,000 participants to date.

Dr. Vilar mentioned that between 2008 and today, the Y tree has grown exponentially.  That’s for sure.  “We are reshaping the tree in an enormous way.”  What was once believed to very homogenous, but in reality, as it drills down to the tips, it’s very heterogenous – a great deal of diversity.

As anyone who works with this information on a daily basis knows, that is probably the understatement of the year.  The Geno 2.0 project, the Walk the Y along with various other private labs are discovering new SNPs more rapidly than they can be placed on the Y tree.  Unfortunately, this has led to multiple trees, none of which are either “official” or “up to date.”  This isn’t meant as a criticism, but more a testimony of just how fast this part of the field is emerging.  I’m hopeful that we will see a tree in 2014, even if it is an interim tree. In fact, Dr. Vilars referred to the 2014 tree.

Next week, the Nat Geo team goes to Ireland and will be looking for the first migrants and settlers in Ireland – both for Y DNA and mitochondrial DNA.  Dr. Vilars says “something happened” about 4000 years ago that changed the frequency of the various haplogroups found in the population.  This “something” is not well understood today but he feels it may be a cultural movement of some sort and is still being studied.

Nat Geo is also focused on haplogroup Q in regions from the Arctic to South America.  Q-M3 has also been found in the Caribbean for the first time, marking a migration up the chain of islands from Mexico and South America within the past 5,000 years.  Papers are coming within the next year about this.

They anticipate that interest will double within the next year.  They expect that based on recent discoveries, the 2015 Y tree will be much larger yet.  Dr. Michael Hammer will speak tomorrow on the Y tree.

Nat Geo will introduce a “new chip by next year.”  The new Ireland data should be available on the National Geographic website within a couple of weeks.

They are also in the process up updating the website with new heat maps and stories.

Session 3 – Matt Dexter – Autosomal Analyses

Matt is a surname administrator, an adoptee and has a BS in Computer Science.  Matt is a relatively new admin, as these things go, beginning his adoptive search in 2008.

Matt found out as a child that he was adopted through a family arrangement.  He contacted his birth mother as an adult.  She told him who his father was who subsequently took a paternity test which disclosed that the man believed to be his biological father, was not.  Unfortunately, his ‘father’ had been very excited to be contacted by Matt, and then, of course, was very disappointed to discover that Matt was not his biological child.

Matt asked his mother about this, and she indicated that yes, “there was another guy, but I told him that the other guy was your father.’  With that, Matt began the search for his biological father.

In order to narrow the candidates, his mother agreed to test, so by process of elimination, Matt now knows which side of his family his autosomal results are from.

Matt covers how autosomal DNA works.

This search has led Matt to an interest in how DNA is passed in general, and specifically from grandparents to grandchildren.

One advantage he has is that he has five children whose DNA he can then compare to his wife and three of their grandparents, inferring of course, the 4th grandparent by process of elimination.  While his children’s DNA doesn’t help him identify his father, it did give him a lot of data to work with to learn about how to use and interpret autosomal DNA.    Here, Matt is discussing his children’s inheritance.

Matt dexter

Session 4 – Jeffrey Mark Paul – Differences in Autosomal DNA Characteristics between Jewish and Non-Jewish Populations and Implications for the Family Finder Test

Dr.Jeffrey Paul, who has a doctorate in Public Health from John Hopkins, noticed that his and his wife’s Family Finder results were quite different, and he wanted to know why.  Why did he, Jewish, have so many more?

There are 84 participants in the Jewish project that he used for the autosomal comparison.

What factors make Ashkenazi Jews endogamous.  The Ashkenazi represent 80%of world’sJewish population.

Arranged marriages based on family backgrounds.  Rabbinical lineages are highly esteemed and they became very inbred with cousins marrying cousins for generations.

Cultural and legal restrictions restrict Jewish movements and who they could marry.

Overprediction, meaning people being listed as being cousins more closely than they are, is one of the problems resulting from the endogamous population issue.  Some labs “correct” for this issue, but the actual accuracy of the correction is unknown.

Jeffrey compared his FTDNA Family Finder test with the expected results for known relatives and he finds the results linear – meaning that the results line up with the expected match percentages for unrelated relatives.  This means that FTDNA’s Jewish “correction” seems to be working quite well.  Of course, they do have a great family group with which to calibrate their product.  Bennett’s family is Jewish.

Jeffrey has downloaded the results of group participants into MSAccess and generates queries to test the hypothesis that Jewish participants have more matches than a non-Jewish control group.

The Jewish group had approximately a total of 7% total non-Ashkenazi Jewish in their Population Finder results, meaning European and Middle Eastern Jewish.  The non-Jewish group had almost exactly the opposite results.

  • Jewish people have from 1500-2100 matches.
  • Interfaith 700-1100 (Jewish and non)
  • NonJewish 60-616

Jewish people match almost 33% of the other Jewish people in the project.  Jewish people match both Jewish and Interfaith families.  NonJewish families match NonJewish and interfaith matches.

Jeffrey mentioned that many people have Jewish ancestry that they are unaware of.

This session was quite interesting.  This study while conducted on the Jewish population, still applies to other endogamous populations that are heavily intermarried.  One of the differences between Jewish populations and other groups, such as Amish, Brethren, Mennonite and Native American groups is that there are many Jewish populations that are still unmixed, where most of these other groups are currently intermixed, although of course there are some exceptions.  Furthermore, the Jewish community has been endogamous longer than some of the other groups.  Between both of those factors, length of endogamy and current mixture level, the Jewish population is probably much more highly admixed than any other group that could be readily studied.

Due to this constant redistribution of Jewish DNA within the same population, many Jewish people have a very high percentage of distant cousin relationships.

For non-Jewish people, if you are finding match number is the endogamous range, and a very high number of distant cousins, proportionally, you might want to consider the possibility that some of your ancestors descend from an endogamous population.

Unfortunately, the photo of Dr. Paul was unuseable.  I knew I should have taken my “real camera.”

Session 5 – Finding Your Indian Prince(ss) Without Having to Kiss Too Many Frogs

This was my session, and I’ll write about it later.

Someone did get a photo, which I’ve lifted from Jennifer Zinck’s great blog (thank you Jennifer), Ancestor Central.  In fact, you can see her writeup for Day 1 here and she is probably writing Day 2’s article as I type this, so watch for it too.

 Estes Indian Princess photo

Session 6 – Roundtable – Y-SNPs, hosted by Roberta Estes, Rebekah Canada and Marie Rundquist

At the end of the day, after the breakout sessions, roundtable discussions were held.  There were several topics.  Rebekah Canada, Marie Rundquist and I together “hostessed” the Y DNA and SNP discussion group, which was quite well attended.  We had a wide range of expertise in the group and answered many questions.  One really good aspect of these types of arrangements is that they are really set up for the participants to interact as well.  In our group, for example, we got the question about what is a public versus a private SNP, and Terry Barton who was attending the session answered the question by telling about his “private” Barton SNPs which are no longer considered private because they have now been found in three other surname individuals/groups.  This means they are listed on the “tree.”  So sometimes public and private can simply be a matter of timing and discovery.

FTDNA roundtable 2013

Here’s Bennett leading another roundtable discussion.

roundtable bennett

Session 7 – Dr. David Mittleman

Mittleman

Dr. Mittleman has a PhD in genetics, is a professor as well as an entrepreneur.  He was one of the partners in Arpeggi and came along to Gene by Gene with the acquisition.  He seems to be the perfect mixture of techie geek, scientist and businessman.

He began his session by talking a bit about the history of DNA sequencing, next generation sequencing and a discussion about the expectation of privacy and how that has changed in the past few years with Google which was launched in 2006 and Facebook in 2010.

David also discussed how the prices have dropped exponentially in the past few years based on the increase in the sophistication of technology.  Today, Y SNPs individually cost $39 to test, but for $199 at Nat Geo you can test 12,000 Y SNPs.

The WTY test, now discontinued tsted about 300,000 SNPs on the Y.  It cost between $950 (if you were willing to make your results public) and $1500 (if the results were private,)

Today, the Y chromosome can be sequenced on the Illumina chip which is the same chip that Nat Geo used and that the autosomal testing uses as well.  Family Tree DNA announced their new Big Y product that will sequence 10 million positions and 25,000 known SNPs for an introductory sale price of $495 for existing customers.  This is not a test that a new customer would ever order.  The test will normally cost $695.

Candid Shots

Tech row in the back of the room – Elliott Greenspan at left seated at the table.

tech row

ISOGG Reception

The ISOGG reception is one of my favorite parts of the conference because everyone comes together, can sit in groups and chat, and the “arrival” adrenaline has worn off a bit.  We tend to strategize, share success stories, help each other with sticky problems and otherwise have a great time.  We all bring food or drink and sometimes pitch in to rent the room.  We also spill out into the hallways where our impromptu “meetings” generally happen.  And we do terribly, terribly geeky things like passing our iPhones around with our chromosome painting for everyone to see.  Do we know how to party or what???

Here’s Linda Magellan working hard during the reception.  I think she’s ordering the Big Y actually.  We had several orders placed by admins during the conference.

magellan.jpg

We stayed up way too late visiting and the ISOGG meeting starts at 8 AM tomorrow!

______________________________________________________________

Disclosure

I receive a small contribution when you click on some of the links to vendors in my articles. This does NOT increase the price you pay but helps me to keep the lights on and this informational blog free for everyone. Please click on the links in the articles or to the vendors below if you are purchasing products or DNA testing.

Thank you so much.

DNA Purchases and Free Transfers

Genealogy Services

Genealogy Research

Why Are My Predicted Cousin Relationships Wrong?

The answer is, because inherited DNA segments do not always follow the 50% rule.  I guess maybe no one told them???

Many times, when we receive our autosomal DNA results, we wonder why predicted relationships, particularly distant ones, aren’t accurate.  Sometimes people estimated to be 3rd cousins, or maybe 2nd to 4th cousins, turn out to be 6th cousins, for example.  This happens because genetic predictions must use math models and averages, but our actual DNA doesn’t follow those rules.

Dr. Steve Mount is an Associate Professor of Cell Biology and Molecular Genetics at the University of Maryland.  In February 2011, he wrote an article about his experience submitting his DNA to 23andMe and his experiences matching his cousins.  More specifically, he became interested in one particular segment of DNA trackable to a specific ancestor.

He shares these insights.

  • Distant relatives (4th cousins and beyond) often share no genetic material at all.
  • It is possible to share a segment with very distant relatives.
  • Sometimes, more distant relationships are more likely.
  • Most of your relatives may be descended from a small fraction of your ancestors.

In genetic genealogy, people who deal with autosomal DNA spend a lot of time trying to figure out which segments are IBD vs IBS – Identical by Descent versus Identical by State.  In laymen’s terms, identical by descent means that you do in fact share a common ancestor in a timeframe in which you might be able to identify them.  Identical by state really implies, technically, that you just happen to have the same DNA due to spontaneous mutations, not because you share a common ancestor.  In reality, it’s taken to mean that you descend from a common population –  in other words, you do share a common ancestor but the segment is so small that it implies that the ancestor is so far back in time that you can’t possibly identify them.  Some people call these matches “false positives” which really isn’t accurate.

Far from being useless, these small segments are very useful in identifying different ethnic populations found in your ancestral tree and can, often in conjunction with larger segments also be useful in identifying ancestral lines.  Discounting small segments, especially if you share a common ancestor, is akin to throwing away pennies because they aren’t as useful and are more difficult to manage than quarters or dollars.  Furthermore, small segments may be our only way of identifying ancestors that are many generations back in our tree.  After all, we inherited all of our DNA from some ancestor, no matter how small the segments are today.

Because we have no better rule of thumb (or statistical model), we utilize the theory that one inherits about 50% of the DNA of each ancestor in each generation.  We know this is absolutely true between Mom and Dad, but you don’t receive exactly 25% of each of your grandparents’ DNA.  However, the mixture of what and how much of your grandparents’ DNA you do inherit is approximately 25% and appears to be random, like a card shuffle.  If it’s not random, we don’t know what the rules of inheritance are.

In the past few years, as we’ve come to work more closely with autosomal results, we have learned that while the rules of thumb about how much DNA you inherit from specific ancestors are useful, they are not absolute.  In other words, it’s certainly possible to inherit a very large chunk of DNA from a very specific distant ancestor when the rules of probability and the rule of thumb of 50% would indicate that you should not.

This is shown clearly in the Vannoy project where 5 cousins who descend from Elijah Vannoy born in 1786 (5 generations removed) share a very significant portion of chromosome 15.  These people are all 5 generations or more distantly related from the common ancestor, (approximate 4th cousins) and should share less than 1% of their DNA in total, and certainly no large, unbroken segments.   As you can see, below, that’s not the case.  We don’t know why or how some DNA clumps together like this and is transmitted in complete (or nearly complete) segments, but they obviously are.  We often call these “sticky segments” for lack of a better term.

cousin 1

I downloaded this information into a spreadsheet where I can sort it by chromosome.  Below you can see the segments on chromosome 15 where these cousins match me.  Note that Buster is also a cousin from a second ancestor.

cousin 2

Given these incidental discoveries and the very large amount of DNA I share with these cousins on chromosome 15, I was quite interested in Dr. Mount’s following commentary:

“The probability that fourth cousins share at least one IBD [identical by descent] segment is 77%, and the expected length of this segment is 10 cM.” Now consider the next step. There is a 50% chance that that one shared segment will not be transmitted at all, but a 90% chance that if it is transmitted it will be just as big as it was (the same 10 cM.). What this means for genealogy on 23andMe is that for two people sharing one segment identical by descent there is no way to reliably estimate how far back the common ancestor was. Furthermore, no improvement in software can possibly change that, because the limitation is imposed by the genetics itself.”

Well, there goes the 50% rule – flying right out the window.  The 50% rule of thumb says that in any given transmission, there is a 50% chance that it will be transmitted (so good so far) and that if it is transmitted, roughly half of it would be transmitted, or approximately 5 cM..  That’s obviously not what is happening.

Dr. Mount goes on to say that, “No matter how far back you go, every nucleotide of one’s genome is derived from some ancestor, and even going back 20 generations, the chance that the bit which has been inherited is part of a block 5 cM. or greater is still appreciable. In fact, even for 19th cousins, there is a real chance (13%) that any segment of DNA they have inherited in common will be 5 cM. or greater. Of course, as mentioned above, there is very little chance that two 19th cousins will share any IBD segments at all, but this is offset if one has many 19th cousins, which is often the case.”

5cM is the line-in-the-sand cutoff number many genetic genealogists use to determine whether DNA segments are IBD or IBS.

What this really means is that the more distant, or 19th, cousins that you have, the greater the chance that one or more of them will test and will indeed share a piece of DNA large enough to be identified by the testing companies as relevant.  The software companies will then apply their relationship estimating software to the size of the match and number of SNPs.  The results are often inaccurate, as Dr. Mount says.  Not inaccurate in that the match is incorrect, but the estimated relationship is incorrect because the DNA did not divide in half as the mathematical model says it should.  The “problem” is not in the software, but in the DNA itself.

“23andMe reports a “predicted relationship” (e.g. “4th cousin”) and a “relationship range” (e.g. “3rd to 7th cousin”). However, these ranges are likely to be wildly inaccurate, because the likely distance to a common ancestor, given only the information that two people share a single IBD segment, can vary enormously, based largely on how many relatives one has.”

And I will add, it will also vary by how and how much the DNA has or has not divided in every generation.

Dr. Mount goes on to provide the math and probability formulas for these various calculations, and explains what they mean, in English, then he summarizes by saying, “

“Thus, if you have many more distant cousins, as would be expected if your ancestors had large families, then someone who shares a single IBD segment is more likely to be a distant cousin, because you have so many more distant cousins. The point where the increase in the number of cousins outweighs the loss of shared segments is five children per family. This is not extremely uncommon.”

This actually makes a lot of sense when I look at my results.  One of my ancestors, Abraham Estes (1647-1720) had at least 12 children of which 11 reproduced and had very large families.  This line was extremely prolific.  Many of my autosomal matches include Estes descendants.  Some of my other lines where my ancestor was one of just a few children have far fewer matches, likely because there are far fewer people out there descended from them.

Dr. Mount confirms this by saying that, “If one family among [your] 32 [great-great-great-grandparents] had five children and their descendants did as well, while others in the family reproduced at replacement rates (two children per family), then your more prolific ancestors (the parents of just one of your 31 great-great-grandparents) would account for over 3/4 of your fourth cousins.”

So what is the take away message to us from all of this?

  • The autosomal testing companies are doing the best they can predicting your cousin-level relationships with what they have to work with.
  • Real life genetic transmission does not follow the 50% rule of thumb beyond the first generation (parent-child).
  • The predictions get more uncertain and therefore unreliable the more distant they are.
  • Based on the unmeasureable randomness of the genetic transmission involved, there is no way for the testing companies to improve their predictions.
  • Expect more matches to your more prolific lines, and less to lines who had fewer children.
  • Beyond about the first or second cousin level, understand that predictions are only suggestions based on math.  Given that you understand why and how reality can vary, you can then utilize this information when analyzing your matches.
  • Drawing an arbitrary cM line for IBS vs IBD and utilizing only the segments above that threshold may eliminate the small segments you need to identify ancestors many generations removed.
  • Endogamous populations throw a monkey wrench into estimates and calculations, because population members are likely related many times over in unknown ways.  This makes the estimate of relatedness of two people appear closer than it is genealogically.  At least one of the testing companies, Family Tree DNA, attempts to correct for this mathematically when they are aware of the situation, such as in Jewish families.

You can read Dr. Mount’s article including his mathematical proofs, here.

______________________________________________________________

Disclosure

I receive a small contribution when you click on some of the links to vendors in my articles. This does NOT increase the price you pay but helps me to keep the lights on and this informational blog free for everyone. Please click on the links in the articles or to the vendors below if you are purchasing products or DNA testing.

Thank you so much.

DNA Purchases and Free Transfers

Genealogy Services

Genealogy Research