Utilizing Ancient DNA at GedMatch

Mummy of 6 month old boy found in Greenland

It has been a wonderful week for those of us following ancient DNA full genome sequencing, because now we can compare our own results to those of the ancient people found whose DNA has been fully sequenced, including one Native American.

Felix Chandrakumar has uploaded the autosomal files of five ancient DNA specimens that have been fully sequenced to GedMatch.  Thanks Felix.

When news of these sequences first hit the academic presses, I was wishing for a way to compare our genomes – and now my wish has come true.

Utilizing GedMatch’s compare one to all function, I ran all of the sequences individually and found, surprisingly, that there are, in some cases, matches to contemporary people today.  I dropped the cM measure to 1 for both autosomal and X.

Please note that because these are ancient DNA sequences, they will all have some segments missing and none can be expected to be entirely complete.  Still, these sequences are far better than nothing.

1.  Montana Anzick at GedMatch

This is the only clearly Native American sample.

http://www.y-str.org/2014/09/clovis-anzick-dna.html

F999912

9-27-2014 – Please note that kit F999912 has been replaced by kit F999913.

10-23-2014 – Please note that kit F999913 has been replaced by kit F999919.

No matches at 1cM in the compare to all.  This must be because the SNP count is still at default thresholds, in light of information discovered later in this article.

Update – as it turns out, this kit was not finished processing when I did the one to one compare.  After it finished, the results were vastly different.  See this article for results.

2.  Paleo Eskimo from Greenland at GedMatch

http://www.y-str.org/2013/12/palaeo-eskimo-2000-bc-dna.html

F999906

Thirty-nine matches with segments as large at 3.8.  One group of matches appears to be a family.  One of these matches is my cousin’s wife.  That should lead to some interesting conversation around the table this holiday season!  All of these matches, except 1, are on the X chromosome.  This must be a function of these segments being passed intact for many generations.

I wrote about some unusual properties of X chromosomal inheritance and this seems to confirm that tendency in the X chromosome, or the matching thresholds are different at GedMatch for the X.

3.  Altai Neanderthal at GedMatch

http://www.y-str.org/2013/08/neanderthal-dna.html

F999902

One match to what is obviously another Neaderthal entry.

4.  Russian Causasus Neanderthal at GedMatch

Another contribution from the Neanderthal Genome Project.

http://www.y-str.org/2014/09/mezmaiskaya-neanderthal-dna.html

F999909

No matches.

5.  Denisova at GedMatch

http://www.y-str.org/2013/08/denisova-dna.html

F999903

Two matches, one to yet another ancient entry and one to a contemporary individual on the X chromosome.

But now, for the fun part.

My Comparison

Before I start this section, I want to take a moment to remind everyone just how old these ancient segments are.

  • Anzick – about 12,500 years old
  • Paleo-Eskimo – about 4,000 years old
  • Altai Neanderthal – about 50,000 years old
  • Russian Caucasus Neanderthal – about 29,000 years old
  • Denisova – about 30,000 years old

In essence, the only way for these segments to survive intact to today would have been for them to enter the population of certain groups, as a whole, to be present in all of the members of that group, so that segment would no longer be divided and would be passed intact for many generation, until that group interbred with another group who did not carry that segment.  This is exactly what we see in endogamous populations today, such as the Askenazi Jewish population who is believed, based on their common shared DNA, to have descended from about 350 ancestors about 700 years ago.  Their descendants today number in the millions.

So, let’s see what we find.

I compared by own kit at GedMatch utilizing the one to one comparison feature, beginning with 500 SNPs and 1cM, dropping the SNP values to 400, then 300, then 200, until I obtained a match of some sort, if I obtained a match at all.

Typically in genetic genealogy, we’re looking for genealogy matches, so the default matching thresholds are set relatively high.  In this case, I’m looking for deep ancestral connections, if they exist, so I was intentionally forcing the thresholds low.  I’m particularly interested in the Anzick comparison, in light of my Native American and First Nations heritage.

The definition of IBS, identical by state, vs IBD, identical by descent segments varies by who is talking and in what context, but in essence, IBD means that there is a genealogy connection in the past several generations.

IBS means that the genealogy connection cannot be found and the IBS match can be a function of coming from a common population at some time in the past, or it can be a match by convergence, meaning that your DNA just happened to mutate to the same state as someone else’s.  If this is the case, then you wouldn’t expect to see multiple segments matching the same person and you would expect the matching segments to be quite short.  The chances of hundreds of SNPs just happening to align becomes increasingly unlikely the longer the matching SNP run.

So, having said that, here are my match results.

Anzick

I had 2 matches at 400 SNPs, several at 300 and an entire list at 200, shown below.

Chr Start Location End Location Centimorgans (cM) SNPs
1 6769350 7734985 1.7 232
1 26552555 29390880 1.9 264
1 31145273 33730360 2.7 300
1 55655110 57069976 1.9 204
1 71908934 76517614 2.8 265
1 164064635 165878596 2.8 264
1 167817718 171330902 3.3 466
1 186083870 192208998 4.2 250
2 98606363 100815734 1.4 256
2 171132725 173388331 2.0 229
2 218855489 220373983 2.5 261
3 128892631 131141396 1.7 263
3 141794591 143848459 2.5 207
4 1767539 3571907 2.7 235
4 70345811 73405268 2.5 223
5 2340730 2982499 2.3 200
5 55899022 57881001 2.3 231
5 132734528 134538202 1.9 275
5 137986213 140659207 1.7 241
6 34390761 36370969 1.8 293
8 17594903 18464321 1.9 200
8 23758017 25732105 1.7 240
8 109589884 115297391 1.9 203
9 122177526 124032492 1.6 229
10 101195132 102661955 1.2 264
10 103040561 105596277 1.3 304
10 106135611 108371247 1.5 226
12 38689229 41184500 1.6 247
13 58543514 60988948 1.6 220
13 94528801 95252127 1.0 277
14 60929984 62997711 1.8 255
14 63724184 65357663 1.7 201
14 72345879 74206753 1.7 263
15 36850933 38329491 2.7 238
16 1631282 2985328 2.5 273
16 11917282 13220406 3.7 276
16 15619825 17324720 3.1 305
16 29085336 31390250 1.3 263
16 51215026 52902771 3.4 224
17 52582669 56643678 4.7 438
19 11527683 13235913 1.7 203
19 15613137 16316773 1.2 204
19 46195917 49338412 3.3 397
20 17126434 18288231 2.1 225
21 35367409 36969215 4.1 254
21 42399499 42951171 1.6 233
22 33988022 35626259 5.0 289

In my case, I’m particularly fortunate, because my mother tested her DNA as well.  By process of elimination, I can figure out which of my matches are through her, and then by inference, which are through my father or are truly IBS by convergence.

I carry Native heritage on both sides, but my mother’s is proven to specific Native ancestors where my father’s is only proven to certain lines and not yet confirmed through genealogy records to specific ancestors.

Because I had so many matches, quite to my surprise, I also compared my mother’s DNA to the Anzick sample, combined the two results and put them in a common spreadsheet, shown below.  White are my matches.  Pink are Mom’s matches, and the green markers are on the segments where we both match the Anzick sample, confirming that my match is indeed through mother.

ancient compare

We’ll work with this information more in a few minutes.

Paleo

At 200 SNP level, 2 segments.

1 26535949 27884441 1.1 258
2 127654021 128768822 1.2 228

My mother matches on 9 segments, but neither of the two above, so they are either from my father’s side or truly IBS by convergence.

Altai Neanderthal

ancient compare2

Russian Neanderthal

Neither my mother nor I have any matches at 100SNPs and 1cM.

Denisovan

I have one match.

Chr Start Location End Location Centimorgans (cM) SNPs
4 8782230 9610959 1.2 100

My mother matches 2 segments at 100 SNPs but neither match is the same as my segment.

Matching to Ancestral Lines

I’ve been mapping my DNA to specific ancestors utilizing the genealogy information of matches and triangulation for some time.  This consists of finding common ancestors with your matches.  Finding one person who matches you and maps to a common ancestor on a particular segment consists of a hint.  Finding two that share the same ancestral line and match you and each other on the same segment is confirmation – hence, the three of you triangulate.  More than three is extra gravy:)

I have also recorded other relevant information in my matches file, like the GedMatch Native chromosomal comparisons when I wrote “The Autosomal Me” series about hunting for my Native chromosomal segments.

So, after looking at the information above, it occurred to me that I should add this ancestral match information to my matches spreadsheet, just for fun, if nothing else.

I added these matches, noted the source as GedMatch and then sorted the results, anxious to see what we might find.  Would at least one of these segments fall into the proven Native segments or the matches to people who also descend from those lines?

What I found was both astonishing and confusing….and true to form to genealogy, introduced new questions.

I have extracted relevant matching groups from my spreadsheet and will discuss them and why they are relevant.  You can click on any of the images to see a larger image.

ancient compare3

This first set of matches is intensely interesting, and equally as confusing.

First, these matches are to both me and mother, so they are confirmed through my mother’s lines.  In case anyone notices, yes, I did switch my mother’s line color to white and mine to pink to be consistent with my master match spreadsheet coloration.

Second, both mother and I match the Anzick line on the matches I’ve utilized as examples.

Third, both 23andMe and Dr. Doug McDonald confirmed the segments in red as Native which includes the entire Anzick segment.

Fourth, utilizing the Gedmatch admixture tools, mother and I had this range in common.  I described this technique in “The Autosomal Me” series.

Fifth, these segments show up for two distinct genealogy lines that do not intersect until my grandparents, the Johann Michael Miller line AND the Acadian Lore line.

Sixth, the Acadian Lore line is the line with proven Native ancestors.

Seventh, the Miller line has no Native ancestors and only one opportunity for a Native ancestor, which is the unknown wife of Philip Jacob Miller who married about 1750 to a women rumored to be Magdalena Rochette, but research shows absolutely no source for that information, nor any Rochette family anyplace in any proximity in the same or surrounding counties to the Miller family.  The Miller’s were Brethren.  Furthermore, there is no oral history of a Native ancestor in this line, but there have been other hints along the way, such as the matching segments of some of the “cousins” who show as Native as well.

Eighth, this makes my head hurt, because this looks, for all the world, like Philip Jacob Miller who was living in Bedford County, PA when he married about 1750 may have married someone related to the Acadian lines who had intermarried with the Micmac.  While this is certainly possible, it’s not a possibility I would ever have suspected.

Let’s see what else the matches show.

ancient compare4

In this matching segment Mom and I both match Emma, who descends from Marie, a MicMac woman.  Mom’s Anzik match is part of this same segment.

ancient compare5

In this matching segment, Mom and I both match cousin Denny who descends from the Lore line who is Acadian and confirmed to have MicMac ancestry.  Mom’s Anzik segments all fit in this range as well.

ancient compare6

In this matching segment, cousin Herbie’s match to Mom and I falls inside the Anzick segments of both Mom and I.

ancient compare7

More matching to the proven Miller line.

ancient compare8

This last grouping with Mom is equally as confusing at the first.  Mom and I both match cousin Denny on the Lore side, proven Acadian.

Mom and I both match the Miller side too, and the Anzik for both of us falls dead center in these matches.

There are more, several more matches, that also indicate these same families, but I’m not including them because they don’t add anything not shown in these examples.  Interestingly enough, there are no pointers to other families, so this isn’t something random.  Furthermore, on my father’s side, as frustrating as it is, here are no Anzick matches that correlate with proven family lines.  ARGGHHHHHH……

On matches that I don’t share with mother, there is one of particular interest.

ancient compare9

You’ll notice that the Anzik and the Paleo-Greenland samples match each other, as well as me.  This is my match, and by inference, not through mother.  Unfortunately, the other people in this match group don’t know their ancestors or we can’t identify a common ancestor.

Given the genetic genealogy gold standard of checking to see if your autosomal matches match each other, I went back to GedMatch to see if the Paleo-Greenland kit matched the Clovis Anzik kit on this segment, and indeed, they do, plus many more segments as well.  So, at some time, in some place, the ancestors of these two people separated by thousands of miles were related to each other.  Their common ancestor would have either been in Asia or in the Northern part of Canada if the Paleo people from Greenland entered from that direction.

Regardless, it’s interesting, very interesting.

What Have I Learned?

Always do experiments.  You never know what you’ll find.

I’m much more closely related to the Anzick individual than I am to the others. This isn’t surprising given my Native heritage along with the endogamous culture of the Acadians.

My relationship level to these ancient people is as follows:

Lived Years Ago Relatedness Comments
Montana Anzick 12,500 107.4cM at 200 SNP level Confirmed to Lore (Acadian) and Miller, but not other lines
Greenland Paleo 4,000 2.3cM at 200 SNP level No family line matches, does match to Anzick in one location
Altai Neanderthal 50,000 2.1cM at 200 SNP level No family line matches
Russian Neanderthal 29,000 0
Denisovan 30,000 1.2cM at 200 SNP No family line matches

The Lores and the Millers

Looking further at the Lore and Miller lines, there are only two options for how these matching segments could have occurred.  There are too many for them all to be convergence, so we’ll have to assume that they are indeed because we shared a common population at some time and place.

The nature of how small the segments are testify that this is not a relatively recent common ancestor, but how “unrecent” is open to debate.  Given that Neanderthal and Denisovan ancient segments are found in all Europeans today, it’s certainly possible for these segments to be passed intact, even after thousands of years.

The confirmations to the Lore line come through proven Lore cousins and also through other proven Acadian non-specific matches.  This means that the Acadian population is highly endogamous and when I find an Acadian match, it often means that I’m related through many ancestors many times.  This, of course, increases the opportunity for the DNA to be passed forward, and decreases the opportunity for it to be lost in transmission, but it also complicates the genealogy greatly and makes determining which ancestor the DNA segment came from almost impossible.

However, I think we are safe to say the segments are from the Acadian population, although my assumption would be that they are from the Native Ancestors and not the French, given the high number of Anzick matches, Anzick being proven to be Native.  Having said that, that assumption may not be entirely correct.

The Miller line is relatively well documented and entirely from Germany/Switzerland, immigrating in the early 1700s, with the exception of the one unknown wife in the first generation married in the US.  Further examination would have to be done to discover if any of the matches came through Johann Michael Miller’s sons other than Philip Jacob Miller, my ancestor.  There are only three confirmed children, all sons.  If this segment shows up in Johann Michael Miller’s line not associated with son Philip Jacob Miller, then we would confirm that indeed the segment came from Europe and not a previously unknown Native or mixed wife of Philip Jacob.

Bottom Line

So, what’s the bottom line here?  I know far more than I did.  The information confirms, yet again, the Acadian Native lines, but it introduces difficult questions about the Miller line.  I have even more tantalizing questions for which I have no answers today, but I tell you what, I wouldn’t trade this journey along the genetic pathway with all of its unexpected bumps, rocks, slippery slopes and crevices for anything!!  That’s why it’s called an adventure!

______________________________________________________________

Disclosure

I receive a small contribution when you click on some of the links to vendors in my articles. This does NOT increase the price you pay but helps me to keep the lights on and this informational blog free for everyone. Please click on the links in the articles or to the vendors below if you are purchasing products or DNA testing.

Thank you so much.

DNA Purchases and Free Transfers

Genealogy Services

Genealogy Research

Finding Native American Ethnic Results in Germanic People

I’m often asked about the significance of small percentages of autosomal DNA in results.  Specifically, the small percentages are often of Native American or results that would suggest Native admixture.  One of the first questions I always ask is whether or not the individual has Germanic or eastern European admixture.

Why?

Take a look at this map of the Invasion of the Roman Empire.  See the Huns and their path?

Hun map

It’s no wonder we’re so admixed.

Here’s a map of the Hunnic empire at its peak under Attila between the years 420-469.

Hun emplire

But that wasn’t the end of the Asian invasions.  The Magyars, who settled in Hungary arrived from Asia as well, in the 800s and 900s, as shown on this map from LaSalle University.

magyar map

Since both the Hungarians and some Germanic people descend from Asian populations, as do Native Americans, albeit thousands of years apart, it’s not unrealistic to expect that, as populations, they share a genetic connection.

Therefore, when people who carry heritage from this region of the world show small amounts of Native or Asian origin, I’m not surprised.  However, for Americans, trying to sort out their Native ethnic heritage, this is most unhelpful.

Let’s take a look at the perfect example candidate.  This man is exactly half Hungarian and half German.  Let’s see what his DNA results say, relative to any Asian or Native heritage, utilizing the testing companies and the free admixture tools at www.gedmatch.com.

He has not tested at Ancestry, but at Family Tree DNA, his myOrigins report 96% European, 4% Middle Eastern.  At 23andMe in speculative view, he shows 99.7 European and .2 sub-saharan African.

Moving to the admixture tools at GedMatch, MDLP is not recommended for Asian or Native ancestry, so I have excluded that tool.

Eurogenes K13 is the most recently updated admixture tool, so let’s take a look at that one first.

Eurogenes K13

 JK Eurogenes K13 v2

Eurogenes K13 showed 7% West Asian, which makes perfect sense considering his heritage, but it might be counted as “Native” in other circumstances, although I would certainly be very skeptical about counting it as such.

However, East Asian, Siberian and Amerindian would all be amalgamated into the Native American category, for a combined percentage of 1.31.

jk eurogenes k13 chart

However, selecting the “admixture proportions by chromosome” view shows something a bit different.  The cumulative percentages, by chromosome equate to 10.10%.  Some researchers mistakenly add this amount and use that as their percentage of Native ancestry.  This is not the case, because those are the portions of 100% of each individual chromosome, and the total would need to be divided by 22 to obtain the average value across all chromosomes.  The total is irrelevant, and the average may not reflect how the developer determines the amount of admixture because chromosomes are not the same size nor carry the same number of SNPs.  Questions relative to the functional underpinnings of each tool should be addressed to the developers.

Dodecad

I understand that there is a newer version of Dodecad, but that it has not been submitted to GedMatch for inclusion, per a discussion with GedMatch.  I can’t tell which of the Dodecad versions on GedMatch is the most current, so I ran the results utilizing both v3 and 12b.

jk dodecad v3

jk dodecad v3 chart

I hope v3 is not the most current, because it does not include any Native American category or pseudocategory – although there is a smattering of Northeast Asian at .27% and Southwest Asian at 1%.

Dodecad 12b below

jk dodecad 12b

The 12b version does show .52% Siberian and 2.6% Southwest Asian, although I’m not at all sure the Southwest Asian should be included.

HarappaWorld

jk harappaworld

jk harappaworld chart

Harappaworld shows .09 Siberian, .27% American (Native American), .23% Beringian and 1.8% Southwest Asian, although I would not include Southwest Asian in the Native calculation.

In Summary

Neither Family Tree DNA nor 23andMe find Native ancestry in our German/Hungarian tester, but all 3 of the admixture tools at Gedmatch find either small amounts of Native or Asian ancestry that could certainly be interpreted as Native, such as Siberian or Beringian.

Does this mean this German/Hungarian man has Native American ancestry?  Of course not, but it does probably mean that the Native population and his ancestral populations did share some genes from the same gene pool thousands of years ago.

While you might think this is improbable, or impossible, consider for a minute that every person outside of Africa today carries some percentage of Neanderthal DNA, and all Europeans also carry Denisovan DNA.  Our DNA does indeed have staying power over the millennia, especially once an entire population or group of people is involved.  We’ve recently seen this same type of scenarios in the full genome sequencing of a 24,000 year old Siberian male skeleton.

Our German/Hungarian man carries 2.4% Neanderthal DNA according to 23andMe and 2.7% according to the Genographic Project, which also reports that he carries 3.9% Denisovan.  The European average is about 2% for Neanderthal.

The net-net of this is that minority admixture is not always what it seems to be, especially when utilizing autosomal DNA to detect small amounts of Native American admixture.  The big picture needs to be taken into consideration.  Caution is advised.

When searching for Native admixture, when possible, both Y DNA and mitochondrial DNA give specific answers for specific pedigree lines relative to ancestry.  Of course, to utilize Y or mtDNA, the tester must descend from the Native ancestor either directly paternally to test the male Y chromosome, or directly matrilineally to test the mitochondrial line.  You can read about this type of testing, and how it works, in my article, Proving Native American Ancestry Using DNA.  You can also read about other ways to prove Native ancestry using autosomal DNA, including how to unravel which pedigree line the Native ancestry descends from, utilizing admixture tools, in the article, “The Autosomal Me.”

______________________________________________________________

Disclosure

I receive a small contribution when you click on some of the links to vendors in my articles. This does NOT increase the price you pay but helps me to keep the lights on and this informational blog free for everyone. Please click on the links in the articles or to the vendors below if you are purchasing products or DNA testing.

Thank you so much.

DNA Purchases and Free Transfers

Genealogy Services

Genealogy Research

John Campbell (c1772-1838) of Little Sycamore Creek – 52 Ancestors #20

John Campbell’s early life is shrouded in the mists of time.  We can’t positively identify him until he’s an adult, living in Claiborne County, Tennessee, beginning in 1802.  By that time, he would have been roughly 30 years old, married, and probably had 2 or 3 children by his wife, Jane “Jenny” Dobkins, daughter of Jacob Dobkins and Dorcas Johnson.

The closest thing to proof we have that Jane was a Dobkins is Claiborne County lawyer and historian, P.G. Fulkerson (born in 1840) who interviewed old-timers and documented the early families.  He stated that Jacob’s daughter, Jane, married John Campbell and his other daughter Elizabeth married George Campbell. Jacob Dobkins died in 1833, and the Claiborne County courthouse burned in 1838, so if Jacob had a will or estate settlement that named his children, it’s lost to flames.

We believe that John Campbell was born in Virginia based on census information from his children in 1880.

John’s children were:

  • Jacob Campbell born about 1810, died 1879/1880, Collin Co., TX, married Temperance Rice
  • Elizabeth born about 1802, dead before 1842, married Lazarus Dodson
  • Elmira born about 1804 married John Pearson
  • Jane born about 1807, married a Freeman, then a Cloud
  • Martha born 1807/1808, died after 1850, married Elisha Jones, moved to Coles County, Illinois before 1839
  • Rutha born about 1813, died after 1870, married Preston Holt
  • George Washington Campbell born about 1813, died after 1870, probably in Denton County, Texas, married Nancy Eastridge, then Mary unknown
  • William Newton Campbell born 1817, died 1908 Tillman Co. OK, married Sydnia Holt, shown in the photo below

???????????????????????????????

I spent years, decades actually, chasing the wrong parents for John Campbell.  I’ve chased so many parents for this man that I’ve just about ruled everyone out and the ones I haven’t ruled out HAVE to be his parents by process of elimination.  If only it were that easy.  Campbells are like rabbits – they have huge families, are found everyplace and they all have the same first names.  John – how could you be any more generic?  And the man we presume is his brother is named George.  Not much better.  Why not Hezekiah and Azariah???

Several years ago a cousin sent me part of her Campbell research, 4 pages of a 23 page document.  In the portion she sent, she states that back in the 1950s, some Campbell relatives were interviewed who were quite elderly, and they reported that John’s father had been James, as told by their grandparents.  That information morphed into the James Campbell from the northern part of Hawkins County who was also descended from the Crockett line.  This did make some sense, as John’s grandson’s middle name was Crockett, although his first name was David.  The problem is that when you track that James in Hawkins County, TN and his widow and children, there is no John and absolutely no hint of a connection with the John Campbell in Claiborne County, Tennessee, nor the George he is so closely associated with.  Not only that, but James Campbell lived in Carter’s Valley, no place near Jacob Dobkins whose daughters John and George Campbell both married.

In Hawkins County, there are two very distinctive groups of Campbell men.  The group that lived about 20 miles north of Rogersville in Carter’s Valley, who believed they were actually settling in Virginia originally, and Charles Campbell who lived just south of Rogersville across the Holston River on Dodson Creek.  The North group is who James Campbell descended from the Crockett family is associated with.  Charles Campbell, living on Dodson Creek, had 2 sons, John and George, and Jacob Dobkins, whose daughters John and George married, lived just up the road at Bulls Gap, about 9 miles or so.  Charles Campbell lived at the ford of the Holston River, so I’d wager that everyone who crossed the river stopped by to visit, probably including Jacob Dobkins and his daughters.

Charles Campbell was living on Dodson’s Creek in 1788 and possibly as early as 1783.  In 1793, he deeded land jointly to John and George Campbell, from Hawkins Co., for 45#, 150 acres on the south side of the Holston River on the west fork of Dodson Creek.  Charles signed the deed and John Payne was the witness.  The description was metes and bounds except for a stake at the mountain.

On Feb. 26, 1802, book 3-54, George and John Campbell of Hawkins Co. sell to Daniel Seyster the 149 acres on the fork of Dodson Creek where “John Campbell now lives” for 225#.  Both men signed and the witnesses are William Paine, Michael Roark and Charles Campbell. It was proved in the May session of the court in 1802 by Michael Roark, which implies that the Campbell men were gone by that time.

John Campbell is no longer found in Hawkins County.  On May 1, 1802, John first appears in Claiborne County when he purchases land from Alexander Outlaw.  This deed is in the loose papers in the front of deed book A.

Alexander Outlaw of Jefferson Co. TN to John Campbell of Claiborne, copied from Book A page 32 – May 1, 1802 – for $400 in hand and paid by John Campbell, tract of land on the North fork of Sycamore Creek adjoining a survey of 640 acres of James Cooper and Nathaniel Henderson beginning on a grassy hill on the North side of said Creek…300 acres.  Alexander signs.  Witness Jacob Dobbins and James A. Perreman.  Registered July 7 1802.

In the same court session, John Campbell is assigned with other men to “view and lay out a road from Fort Butler to Mulberry Gap and report to next court.”

In 1809, John purchases slaves on the same day, from the same person who sells slaves to Jacob Dobkins.  Note that this same male slave, or another by the same name, is sold within the family in 1839 after John Campbell’s death.

March 29, 1809 – Jesse Cheek of Grainger County to John Campbell, negro boy Charles for $300, signed and witnessed by Solomon and Reuben Dobkins. (note this same day Jesse Cheek and his daughter sold slaves to Jacob Dobkins as well).

1809 – Elizabeth Cheek of Grainger does sell and deliver a negro girl named Jamima aged six years unto John Campbell of Claiborne and by virtue and effect of these presents to bind myself and my heirs to warrant and defend said negro from all persons and claims…Elizabeth signs…March 24, 1809 witness Jesse Cheek Senior and Jr.

Followed directly by…

I, Jesse Cheek, hath bargained and sold unto Jacob Dobkins 4 negroes names Aneker or Anekey, Mitilty, Jiary, Amelyer for the consideration of $130 in hand paid.  March 29, 1809 Jesse signs, registered July 30, 1809.  John Campbell and Solomon Dobkins witness.

In 1811, John Campbell purchases more land.

Jan. 21, 1811 Abner Chapman of Warren Co., Georgia to John Campbell of Claiborne $100 the land where said John Campbell now lives at the head of the north fork of Sycamore Creek (metes and bounds)…original corner of Chapman grant for 400 acres….stake in Campbell’s line…Campbell’s corner…crossing line in Chapman grant…containing 300 acres more or less.  Signed.  Wit Walter Evans and Abel Lanham.  Registered May 18, 1811

For the next many years, John Campbell along with George Campbell and often Jacob Dobkins are assigned as jurors and to work on and lay out roads.  This is normal activity for the timeframe.  Courts, which were held quarterly, were quite the social event of the season – and everyone attended.  If they weren’t a juror, they certainly wanted to watch the proceedings.  It’s said that one time there was so much imbibing that court had to be adjourned because the justices fell off the bench.

It appears in 1812 that John managed to upset someone, although there were two John Campbells, the other being the son of Arthur Campbell of Middlesboro, KY, who lived just beyond the Cumberland Gap.  This Martin Beaty did sue numerous people in the Arthur Campbell family, so maybe our John didn’t get himself sued.

March 25, 1812 – pages 18 and 19 – Martin Beaty vs John Campbell, defendant appears in court by Jacob Peck and Charles F. Keith his attys for slander, appealed for unit of error – moved to next court.  (Note – Beatty lives where Kentucky Rd. crosses Gap Creek, very near Middlesboro, KY where Arthur Campbell lived.)

In 1817, John Campbell was security for Solomon Dobkins, who was a constable.

In 1823, John Campbell buys and sells some land.

1823, June 4 – William Willoughby of Sullivan Co and John Campbell of Claiborne $600 paid in hand tract of land beginning on Brumfield Ridley’s corner chestnut then down the Valley south…stake in the side of Powell’s mountain…200 acres…being the tract where John Condry and others now live.  William Signs.  Witness Hugh Graham and R. Rose.

1823 – John Campbell to Jacob Campbell for $300 land on both sides of main road from the spring fork of Sycamore Creek to Little Mulberry Creek being one half of a two hundred acre tract of land granted by the St of NC to Matthew Willoughby of number 79 dated Feb. 13, 1791 and said half begins at a chestnut tree at the beginning of said grant running with the grant line…crossing said road…stake in the side of Powell’s mountain in the grant line…containing 100 acres to Jacob Campbell.  John Campbell signs.  Witness Walter Evans (he is the clerk).  Registered Jan 15 1824.  Proved in open court May 1823.

John Campbell dies in 1838.  There remains some confusion about exactly where John died.  He had some connection to Coles County, Illinois, possibly only because his daughter lived there and the documents in question may only be referring to her residence in Coles County.  Some indication is that John died there, but in the subsequent deeds, it suggests that he died in Claiborne County.  Regardless, we know that he was dead on or before Sept 22, 1838 when William Hicks built John’s coffin and submitted a receipt for payment for $5.

In 1840, a William Hicks was living 2 doors away from a William and George Campbell, so I’m betting that John Campbell was buried in Claiborne County. William Hicks also purchased items at the estate sale of John Campbell in 1838.  If John was buried in Claiborne County, in September, I’m thinking that no one would want to transport a body from Illinois to Claiborne County for burial, by wagon, at about 20 miles a day.  Google maps says that it’s about 445 miles so that would equate to about 3 weeks.  By that time, I’m thinking they would be burying him along the road someplace or giving him a water burial in the Ohio River.

If John died in Claiborne County, which seems very likely, he could be buried in the old Jacob Dobkins Cemetery which seems to be the family cemetery, shown below, and has many early unmarked graves, including that of Jacob Dobkins and his wife.  There was not a cemetery on John Campbell’s land, unless there was an early cemetery where Liberty Church and cemetery stand today, which is certainly possible.

Dobkins cemetery

On the 1839 tax list, John is listed thus in the Rob Camp District in the far northeast part of the county:

  • John Campbell, decd – 443 acres worth $1300, 25 school acres worth $10, 2 slaves worth $900

Will Book A – page 71 – inventory of the estate of John Campbell, decd and of sales (3 pages) William Fugate and Jacob Campbell admin.

In the cousin’s research that she sent, she indicated that Henley Fugate was the uncle of John Campbell, and was married to Elizabeth Campbell, sister of John, although that would make Henley John’s brother-in-law, not his uncle.  Henley and Elizabeth’s son, William, according to the cousin, was administrator of John’s estate, along with Jacob Campbell, John’s son, and that somehow William Fugate and Jacob Campbell cheated the heirs out of their money.  There are 4 different court entries accounting for the funds, which don’t look in any way unusual, but there is always a back story to be found, it seems, especially having to do with estate settlements.  The Fugates do seem very connected to the Campbell family, so there may well be a family relationship there. The cousin also indicated that the families had lived adjacent in Virginia but since I can’t seem to find a location in Virginia, I have been unable to confirm that tidbit of data.

John Campbell’s sale was huge, as these things go, and as compared to other estates of the time.

  • Cash on hand after paying note – $649
  • Note from Johoel and William Fugate  – $15
  • Notes from others – $385.22

Apparently John was in the business of lending money as he was owed notes from several people.

John’s estate sale was Feb. 25, 1839.  We don’t know what the weather was like that day.  In Claiborne County, it could have been anything from snowing, slick and miserable to sunny and warm.  The administrators of John’s estate likely wanted to get things sold and felt early spring was a good time because farmers were likely to purchase things they needed for the upcoming planting season.

Sadly, the widow, Jane Campbell, had to purchase her own things at the estate sale, because all property was deemed to be that of the husband.  Therefore, Jane Campbell, widow, purchased the following items for a total of $87.63 and a half cents:

  • 1 saw
  • 1 little wheel
  • 1 set spools
  • 1 cupboard furniture
  • 1 reel bed and bedding
  • 1 chaff bed and feather bed
  • 1 lot of gums (guns?)
  • Sheet of cotton
  • 1 trunk
  • 1 clock and case
  • 1 lot of hay
  • 1 bucket
  • 1 set fire irons and shovel
  • 1 tin trunk
  • 1 set chairs
  • 1 lot barrels
  • Tub and lard
  • 1 ewe and lamb
  • 1 mare
  • 1 lot of casting
  • 1 cow

She obviously purchased her spinning wheel.  I have to wonder at the lack of a listing for the family Bible.

Others at the same purchased:

  • 1 tub
  • 1 chipping ax
  • 1 lot tubs
  • 690 lbs bacon
  • 1 broad ax
  • 1 big wheel
  • 1 trunk
  • Raxor and box
  • Table
  • Ax
  • 2 pr gears
  • 1 yoke oxen
  • 2 baskets
  • Hoe
  • Curry comb and chair
  • Piece of steel
  • Ax
  • Harrow
  • 1 bull
  • 1 grindstone shovel, plows and bridle
  • Remnant of corn
  • 1 box shoemakers tools
  • Side leather
  • 2 lots tools
  • Fire irons
  • 1 coult
  • 1 cow
  • Cow
  • Horse
  • 1 lot sheep
  • 4 yearlings
  • 1 scythe blade
  • Cross cut saw
  • Candle stand
  • 1 saddle
  • 2 pitch forks
  • Double tree
  • Wheet sive
  • Wagon
  • Skillet and lid
  • Lot plunder
  • Lot corn basket and pickett book
  • Yoke of oxen
  • Lot of tools
  • Coult
  • 1 horse
  • 1 lock chain
  • Cow and calf
  • 1200# ?
  • 1 plain
  • 1 mare
  • 1 bridle
  • 2 hoes
  • Coulter and iron
  • Remnant of oats
  • Cutting knife and hammer
  • 202 lb bacon
  • 1 lot castings
  • Saddle
  • Lot of hogs
  • Set of chains
  • Big plow
  • 13 bushels and 3 peck wheat
  • Plow
  • 50 bushels corn
  • Big plow
  • Mill peck
  • Plow
  • Sack of cotton
  • Large plow and matchk
  • Hoe and stretchers
  • 1 bridle
  • Grindstone
  • 1 shovel, plows
  • 1 chair
  • Lot tools
  • 1 beef hide
  • 1 bee gum
  • Hoe and rake
  • Bridle and lot of corn
  • Big sugar
  • Bureau
  • 1 pair chains
  • 1 little when
  • 1 side leather and castings
  • 1 press
  • 1 bee gums
  • Blacksmith tools
  • Piece of iron
  • 2 leather aprons
  • Lot of castings and coffee mill
  • 1 pair steelyards
  • 1 cack bank
  • 1 scythe and cradle and houe
  • 1 cupboard
  • 100 dozen binds of oats
  • 1 mattock
  • 1 bedstead
  • 3 scythes
  • 1 cutting knife and scythe
  • Plow

The total of the estate sale was $958.58

Was John a shoemaker or a blacksmith?  Was his slave trained to one of these professions?

What else does this tell us about John’s life?  He was obviously a farmer, but everyone was.  He had several horses; 2 mares, 2 colts, 3 horses and 4 yearlings.  He had a “lot of hogs,” which of course means a group that was sold together, and he also had almost 1000 pounds of bacon.  Fall was slaughtering time, so there were quite a few hogs that had been killed and processed, probably in a smoke house.  There was one ewe and lamb and obviously Jane felt fondly towards them.  There was also a “lot of sheep.”  There were 3 cows and a bull and there were 2 yoke of oxen.  Oxen were matched and trained to work together, so they were often sold together as well.

They also had bee gums, which were gum trees that bees lived in.  So in essence, he was an early beekeeper.  This means, of course, that they also had honey, which might be connected to the item called “big sugar.”

They had 3 beds, 3 trunks, 2 cupboards, a bureau and a clock, which was a luxury. John was not a poor farmer.  In fact, few people in Claiborne County had slaves, so John having 2 was rather unusual.  Those who did have slaves had 1 or 2 and a very few people had 10 or more.  In the 1830 census, John had 2 slaves and his father-in-law, Jacob Dobkins, had 4.  Finding this heritage of slavery within the family saddens my heart, although I realize that it was socially acceptable, even desirable, at the time.  Well, desirable by everyone except the slave.  Slaves on small farms were often well treated and had good lives, and I hope that is how these people were treated.

John’s children and their spouses also attended his estate sale except for his daughter, Martha, who lived in Illinois.  It’ must have been a sad day to see your parents things being divided like so much excess and being sold away from your mother.  Jane did, of course, retain her dower right to one third of his estate, but that didn’t stop the estate sale.

In July of 1839, the court record shows each of the children of John Campbell and what they received during their lifetimes.

July 22, 1839 – Estate of John Campbell, amounts received during this lifetime:

  • Jacob Campbell $210
  • George Campbell (blank)
  • Lazarus Dodson 192.95
  • Preston and Ruth Holt 170.00
  • Jane Freeman 43.50
  • Jefferson and Elmire? (Eliza?) Pearson 124.50
  • William Campbell 214.00
  • Martha Jones 65.75 of Illinois

Page 206 – settlement estate of John Campbell by William Fugate and Jacob Campbell before Wiley Huffaker, clerk of court – paid William Hicks for coffin- Sept 22, 1838 – $5.00  Paid Jane Campbell for her dower June 25, 1839

By 1839, John’s heirs are selling his land to their sibling, along with a slave described as a boy in this document, so not the same person purchased in 1809.

July 29, 1839 – Elisha Jones and Martha Jones his wife, formerly Martha Campbell and daughter of John Campbell, now decd of Coale Co., Illinois, to William and George Campbell of Claiborne Co., for $187.50 assign all right and interest of 1/8th share in consequence of Martha being a daughter and heir of the said John Cambell in tract of land containing 345 acres adjacent the lands of William McVay and Marcurioius Cook it being the tract of land where on the John Campbell formerly lived and whereon the said John Campbell died seized and possessed of subject to the dower of the widow and all right and title after the death of the widow.  Elisha signs and Martha with an X.  Witness William Niel and Jacob Campbell.

This is the entry that caused the confusion about where John died.  We know that Martha Campbell lived in Illinois, and given the other information we do have, I believe this is mean to convey that Martha Jones is of “Coale Co., Illinois” and not John Campbell.  The words “formerly lived” is always used after death.  John was clearly still very invested in Claiborne County, judging from his significant estate.

The East Tennessean Newspaper on Saturday, March 7th, 1840 ran the following legal notice:

On the 13th day of Match next at the late residence of John Campbell, dec’d, upon Little Sycamore Creek in Claiborne County – offer at public sale to the highest bidder, three slaves, Charles, 51 or 52, Jenny, 38 years and Berry, 25 years.  William Fugate and Jacob Campbell administrators of John Campbell, decd.  February 8, 1840.

On March 30, 1840, John Campbell’s negroes were sold.

In April 1841, the court notes reflect that John’s estate was now worth $2897.64 and two thirds cents.

In July 1841, Wiley Huffaker was the guardian to the children of Elizabeth Campbell Dodson, deceased, and Lazarus Dodson.

Feb 1843 – Settlement of the estate of John Campbell by William Fugate and Jacob Campbell admin.  Amount given to each heir of John Campbell as received by them in the lifetime of said deceased.

  • Jacob Campbell $210.00
  • George Campbell 103.65
  • Lasarous (Lazarus) Dotson 192.75
  • Preston Holt 170.16 and a half cents
  • Jane Freeman 43.50
  • Elmire Pearson 124.50
  • William Campbell 214.00
  • Martha Jones 65.75

This is a great list, as it shows that John Campbell loaned or gave his children part of their inheritance early.

Jacob Campbell, George Campbell, Jane Freeman, Jefferson Pearson, Preston Holt and Jane Campbell sell to William Campbell for $33.03 and 1/3 cents negro boy Charles which John Campbell died seized and possessed and Jefferson Pearson and Preston Holt having interest in said negro by their marriage with daughters of said John Campbell.  Signed except Jane who makes mark of a plus sign.  Witness Gray Garrett and Hugh Dobkins and registered Jan. 13, 1840.

In October 1843, a final settlement was made with the children of Elizabeth Campbell Dodson which lists her children, by name.

On Jan. 24, 1852, William Campbell sells to Daniel Jones of the same for $1300 the land where Daniel Jones now lives including the residence of John Campbell decd lying on Little Sycamore Creek including part of 2 grants, one to Alexander Outlaw and the other to Abner Chapman, beginning….southwest corner of Outlaw grant…closing line of Chapman grant…conditional corner between William Campbell and Daniel Jones…Outlaw grant.  Signed.  Registered March 10, 1852.  Witness Tennessee Cook and William Fugate.

This last deed clearly identifies which John Campbell we are talking about.  I brought these deeds forward in time, hoping to find a landmark of some sort that I could locate today. I was very lucky.  Skipping several transactions, I found this:

1903 – Jane Ann Jones et all to G.R. Sulfridge – deed of trust – all the old Daniel Jones home farm and tract deeded to Ann Jane Jones except that previously deeded to H. Friar and others, beginning at Sycamore Creek at Nancy Coles, Nancy Cooks line, across ridge to John Cunningham’s line, Buis corner, top of ridge, George Runions, Friar’s line, public road in Little Sycamore Valley, except the grave yard plot of 3/4 acre deeded to Liberty Church, 140 acres.

liberty cemetery sign

The Liberty Church!  I knew exactly where that was located.  Here’s a photo of some of the old settlers and the Old Liberty Church taken about 1902.  The church itself was founded in 1856 and the building in this photo was built in 1883, so this church did not exist when John Campbell was alive, but the fact that the cemetery was deeded to the church helped us locate John’s land.

liberty church

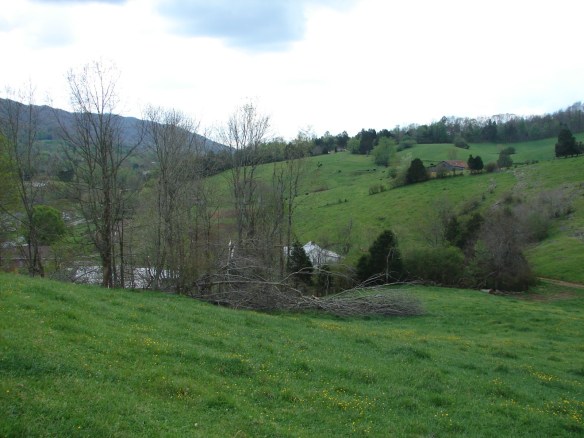
The Liberty church sits down on Little Sycamore road, but the cemetery sits up on a ridge beside the church and directly behind John Campbell’s house.

From this vantage point, you look down over the valley.  It’s quite beautiful!  John Campbell might be buried here.

Liberty cemetery

This photo, below, is John’s house from in the cemetery.

Campbell house from cemetery

It’s very likely that when John died, William Hicks made his casket, someone preached his funeral, and John was carried up the hill, probably in his wagon by his own team of oxen, and he was buried right here, forever standing silent sentry, looking over his land from what is called Little Ridge.

Here’s the house from the road.  My cousin, Daryl and I went to visit.  Once we discovered the landmark of Liberty Church, we couldn’t NOT visit.

Campbell house

The cemetery stands above the house on top of the ridge.

This was a prime piece of real estate, because it had a natural spring which still flows today.  The head of the spring is under the rocks and you can see that it has hollowed out a bed downstream.

Campbell spring

You can see the stream here, located in front of the house, where it’s not far to carry fresh water to the house.

Campbell spring 2

Campbell property

The current owners were very gracious allowing us to photograph the property and answering many questions.

campbell house 2

You can easily see the original house in the center.  The owners told us the center part is made of logs.

Campbell foundation

We asked about this odd part of the foundation and discovered that there is a hidden “room” under the house.  The owners told us that they had been told that it was for travelers from long ago so that they could stay someplace without disturbing the household if they arrived at night.  I wondered about the Civil War because this area was rife with marauding soldiers from both side and many families have stories about hiding from the soldiers.

Campbell step

The door into the original cabin and the original steps.  Most of the steps in this region are stones like this.  I have the stone from one of my ancestor’s cabins that is now my back step.  I’m not sure how I’d have gotten this one in my Jeep, but had it been offered, Daryl and I would have found a way, rest assured!

George and John Campbell, Brothers or Not?

One enduring mystery is the relationship of George Campbell and John Campbell.  If you believe Fulkerson, and there isn’t any reason not to, they married Dobkins sisters, but what he did not say was that they were brothers, although based on the joint deed from Charles Campbell, the timing and the enduring relationship between the Campbell men, it’s certainly a logical conclusion.  But is it accurate?

One fine day, when Daryl and I were researching on one of our many library trips, we stumbled on one right juicy lawsuit in which the divorce of one of John Campbell’s daughters is discussed.  It seems that one fall during “hog killing,” while married, she was “discovered” in a compromising position in the barn with her Campbell cousin, George’s son, who was named and identified as her cousin.  Woohooo…..our lucky day.  Until we realized that John’s daughter and George’s son would have been cousins through their mother’s as well.  If John and George were brothers then their children would have been double first cousins.  Thankfully, she apparently didn’t get pregnant from the encounter, just divorced.  I bet that was the talk of the neighborhood for a very long time.

These families didn’t live far apart.  It was closer over the mountains, and they had wagon trails and roads across the ridges that don’t exist today.

On the map below, the red arrow at left shows the approximate location of the land of George Campbell on Russell Creek.  The top arrow shows Jacob Dobkins land and the bottom arrow shows the circle drive today around the cemetery above John Campbell’s home.  These properties were about 3 miles from each other, John’s being “across the ridge” from the others.

Campbell map

I turned to DNA hoping that perhaps I could discover something more about the relationship between John and George Campbell.  Maybe, if I was lucky they would have a family mutation that linked them.  Maybe, today, they would match exactly to a family line out of Virginia.  When the descendants of both George and John were first Y DNA tested, several years ago, we certainly weren’t that lucky.

John’s descendant who tested is Jim Campbell and George’s descendant is Paul Campbell.

I would expect both Jim and Paul to match closely.  They do match, but not closely.

Both men are 5 generations from their oldest known ancestor, meaning John and George, so they would be 6 generations from a common ancestor if George and John are brothers.

At 67 markers they have 4 mutations difference.  This would be expected, at the 50th percentile, at about 8 generations, using the TIP tool at Family Tree DNA.  Of course, I’ve discussed this tool, its drawbacks and the fallacy of averages, but sometimes it’s the only tool you have and it’s certainly better than nothing.

At 37 markers Jim and Paul have 2 mutations, at 25 markers, they aren’t shown as a match, so that means 2 mutations (deduced because that is what they have at 37).  They are not showing as a match at 12 markers either, so more than 1 mutation difference in the first panel.

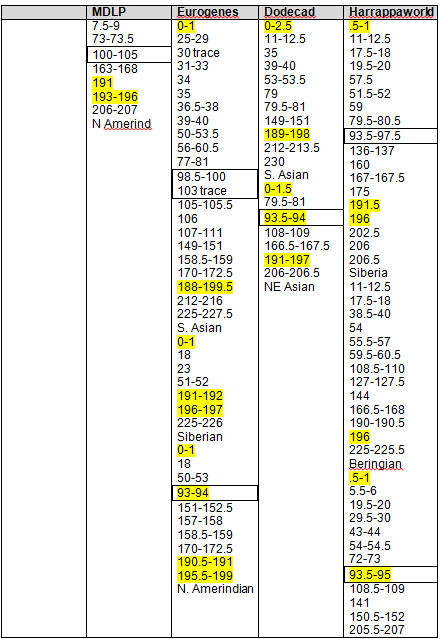
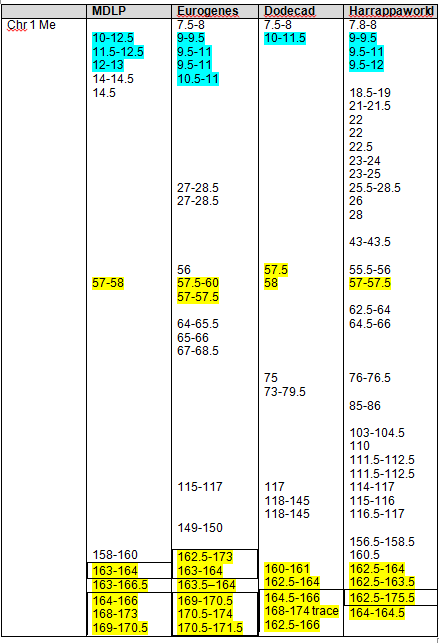
Moving to the Campbell DNA project, I can see the DNA results for the group that the administrator, Kevin Campbell has grouped both Jim and Paul into.  Fortunately, it is the same group, R1b-group 30.

Comparing their results with others in the group, we see that Jim (yellow 80569) has several mutations, and Paul (blue 81430) seems to match the modal value perfectly, so in essence has had no mutations since the common ancestor of this group.

Campbell group 30

Paul is the closest match to kit 23564 whose oldest ancestor is:

David J. Campbell, a son of Mark Washington Campbell and Mary Ann Campbell, was born on 26 August 1846 in Franklin County, PA.  It is speculated that he was born in Dry Run.  Also, according to speculation, his father, Mark W. Campbell, was born 15 December 1815 in the same county.  David married Marie Edna Gribble in 1870 and had six children. The family migrated to Clinton County, IA, McLean County, IL, Kearney County, NE, and Payette County, ID.

Jim’s closest match has 3 mutations, which isn’t terribly close, kit 28877 whose oldest ancestor is:

Solomon Campbell born Sept 1805, married Margaret Laurie, John N’s son James N Campbell Born Feb 2 1835.  Other children of John N are Martha, William, Margaret, Thomas L., James N., Solomon J., Jane.  It states on the 1841 Scottish census (Crofthead, Neilston, Renfrewshire) that John N and family were born in Ireland except for Jane who was born in Neilston.  Family also listed in Scotland 1851 census. Came to America in June of 1853, settled in Mason NH, John N. died 1878 Townsend Mass.

There is clearly no commonality in terms of either ancestors or location comparing the two closest matches.  Furthermore, Jim’s closest match is in Massachusetts when we know that John Campbell did arrive from Virginia, born in the 1770s, and was very likely part of the Scots/Irish migration from Pennsylvania through Virginia – simply given the historical patterns and logistics.

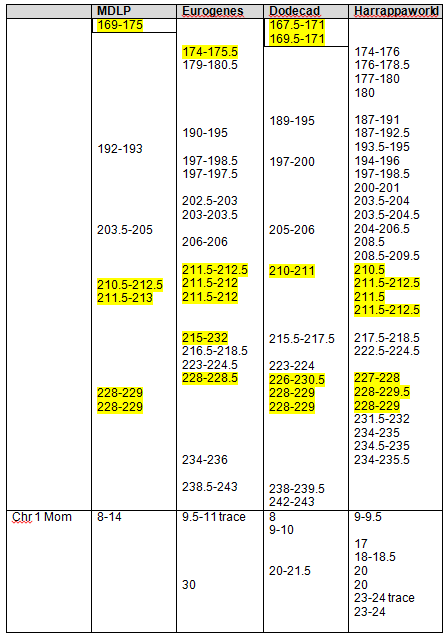
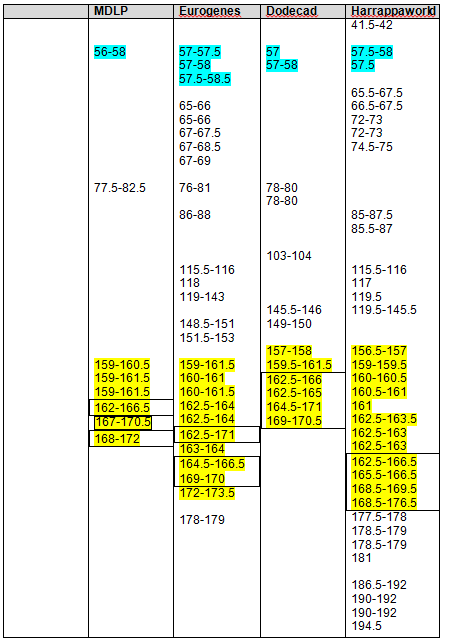
Let’s move to the individual markers and see what we can tell.

Campbell headingCampbell 389

I looked at the markers, and I think that DYS389(2) is having spontaneous mutations.  I say this because IF and assuming that truly, kit 81430 has not mutated, then all of the mutations in the 80569 kit happened after Charles Campbell who was born about 1750 or maybe slightly earlier.  It’s obvious from looking at oldest ancestors of the matches who have a value of 31 at DYS389(2) that  they could not all be descended from someone who lived since Charles Campbell.

Both Paul and Jim have taken the Family Finder autosomal test.  Let’s see what that says about their relationship.  I searched Jim’s account for matches having a surname of Campbell.  Sure enough, there were 5 results, but none of them were Paul.  These men should be 5th cousins if Charles Campbell is the father of both John and George.  That is a long way back and we would expect, on average for 5th cousins to carry only about 3cM of common DNA and less than 1%.  The FTDNA threshold is 7cM.

Jim’s sister has also taken the Family Finder test.  On the chance that she inherited differently, I checked to see if she perhaps matches Paul.  She does not.

We know that at Family Tree DNA matching threshold is set to approximately 7cM and that matches have to meet other criteria as well to be considered a match, like minimum SNPs and a minimum total cM as well.  Therefore, people with small amounts of matching DNA are not shown as matches at Family Tree DNA, but may share DNA that is important to find.  At GedMatch, you can set the matching thresholds yourself.

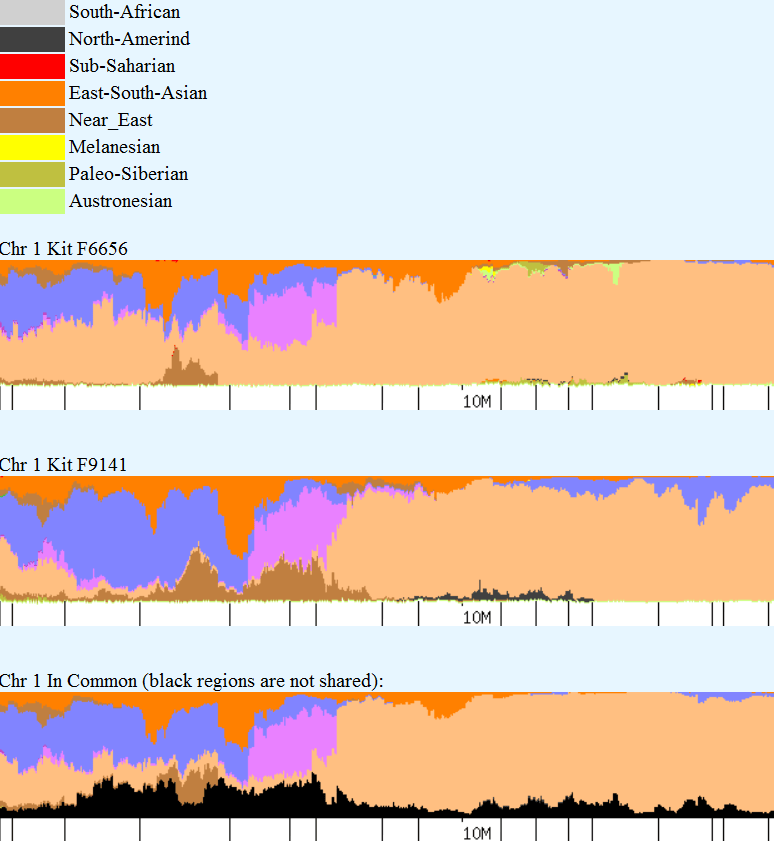
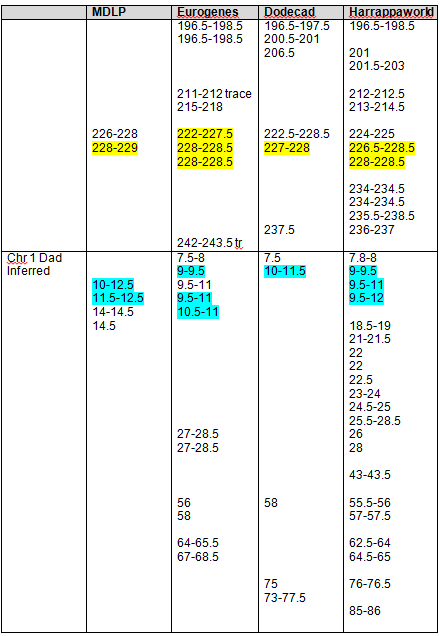
Let’s take a look at GedMatch to see if the John Campbell descendants match the George Campbell descendants.  Below, Jim and Paul’s autosomal DNA is compared for matches.

Campbell, paul vs jim

Sure enough, Jim and Paul match each other on four segments, one just above 3cM, just as predicted, and three more just over 1cM each.  Without a proven family connection, we would ignore segments of this size, but in a known family situation, these are important matching segments.

Let’s see if Jim’s sister matches Paul.

Campbell, paul vs jim sister

Yes, Jim’s sister and Jim both match Paul and in the same location on chromosome 7.

Do I match Paul?

Campbell, paul vs me

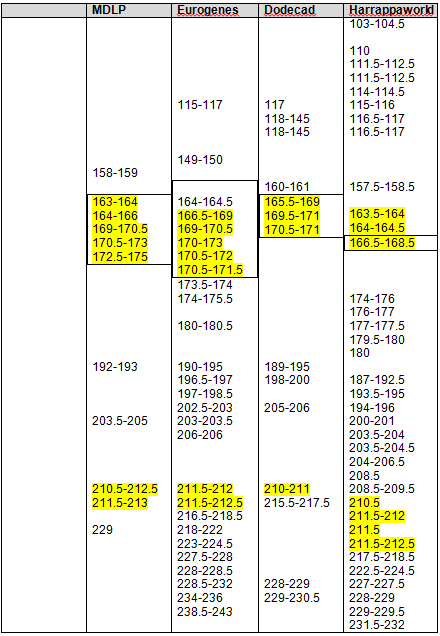
I do match Paul significantly.  On two chromosomes, the segments are 12 and 13 cm.  On chromosome 12, I match Paul on the same location at Jim’s sister.  On chromosome 13, I match on the same location as Jim matches Paul.

The GedMatch estimate is interesting in that it is 4.2 generations.  We know positively that we are a minimum of 7 generations distant, assuming that Charles is the father of both George and John.  Paul and I do not share any other ancestors.

Do I match Joy, the other George descendant?

Yes, I do, below.  Again, a minimum of 7 generations between us.

Campbell, me vs joy

Does Jim match Joy? No.

Does Joy match Jim’s sister? No.

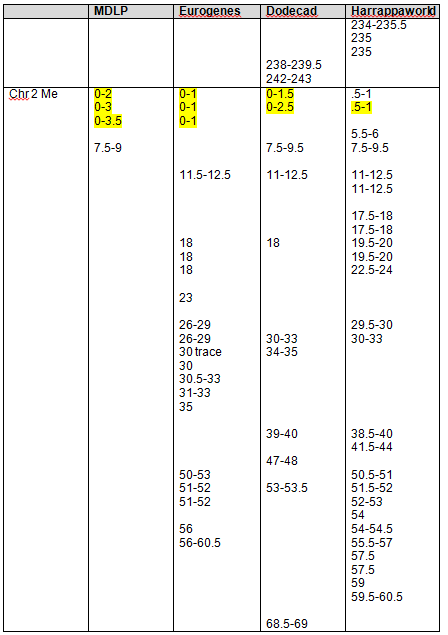
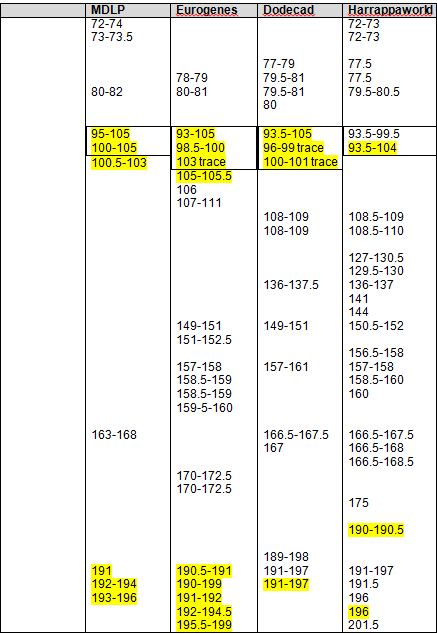
Does Paul match Joy?  Both are descended from George.  Yes, on 10 different chromosomes.  These should be more closely matched than any John/George descendant matches, but they are further than 2.7 generations.

Campbell, paul vs joy

Do I match Jim, who is also descended from John Campbell?  Yes.

Campbell, me vs jim

Do I match Jim’s sister? Yes, on far more segments that I match Jim.

Campbell, me vs jim sister

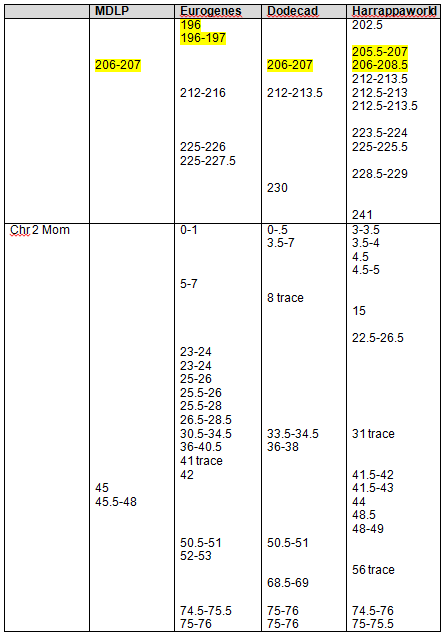
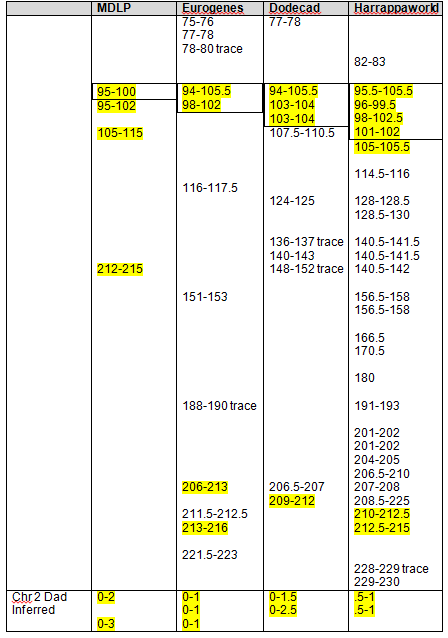
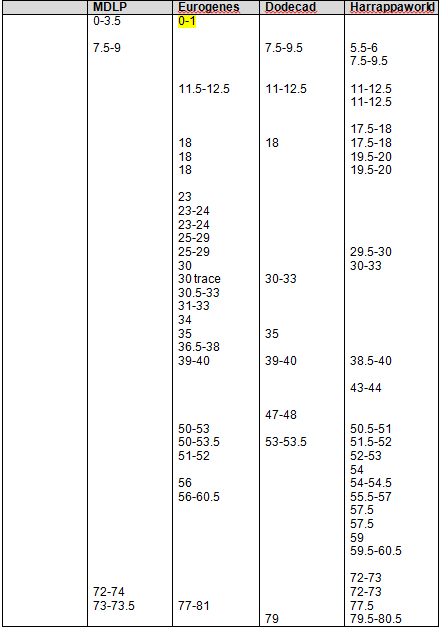
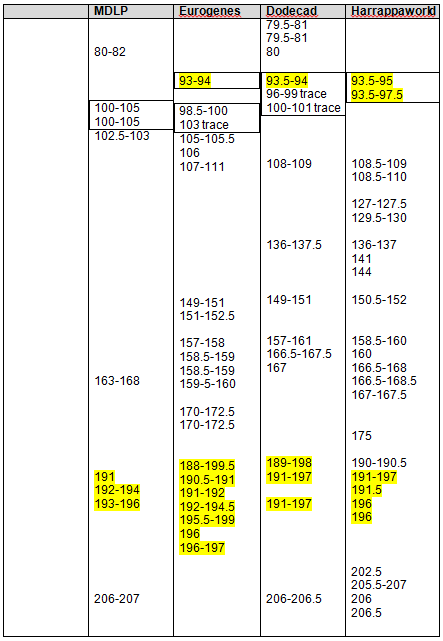
The segments on chromosome 5 are identical between me, Jim and his sister.  Clearly, that came from John Campbell.  Our common ancestor, John Campbell is 5 generations from Jim and his sister, and 6 from me.

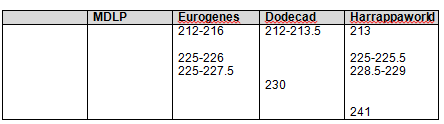
I created the following table of the results.  We have two descendants from George who match each other most closely.  Conversely, the descendants of John match each other more closely than the descendants of John match the descendants of George.  However, given the generational distance, the descendant of John and George do fall into the expected tolerance in the case of Paul matching Jim, John and me.

Jim (John) Jim’s sister Paul (George) Me (John) Joy (George)
Jim na siblings 1,3,7,13 5, 7, 11, 15 No
Jim’s sister siblings na 7, 10, 12, 13 2, 3, 5, 10, 11, 12, 13 No
Paul 1,3,7,13 7, 10, 12, 13 na 4, 9, 10, 12, 13 1, 2, 3, 5, 6, 7, 9, 12, 15, 16
Me 5, 7, 11, 15 2, 3, 5, 10, 11, 12, 13 4, 9, 10, 12, 13 na 16, 17
Joy No No 1, 2, 3, 5, 6, 7, 9, 12, 15, 16 16, 17 na

What else can we do now to further identify the parents of John and George Campbell, presuming that they are indeed brothers as the results above suggest?

At this point, there are three avenues open for study.

  1. Upgrade both Jim and Paul to 111 markers and hope for line marker mutations.
  2. Upgrade both Jim and Paul to the Big Y hoping for identical mutations, and if not, ones that will connect to another Campbell line. This option is very expensive at this time, and according to the Campbell surname administrator there are either few or no project members who have ordered the Big Y.
  3. Utilize Family Finder to search both Jim and Paul’s matches for consistent matches and hope for a clear genealogy clue as to where to begin the search for the common family of John and George.
  4. Add a dash of luck!

One thing is certain, whether John and George share a father or not, and whether that father is Charles Campbell who died before 1825 in Hawkins County, TN, or not, they do at some point not terribly distant past, share a common Campbell ancestor.  I surely wish there were any other proven children of Charles Campbell to test against.

As a matter of curiosity, I did check to see if any of the five of us Campbell descendants have matches to people with Fugate as an ancestral surname – and we all do.  However, many of these people also have Campbell ancestry and/or are from the Claiborne County region where we all have roots, so it would require more research to draw any inferences or conclusions on the Fugate question.

The Campbell lineage has been exceedingly frustrating. Why, oh why, didn’t they register that deed in 1825 in Hawkins County listing the heirs of Charles Campbell???

______________________________________________________________

Disclosure

I receive a small contribution when you click on some of the links to vendors in my articles. This does NOT increase the price you pay but helps me to keep the lights on and this informational blog free for everyone. Please click on the links in the articles or to the vendors below if you are purchasing products or DNA testing.

Thank you so much.

DNA Purchases and Free Transfers

Genealogy Services

Genealogy Research

Family Tree DNA Releases myOrigins

my origins

On May 6th, Family Tree DNA released myOrigins as a free feature of their Family Finder autosomal DNA test.  This autosomal biogeographic feature was previously called Population Finder.  It has not just been renamed, but entirely reworked.

Currently, 22 population clusters in 7 major geographic groups are utilized to evaluate your biogeographic ethnicity or ancestry as compared to these groups, many of which are quite ancient.

my origins regions

Primary Population Clusters

  • Anatolia & Caucasus
  • Asian Northeast
  • Bering Expansion
  • East Africa Pastoralist
  • East Asian Coastal Islands
  • Eastern Afroasiatic
  • Eurasian Heartland
  • European Coastal Islands
  • European Coastal Plain
  • European Northlands
  • Indian Tectonic
  • Jewish Diaspora
  • Kalahari Basin
  • Niger-Congo Genesis
  • North African Coastlands
  • North Circumpolar
  • North Mediterranean
  • Trans-Ural Peneplain

Blended Population Clusters

  • Coastal Islands & Central Plain
  • Northlands & Coastal Plain
  • North Mediterranean & Coastal Plain
  • Trans-Euro Peneplain & Coastal Plain

Each of these groups has an explanation which can be found here.

Matching

Prior to release, Family Tree DNA sent out a notification about new matching options.  One of the new features is that you will be able to see the matching regions of the people you match – meaning your populations in common.  This powerful feature lets you see matches who are similar which can be extremely useful when searching for minority admixture, for example.  However, some participants don’t want their matches to be able to see their ethnicity, so everyone was given an ‘opt out’ option.  Fortunately, few people have opted out, less than 1%.

Be aware that only your primary matches are shown.  This means that your 4-5th cousins or more distant are not shown as ethnicity matches.

Here’s what the FTDNA notification said:

With myOrigins, you’ll be able compare your ethnicity with your Family Finder matches. If you want to share your ethnic origins with your matches, you don’t need to take any action.  You’ll automatically be able to compare your ethnicity with your matches when myOrigins becomes available.  This is the recommended option. However, we do understand that sharing your ethnicity with your matches is your choice so we’re sending you this reminder in case you want to not take part (opt-out). To opt-out, please follow the instructions below. *

  1. Click this link.
  2. If you are not logged in, do so.
  3. Select the “Do not share my ethnic breakdown with my matches. This will not let me compare my ethnicity with my matches.” radio button.
  4. Click the Save button.

You can get more details about what will be shared here.  You may also join our forums for discussion* You can change your privacy settings at any time. Thus, you may opt-out of or opt back into ethnic sharing at a later date if you change your mind.

What’s New?

Let’s take a look at the My Origins results.  You can see your results by clicking on “My Origins” on the Family Finder tab on your personal page at Family Tree DNA.

Ethnicity and Matches

Your population ethnicity is shown on the main page, as well as up to three shared regions that you share with your matches.  This means that if you share more than 3 regions with these people, the 4th one (or 5th or 6th, etc.) won’t show.  This also means that if your match has an ethnicity you don’t have, that won’t show either.

my origins ethnicity

Above, you see my main results page.  Please note that this map is what is known as a heat map.  This means that the darkest, or hottest, areas are where my highest percentages are found.

Each region has a breakdown that can be seen by clicking on the region bar.  My European region bar population cluster breakdown is shown below along with my ethnicity match to my mother.

my origins euro breakdown

And my Middle Eastern breakdown is shown below.

my origins middle east breakdown

Ethnicity Mapping

A great new feature is the mapping of the maternal and paternal ethnicity of your Family Finder matches, when known.  How does Family Tree DNA know?  The location data entered in the “Matches Map” location field.  Can’t remember if you completed these fields?  It’s easy to take a look and see.  On either the Y DNA or the mtDNA tabs, click on Matches Map and you’ll see your white balloon.  If the white balloon is in the location of your most distant ancestor in your paternal line (for Y) or your matrilineal line for mtDNA (your mother’s mother’s mother’s line on up the tree until you run out of mothers), then you’ve entered the location data and you’re good to go.  If your white balloon is on the equator, click on the tab at the bottom of the map that says “update ancestor’s location” and step through the questions.

ancestor location

If you haven’t completed this information, please do.  It makes the experience much more robust for everyone.

How Does This Tool Work?

my origins paternal matches

The buttons to the far right of the page show the mapped locations of the oldest paternal lines and the oldest matrilineal (mtDNA) lines of your matches.  Direct paternal matches would of course be surname matches, but only to their direct paternal lines. This does not take into account all of their “most distant ancestors,” just the direct paternal ones.  This is the yellow button.

The green button provides the direct maternal matches.

my origins maternal matches

Do not confuse this with your Matches Map for your own paternal (if you’re a male) or mitochondrial matches.  Just to illustrate the difference, here is my own direct maternal full sequence matches map, available on my mtDNA tab.  As you can see, they are very different and convey very different information for you.

my mito match map

Comparisons

By way of comparison, here are my mother’s myOrigins results.

my origins mother

Let’s say I want to see who else matches her from Germany where our most distant mitochondrial DNA ancestor is located.

I can expand the map by scrolling or using the + and – keys, and click on any of the balloons.

my origins individual match

Indeed, here is my balloon, right where it should be, and the 97% European match to my mother pops up right beside my balloon.  The matches are not broken down beyond region.

This is full screen, so just hit the back button or the link in the upper right hand corner that says “back to FTDNA” to return to your personal page.

Walk Through

Family Tree DNA has provided a walk-through of the new features.

Methodology

How did Family Tree DNA come up with these new regional and population cluster matches?

As we know, all of humanity came originally from Africa, and all of humanity that settled outside of Africa came through the Middle East.  People left the Middle East in groups, it would appear, and lived as isolated populations for some time in different parts of the world.  As they did, they developed mutations that are found only in that region, or are found much more frequently in that region as opposed to elsewhere.  Patterns of mutations like this are established, and when one of us matches those patterns, it’s determined that we have ancestry, either recent or perhaps ancient, from that region of the world.

The key to this puzzle is to find enough differentiation to be able to isolate or identify one group from another.  Of course, the groups eventually interbred, at least most of them did, which makes this even more challenging.

Family Tree DNA says in their paper describing the population clusters:

MyOrigins attempts to reduce the wild complexity of your genealogy to the major historical-genetic themes which arc through the life of our species since its emergence 100,000 years ago on the plains of Africa. Each of our 22 clusters describe a vivid and critical color on the palette from which history has drawn the brushstrokes which form the complexity that is your own genome. Though we are all different and distinct, we are also drawn from the same fundamental elements.

The explanatory narratives in myOrigins attempt to shed some detailed light upon each of the threads which we have highlighted in your genetic code. Though the discrete elements are common to all humans, the weight you give to each element is unique to you. Each individual therefore receives a narrative fabric tailored to their own personal history, a story stitched together from bits of DNA.

They have also provided a white paper about their methodology that provides more information.

After reading both of these documents, I much prefer the explanations provided for each cluster in the white paper over the shorter population cluster paper.  The longer version breaks the history down into relevant pieces and describes the earliest history and migrations of the various groups.

I was pleased to see the methodology that they used and that four different reference data bases were utilized.

  • GeneByGene DNA customer database
  • Human Genome Diversity Project
  • International HapMap Project
  • Estonian Biocentre

Given this wealth of resources, I was very surprised to see how few members of some references populations were utilized.

Population N Population N
Armenian 46 Lithuanian 6
Ashkenazi 60 Masai 140
British 39 Mbuti 15
Burmese 8 Moroccan 7
Cambodian 26 Mozabite 24
Danish 13 Norwegian 17
Filipino 20 Pashtun 33
Finnish 49 Polish 35
French 17 Portuguese 25
German 17 Russian 41
Gujarati 31 Saudi 19
Iraqi 12 Scottish 43
Irish 45 Slovakian 12
Italian 30 Spanish 124
Japanese 147 Surui 21
Karitiana 23 Swedish 33
Korean 15 Ukrainian 10
Kuwaiti 14 Yoruba 136

In particular, the areas of France, Germany, Norway, Slovakia, Denmark and the Ukraine appear to be very under-represented, especially given Family Tree DNA’s very heavy European-origin customer base .  I would hope that one of the priorities would be to expand this reference data base substantially.  Furthermore, I don’t see any New World references included here which calls into question Native American ancestry.

Webinar

Family Tree DNA typically provides a webinar for new products as well as general education.  The myOrigins webinar can be found in the archives at this link.  It can be viewed any time.  https://www.familytreedna.com/learn/ftdna/webinars/

Accuracy

How did they do?  Certainly, Family Tree DNA has a great new interface with wonderful new maps and comparison features.  Let’s take a look at accuracy and see if everything makes sense.

I am fortunate to have the DNA of one of my parents, my mother.  In the chart below, I’m comparing that result and inferring my father’s results by subtracting mine from my mother’s.  This may not be entirely accurate, because this presumes I received the full amount of that ethnicity from my mother, and that is probably not accurate – but – it’s the best I can do under the circumstances.  It’s safe to say that my father has a minimum of this amount of that particular population category and may have more.

Region Me Mom Dad Inferred Minimum
European Coastal Plain 68 17 51
European Northlands 12 7 5
Trans Ural Peneplain 11 10 1
European Coastal Islands 7 34 0
Anatolia and Caucus 3 0 3
North Mediterranean 0 34 0
Circumpolar 0 1 0
Undetermined* 0 0 40

*The Undetermined category is not from Family Tree DNA, but is the percentage of my father not accounted for by inference.  This 40% is DNA that I did not inherit if it falls into a different category.

Based on these results alone, I have the following observations.

    1. I find it odd that my mother has 34% North Mediterranean and I have none. We have no known ancestry from this region.
    2. My mother does have one distant line of Turkish DNA via France. I have presumed that my Middle Eastern (now Anatolia and Caucus) was through that line, but these results suggest otherwise.
    3. My mother’s Circumpolar may be Native American. She does have proven Native lines (Micmac) through the Acadian families.
    4. These results have missed both my Native lines (through both parents) and my African admixture although both are small percentages.
    5. The European Coastal Plain is one of the groups that covers nearly all of Europe. Given that my mother is 3/4th Dutch/German, with the balance being Acadian, Native and English, one would expect her to have significantly more, especially given my high percentage.
    6. The European Coastal Island percentages are very different for me and my mother, with me carrying much less than my mother.  This is curious, because she is 3/4th German/Dutch with between 1/8th and 3/16th English while my father’s lines are heavily UK.  My father’s ancestry may well be reflected in European Coastal Plain which covers a great deal of territory.

What We Need to Remember

All of the biogeographic tools, from Family Tree DNA, 23andMe and Ancestry, are “estimates” and each of the tools from the three major vendors rend different results.  Each one is using different combinations of reference populations, so this really isn’t surprising.  Hopefully, as the various companies increase their population references and the size of their reference data bases, the results will increasingly mesh from company to company.  These results are only as good as the back end tools and the DNA that you randomly inherited from your ancestors.

Furthermore, we all carry far more similar DNA than different DNA, so it’s extremely difficult to make judgment calls based on ranges.  Europe, for example, is extremely admixed and the US is moreso.  The British Isles were a destination location for many groups over thousands of years.  Some of the DNA being picked up by these tests may indeed be very ancient and may cause us to wonder where it came from.  In future test versions, this may be more perfectly refined.

There is no way to gauge “ancient” DNA, like from the Middle East Diaspora, from more contemporary DNA, only a thousand years or so old, once it’s in very small segments.  In other words, it’s all very individual and personal and pretty much cast in warm jello.  We’ve come a long way, but we aren’t “there” yet.  However, without these tools and the vendors working to make them better, we’ll never get “there,” so keep that in mind.

While this makes great conversation today, and there is no question about accuracy in terms of majority ancestry/ethnicity, no one should make any sweeping conclusions based on this information.  This is not “cast in concrete” in the same way as Y DNA and mitochondrial haplogroups and STR markers.  Those are irrefutable – while biogeographical ethnicity remains a bit ethereal.

In summary, I would simply say that this tool can provide great hints and tips, especially the matching, which is unique, but it can’t disprove anything.  The absence of minority admixture, which is what so many people are hunting for, may be the result of the various data bases and the infancy of the science itself, and not the absence of admixture.

My recommendation would be to utilize all three biogeographic admixture products as well as the free tools in the Admixture category at GedMatch.  Look for consistency in results between the tools.  I discussed this methodology in “The Autosomal Me” series.

What Next?

I asked Dr. David Mittelman, Chief Scientific Officer, at Family Tree DNA about the reference populations.  He indicated that he agreed that some of their reference populations are small and they are actively working to increase them.  He also stated that it is important to note that Family Tree DNA prioritized accuracy over false positives so they definitely took a conservative approach.

______________________________________________________________

Disclosure

I receive a small contribution when you click on some of the links to vendors in my articles. This does NOT increase the price you pay but helps me to keep the lights on and this informational blog free for everyone. Please click on the links in the articles or to the vendors below if you are purchasing products or DNA testing.

Thank you so much.

DNA Purchases and Free Transfers

Genealogy Services

Genealogy Research

2013’s Dynamic Dozen – Top Genetic Genealogy Happenings

dna 8 ball

Last year I wrote a column at the end of the year titled  “2012 Top 10 Genetic Genealogy Happenings.”  It’s amazing the changes in this industry in just one year.  It certainly makes me wonder what the landscape a year from now will look like.

I’ve done the same thing this year, except we have a dozen.  I couldn’t whittle it down to 10, partly because there has been so much more going on and so much change – or in the case of Ancestry, who is noteworthy because they had so little positive movement.

If I were to characterize this year of genetic genealogy, I would call it The Year of the SNP, because that applies to both Y DNA and autosomal.  Maybe I’d call it The Legal SNP, because it is also the year of law, court decisions, lawsuits and FDA intervention.  To say it has been interesting is like calling the Eiffel Tower an oversized coat hanger.

I’ll say one thing…it has kept those of us who work and play in this industry hopping busy!  I guarantee you, the words “I’m bored” have come out of the mouth of no one in this industry this past year.

I’ve put these events in what I consider to be relatively accurate order.  We could debate all day about whether the SNP Tsunami or the 23andMe mess is more important or relevant – and there would be lots of arguing points and counterpoints…see…I told you lawyers were involved….but in reality, we don’t know yet, and in the end….it doesn’t matter what order they are in on the list:)

Y Chromosome SNP Tsunami Begins

The SNP tsumani began as a ripple a few years ago with the introduction at Family Tree DNA of the Walk the Y program in 2007.  This was an intensively manual process of SNP discovery, but it was effective.

By the time that the Geno 2.0 chip was introduced in 2012, 12,000+ SNPs would be included on that chip, including many that were always presumed to be equivalent and not regularly tested.  However, the Nat Geo chip tested them and indeed, the Y tree became massively shuffled.  The resolution to this tree shuffling hasn’t yet come out in the wash.  Family Tree DNA can’t really update their Y tree until a publication comes out with the new tree defined.  That publication has been discussed and anticipated for some time now, but it has yet to materialize.  In the mean time, the volunteers who maintain the ISOGG tree are swamped, to say the least.

Another similar test is the Chromo2 introduced this year by Britain’s DNA which scans 15,000 SNPs, many of them S SNPs not on the tree nor academically published, adding to the difficulty of figuring out where they fit on the Y tree.  While there are some very happy campers with their Chromo2 results, there is also a great deal of sloppy science, reporting and interpretation of “facts” through this company.  Kind of like Jekyll and Hyde.  See the Sloppy Science section.

But Walk the Y, Chromo2 and Geno 2.0, are only the tip of the iceburg.  The new “full Y” sequencing tests brought into the marketspace quietly in early 2013 by Full Genomes and then with a bang by Family Tree DNA with the their Big Y in November promise to revolutionize what we know about the Y chromosome by discovering thousands of previously unknown SNPs.  This will in effect swamp the Y tree whose branches we thought were already pretty robust, with thousands and thousands of leaves.

In essence, the promise of the “fully” sequenced Y is that what we might term personal or family SNPs will make SNP testing as useful as STR testing and give us yet another genealogy tool with which to separate various lines of one genetic family and to ratchet down on the time that the most common recent ancestor lived.

http://dna-explained.com/2013/03/31/new-y-dna-haplogroup-naming-convention/

http://dna-explained.com/2013/11/10/family-tree-dna-announces-the-big-y/

http://dna-explained.com/2013/11/16/what-about-the-big-y/

http://www.yourgeneticgenealogist.com/2013/11/first-look-at-full-genomes-y-sequencing.html

http://cruwys.blogspot.com/2013/12/a-first-look-at-britainsdna-chromo-2-y.html

http://cruwys.blogspot.com/2013/11/yseqnet-new-company-offering-single-snp.html

http://cruwys.blogspot.com/2013/11/the-y-chromosome-sequence.html

http://cruwys.blogspot.com/2013/11/a-confusion-of-snps.html

http://cruwys.blogspot.com/2013/11/a-simplified-y-tree-and-common-standard.html

23andMe Comes Unraveled

The story of 23andMe began as the consummate American dotcom fairy tale, but sadly, has deteriorated into a saga with all of the components of a soap opera.  A wealthy wife starts what could be viewed as an upscale hobby business, followed by a messy divorce and a mystery run-in with the powerful overlording evil-step-mother FDA.  One of the founders of 23andMe is/was married to the founder of Google, so funding, at least initially wasn’t an issue, giving 23andMe the opportunity to make an unprecedented contribution in the genetic, health care and genetic genealogy world.

Another way of looking at this is that 23andMe is the epitome of the American Dream business, a startup, with altruism and good health, both thrown in for good measure, well intentioned, but poorly managed.  And as customers, be it for health or genealogy or both, we all bought into the altruistic “feel good” culture of helping find cures for dread diseases, like Parkinson’s, Alzheimer’s and cancer by contributing our DNA and responding to surveys.

The genetic genealogy community’s love affair with 23andMe began in 2009 when 23andMe started focusing on genealogy reporting for their tests, meaning cousin matches.  We, as a community, suddenly woke up and started ordering these tests in droves.  A few months later, Family Tree DNA also began offering this type of testing as well.  The defining difference being that 23andMe’s primary focus has always been on health and medical information with Family Tree DNA focused on genetic genealogy.  To 23andMe, the genetic genealogy community was an afterthought and genetic genealogy was just another marketing avenue to obtain more people for their health research data base.  For us, that wasn’t necessarily a bad thing.

For awhile, this love affair went along swimmingly, but then, in 2012, 23andMe obtained a patent for Parkinson’s Disease.  That act caused a lot of people to begin to question the corporate focus of 23andMe in the larger quagmire of the ethics of patenting genes as a whole.  Judy Russell, the Legal Genealogist, discussed this here.  It’s difficult to defend 23andMe’s Parkinson’s patent while flaying alive Myriad for their BRCA patent.  Was 23andMe really as altruistic as they would have us believe?

Personally, this event made me very nervous, but I withheld judgment.  But clearly, that was not the purpose for which I thought my DNA, and others, was being used.

But then came the Designer Baby patent in 2013.  This made me decidedly uncomfortable.  Yes, I know, some people said this really can’t be done, today, while others said that it’s being done anyway in some aspects…but the fact that this has been the corporate focus of 23andMe with their research, using our data, bothered me a great deal.  I have absolutely no issue with using this information to assure or select for healthy offspring – but I have a personal issue with technology to enable parents who would select a “beauty child,” one with blonde hair and blue eyes and who has the correct muscles to be a star athlete, or cheerleader, or whatever their vision of their as-yet-unconceived “perfect” child would be.  And clearly, based on 23andMe’s own patent submission, that is the focus of their patent.

Upon the issuance of the patent, 23andMe then said they have no intention of using it.  They did not say they won’t sell it.  This also makes absolutely no business sense, to focus valuable corporate resources on something you have no intention of using?  So either they weren’t being truthful, they lack effective management or they’ve changed their mind, but didn’t state such.

What came next, in late 2013 certainly points towards a lack of responsible management.

23andMe had been working with the FDA for approval the health and medical aspect of their product (which they were already providing to consumers prior to the November 22nd cease and desist order) for several years.  The FDA wants assurances that what 23andMe is telling consumers is accurate.  Based on the letter issued to 23andMe on November 22nd, and subsequent commentary, it appears that both entities were jointly working towards that common goal…until earlier this year when 23andMe mysteriously “somehow forgot” about the FDA, the information they owed them, their submissions, etc.  They also forgot their phone number and their e-mail addresses apparently as well, because the FDA said they had heard nothing from them in 6 months, which backdates to May of 2013.

It may be relevant that 23andMe added the executive position of President and filled it in June of 2013, and there was a lot of corporate housecleaning that went on at that time.  However, regardless of who got housecleaned, the responsibility for working with the FDA falls squarely on the shoulders of the founders, owners and executives of the company.  Period.  No excuses.  Something that critically important should be on the agenda of every executive management meeting.   Why?  In terms of corporate risk, this was obviously a very high risk item, perhaps the highest risk item, because the FDA can literally shut their doors and destroy them.  There is little they can do to control or affect the FDA situation, except to work with the FDA, meet deadlines and engender goodwill and a spirit of cooperation.  The risk of not doing that is exactly what happened.

It’s unknown at this time if 23andMe is really that corporately arrogant to think they could simply ignore the FDA, or blatantly corporately negligent or maybe simply corporately stupid, but they surely betrayed the trust and confidence of their customers by failing to meet their commitments with and to the FDA, or even communicate with them.  I mean, really, what were they thinking?

There has been an outpouring of sympathy for 23andme and negative backlash towards the FDA for their letter forcing 23andMe to stop selling their offending medical product, meaning the health portion of their testing.  However, in reality, the FDA was only meting out the consequences that 23andMe asked for.  My teenage kids knew this would happen.  If you do what you’re not supposed to….X, Y and Z will, or won’t, happen.  It’s called accountability.  Just ask my son about his prom….he remembers vividly.  Now why my kids, or 23andMe, would push an authority figure to that point, knowing full well the consequences, utterly mystifies me.  It did when my son was a teenager and it does with 23andMe as well.

Some people think that the FDA is trying to stand between consumers and their health information.  I don’t think so, at least not in this case.  Why I think that is because the FDA left the raw data files alone and they left the genetic genealogy aspect alone.  The FDA knows full well you can download your raw data and for $5 process it at a third party site, obtaining health related genetic information.  The difference is that Promethease is not interpreting any data for you, only providing information.

There is some good news in this and that is that from a genetic genealogy perspective, we seem to be safe, at least for now, from government interference with the testing that has been so productive for genetic genealogy.  The FDA had the perfect opportunity to squish us like a bug (thanks to the opening provided by 23andMe,) and they didn’t.

The really frustrating aspect of this is that 23andMe was a company who, with their deep pockets in Silicon Valley and other investors, could actually afford to wage a fight with the FDA, if need be.  The other companies who received the original 2010 FDA letter all went elsewhere and focused on something else.  But 23andMe didn’t, they decided to fight the fight, and we all supported their decision.  But they let us all down.  The fight they are fighting now is not the battle we anticipated, but one brought upon themselves by their own negligence.  This battle didn’t have to happen, and it may impair them financially to such a degree that if they need to fight the big fight, they won’t be able to.

Right now, 23andMe is selling their kits, but only as an ancestry product as they work through whatever process they are working through with the FDA.  Unfortunately, 23andMe is currently having some difficulties where the majority of matches are disappearing from some testers records.  In other cases, segments that previously matched are disappearing.  One would think, with their only revenue stream for now being the genetic genealogy marketspace that they would be wearing kid gloves and being extremely careful, but apparently not.  They might even consider making some of the changes and enhancements we’ve requested for so long that have fallen on deaf ears.

One thing is for sure, it will be extremely interesting to see where 23andMe is this time next year.  The soap opera continues.

I hope for the sake of all of the health consumers, both current and (potentially) future, that this dotcom fairy tale has a happy ending.

Also, see the Autosomal DNA Comes of Age section.

http://dna-explained.com/2013/10/05/23andme-patents-technology-for-designer-babies/

http://www.thegeneticgenealogist.com/2013/10/07/a-new-patent-for-23andme-creates-controversy/

http://dna-explained.com/2013/11/13/genomics-law-review-discusses-designing-children/

http://www.thegeneticgenealogist.com/2013/06/11/andy-page-fills-new-president-position-at-23andme/

http://dna-explained.com/2013/11/25/fda-orders-23andme-to-discontinue-testing/

http://dna-explained.com/2013/11/26/now-what-23andme-and-the-fda/

http://dna-explained.com/2013/12/06/23andme-suspends-health-related-genetic-tests/

http://www.legalgenealogist.com/blog/2013/11/26/fooling-with-fda/

Supreme Court Decision – Genes Can’t Be Patented – Followed by Lawsuits

In a landmark decision, the Supreme Court determined that genes cannot be patented.  Myriad Genetics held patents on two BRCA genes that predisposed people to cancer.  The cost for the tests through Myriad was about $3000.  Six hours after the Supreme Court decision, Gene By Gene announced that same test for $995.  Other firms followed suit, and all were subsequently sued by Myriad for patent infringement.  I was shocked by this, but as one of my lawyer friends clearly pointed out, you can sue anyone for anything.  Making it stick is yet another matter.  Many firms settle to avoid long and very expensive legal battles.  Clearly, this issue is not yet resolved, although one would think a Supreme Court decision would be pretty definitive.  It potentially won’t be settled for a long time.

http://dna-explained.com/2013/06/13/supreme-court-decision-genes-cant-be-patented/

http://www.legalgenealogist.com/blog/2013/06/14/our-dna-cant-be-patented/

http://dna-explained.com/2013/09/07/message-from-bennett-greenspan-free-my-genes/

http://www.thegeneticgenealogist.com/2013/06/13/new-press-release-from-dnatraits-regarding-the-supreme-courts-holding-in-myriad/

http://www.legalgenealogist.com/blog/2013/08/18/testing-firms-land-counterpunch/

http://www.legalgenealogist.com/blog/2013/07/11/myriad-sues-genetic-testing-firms/

Gene By Gene Steps Up, Ramps Up and Produces

As 23andMe comes unraveled and Ancestry languishes in its mediocrity, Gene by Gene, the parent company of Family Tree DNA has stepped up to the plate, committed to do “whatever it takes,” ramped up the staff both through hiring and acquisitions, and is producing results.  This is, indeed, a breath of fresh air for genetic genealogists, as well as a welcome relief.

http://dna-explained.com/2013/08/07/gene-by-gene-acquires-arpeggi/

http://dna-explained.com/2013/12/05/family-tree-dna-listens-and-acts/

http://dna-explained.com/2013/12/10/family-tree-dnas-family-finder-match-matrix-released/

http://www.haplogroup.org/ftdna-family-finder-matches-get-new-look/

http://www.haplogroup.org/ftdna-family-finder-new-look-2/

http://www.haplogroup.org/ftdna-family-finder-matches-new-look-3/

Autosomal DNA Comes of Age

Autosomal DNA testing and analysis has simply exploded this past year.  More and more people are testing, in part, because Ancestry.com has a captive audience in their subscription data base and more than a quarter million of those subscribers have purchased autosomal DNA tests.  That’s a good thing, in general, but there are some negative aspects relative to Ancestry, which are in the Ancestry section.

Another boon to autosomal testing was the 23andMe push to obtain a million records.  Of course, the operative word here is “was” but that may revive when the FDA issue is resolved.  One of the down sides to the 23andMe data base, aside from the fact that it’s not genealogist friendly, is that so many people, about 90%, don’t communicate.  They aren’t interested in genealogy.

A third factor is that Family Tree DNA has provided transfer ability for files from both 23andMe and Ancestry into their data base.

Fourth is the site, GedMatch, at www.gedmatch.com which provides additional matching and admixture tools and the ability to match below thresholds set by the testing companies.  This is sometimes critically important, especially when comparing to known cousins who just don’t happen to match at the higher thresholds, for example.  Unfortunately, not enough people know about GedMatch, or are willing to download their files.  Also unfortunate is that GedMatch has struggled for the past few months to keep up with the demand placed on their site and resources.

A great deal of time this year has been spent by those of us in the education aspect of genetic genealogy, in whatever our capacity, teaching about how to utilize autosomal results. It’s not necessarily straightforward.  For example, I wrote a 9 part series titled “The Autosomal Me” which detailed how to utilize chromosome mapping for finding minority ethnic admixture, which was, in my case, both Native and African American.

As the year ends, we have Family Tree DNA, 23andMe and Ancestry who offer the autosomal test which includes the relative-matching aspect.  Fortunately, we also have third party tools like www.GedMatch.com and www.DNAGedcom.com, without which we would be significantly hamstrung.  In the case of DNAGedcom, we would be unable to perform chromosome segment matching and triangulation with 23andMe data without Rob Warthen’s invaluable tool.

http://dna-explained.com/2013/06/21/triangulation-for-autosomal-dna/

http://dna-explained.com/2013/07/13/combining-tools-autosomal-plus-y-dna-mtdna-and-the-x-chromosome/

http://dna-explained.com/2013/07/26/family-tree-dna-levels-the-playing-field-sort-of/

http://dna-explained.com/2013/08/03/kitty-coopers-chromsome-mapping-tool-released/

http://dna-explained.com/2013/09/29/why-dont-i-match-my-cousin/

http://dna-explained.com/2013/10/03/family-tree-dna-updates-family-finder-and-adds-triangulation/

http://dna-explained.com/2013/10/21/why-are-my-predicted-cousin-relationships-wrong/

http://dna-explained.com/2013/12/05/family-tree-dna-listens-and-acts/

http://dna-explained.com/2013/12/09/chromosome-mapping-aka-ancestor-mapping/

http://dna-explained.com/2013/12/10/family-tree-dnas-family-finder-match-matrix-released/

http://dna-explained.com/2013/12/15/one-chromosome-two-sides-no-zipper-icw-and-the-matrix/

http://dna-explained.com/2013/06/02/the-autosomal-me-summary-and-pdf-file/

DNAGedcom – Indispensable Third Party Tool

While this tool, www.dnagedcom.com, falls into the Autosomal grouping, I have separated it out for individual mention because without this tool, the progress made this year in autosomal DNA ancestor and chromosomal mapping would have been impossible.  Family Tree DNA has always provided segment matching boundaries through their chromosome browser tool, but until recently, you could only download 5 matches at a time.  This is no longer the case, but for most of the year, Rob’s tool saved us massive amounts of time.

23andMe does not provide those chromosome boundaries, but utilizing Rob’s tool, you can obtain each of your matches in one download, and then you can obtain the list of who your matches match that is also on your match list by requesting each of those files separately.  Multiple steps?  Yes, but it’s the only way to obtain this information, and chromosome mapping without the segment data is impossible

A special hats off to Rob.  Please remember that Rob’s site is free, meaning it’s donation based.  So, please donate if you use the tool.

http://www.yourgeneticgenealogist.com/2013/01/brought-to-you-by-adoptiondna.html

I covered www.Gedmatch.com in the “Best of 2012” list, but they have struggled this year, beginning when Ancestry announced that raw data file downloads were available.  GedMatch consists of two individuals, volunteers, who are still struggling to keep up with the required processing and the tools.  They too are donation based, so don’t forget about them if you utilize their tools.

Ancestry – How Great Thou Aren’t

Ancestry is only on this list because of what they haven’t done.  When they initially introduced their autosomal product, they didn’t have any search capability, they didn’t have a chromosome browser and they didn’t have raw data file download capability, all of which their competitors had upon first release.  All they did have was a list of your matches, with their trees listed, with shakey leaves if you shared a common ancestor on your tree.  The implication, was, and is, of course, that if you have a DNA match and a shakey leaf, that IS your link, your genetic link, to each other.  Unfortunately, that is NOT the case, as CeCe Moore documented in her blog from Rootstech (starting just below the pictures) as an illustration of WHY we so desperately need a chromosome browser tool.

In a nutshell, Ancestry showed the wrong shakey leaf as the DNA connection – as proven by the fact that both of CeCe’s parents have tested at Ancestry and the shakey leaf person doesn’t match the requisite parent.  And there wasn’t just one, not two, but three instances of this.  What this means is, of course, that the DNA match and the shakey leaf match are entirely independent of each other.  In fact, you could have several common ancestors, but the DNA at any particular location comes only from one on either Mom or Dad’s side – any maybe not even the shakey leaf person.

So what Ancestry customers are receiving is a list of people they match and possible links, but most of them have no idea that this is the case, and blissfully believe they have found their genetic connection.  They have found a genealogical cousin, and it MIGHT be the genetic connection.  But then again, they could have found that cousin simply by searching for the same ancestor in Ancestry’s data base.  No DNA needed.

Ancestry has added a search feature, allowed raw data file downloads (thank you) and they have updated their ethnicity predictions.  The ethnicity predictions are certainly different, dramatically different, but equally as unrealistic.  See the Ethnicity Makeovers section for more on this.  The search function helps, but what we really need is the chromosome browser, which they have steadfastly avoided promising.  Instead, they have said that they will give us “something better,” but nothing has materialized.

I want to take this opportunity, to say, as loudly as possible, that TRUST ME IS NOT ACCEPTABLE in any way, shape or form when it comes to genetic matching.  I’m not sure what Ancestry has in mind by the way of “better,” but it if it’s anything like the mediocrity with which their existing DNA products have been rolled out, neither I nor any other serious genetic genealogist will be interested, satisfied or placated.

Regardless, it’s been nearly 2 years now.  Ancestry has the funds to do development.  They are not a small company.  This is obviously not a priority because they don’t need to develop this feature.  Why is this?  Because they can continue to sell tests and to give shakey leaves to customers, most of whom don’t understand the subtle “untruth” inherent in that leaf match – so are quite blissfully happy.

In years past, I worked in the computer industry when IBM was the Big Dog against whom everyone else competed.  I’m reminded of an old joke.  The IBM sales rep got married, and on his wedding night, he sat on the edge of the bed all night long regaling his bride in glorious detail with stories about just how good it was going to be….

You can sign a petition asking Ancestry to provide a chromosome browser here, and you can submit your request directly to Ancestry as well, although to date, this has not been effective.

The most frustrating aspect of this situation is that Ancestry, with their plethora of trees, savvy marketing and captive audience testers really was positioned to “do it right,” and hasn’t, at least not yet.  They seem to be more interested in selling kits and providing shakey leaves that are misleading in terms of what they mean than providing true tools.  One wonders if they are afraid that their customers will be “less happy” when they discover the truth and not developing a chromosome browser is a way to keep their customers blissfully in the dark.

http://dna-explained.com/2013/03/21/downloading-ancestrys-autosomal-dna-raw-data-file/

http://dna-explained.com/2013/03/24/ancestry-needs-another-push-chromosome-browser/

http://dna-explained.com/2013/10/17/ancestrys-updated-v2-ethnicity-summary/

http://www.thegeneticgenealogist.com/2013/06/21/new-search-features-at-ancestrydna-and-a-sneak-peek-at-new-ethnicity-estimates/

http://www.yourgeneticgenealogist.com/2013/03/ancestrydna-raw-data-and-rootstech.html

http://www.legalgenealogist.com/blog/2013/09/15/dna-disappointment/

http://www.legalgenealogist.com/blog/2013/09/13/ancestrydna-begins-rollout-of-update/

Ancient DNA

This has been a huge year for advances in sequencing ancient DNA, something once thought unachievable.  We have learned a great deal, and there are many more skeletal remains just begging to be sequenced.  One absolutely fascinating find is that all people not African (and some who are African through backmigration) carry Neanderthal and Denisovan DNA.  Just this week, evidence of yet another archaic hominid line has been found in Neanderthal DNA and on Christmas Day, yet another article stating that type 2 Diabetes found in Native Americans has roots in their Neanderthal ancestors. Wow!

Closer to home, by several thousand years is the suggestion that haplogroup R did not exist in Europe after the ice age, and only later, replaced most of the population which, for males, appears to have been primarily haplogroup G.  It will be very interesting as the data bases of fully sequenced skeletons are built and compared.  The history of our ancestors is held in those precious bones.

http://dna-explained.com/2013/01/10/decoding-and-rethinking-neanderthals/

http://dna-explained.com/2013/07/04/ancient-dna-analysis-from-canada/

http://dna-explained.com/2013/07/10/5500-year-old-grandmother-found-using-dna/

http://dna-explained.com/2013/10/25/ancestor-of-native-americans-in-asia-was-30-western-eurasian/

http://dna-explained.com/2013/11/12/2013-family-tree-dna-conference-day-2/

http://dna-explained.com/2013/11/22/native-american-gene-flow-europe-asia-and-the-americas/

http://dna-explained.com/2013/12/05/400000-year-old-dna-from-spain-sequenced/

http://www.thegeneticgenealogist.com/2013/10/16/identifying-otzi-the-icemans-relatives/

http://cruwys.blogspot.com/2013/12/recordings-of-royal-societys-ancient.html

http://cruwys.blogspot.com/2013/02/richard-iii-king-is-found.html

http://dna-explained.com/2013/12/22/sequencing-of-neanderthal-toe-bone-reveals-unknown-hominin-line/

http://dna-explained.com/2013/12/26/native-americans-neanderthal-and-denisova-admixture/

http://dienekes.blogspot.com/2013/12/ancient-dna-what-2013-has-brought.html

Sloppy Science and Sensationalist Reporting

Unfortunately, as DNA becomes more mainstream, it becomes a target for both sloppy science or intentional misinterpretation, and possibly both.  Unfortunately, without academic publication, we can’t see results or have the sense of security that comes from the peer review process, so we don’t know if the science and conclusions stand up to muster.

The race to the buck in some instances is the catalyst for this. In other cases, and not in the links below, some people intentionally skew interpretations and results in order to either fulfill their own belief agenda or to sell “products and services” that invariably report specific findings.

It’s equally as unfortunate that much of these misconstrued and sensationalized results are coming from a testing company that goes by the names of BritainsDNA, ScotlandsDNA, IrelandsDNA and YorkshiresDNA. It certainly does nothing for their credibility in the eyes of people who are familiar with the topics at hand, but it does garner a lot of press and probably sells a lot of kits to the unwary.

I hope they publish their findings so we can remove the “sloppy science” aspect of this.  Sensationalist reporting, while irritating, can be dealt with if the science is sound.  However, until the results are published in a peer-reviewed academic journal, we have no way of knowing.

Thankfully, Debbie Kennett has been keeping her thumb on this situation, occurring primarily in the British Isles.

http://dna-explained.com/2013/08/24/you-might-be-a-pict-if/

http://cruwys.blogspot.com/2013/12/the-british-genetic-muddle-by-alistair.html

http://cruwys.blogspot.com/2013/12/setting-record-straight-about-sara.html

http://cruwys.blogspot.com/2013/09/private-eye-on-britainsdna.html

http://cruwys.blogspot.com/2013/07/private-eye-on-prince-williams-indian.html

http://cruwys.blogspot.com/2013/06/britainsdna-times-and-prince-william.html

http://cruwys.blogspot.com/2013/03/sense-about-genealogical-dna-testing.html

http://cruwys.blogspot.com/2013/03/sense-about-genetic-ancestry-testing.html

Citizen Science is Coming of Age

Citizen science has been slowing coming of age over the past few years.  By this, I mean when citizen scientists work as part of a team on a significant discovery or paper.  Bill Hurst comes to mind with his work with Dr. Doron Behar on his paper, A Copernican Reassessment of the Human Mitochondrial DNA from its Root or what know as the RSRS model.  As the years have progressed, more and more discoveries have been made or assisted by citizen scientists, sometimes through our projects and other times through individual research.  JOGG, the Journal of Genetic Genealogy, which is currently on hiatus waiting for Dr. Turi King, the new editor, to become available, was a great avenue for peer reviewed publication.  Recently, research projects have been set up by citizen scientists, sometimes crowd-funded, for specific areas of research.  This is a very new aspect to scientific research, and one not before utilized.

The first paper below includes the Family Tree DNA Lab, Thomas and Astrid Krahn, then with Family Tree DNA and Bonnie Schrack, genetic genealogist and citizen scientist, along with Dr. Michael Hammer from the University of Arizona and others.

http://dna-explained.com/2013/03/26/family-tree-dna-research-center-facilitates-discovery-of-ancient-root-to-y-tree/

http://dna-explained.com/2013/04/10/diy-dna-analysis-genomeweb-and-citizen-scientist-2-0/

http://dna-explained.com/2013/06/27/big-news-probable-native-american-haplogroup-breakthrough/

http://dna-explained.com/2013/07/22/citizen-science-strikes-again-this-time-in-cameroon/

http://dna-explained.com/2013/11/30/native-american-haplogroups-q-c-and-the-big-y-test/

http://www.yourgeneticgenealogist.com/2013/03/citizen-science-helps-to-rewrite-y.html

Ethnicity Makeovers – Still Not Soup

Unfortunately, ethnicity percentages, as provided by the major testing companies still disappoint more than thrill, at least for those who have either tested at more than one lab or who pretty well know their ethnicity via an extensive pedigree chart.

Ancestry.com is by far the worse example, swinging like a pendulum from one extreme to the other.  But I have to hand it to them, their marketing is amazing.  When I signed in, about to discover that my results had literally almost reversed, I was greeted with the banner “a new you.”  Yea, a new me, based on Ancestry’s erroneous interpretation.  And by reversed, I’m serious.  I went from 80% British Isles to 6% and then from 0% Western Europe to 79%. So now, I have an old wrong one and a new wrong one – and indeed they are very different.  Of course, neither one is correct…..but those are just pesky details…

23andMe updated their ethnicity product this year as well, and fine tuned it yet another time.  My results at 23andMe are relatively accurate.  I saw very little change, but others saw more.  Some were pleased, some not.

The bottom line is that ethnicity tools are not well understood by consumers in terms of the timeframe that is being revealed, and it’s not consistent between vendors, nor are the results.  In some cases, they are flat out wrong, as with Ancestry, and can be proven.  This does not engender a great deal of confidence.  I only view these results as “interesting” or utilize them in very specific situations and then only using the individual admixture tools at www.Gedmatch.com on individual chromosome segments.

As Judy Russell says, “it’s not soup yet.”  That doesn’t mean it’s not interesting though, so long as you understand the difference between interesting and gospel.

http://dna-explained.com/2013/08/05/autosomal-dna-ancient-ancestors-ethnicity-and-the-dandelion/

http://dna-explained.com/2013/10/04/ethnicity-results-true-or-not/

http://www.legalgenealogist.com/blog/2013/09/15/dna-disappointment/

http://cruwys.blogspot.com/2013/09/my-updated-ethnicity-results-from.html?utm_source=feedburner&utm_medium=email&utm_campaign=Feed%3A+Cruwysnews+%28Cruwys+news%29

http://dna-explained.com/2013/10/17/ancestrys-updated-v2-ethnicity-summary/

http://dna-explained.com/2013/10/19/determining-ethnicity-percentages/

http://www.thegeneticgenealogist.com/2013/09/12/ancestrydna-launches-new-ethnicity-estimate/

http://cruwys.blogspot.com/2013/12/a-first-look-at-chromo-2-all-my.html

Genetic Genealogy Education Goes Mainstream

With the explosion of genetic genealogy testing, as one might expect, the demand for education, and in particular, basic education has exploded as well.

I’ve written a 101 series, Kelly Wheaton wrote a series of lessons and CeCe Moore did as well.  Recently Family Tree DNA has also sponsored a series of free Webinars.  I know that at least one book is in process and very near publication, hopefully right after the first of the year.  We saw several conferences this year that provided a focus on Genetic Genealogy and I know several are planned for 2014.  Genetic genealogy is going mainstream!!!  Let’s hope that 2014 is equally as successful and that all these folks asking for training and education become avid genetic genealogists.

http://dna-explained.com/2013/08/10/ngs-series-on-dna-basics-all-4-parts/

https://sites.google.com/site/wheatonsurname/home

http://www.yourgeneticgenealogist.com/2012/08/getting-started-in-dna-testing-for.html

http://dna-explained.com/2013/12/17/free-webinars-from-family-tree-dna/

http://www.thegeneticgenealogist.com/2013/06/09/the-first-dna-day-at-the-southern-california-genealogy-society-jamboree/

http://www.yourgeneticgenealogist.com/2013/06/the-first-ever-independent-genetic.html

http://cruwys.blogspot.com/2013/10/genetic-genealogy-comes-to-ireland.html

http://cruwys.blogspot.com/2013/03/wdytya-live-day-3-part-2-new-ancient.html

http://cruwys.blogspot.com/2013/03/who-do-you-think-you-are-live-day-3.html

http://cruwys.blogspot.com/2013/03/who-do-you-think-you-are-live-2013-days.html

http://genealem-geneticgenealogy.blogspot.com/2013/03/the-surnames-handbook-guide-to-family.html

http://www.isogg.org/wiki/Beginners%27_guides_to_genetic_genealogy

A Thank You in Closing

I want to close by taking a minute to thank the thousands of volunteers who make such a difference.  All of the project administrators at Family Tree DNA are volunteers, and according to their website, there are 7829 projects, all of which have at least one administrator, and many have multiple administrators.  In addition, everyone who answers questions on a list or board or on Facebook is a volunteer.  Many donate their time to coordinate events, groups, or moderate online facilities.  Many speak at events or for groups.  Many more write articles for publications from blogs to family newsletters.  Additionally, there are countless websites today that include DNA results…all created and run by volunteers, not the least of which is the ISOGG site with the invaluable ISOGG wiki.  Without our volunteer army, there would be no genetic genealogy community.  Thank you, one and all.

2013 has been a banner year, and 2014 holds a great deal of promise, even without any surprises.  And if there is one thing this industry is well known for….it’s surprises.  I can’t wait to see what 2014 has in store for us!!!  All I can say is hold on tight….

______________________________________________________________

Disclosure

I receive a small contribution when you click on some of the links to vendors in my articles. This does NOT increase the price you pay but helps me to keep the lights on and this informational blog free for everyone. Please click on the links in the articles or to the vendors below if you are purchasing products or DNA testing.

Thank you so much.

DNA Purchases and Free Transfers

Genealogy Services

Genealogy Research

Cherokee Mother of John Red Bank Payne

John Red Bank Payne

There is nothing I love more than a happy ending.  Second to that perhaps is to know that my blog or work helped someone, and in particularly, helped someone document their Native heritage.  In doing so, this confirms and unveils one more of our elusive Native people in early records.

I recently received a lovely thank you note from Shawn Potter.  We had exchanged notes earlier, after I wrote “The Autosomal Me” series, about how to utilize small segments of Native American (and Asian) DNA to identify Native American lines and/or ancestors.  This technique is called Minority Admixture Mapping (MAP) and was set forth in detail in various articles in the series.

Shawn’s note said:  “I’ve been doing more work on this segment and others following your method since we exchanged notes.  I’m pretty sure I’ve found the source of this Native American DNA — an ancestor named John Red Bank Payne who lived in North Georgia in the late 18th and 19th centuries.  Many of his descendants believe on the basis of circumstantial evidence that his mother was Cherokee.  I’ve found 10 descendants from four separate lines that inherited matching Native American DNA, pointing to one of his parents as the source.”

Along with this note, Shawn attached a beautiful 65 page book he had written for his family members which did document the Native DNA, but in the context of his family history.  He included their family story, the tales, the genealogical research, the DNA evidence and finally, a chapter of relevant Cherokee history complete with maps of the area where his ancestors lived. It’s a beautiful example of how to present something like this for non-DNA people to understand.  In addition, it’s also a wonderful roadmap, a “how to” book for how to approach this subject from a DNA/historical/genealogical perspective.  As hard as it is for me to sometimes remember, DNA is just a tool to utilize in the bigger genealogy picture.

Shawn has been gracious enough to allow me to reprint some of his work here, so from this point on, I’ll be extracting from his document.  Furthermore, Elizabeth Shown Mills would be ecstatic, because Shawn has fully documented and sourced his document.  I am not including that information here, but I’m sure he would gladly share the document itself with any interested parties.  You can contact Shawn at shpxlcp@comcast.net.

From the book, “Cherokee Mother of John Red Bank Payne” by Shawn Potter and Lois Carol Potter:

Descendants of John Red Bank Payne describe his mother as Cherokee. Yet, until now, some have questioned the truth of this claim because genealogists have been unable to identify John’s mother in contemporary records. A recent discovery, however, reveals both John Red Bank Payne and his sister Nancy Payne inherited Native American DNA.

Considering information from contemporary records, clues from local tradition, John’s name itself, and now the revelation that John and his sister inherited Native American DNA, there seems to be sufficient evidence to say John Red Bank Payne’s mother truly was Cherokee. The following summary describes what we know about John, his family, and his Native American DNA.

John Red Bank Payne was born perhaps near present-day Canton, Cherokee County, Georgia, on January 24, 1754, married Ann Henslee in Caswell County, North Carolina, on March 5, 1779, and died in Carnesville, Franklin County, Georgia, on December 14, 1831.

John’s father, Thomas Payne, was born in Westmorland County, Virginia, about 1725, and owned property in Halifax and Pittsylvania counties, Virginia, as well as Wilkes County, North Carolina, and Franklin County, Georgia.  Several factors suggest Thomas travelled with his older brother, William, to North Georgia and beyond, engaging in the deerskin trade with the Cherokee Nation during the mid 1700s. Thomas Payne died probably in Franklin County, Georgia, after February 23, 1811.

Contemporary records reveal Thomas had four children (William, John, Nancy, and Abigail) by his first wife, and nine children (Thomas, Nathaniel, Moses, Champness, Shrewsbury, Zebediah, Poindexter, Ruth, and Cleveland) by his second wife Yanaka Ayers.  Thomas married Yanaka probably in Halifax County, Virginia, before September 20, 1760.

Local North Georgia tradition identifies the first wife of Thomas Payne as a Cherokee woman. Anna Belle Little Tabor, in History of Franklin County, Georgia, wrote that “Trader Payne” managed a trading post on Payne’s Creek, and “one of his descendants, an offspring of his Cherokee marriage, later married Moses Ayers whose descendants still live in the county.”

Descendants of John Red Bank Payne also cite his name Red Bank, recorded in his son’s family Bible, as evidence of his Cherokee heritage.  Before the American Revolution, British Americans rarely defied English legal prohibitions against giving a child more than one Christian name.  So, the very existence of John’s name Red Bank suggests non-English ethnicity. On the other hand, many people of mixed English-Cherokee heritage were known by their Cherokee name as well as their English first and last names during this period.

Furthermore, while the form of John’s middle name is unlike normal English names, Red Bank conforms perfectly to standard Cherokee names.  It also is interesting to note, Red Bank was the name of a Cherokee village located on the south side of Etowah River to the southwest of present-day Canton, Cherokee County, Georgia.

While some believe the above information from contemporary records and clues from local tradition, as well as John’s name Red Bank, constitute sufficient proof of John’s Cherokee heritage, recently discovered DNA evidence confirms at least one of John’s parents had Native American ancestry. Ten descendants of John Red Bank Payne and his sister Nancy Payne, representing four separate lineages, inherited six segments of Native American DNA on chromosomes 2, 3, 5, 8, 13, and 18 (see Figure 1 for the relationship between these descendants; Figures 2-7 for images of their shared Native American DNA; and http://dna-explained.com/2013/06/02/the-autosomal-me-summary-and-pdf-file/ for an explanation of this method of identifying Native American chromosomal segments).

Upon careful reflection, there seems sufficient reason to believe John Red Bank Payne’s mother truly was Cherokee.

Roberta’s note:  I have redacted the surnames of current testers.

Payne chart

Chromosome 2, Segment 154-161

In this segment, Bert P, Rosa P, Nataan S, Cynthia S, and Kendall S inherited matching Native American DNA described as Amerindian, Siberian, Southeast Asian, and Oceanian by the Eurogenes V2 K15 admixture tool, and as North Amerind, Mesoamerican, South America Amerind, Arctic Amerind, East Siberian, Paleo Siberian, Samoedic, and East South Asian by the Magnus Ducatus Lituaniae Project World22 admixture tool. Since their common ancestors were Thomas Payne and his wife, the source of this Native American DNA must be either Thomas Payne or his wife. See Figures 2a-2g.

Note: Since Native Americans and East Asians share common ancestors in the pre-historic past, their DNA is similar to each other in many respects. This similarity often causes admixture tools to interpret Native American DNA as various types of East Asian DNA. Therefore, the presence of multiple types of East Asian DNA together with Native American DNA tends to validate the presence of Native American DNA.

Payne graph 1

Payne graph 2

Payne graph 3

Payne graph 4

Payne graph 5

Roberta’s Summary:  Shawn continues to document the other chromosome matches in the same manner.  In total, he has 10 descendants of Thomas Payne and his wife, who it turns out, indeed was Cherokee, as proven by this exercise in combination with historical records.  These people descend through 2 different children.  Cynthia and Kendall descend through daughter Nancy Payne, and the rest of the descendants descend through different children of John Red Bank Payne.  All of the DNA segments that Shawn utilized in his report share Native/Asian segments in both of these family groups, the descendants of both Nancy and John Red Bank Payne.

Shawn’s success in this project hinged on two things.  First, being able to test multiple (in this case, two) descendants of the original couple.  Second, he tested several people and had the tenacity to pursue the existence of Native DNA segments utilizing the Minority Admixture Mapping (MAP) technique set forth in “The Autosomal Me” series.  It certainly paid off.  Shawn confirmed that the wife of Thomas Payne was, indeed Native, most likely Cherokee since he was a Cherokee trader, and that today’s descendants do indeed carry her heritage in their DNA.

Great job Shawn!!  Wouldn’t you love to be his family member and one of the recipients of these lovely books about your ancestor! Someone’s going to have a wonderful Christmas!

______________________________________________________________

Disclosure

I receive a small contribution when you click on some of the links to vendors in my articles. This does NOT increase the price you pay but helps me to keep the lights on and this informational blog free for everyone. Please click on the links in the articles or to the vendors below if you are purchasing products or DNA testing.

Thank you so much.

DNA Purchases and Free Transfers

Genealogy Services

Genealogy Research

Determining Ethnicity Percentages

Recently, as a comment to one of my blog postings, someone asked how the testing companies can reach so far back in time and tell you about your ancestors.  Great question.

The tests that reliably reach the furthest back, of course, are the direct line Y-Line and mitochondrial DNA tests, but the commenter was really asking about the ethnicity predictions.  Those tests are known as BGA, or biogeographical ancestry tests, but most people just think of them or refer to them as the ethnicity tests.

Currently, Family Tree DNA, 23andMe and Ancestry.com all provide this function as a part of their autosomal product along with the Genographic 2.0 test.  In addition, third party tools available at www.gedmatch.com don’t provide testing, but allow you to expand what you can learn with their admixture tools if you upload your raw data files to their site.  I wrote about how to use these ethnicity tools in “The Autosomal Me” series.  I’ve also written about how accurate ethnicity predictions from testing companies are, or aren’t, here, here and here.

But today, I’d like to just briefly review the 3 steps in ethnicity prediction, and how those steps are accomplished.  It’s simple, really, in concept, but like everything else, the devil is in the details.devil

There are three fundamental steps.

  • Creation of the underlying population data base.
  • Individual DNA extraction.
  • Comparison to the underlying population data base.

Step 1:  Creation of the underlying population data base.

Don’t we wish this was as simple as it sounds.  It isn’t.  In fact, this step is the underpinnings of the accuracy of the ethnicity predictions.  The old GIGO (garbage in, garbage out) concept applies here.

How do researchers today obtain samples of what ancestral populations looked like, genetically?  Of course, the evident answer is through burials, but burials are not only few and far between, the DNA often does not amplify, or isn’t obtainable at all, and when it is, we really don’t have any way to know if we have a representative sample of the indigenous population (at that point in time) or a group of travelers passing through.  So, by and large, with few exceptions, ancient DNA isn’t a readily available option.

The second way to obtain this type of information is to sample current populations, preferably ones in isolated regions, not prone to in-movement, like small villages in mountain valleys, for example, that have been stable “forever.”  This is the approach the National Geographic Society takes and a good part of what the Genograpic Geno 2.0 project funding does.  Indigenous populations are in most cases our most reliable link to the past.  These resources, combined with what we know about population movement and history are very telling.  In fact, National Geographic included over 75,000 AIMs (Ancestrally Informative Markers) on the Geno 2.0 chip when it was released.

The third way to obtain this type of information is by inference.  Both Ancestry.com and 23andMe do some of this.  Ancestry released its V2 ethnicity updates this week, and as a part of that update, they included a white paper available to DNA participants.  In that paper, Ancestry discusses their process for utilizing contributed pedigree charts and states that, aside from immigrant locations, such as the United States and Canada, a common location for 4 grandparents is sufficient information to include that individuals DNA as “native” to that location.  Ancestry used 3000 samples in their new ethnicity predictions to cover 26 geographic locations.  That’s only 115 samples, on average, per location to represent all of that population.  That’s pretty slim pickins.  Their most highly represented area is Eastern Europe with 432 samples and the least represented is Mali with 16.  The regions they cover are shown below.

ancestry v2 8

Survey Monkey, a widely utilized web survey company, in their FAQ about Survey Size For Accuracy provides guidelines for obtaining a representative sample.  Take a look.  No matter which calculations you use relative to acceptable Margin of Error and Confidence Level, Ancestry’s sample size is extremely light.

23andMe states in their FAQ that their ethnicity prediction, called Ancestry Composition covers 22 reference populations and that they utilize public reference datasets in addition to their clients’ with known ancestry.

23andMe asks geographic ancestry questions of their customers in the “where are you from” survey, then incorporates the results of individuals with all 4 grandparents from a particular country.  One of the ways they utilize this data is to show you where on your chromosomes you match people whose 4 grandparents are from the same country.  In their tutorial, they do caution that just because a grandparent was born in a particular location doesn’t necessarily mean that they were originally from that location.  This is particularly true in the past few generations, since the industrial revolution.  However, it may still be a useful tool, when taken with the requisite grain of salt.

23andme 4 grandparents

The third way of creating the underlying population data base is to utilize academically published information or information otherwise available.  For example, the Human Genome Diversity Project (HGDP) information which represents 1050 individuals from 52 world populations is available for scrutiny.  Ancestry, in their paper, states that they utilized the HGDP data in addition to their own customer database as well as the Sorenson data, which they recently purchased.

Academically published articles are available as well.  Family Tree DNA utilizes 52 different populations in their reference data base.  They utilize published academic papers and the specific list is provided in their FAQ.

As you can see, there are different approaches and tools.  Depending on which of these tools are utilized, the underlying data base may look dramatically different, and the information held in the underlying data base will assuredly affect the results.

Step 2:  Your Individual DNA Extraction

This is actually the easy part – where you send your swab or spit off to the lab and have it processed.  All three of the main players utilize chip technology today.  For example, 23andMe focuses on and therefore utilizes medical SNPs, where Family Tree DNA actively avoids anything that reports medical information, and does not utilize those SNPs.

In Ancestry’s white paper, they provide an excellent graphic of how, at the molecular level, your DNA begins to provide information about the geographic location of your ancestors.  At each DNA location, or address, you have two alleles, one from each parent.  These alleles can have one of 4 values, or nucleotides, at each location, represented by the abbreviations T, A, C and G, short for Thymine, Adenine, Cytosine and Guanine.  Based on their values, and how frequently those values are found in comparison populations, we begin to fine correlations in geography, which takes us to the next step.

ancestry allele snps

Step 3:  Comparison to Underlying Population Data Base

Now that we have the two individual components in our recipe for ethnicity, a population reference set and your DNA results, we need to combine them.

After DNA extraction, your individual results are compared to the underlying data base.  Of course, the accuracy will depend on the quality, diversity, coverage and quantity of the underlying data base, and it will also depend on how many markers are being utilized or compared.

For example, Family Tree DNA utilizes about 295,000 out of 710,000 autosomal SNPs tested for ethnicity prediction.  Ancestry’s V1 product utilized about 30,000, but that has increased now to about 300,000 in the 2.0 version.

When comparing your alleles to the underlying data set one by one, patterns emerge, and it’s the patterns that are important.  To begin with, T, A, C and G are not absent entirely in any population, so looking at the results, it then becomes a statistics game.  This means that, as Ancestry’s graphic, above, shows, it becomes a matter of relativity (pardon the pun), and a matter of percentages.

For example, if the A allele above is shown is high frequencies in Eastern Europe, but in lower frequencies elsewhere, that’s good data, but may not by itself be relevant.  However if an entire segment of locations, like a street of DNA addresses, are found in high percentages in Eastern Europe, then that begins to be a pattern.  If you have several streets in the city of You that are from Eastern Europe, then that suggests strongly that some of your ancestors were from that region.

To show this in more detailed format, I’m shifting to the third party tool, GedMatch and one of their admixture tools.  I utilized this when writing the series, “The Autosomal Me” and in Part 2, “The Ancestor’s Speak,” I showed this example segment of DNA.

On the graph below, which is my chromosome painting of one a small part of one of my chromosomes on the top, and my mother’s showing the exact same segment on the bottom, the various types of ethnicity are colored, or painted.

The grid shows location, or address, 120 on the chromosome and each tick mark is another number, so 121, 122, etc.   It’s numbered so we can keep track of where we are on the chromosome.

You can readily see that both of us have a primary ethnicity of North European, shown by the teal.  This means that for this entire segment, the results are that our alleles are found in the highest frequencies in that region.

Gedmatch me mom

However, notice the South Asian, East Asian, Caucus, and North Amerindian. The important part to notice here, other than I didn’t inherit much of that segment at 123-127 from her, except for a small part of East Asian, is that these minority ethnicities tend to nest together.  Of course, this makes sense if you think about it.  Native Americans would carry Asian DNA, because that is where their ancestors lived.  By the same token, so would Germans and Polish people, given the history of invasion by the Mongols. Well, now, that’s kind of a monkey-wrench isn’t it???

This illustrates why the results may sometimes be confusing as well as how difficult it is to “identify” an ethnicity.  Furthermore, small segments such as this are often “not reported” by the testing companies because they fall under the “noise” threshold of between about 5 and 7cM, depending on the company, unless there are a lot of them and together they add up to be substantial.

In Summary

In an ideal world, we would have one resource that combines all of these tools.  Of course, these companies are “for profit,” except for National Geographic, and they are not going to be sharing their resources anytime soon.

I think it’s clear that the underlying data bases need to be expanded substantially.  The reliability of utilizing contributed pedigrees as representative of a population indigenous to an area is also questionable, especially pedigrees that only reach back two generations.

All of these tools are still in their infancy.  Both Ancestry and Family Tree DNA’s ethnicity tools are labeled as Beta.  There is useful information to be gleaned, but don’t take the results too seriously.  Look at them more as establishing a pattern.  If you want to take a deeper dive by utilizing your raw data and downloading it to GedMatch, you can certainly do so. The Autosomal Me series shows you how.

Just keep in mind that with ethnicity predictions, with all of the vendors, as is particularly evident when comparing results from multiple vendors, “your mileage may vary.”  Now you know why!

______________________________________________________________

Disclosure

I receive a small contribution when you click on some of the links to vendors in my articles. This does NOT increase the price you pay but helps me to keep the lights on and this informational blog free for everyone. Please click on the links in the articles or to the vendors below if you are purchasing products or DNA testing.

Thank you so much.

DNA Purchases and Free Transfers

Genealogy Services

Genealogy Research

Autosomal DNA, Ancient Ancestors, Ethnicity and the Dandelion

 dandelion 1

Understanding our own ancient DNA is a little different than contemporary DNA that we use for genealogy, but it’s a continuum between the two with a very long umbilical cord between them, then, and now.  And just when you think you’re about to understand autosomal DNA transmission and how it works, the subject of ancient DNA comes up.  This is particularly perplexing when all you wanted in the first place was a simple answer to the question, “who am I and who were my ancestors?”  Well, as you’re probably figured out by now, there is no simple answer.

Inheritance

In a nutshell – we know that every generation gets divided by 50% when we’re talking about autosomal DNA transmission.

So you inherit 50% of the DNA of each of your parents.  They inherited 50% of the DNA of each of their parents, so you inherit ABOUT 25% of the DNA of each of your grandparents.

Did you see that word, about?  It’s important, because while you do inherit exactly 50% of the DNA of each parent, you don’t inherit exactly 25% of the DNA of each grandparent.  You can inherit a little less or a little more from either grandparent as your parents 50% that you’re going to receive is in the mixer.

This is also true for the 12.5% of each of your great-grandparents, and the 6.25% of each of your great-great-grandparents, and so forth, on up the line.

The chart below shows the percentages that you share from each generation.

Relationship to You Approximate % Of Their DNA You Share
Parents Exactly 50%
Grandparents 25
Great-grandparents 12.5
Great-great-grandparents 6.25
Great-great-great-grandparents 3.125
Great-great-great-great-grandparents 1.5625

Ethnicity

So, here’s the question posed by people trying to understand their ethnicity.

If I have 3% Melanesian (or Middle Eastern, Indo-Tibetan or fill-in-the-blank ethnicity), doesn’t that mean that one of my great-great-great-grandparents was Melanesian?

There are really two answers to this question.  (I can hear you groaning!!!)

If the amount is 25% (for example) and not very small amounts, then the answer would be yes, that is very likely what this is telling you.  Or maybe it’s telling you that you have two different great-grandparents who have 12.5 each – but those relatives are fairly close in time due to the amount of DNA that came from that region.  See, that was easy.

However, the answer changes when we’re down in the very small percentages, below 5%, often in the 1 and 2% range.  This answer isn’t nearly as straightforward.

The Dandelion – Your Ancestor

The answer is the dandelion.

dandelion 2

The dandelion is one of your ancestors who lived in the Middle East, let’s say, 20,000 years ago, maybe 30,000 years ago.  In case you’re counting generations, that is 800 to 1200 generations ago.  The percentage of DNA you would carry from a single ancestor who lived 20,000 years ago, assuming you only descended from that ancestor 1 time, is infinitesimally small.  There are more zeroes following that decimal point than I have patience to type.  Let’s call that ancestor Xenia and let’s say she is a female.

However, you did inherit DNA from many of your ancestors who lived 20,000 years ago, thousands of them, because all of them, through their descendants, make up the DNA you carry today.  So infinitesimally small or not, you do carry some of the DNA of some of those ancestors.  It’s just broken into extremely small pieces today and their individual contributions to you may be extremely small.  You don’t carry any DNA from some of them, actually, probably most of them, due to the recombination event, dividing their DNA in half, happening 800 times, give or take.

Now, given that your ancestors’ DNA is divided in every generation by approximately half, and we know there are about 3 billion base pairs on all of your chromosomes combined, this means that by generation 32 or 33, on average, you carry 1 segment from this ancestor.  By generation 45, you carry, on average, .00017 segments of this ancestor’s DNA.  And for those math aficionados among us, this is the mathematical notation for how much of our ancestor’s DNA we carry after 800 generations: 4.4991E-232.

But, we also know that this dividing in half, on the average, doesn’t always work exactly that way in reality, because some of those ancestors from 20,000 years ago did in fact pass their DNA to you, despite the infinitesimal odds against that happening.  Some of their DNA was passed intact generation after generation, to you, and you carry it today.  The DNA contributed by any one ancestor from 800 generations ago is probably limited to one or two locations, or bases, but still, it’s there, and it’s the combined DNA of those ancient ancestors that make us who we are today.

The autosomal DNA of any specific ancestor from long ago is probably too small and fragmented to recognize as “theirs” and attribute to them.  Of course, the beauty of Y DNA and mitochondrial is that it is passed in tact for all of those generations.  But for autosomal DNA and genealogy, we need hundreds of thousands of DNA pieces in a row from a particular ancestor to be recognizable as “theirs.”  When we measure DNA for genealogy, what we are measuring is both centiMorgans, a measure of distance between chromosome positions (length) and the number of contiguous SNP (Single Nucleotide Polymorphism) base locations that match (quantity).  The values from these calculations tells us how closely we are related to people, because remember, DNA is divided in each generation so there is a mathematically predictable amount we will share with specific relatives.

Here is an example from a Family Finder comparison table showing both centiMorgans and matching SNPs with a second cousin.

family finder table

The matching threshold for genealogical significance is either 5 or 7 cM depending on which of the major companies you are using.  At Family Tree DNA, if you match above the threshold, then you can view down to 1cM, which is the case above.  Another match criteria is the number of SNPs, or locations, matching contiguously.  Anything below about 500-800 is considered to be a population match, not a genealogical match, unless you also have a significant number of genealogical matches at higher cMs and segments with this person.

OK, where is all of this going?

Dispersion

Think of your ancestor 20,000 years ago as the dandelion.  Now, blow.

dandelion 3

Xenia lived in the Middle East.  Where might her descendants land, over time, with every new generation?  In Europe?  In Asia?  In India?  In America via the Native Americans through Asia?  In North Africa?  Where?

So let’s say that groups of descendants settle across the globe.  Let’s say that her mitochondrial haplogroup is X.  Yes, haplogroup X is found both in Europe and in Asia and in the Native Americans, so this is actually a good example.  So Xenia carried mitochondrial haplogroup X and we know for sure via mitochondrial DNA testing that indeed, Xenia’s seeds were scattered to all of the winds.  The only place we haven’t found Xenia’s children is in Subsaharan Africa and the Australian archipelago, at least not yet.

Ok, so now that we know where her children and their children went, let’s go back to ancient DNA.

Predictive DNA

The way ethnicity is determined is by studying the frequency with which a specific allele or group of alleles is found in any particular population.  Two “pure” examples come to mind.

The first example is the Duffy Null allele that is only found in the Subsaharan African populations.  Currently this marker is found in about 68% of American blacks and in 88-100% of African blacks.  If you have the Duffy Null allele, you have African heritage.  Of course, you don’t know which line or which ancestor it came from, or how far back in time, but it assures you that you do in fact have African heritage.  It could have been from an ancestor long ago.  It could have been very recent.  This is one of the factors considered when determining percentage of ethnicity.

A second example is the STR marker known as D9S919 which is present in about 30% of the Native American people.  The value of 9 at this marker is not known to be present in any other ethnic group, so this mutation occurred after the Native people migrated across Beringia into the Americas, but long enough ago to be present in many descendants.  There is also no other known marker that is only found only among Native Americans, although I expect as we move into full genome sequencing we will discover more.  You can test this marker individually at Family Tree DNA, which is the only lab that offers this test.  If you have the value of 9 at this marker, it confirms Native heritage, but if you don’t carry 9, it does NOT disprove Native heritage.  After all, many Native people don’t carry it.  Again, you don’t know how long ago this marker was introduced into your ancestry.

These two examples are very unique because the markers are found only in certain groups.  Generally, with the rest of the DNA values, they are found in different amounts, or frequencies, in different parts of the world and ethnic groups.

So, if you’re trying to determine the ethnicity of an individual, you’re going to compile a huge data base of percentages of DNA values found of Ancestrally Informative Markers (AIMs) in different parts of the world.

So, you would compare the participant’s values against your data base and you will come up with those regions or ethnicities that are present most often in your comparison.  This is exactly what the products and services that provide you with your ethnicity percentages do – and how accurate the results are depend highly on the data base itself, the amount of data, and the quality of data.  Dare I mention Ancestry’s issue that they’ve had since they first began offering their autosomal product over a year ago where everyone seems to have Scandinavian ancestry?  Ancestry doesn’t share with us their sources, so as a community we have no idea how they have come up with these numbers.

You can easily compare your autosomal results in nauseating detail at both 23andMe and Family Tree DNA by testing with both companies, or by testing with either 23andMe or Ancestry and transferring your autosomal results to Family Tree DNA.  All 3 of these companies will give you a somewhat different result, but they should be in the same ballpark.  You can also then download your raw data file from any of those vendors and upload it to www.gedmatch.com where you can then do ethnicity comparisons using a variety of tools.  These tools, an example shown below, will have much more variance and detail than the vendor’s tools or results.  And because of that, they tend to be more confusing as well.

gedmatch example

Many people with small amounts of minority admixture are disappointed with the results through the vendors, especially if their Native American admixture doesn’t show.  I wrote extensively about this in my series, The Autosomal Me, so I won’t rehash it here, but using the GedMatch tools is very enlightening, as you can see above with my results.  And do I really have Indo-Tibetan and Indo-Iranian ancestors?

Where’s Xenia?

Back to Xenia and her descendants.  Let’s say that Xenia’s descendants settled in four primary locations.  One is in the Middle East – they never left home.  One is in Asia and from there, to the Americans to become the Native Americans and lastly, to Europe.  Now let’s say there is a pocket of them in the Altai region of Asia and a pocket in France.  The Altai is the ancestral home of the Native Americans and could explain the Indo-Tibet result, above.  We’ll call that Central Asia.  And France is where my Acadian ancestors were from.  Hmmm….this is getting confusing.  To make matters even more confusing, I might well descend from both groups, who originally descended from Xenia.

Let’s say that I do in fact carry small segments of Xenia’s DNA.  Now let’s say that this same DNA is found in a group of people in Central Asia, maybe in Tibet, it’s published in an obscure journal someplace, and it finds its way into a data base.  Voila – there you go – I now have a match in Central Asia in a place called Indo-Tibet.  But do I really?

Does this mean that my ancestor was from Central Asia?  Not necessarily.  And if so, maybe not recently, but the people from that location for some reason share some of the DNA that I carry.  The question of course is why, how and when?

What this really means to you is a matter of degrees.  If you have a few matches from obscure regions, along with very small percentages, it is likely a result of the dandelion’s dispersion.  If you have a lot of matches, meaning a high percentage hit rate, from a particular region, pay attention, it probably has some genealogical significance.

It’s no wonder people are confused by this!  Now, just think how many dandelions you have.  In 15 generations, you have 32,768 ancestors.  In fact, this is how we know for sure that we all descend from the same ancestor multiple times.  Our number of ancestors quickly exceeds the world population.  In 30 (25 years) generations, in about the year 1263, we reach about 1 billion ancestors.  In 1750, there were 791 million people on Earth, in 1600, 580 million, in 1500, 458 million and in 1000, 310 million.

Ancestors - Years

We know that we very likely descend several times from a much smaller group of ancestors from isolated local populations.  However, just looking at the 32,000+ ancestors in 15 generations, it’s still an entire dandelion field!!!

???????????????????????????????????????????????????????????????????????

______________________________________________________________

Disclosure

I receive a small contribution when you click on some of the links to vendors in my articles. This does NOT increase the price you pay but helps me to keep the lights on and this informational blog free for everyone. Please click on the links in the articles or to the vendors below if you are purchasing products or DNA testing.

Thank you so much.

DNA Purchases and Free Transfers

Genealogy Services

Genealogy Research

The Autosomal Me – The Holy Grail – Identifying Native Genealogy Lines

holy grail

Sangreal – the Holy Grail.  We are finally here, Part 9 and the final article in our series.  The entire purpose of The Autosomal Me series has been to use our DNA and the clues it holds to identify minority admixture, in this case, Native American, and by identifying those Native segments, and building chromosomal clusters, to identify the family lines that contributed that Native admixture.  Articles 1-8 in the series set the stage, explained the process and walked us through the preparatory steps.  In this last article, we apply all of the ingredients, fasten the lid, shake and see what we come up with.  Let’s take a minute and look at the steps that got us to this point.

Part 1 was “The Autosomal Me – Unraveling Minority Admixture” and Part 2 was “The Autosomal Me – The Ancestors Speak.”  Part 1 discussed the technique we are going to use to unravel minority ancestry, and why it works.  Part two gave an example of the power of fragmented chromosomal mapping and the beauty of the results.

Part 3, “The Autosomal Me – Who Am I?,” reviewed using our pedigree charts to gauge expected results and how autosomal results are put into population buckets.

Part 4, “The Autosomal Me – Testing Company Results,” shows what to expect from all of the major testing companies, past and present, along with Dr. Doug McDonald’s analysis.

In Part 5, “The Autosomal Me – Rooting Around in the Weeds Using Third Party Tools,” we looked at 5 different third party tools and what they can tell us about our minority admixture that is not reported by the major testing companies because the segments are too small and fragmented.

In Part 6, “The Autosomal Me – DNA Analysis – Splitting Up” we began the analysis part of the data we’ve been gathering.   We looked at how to determine whether minority admixture on specific chromosomes came from which parent.

Part 7, “The Autosomal Me – Start, Stop, Go – Identifying Native Chromosomal Segments” took a deeper dive and focused on the two chromosomes with proven Native heritage and began by comparing those chromosome segments using the 4 GedMatch admixture tools.

Part 8, “The Autosomal Me – Extracting Data Segments and Clustering,” we  extract all of the Native and Blended Asian segments in all 22 chromosomes, but only used chromosomes 1 and 2 for illustration purposes.  We then clustered the resulting data to look for trends, grouping clusters by either the Strong Native criteria or the Blended Asian criteria.

In this final segment, Part 9, we will be applying the chromosomal information we’ve gathered to our matches and determine which of our lines are the most likely to have Native Ancestry.  This, of course, has been the goal all along.  So, drum roll…..here we go.

In Part 8, we ended by entering the start and stop locations of both Strong Native and Blended Asian clusters into a table to facilitate easy data entry into the chromosome match spreadsheet downloaded from either 23andMe or Family Tree DNA.  If you downloaded it previously, you might want to download it again if you haven’t modified it, or download new matches since you last downloaded the spreadsheet and add them to the master copy.

My goal is to determine which matches and clusters indicate Native ancestry, and how to correlate those matches to lineage.  In other words, which family lines in my family were Native or carry Native heritage someplace.

The good news is that my mother’s line has proven Native heritage, so we can use her line as proof of concept.  My father’s family has so many unidentified wives, marginalized families and family secrets that the Native line could be almost any of them, or all of them!  Let’s see how that tree shakes out.

Finding Matches

So let’s look at a quick example of how this would work.  Let’s say I have a match, John, on chromosome 4 in an area where my mother has no Native admixture, but I do.  Therefore, since John does not match my mother, then the match came from my father and if we can identify other people who also match both John and I in that same region on that chromosome, they too have Native ancestry.  Let’s say that we all also share a common ancestor.  It stands to reason at that point, that the common ancestor between us indicates the Native line, because we all match on the Native segment and have the same ancestor.  Obviously, this would help immensely in identifying Native families and at least giving pointers in which direction to look.  This is a “best case’ example.  Some situations, especially where both parents contribute Native heritage to the same chromosome, won’t be this straightforward.

Based on our findings, the maximum range and minimum (least common denominator or “In Common” range is as follows for the strongest Native segments on chromosomes 1 and 2.

  Chromosome 1 Chromosome 2
Largest   Range 162,500,000   – 180,000,000 79,000,000   – 105,000,000
Smallest   Range 165,658,091   – 171,000,000 90,000,000   – 103,145,425

At GedMatch

At GedMatch, I used a comparison tool to see who matched me on chromosome 1.  Only 2 people outside of immediate family members matched, and both from Family Tree DNA.  Both matched me on the critical Native segments between about 165-180mg.  I was excited.  I went to Family Tree DNA and checked to see if these two people also matched my mother, which would confirm the Native connection, but neither did, indicating of course that these two people matched me on my father’s side.  That too is valuable information, but it didn’t help identify any common Native heritage with my mother on chromosome 1.  It did, however, eliminate them as possibilities which is valuable information as well.

DNAGedcom

I used a new tool, DNAGedcom, compliments of Rob Warthen who has created a website, DNA Tools, at www.dnagedcom.com.  This wonderful tool allows you to download all of your autosomal matches at Family Tree DNA and 23andMe along with their chromosomal segment matches.  Since my mother’s DNA has only been tested at Family Tree DNA, I’m limiting the download to those results for now, because what I need is to find the people who match both she and I on the critical segments of chromosome 1 or 2.

Working with the Download Spreadsheet

It was disappointing to discover that my mother and I had no common matches that fell into this range on chromosome 1, but chromosome 2 was another matter.  Please note that I have redacted match surnames for privacy.

step 9 table 1

The spreadsheet above shows the comparison of my matches (pink) and Mother’s (white).  The Native segment of chromosome 2 where I match Mother is shaded mustard.  I shaded the chromosome segments that fell into the “common match” range in green.  Of those matches, there is only one person who matches both Mother and I, Emma.  The next step, of course, is to contact Emma and see if we can discover our common ancestor, because whoever it is, that is the Native line.  As you might imagine, I am chomping at the bit.

There are no segments of chromosome 2 that are unquestionably isolated to my father’s line.

Kicking it up a Notch

Are you wondering about now how something that started out looking so simple got so complex?  Well, I am too, you’re not alone.  But we’ve come this far, so let’s go that final leg in this journey.  My mom always used to say there was no point in doing something at all if you weren’t going to do it right.  Sigh….OK Mom.

The easiest way to facilitate a chromosome by chromosome comparison with all of your matches and your Strong Native and Blended Asian segments is to enter all of these segment groups into the match spreadsheet.  If you’re groaning and your eyes glaze over right after you do one big ole eye roll, I understand.

But let’s take a look at how this helps us.

On the excerpt from my spreadsheet below, for a segment of chromosome 5, I have labeled the people and how they match to me.  The ones labeled “Mom” in the last column are labeled that way because these people match both Mom and I.  The ones labeled “Dad” are labeled that way because I know that person is related on my father’s side.

Using the information from the tables created in Step 8, I entered the beginning and end of all matching segment clusters into my spreadsheet.  You can see these entries on lines 7, 8, 22, 23 and 24.  You then proceed to colorize your matches based on the entry for either Mom or Dad – in other words the blue row or the purple row, line 7, 22 or 24.  In this example, actually, line 5 Rex, based on the coloration, should have been half blue and half purple, but we’ll discuss his case in a minute.

The you can then sort either by match name or by chromosome to view data in both ways.  Let’s look at an example of how this works.

Legend:

  • White Rows:  Mother’s matches.  When Mother and I both match an individual, you’ll see the same matches for me in pink.  This double match indicates that the match is to Mother’s side and not Father’s side.
  • Pink Rows:  My matches.
  • Purple “Mom” labels in last column:  The individual matches both me and Mom.  This is a genetic match.
  • Teal “Dad” labels in last column: Genealogically proven to be from my father’s side.  This is a genealogical, not a genetic label, since I don’t have Dad’s DNA and can only infer these genetically when they don’t also match Mother.
  • Dark Pink Rows labeled “Me Amerind Only” are Strong Native or Blended Asian segments from Chromosome Table that I have entered.  My segments must come from one of my parents, so I’ve either colored them purple, if the match is someone who matches Mother and I both, or teal, if they don’t match both Mom and I, so by inference they come from my father’s line.
  • Dark Purple Rows labeled “Mom Amerind Only” are Mom’s segments from the Chromosome Table.
  • Dark Teal Rows labeled “Dad Amerind Only” are inferred segments belonging to my father based on the fact that Mother and I don’t share them.

Inferred Relationships

This is a good place to talk for just a minute about inferred relationships in this context.  Inference gets somewhat tenuous or weak.  The inferred matches on my father’s side began with the Native segments in the admix tools.  Some inferences are very strong, where Mother has no Native at all in that region.  For example, Mom has European and I have Native American.  No question, this had to come from my father.  But other cases are much less straightforward.

In many cases, categorization may be the issue.  Mom has West Asian for example and I have Siberian or Beringian.  Is this a categorization issue or is this a real genetic difference, meaning that my Siberian/Beringian is actually Native and came from my father’s side?

Other cases of confusion arise from segment misreads, etc.  I’ve actually intentionally included a situation like this below, so we can discuss it.  Like all things, some amount of common sense has to enter the picture, and known relationships will also weigh heavily in the equation.  How known family members match on other chromosome segments is important too.  Do you see a pattern or is this match a one-time occurrence?  Patterns are important.

Keep in mind that these entries only reflect STRONG Asian or Native signals, not all signals.  So even if Mother doesn’t have a strong signal, it doesn’t mean that she doesn’t have ANY signal in that region.  In some cases, start and stop segments for Mom and Dad overlapped due to very long segments on some matches.  In this case, we have to rely on the fact that we do have Mother’s actual DNA and assume that if they aren’t also a match to Mother, that what we are seeing is actually Dad’s lines, although this may not in actuality always be true.  Why?  Because we are dealing with segments below the matching threshold limit at both Family Tree DNA and 23andMe, and both of my parents carry Native heritage.  We can also have crossed a transitional boundary where the DNA that is being matched switches from Mom’s side to Dad’s side.

Ugh, you say, now that’s getting messy.  Yes, it is, and it has complicated this process immensely.

The Nitty-Gritty Data Itself

step 9 table 2

Taking a look at this portion of chromosome 5, we have lots going on in this cluster.  Most segments will just be boring pink and white (meaning no Native), but this segment is very busy.  Mom and I match on a small segment from 52,000,000 to 53,000,000.  Indeed, this is a very short segment when compared to the entire chromosome, but it is strongly Native.  We both also match Rex, our known cousin.  I’ve noted him with yellow in the table. Please note that Mom’s white matches are never shaded.  I am focused on determining where my own segments originate, so coloring Mother’s too was only confusing.  Yes, I did try it.

You can see that Mother actually shares all or any part of her segment with only me and Rex.  This simplifies matters, actually.  However, also note that I carry a larger segment in this region than does Mother, so either we have a categorization issue, a misread, or my father also contributed.  So, a conundrum.  This very probably implies that my father also carried Native DNA in this region.

Let’s see what Rex’s DNA looks like on this same segment of chromosome 5, from 52-53 using Eurogenes.  In the graph below, my chromosome is the top bar, Rex’s the middle and the bottom bar shows common DNA with the black nonmatching.  Yellow is Native American, red is South Asian, putty is Siberian, lime green is Mediterranean, teal is North Europe, orange is Caucus.

Step 9 item 3

This same comparison is shown to Mother’s DNA (top row) below.

step 9 item 4

It’s interesting that while Mother doesn’t have a lot of yellow (Native), she does have it throughout the same segment where Rex’s occurs, from about 52 through 53.5.

Does this actually point to a Native ancestor in the common line between Rex, Mom and I, which is the Swiss/German Johann Michael Miller line which does include an unidentified wife stateside, or does this simply indicate a common ancient population long ago in Asia?  It’s hard to say and is deserving of more research.  I feel that it is most likely Native because of the actual yellow, Native segment. If this was an Asian/European artifact, it would be much less likely to carry the actual yellow segment.

Is Rex also genealogically related to my father?  As I’ve worked through this process with all of my chromosomes and matches, I’ve really come to question if one of my father’s dead ends is also an ancestral line of my mother’s.

The key to making sense of these results is clusters.

Clusters vs Singleton Outliers

The work we’ve already done, especially in Step 8, clusters the actual DNA matching segments.  We’ve now entered that information into the spreadsheet and colored the segments of those who match.  What’s next?

The key is to look for people with clusters.  Many matches will have one segment, of say, 10 that match, colored.  Unless this is part of a large chromosome cluster, it’s probably simply an outlier.  Part of a large chromosome cluster would be like the large Strong Native segments on chromosome 1 or 2, for example.  How do we tell if this is a valid match or just an outlier?

Sort the spreadsheet by match name.  Take a look at all of the segments.

The example we’ll use is that of my cousin, Rex.  If you recall, he matches both me and Mother, is a known first cousin twice removed to me, (genetically equal to a second cousin), and is descended from the Miller line.

In this example, I also colored Mother’s segments because I wanted to see which segments that I did not receive from her were also Native. You can see that there are many segments where we all match and several of those are Native.  These also match to other Miller descendants as well, so are strongly indicative of a Native connection someplace in our common line.

If we were only to see one Native segment, we would simply disregard this as an outlier situation.  But that’s not the case.  We see a cluster of matches on various segments, we match other cousins from the same line on these segments, and reverting back to the original comparison admixture tools verifies these matches are Native for Rex, Mom and me.

step 9 item 5

Hmmmm…..what is Dad’s blue segment color doing in there?  Remember I said that we are only dealing with strong match segments?  Well, Mom didn’t have a strong segment at that location and so we inferred that Dad did.  But we know positively that this match does come from Mother’s side.  I also mentioned that I’ve come to wonder if my Mom and Dad share a common line.  It’s the Miller line that’s in question.  One of Johann Michael Miller’s children, Lodowick, moved from Pennsylvania to Augusta County, Virginia in the 1700s and his line became Appalachian, winding up in many of the same counties as my father’s family.  I’m going to treat this as simply an anomaly for now, but it actually could be, in this case, an small indication that these lines might be related.  It also might be a weak “Mom” match, or irrelevant.  I see other “double entries” like this in other Miller cousins as well.

What is the pink row on chromosome 12?  When I grouped the Strong Native and Asian Clusters, sometimes I had a strong grouping, and Mom had some.  The way I determined Dad’s inferred share was to subtract what Mom had in those segments from mine.  In a few cases, Mom didn’t have enough segments to be considered a cluster but she had enough to prevent Dad from being considered a cluster either, so those are simply pink, me with no segment coloring for Mom or Dad.

Let’s say I carry Strong Native/Mixed Asian at the following 8 locations:

10, 12, 14, 16, 18, 20, 22, 24

This meets the criteria for 8 of 15 ethno-geographic locations (in the admix tools) within a 2.5 cM distance of each other, so this cluster would be included in the Mixed Asian for me.  It could also be a Strong Native cluster if it was found in 3 of 4 individual tools.  Regardless of how, it has been included.

Let’s now say that Mom carries Native/Mixed Asian at 10, 12 and 14, but not elsewhere in this cluster.

Mom’s 3 does not qualify her for the 8/15 and it only leaves Dad with 5 inferred segments, which disqualifies him too.  So in this case, my cluster would be listed, but not attributable directly to either parent.

What this really says is that both of my parents carry some Native/Blended Asian on this segment and we have to use other tools to extrapolate anything further.  The logic steps are the same as for Dad’s blue segment.  We’re going to treat that as an outlier.  If I really need to know, I can go back to the actual admixture tools and see whether Mom or Dad really match me strongly on which segments and how we compare to Rex as well.  In this case, it’s obvious that this is a match to my Mother’s side, so I’m leaving well enough alone.

Let’s see what the matches reveal.

Matches

Referring back to the Nitty Gritty Data spreadsheet, Mom’s match to Phyllis on row 15 confirms an Acadian line.  This is the known line of Mother’s Native ancestry.  This makes sense and they match on Native segments on several other chromosomes as well.  In fact, many of my and Mother’s matches have Acadian ancestry.

My match to row 19, Joy, is a known cousin on my father’s side with common Campbell ancestry.  This line is short however, because our common ancestor, believed to be Charles Campbell died before 1825 in Hawkins County, TN.  He was probably born before 1750, given that his sons were born about 1770 and 1772.  Joy and I descend from those 2 sons.  Charles wife and parents are unknown, as is his wife.

My match to row 20, inferred through my father’s side, is to a Sizemore, a line with genetically proven Native ancestry.  Of course, this needs more research, but it may be a large hint.  I also match with several other people who carry Sizemore ancestors.  This line appears to have originated near the NC/VA border.

I wanted to mention rows 4 and 17.  Using our rules for the spreadsheet, if I match someone and they don’t also match Mother on this segment, I have inferred them to be through my father.  These are two instances that this is probably incorrect.  I do match these people through Mother, but Mother didn’t carry a strong signal on this segment, so it automatically became inferred to Dad.  Remember, I’m only recording the Strong Native or the Blended Asian segments, not all segments.  However, I left the inferred teal so that you can see what kinds of judgment calls you’ll have to make.  This also illustrates that while Mom’s genetic matches are solid, Dad’s inferred matches are less so and sometimes require interpretation.  The proper thing to do in this instance would be to refer back to the original admixture tools themselves for clarification.

Let’s see what that shows.

step 9 item 6

Using HarrappaWorld, the most pronounced segment is at about 52.  Teal is American.  You can see that Mother has only a very small trace between 53 and 54, almost negligible.  Mother’s admixture at location 52 is two segments of purple, brown and cinnamon which translate to Southwest Asian (lt purple), Mediterranean (dk purple), Caucasian (brown) and Balock (cinnamon), from Pakistan.

Checking Dodecad shows pretty much the same thing, except Mother’s background there is South Asian, which could be the same thing as Caucus and Pakistan, just different categorizations.

In this case, it looks like the admixture is not a categorization issue, but likely did come from my father.  Each segment will really be a case by case call, with only the strongest segments across all tools being the most reliable.

It’s times like this that we have to remember that we have two halves of each chromosome and they carry vastly different information from each of our parents.  Determining which is which is not always easy.  If in doubt, disregard that segment.

Raw Numbers

So, what, really did I figure out after all of this?

First, let’s look at some numbers.

I was working with a total of 292 people who had at least one chromosomal segment that matched me with a Strong Native or Blended Asian segment.  Of those, 59 also matched Mom’s DNA.  Of those, 18 had segments that matched only Mom.  This means that some of them had segments that also matched my father.  Keep in mind, again, that we are only using “strong matches” which involves inferring Dad’s segments and that referring back to the original tools can always clarify the situation.  There seems to be some specific areas that are hotspots for Native ancestry where it appears that both of my parents passed Native ancestry to me.

Many of my and my mother’s 59 matches have Acadian ancestry which is not surprising as the Acadians intermarried heavily with the Native population as well as within their own ethnic group.

Several also have Miller Ancestry.  My Miller ancestor is Johann Michael Miller (1692-1771) who immigrated in the colonial period and settled on the Pennsylvania frontier.  His son, Philip Jacob Miller’s (1726-1799) wife was a woman named Magdalena whose last name has been rumored for years to be Rochette, but no trace of a Rochette family has ever been found in the county where they lived, region or Brethren church history…and it’s not for lack of looking.  Several matches point to Native Ancestry in this line.  This also begs the question of whether this is really Native or whether it is really the Asian heritage of the German people.  Further analysis, referring back to the admixture tools, suggests that this is actually Native. It’s also interesting that absolutely none of Mother’s other German or Dutch lines show this type of ancestry.

There is no suggestion of Native ancestry in any of her other lines.  Mother’s results are relatively clean.  Dad’s are anything but.

Dad’s Messy Matches

My father’s side of the family, however, is another story.

I have 233 matches that don’t also match my mother.  There can be some technical issues related to no-calls and such, but by and large, those would not represent many.  So we need to accept that most of my matches are from my Father’s side originating in colonial America.  This line is much “messier” than my mother’s, genealogically speaking.

Of those 233 matches, only 25 can be definitely assigned to my father.  By definitely assigned, I mean the people are my cousins or there is an absolutely solid genealogical match, not a distant match.  Why am I not counting distant matches in this total?  We all know by virtue of the AncestryDNA saga that just because we match family lines and DNA does NOT mean that the DNA match is the genealogical line we think it is.  If you would like to read all about this, please refer to the details in CeCe Moore’s blog where she discussed this phenomenon.  The relevant discussion begins just after the third photo in this article where she shows that 3 of 10 matches at Ancestry where they “identify” the common DNA ancestor are incorrect.  Of course, they never SAY that the common ancestor is the DNA match, but it’s surely inferred by the DNA match and the “leaf” connecting these 2 people to a common ancestor.  It’s only evident to someone who has tested at least one parent and is savvy enough to realize that the individual whose ancestor on Mom’s side that they have highlighted, isn’t a match to Mom too.  Oops.  Mega-oops!!!

However, because we are dealing in our project, on Dad’s side, with inferences, we’re treading on some of the same ground.  Also, because we are dealing with only “strong clustered” segments, not all Native or Asian segments and because it appears that my parents both have Native ancestry.  To make matters worse, they may both have Algonquian, Iroquoian or both.

I have also discovered during this process that several of my matches are actually related to both of my parents.  I told you this got complex.

Of the people who don’t match Mother, 32 of them have chromosomal matches only to my father, so those would be considered reliable matches, as would the closest ones of the 25 that can be identified genealogically as matching Dad.  Many of these 25 are cousins I specifically asked to test, and those people’s results have been indispensable in this process.

In fact, it’s through my close circle of cousins that we have been able to eliminate several lines as having Native ancestry, because it doesn’t’ show as strong and they don’t have it either.

Many of these lines group together when looking at a specific chromosome.  There is line after line and cousin after cousin with highlighted data.

Dad’s Native Ancestors

So what has this told me?  This information strongly suggests that the following lines on my father’s side carry Native heritage.  Note the word “carry.”  All we can say at this point is that it’s in the soup – and we can utilize current matches at our testing company and at GedMatch, genealogy research and future matches to further narrow the branches of the tree.  Many of these families are intermarried and I have tried to group them by marriage group.  Obviously, eventually, their descendants all intermarried because they are all my ancestors on my father’s side.  But multiple matches to other people who carry the Native markers but aren’t related to my other lines are what define these as lines carrying Native heritage someplace.

  • Campbell – Hawkins County, Tn around 1800, missing wife and parents, married into the Dodson family
  • Dodson – Hawkins County, Tn, Virginia – written record of Lazarus Dodson camping with the Cherokee – missing wife, married into the Campbell and Estes family
  • Claxton/Clarkson – Russell Co., Va, Claiborne and Hancock Co., Tn – In NC associated with the known Native Hatcher family.  Possibly a son-in-law.  Missing family entirely.
  • Cook – Russell Co., Va. – daughter married Claxton/Clarkson – missing wives
  • Harrold, Harrell, Herrell – Hancock Co., Tn., Wilkes Co., NC – missing wives
  • McDowell – Hancock Co. Tn, Wilkes Co., NC, Augusta Co., Va – married into the Harrell family, missing wife
  • McNeil, McNiel – Wilkes Co., NC – missing wives, married into the Vannoy family
  • Vannoy – Wilkes County – some wives unaccounted for pre-1800
  • Crumley – Greene County, Tn., Lee Co., Va. – oral history of Native wife, married into the Vannoy family
  • Brown – Greene County, Tn, Montgomery Co., Va – married into the Crumley family, missing wives

While this looks like a long list, the list of families that don’t have any Native ancestry represented is much longer and effectively serves to eliminate all of those lines.  While I don’t have “THE” answer, I certainly know where to focus my research.  Maybe there isn’t the one answer.  Maybe there are multiple answers, in multiple lines.

The Take Away

Is this complex?  Yes!  Is it a lot of work?  You bet it is!  Is everything cast in concrete?  Never!  You can see that by the differences we’ve found in data interpretation, not to mention issues like no-calls (areas that for some reason in the test don’t read) and cross overs where your inheritance switches from your mom’s side to your dad’s side.  Is there any other way to do this?  No, not if your minority admixture is down in that weedy area around 1%.

Is it worth it?  You’ll have to decide.  It guess it depends on how desperately you want to know.

Part of the reason this is difficult is because we are missing tools in critical locations.  It’s an intensively laborious manual process.  In essence, using various tools, one has to figure out the locations of the Native and Asian chromosome segments and then use that information to infer Native matches by a double match (genetic match at DNA company plus match with Strong Native/Blended Asian segment) with the right parent.  It becomes even more complex if neither parent is available for testing, but it is doable although I would think the reliability could drop dramatically.

Tidbits and Trivia

I’ve picked up a number of little interesting tidbits during this process.  These may or may not be helpful to you.  Just kind of file them away until needed:)

  • Matches at testing companies come and go….and sometimes just go.  At Family Tree DNA, I have some matches that must be trembling on the threshold that come and go periodically.  Now you see them, now you don’t.  I lost matches moving from the Affy chip to the Illumina chip and lost additional matches between Build 36 and 37.  Some reappeared, some haven’t.
  • The start and stop boundaries changed for some matches between build 36 and build 37.  I did not go back and readjust, as most of these, in the larger scheme of things, were minor.  Just understand that you are looking for  patterns here that indicate Native heritage, not exact measurements.  This process is a tool, and unfortunately, not a magic wand:)
  • The centromere locations change between builds.  If you have matches near or crossing the middle of the chromosome, called the centromere, there may be breaks in that region.  I enter the centromere start and stop locations in my spreadsheet so that if I notice something odd going on in that region, the centromere addresses are right there to alert me that I’m dealing with that “odd” region.  You can find the centromere addresses in the FAQ at Family Tree DNA for their current build.
  • At 23andMe, when you reach the magic 1000 matches threshold, you start losing matches and the matching criteria is elevated so that you can stay under 1000 matches.  For people with colonial American or Jewish heritage, in other words those with high numbers of matches, this is a problem.
  • Watch for matches that are related to both sides of your family.  If your family lived in colonial America, you’re going to have a lot of matches and many are probably related to each other in ways you aren’t aware of.
  • If your parents are related to each other, this process might simply be too complex and intertwined to provide enough granular data to be useful.
  • Endogamous groups are impossible to sort through as to where, meaning which ancestor, the DNA came from.  This is because the original group founders’ DNA is just getting passed around and around, with little or no new DNA being introduced.  The effect of this on downstream generations relative to genetic genealogy is that matches appear to be more closely related than they are because of the amount of matching DNA they carry.  For my Brethren and my Acadian groups of people, I just list them by the group name, since, as the saying goes, “if you’re related to one Acadian, you’re related to all Acadians.”
  • If you’re going to follow this procedure, save one spreadsheet copy with the Strong Native only and then a second one with both the Strong Native and Blended Asian.  I’m undecided truthfully whether the Mixed Asian adds enough resolution for the extra work it generates.
  • When in question, refer back to the original tools.  The answer will always be found there.
  • Unfortunately, tools change.  You may want to take screen shots.  During this process, FTDNA went from build 36 to 37, match thresholds changed, 23andMe introduced a new user interface (which I find much less intuitive) and GedMatch has made significant changes.  The net-net of this is when you decide to undertake this project, commit to it and do it, start to finish.  Doing this little by little makes you vulnerable to changes that may make your data incompatible midstream – and you may not even realize it.
  • This entire process is intensively manual.  My spreadsheet is over 5500 rows long.  I won’t be doing it again…although I will update my spreadsheet with new matches from time to time.  The hard work is already done.
  • This same technique applies to any minority ancestry, not just Native, although that’s what I’ve been hunting for and one of the most common inquiries I receive.
  • I am hopeful that in the not too distant future many of these steps and processes will be automated by the group of bright developers that contribute to GedMatch or via other tools like DNAGedcom. HINT – HINT!!!

I would like to follow this same process to identify the source of my African heritage, but I’m thinking I’ll wait for the tools to become automated.  The great irony is that it’s very likely in the same lines as my Native ancestors.

If You Want to Test

What does it take to do this for yourself using the tools we have today, as discussed?

If your parents are living, the best gift you can give yourself is to test them, now, while you still can.  My mother has been gone for several years, but her DNA archived at Family Tree DNA was still viable.  This is not always the case.  I was fortunate.  Her DNA is one of the best gifts she gave me.  Not just by inheritance, but by having hers tested.  I thank her every single day, for both!  I could not have written this article without her DNA results.  The gift that keeps on giving.

If you don’t have a parent to test, you can test several other family members who will provide some information, but clearly won’t carry the same amounts of common DNA with you as your parents.  These would include your aunts and uncles, your parents’ siblings and what I’ve referred to as your close cousin circle.  Attempt to test at least someone from each line.  Yes, it gets expensive, but as one of my cousins said, as she took her third or 4th DNA test.  “It’s only money.  This is about family.”

You can also test your own siblings as well to obtain more information that you can use to match up to your family lines. Remember, you only receive half of your parents DNA, and your siblings will received some DNA from your parents that you didn’t.

I don’t have any other siblings to test, but I have tested cousins from several lines which have proven invaluable when trying to discern the sources of certain segments. For example, one of these Native segments fell on a common segment with my cousin Joy.  Therefore, I know it’s from the Campbell line, and because I have the Campbell paternal Y-DNA which is European, I know immediately the Native admixture would have had to be from a wife.

Much of this puzzle is deductive, but we now have the tools, albeit manual, to do this type of work that was previously impossible.  I am somewhat disappointed that I can’t pinpoint the exact family lines, yet, but hopefully as more people test and more matches provide genealogical information, this will improve.

If you want to play in this arena, you need to test at either Family Tree DNA, 23andMe, or both.  Right now, the most cost effective way to achieve this is to purchase a $99 kit from 23andMe, test there, then download your results from 23andMe and upload them to Family Tree DNA for $99.  That way, you are fishing in both pools.  Be aware that less than half of the people who test at either company download results to GedMatch, so your primary match locations are with the testing companies.  GedMatch is auxiliary, but critical for this analysis.  And the newest tool, DNAGedcom is a Godsend.

Also note that transferring your result to Family Tree DNA is NOT the same thing as actually testing there.  Why does this matter?  If you want a future test at Family Tree DNA, who is the premiere genetic genealogy testing company, offering the most variety and “deepest” commercial tests, they archive your DNA for 25 years, but if you transfer results, they don’t have your DNA to archive, so no future products can be ordered.  All I can say is thank Heavens Mom’s DNA was there.

Ancestry.com doesn’t provide any tools such as the chromosome browser or even the basic information of matching segments.  All you get is a little leaf that says you’re related, but the questions of which segment or how are not answerable today at Ancestry and as CeCe’s experience proved, its unreliable.  It’s  possible that you share the same surnames and ancestor, but your genetic connection is not through that family line.  Without tools, there is no way to tell.  Ancestry released raw data files a few weeks ago and very recently, GedMatch has implemented the ability to upload them so that Ancestry participants can now utilize the additional tools at GedMatch.

Although this has been an extraordinarily long and detailed process, I can’t tell you how happy I am to have developed this new technique to add to my toolbox.  My Native and African ancestors have been most elusive.  There are no records, they didn’t write and probably didn’t even speak English, certainly not initially.  The only clues to their existence, prior to DNA, were scant references and family lore.  The only prayer of actually identifying them is though these small segments of our DNA – yep – down in the weeds.  Are there false starts perhaps, and challenges and maybe a few snakes down there?  Yes, for sure, but so is the DNA of your ancestors.

Happy gardening and rooting around in the weeds.  Just think of it as searching for the very best buried treasure!  It’s down there, just waiting to be found.  Keep digging!

I hope you’ve enjoyed this series and that it leads you to your own personal genealogical treasure trove!

treasure chest

______________________________________________________________

Disclosure

I receive a small contribution when you click on some of the links to vendors in my articles. This does NOT increase the price you pay but helps me to keep the lights on and this informational blog free for everyone. Please click on the links in the articles or to the vendors below if you are purchasing products or DNA testing.

Thank you so much.

DNA Purchases and Free Transfers

Genealogy Services

Genealogy Research

The Autosomal Me – Extracting Data Segments and Clustering

This is Part 8 of a multi-part series, “The Autosomal Me.”

Part 1 was “The Autosomal Me – Unraveling Minority Admixture” and Part 2 was “The Autosomal Me – The Ancestors Speak.”  Part 1 discussed the technique we are going to use to unravel minority ancestry, and why it works.  Part two gave an example of the power of fragmented chromosomal mapping and the beauty of the results.

Part 3, “The Autosomal Me – Who Am I?,” reviewed using our pedigree charts to gauge expected results and how autosomal results are put into population buckets.  Part 4, “The Autosomal Me – Testing Company Results,” shows what to expect from all of the major testing companies, past and present, along with Dr. Doug McDonald’s analysis.  In Part 5, “The Autosomal Me – Rooting Around in the Weeds Using Third Party Tools,” we looked at 5 different third party tools and what they can tell us about our minority admixture that is not reported by the major testing companies because the segments are too small and fragmented.

In Part 6, “The Autosomal Me – DNA Analysis – Splitting Up” we began the analysis part of the data we’ve been gathering.   We looked at how to determine whether minority admixture on specific chromosomes came from which parent.

Part 7, “The Autosomal Me – Start, Stop, Go – Identifying Native Chromosomal Segments”, took a deeper dive and focused on the two chromosomes with proven Native heritage and began by comparing those chromosome segments using the 4 GedMatch admixture tools.

In this segment, Part 8, we’ll be extracting all of the Native and Blended Asian segments on all 22 chromosomes, but I’ll only be using chromosomes 1 and 2 for illustration purposes.  We will then be clustering the resulting data to look for trends.  If you’re following along and using this methodology, you’ll be extracting the Native segment start and stop locations from all 22 chromosomes.

I apologize in advance for the length of this article, but there was just no good place to break it into pieces.

So, let’s get started.  As a reminder, we are using the admixture tools at www.gedmatch.com.

I experimented with several types of extractions to see which ones best reflected the results found by both 23andMe and Dr. McDonald and confirmed by the start and stop segments in the highly Native segments of chromosomes 1 and 2 in Part 7 of this series.  We verified that all 4 tools accurately reflected and corroborated the segments listed as Native, so now we’re going to apply that same methodology to the rest of our chromosomal data.

Initially, I tried to use the information from chromosomes 1 and 2 to extract the Native chromosomes using only the “best” tool, but when I looked at all 4 tools, I quickly realized that there was no single “best” choice.  A couple of crucial points came to light.

  • Some of the geographic colors are almost impossible to tell apart.
  • None of the tools are universally best.
  • When looking at all 4 tools, generally a “best 3 out of 4” approach allowed for one of the tools to be wrong, to perhaps reference a slightly different data base that called the segment differently or for the colors to be indistinguishable.  In other words, if three called a segment Native and one did not, it’s Native and conversely, if less than 3 call it Native, in this comparison, it’s not.

Unfortunately, this created an awful lot of work.  This is probably the best example of where automation tools could and would make a huge difference in this process.

I did two separate extracts.  The first one is what I refer to as the “Strong Native” extract and the second is the “Blended Asian.”  In part, I did these separately as a check and balance to be sure that my first extraction was accurate.

In the first extract, I selected only one category, the one best fitted to “Native American” for each tool.  I used the following categories for each admixture tool:

  • MDLP – Amerind
  • Eurogenes – North Amerindian
  • Dodecad – NE Asian
  • Harrappaworld – American

I completed this process for every chromosome, but I’m only showing the first two chromosomes in this article.

By way of example, using the first tool, MDLP, North Amerind looks black, but is actually very dark grey.  It is, fortunately, distinctive.

On the chromosome painting below, my results for the first part of chromosome 1 are shown in the first band, and mother’s for the same segment are shown as the second band.  The bottom band represents common segments and the black is non-matching segments, meaning those I obtained from my father.  Sometimes this third band can help you determine what you are really seeing in terms of colors and blending, but it’s not always useful.  In this case, trying to spot a small amount of dark gray against black is almost impossible, so not terribly helpful.  But if you were looking for red, that would be another story.  As you move through this process, remember, it’s not exact and utilizing best 3 of 4 will help you recover from any major errors.

You can see that my grey segments show up from about 12-13 and then again at about 14.5.  Sometimes it’s difficult to know how to count something.  For example, my Native at 14.5 – it’s actually more like 14.25 -14.5, but I chose not to divide further than half mb segments.  As long as you are consistent in whatever methodology you select, it will work out.

step 8 - 1

Please note that when reading these charts, that the small hash mark is the indicator for the measure.  In other words, the small hash mark above 10M means that is the 10M location.  It’s obvious here, but on some charts, the hash mark and the location legend look to be 1-off.  Again, as long as you’re consistent, it really doesn’t matter.

Mother’s Native segments are more pronounced and obvious.  They range from about 8-14.  Using the actual tools, you would record this and then continue scrolling to the right until you reach the end of the chromosome.  On chromosomes 1 and 2, I found the strong Native segments for the four admixture tools, as shown below.

The boxed numbers show the areas that were found “in common” between 23andMe, Dr. McDonald and the admixture tools, as determined in Part 7 of this series.  Highlighted segments show segments where at least 3 of 4 admixture tools reported Native heritage.  As you can see, there were clearly additional Native segments not reported by 23andme and Dr. McDonald.

Strong Native Chromosomal Detail Table

step 8 - 2

step 8 - 3

Because we have both my and mother’s results, we can infer my father’s contribution.  Clearly, some of his will wind up being some amount of “noise” and some IBS segments, but not all, by any means, and this is the only way to get a “read” on Dad.  This is one form of phasing data.  Phasing refers to various methodologies of figuring out which DNA comes from what source, meaning which parental line.

While the strongest Native segments are the ones individually most likely to indicate Native American ancestry, that really isn’t the whole story.  I discovered that many of these Native segments are actually embedded in other segments that are indicative of Native heritage too.  In other words, it’s not a line in the sand, yes or no, but more of a sliding scale.

On the chromosome painting below, this one using Eurogenes, with my results shown above and mother’s below, you can see two excellent examples.  Regions relevant to Native ancestry include:

  • Red – South Asian
  • Brown – Southwest Asian
  • Yellow – North Amerindian and      Arctic
  • Putty – Siberian
  • Emerald – East Asian

You can see that while mine is almost universally yellow, or Native, with a little Siberian (putty) mixed in for good measure between 169-170, a hint of East Asian (emerald) plus a little Asian (red), mother’s isn’t.  In fact, hers is a mixture of Native American and South Asian (red), with more red than yellow,  Siberian (putty) and a large segment of East Asian (emerald green).

step 8 - 4A

While her yellow Native segments alone would be staggered across this entire segment in 7 different pieces, when taken together as a whole, the “blended Asian” segment reaches entirely across the screen with the exception of 1 mb between 161.5-162.5, roughly.

The following Blended Asian Chromosomal Detail Table shows all of the blended Asian segments using all four of the admixture tools for chromosomes 1 and 2.

It’s clear that these regions are not solely “Native American” but reach back in time genetically into Asia, particularly Northeast Asia.

Again, the boxed numbers show the “in common” segments between all tools and the yellow highlighted segments are common between at least three of the four admixture tools.

Please note that there were some issues distinguishing colors, as follows:

  • For the MDLP comparison, Mesoamerican and Paleo Siberian are both putty colored and indistinguishable on the chart.  Also, the apple green for Arctic Amerind is very similar to the Austronesian.
  • When using Dodecad, Southeast Asian (light green) and South Asian (apple green) are nearly impossible to distinguish from each other on the graphs.
  • When using HarappaWorld, the apple green for Siberian was very similar to the light forest green for Papua New Guinea and was very difficult to distinguish.  The South Asian putty appears often with the other Native markers, and I considered including this group, but it too was difficult to distinguish from other regions so in the end, I opted not to include this category.
  • If you are colorblind – get help as this is impossible otherwise.

Blended Asian Chromosomal Detail Table

On the blended Asian Chromosome Detail Table, I added yellow highlighting where the same segments show in other Asian geographies that showed in the Strong Native table.  In each column, the Strong Native category is the last one at the bottom of the list.

The blue highlighting shows other common segments found that were not included in the Strong Native segments.  For a Strong Native yellow segment to be highlighted, it had to be present in 3 of 4 tools, or 75%.  In the Blended Asian group, there are a total of 15 categories between the 4 admixture tools, so for a segment to be shaded blue, it must be found in at least 8 of the categories, so just over half.  There are many segments that are found in several categories across the tools.  For example, segment 192-193 on chromosome 1 is found five times.  This isn’t to say you should discount this segment, only that it isn’t one of the strongest, most universal.  Surprisingly, there really weren’t too many that were close to the cutoff.  Several, but not a majority, were in the 4 or 5 range, only one was at 7.

step 8 - 4

 step 8 - 5

step 8 - 6

 step 8 - 7

  step 8 - 8step 8 - 9

 step 8 - 10

 Step 8 - 11

step 8 - 12

Clustering

The third step in data extraction is to look at all of the data together.  In this step, we are removing the geographic boundaries of Siberian, N. Amerindian, etc. and combining all of our data.  I have only combined the data within columns, not between columns, so we can get a feel for which tool or tools performed best or maybe not so well.  Each chromosome in each column has its data ordered numerically, and yes, this is a manual cut and paste process.  Sorry.  I warned you, this is an very manually intensive process.

After I put each column in numerical order, I arranged them so that the numbers were approximately in a line, or a row, with each other.  For example, in the first group below, you can clearly see that the first cluster of results is found using all 4 tools.  When looked at individually, only the blue results were noted as common (at least 8 of 15 for blue), but when viewed as a cluster, you can see between the tools that the cluster itself runs from about 7.5, with a small break from 8-9, and then to about 14.5.  As you would expect the beginning and end points of the cluster trail off and are not uniform between tools, but the main part of the cluster is found in all the tools.  This introduces the question of how to measure a cluster.  In this case, there is a clean break using all tools between 8 and 9, but that is only 1 mb, rather difficult to measure accurately.  You could record this as two distinct clusters but since it’s very closely adjacent the rest of the cluster, I’m inclined to include this as one large cluster and use the starting and ending segments for the cluster as a whole, in other words, the cluster runs from 7.5 through 14.5.  The alternate, or more conservative methodology would be to use the “in common” numbers, but in this case, that would be only 10-11.5 and I think you would miss a great deal of useful data.  So, for clusters, I’m recording the full extent of the cluster.  In some cases, you may need to exercise a judgment call.

Let’s look at the second group of numbers, beginning with 18.5 in Harrappaworld.  This grouping runs though about 28.  Eurogenes found some blended Asian between 27-28.5 as well in two of the geographies, but over all, of the 15 tools, we don’t see much.  This could be a result of a number of things.  I could have had problems with the colors, there may be only a very small amount and it may be categorized as something else with the other tools.  I would not consider this a cluster, and using our best 3 or 4 methodology eliminates this cluster from consideration.  This also holds true for 43-43.5.

However, the next cluster, from 55.5 to 58 is found in the Strong Native comparison, indicated by the yellow highlighting and is found using all 4 tools.  This is definitely a cluster.

step 8 - 13

step 8 - 14

step 8 - 15

step 8 - 16

step 8 - 17

step 8 - 18

step 8 - 19

Step 8 - 20

step 8 - 21

step 8 - 22

step 8 - 23

step 8 - 24

I’ve synthesized the cluster information into a list.  From the clusters above, I’ve created a list that I will be using in the next segment for data input into my spreadsheet of matches.  The blended segments below that include Strong Native segments are shown with yellow.

step 8 - 25

Using the GedMatch admixture applications, we’ve isolated the strongest Native and the Blended Asian segments and clusters in preparation for identifying specific Native family lines within our group of matches.

This process shows that, for the most part, the Strong Native segments picked up the strongest signals, about half of the segments that will be useful in determining Native admixture, although it does miss some.

When we use the clustering technique to view our results across all the admixture tools, we see a somewhat different picture emerge, adding several Blended Asian clusters.

In Part 9 of this series, we will use the highlighted Strong Native segments and the Blended Asian clusters, both of which suggest Native chromosomal “hotspots” to begin our comparison to our genetic matches for genealogical relevance.  In other words, using this information, we will determine which genealogical lines carry Native ancestry.

Part 9 may be somewhat delayed.  The good news is that Family Tree DNA is finishing work on their Build 36 to Build 37 conversion.  The bad news is that it fell right in the middle of writing this series.  When they finish Build 37, I’ll finish Part 9 of this series.  In the mean time, you can be extracting your minority segments using the tools and techniques that we have covered in Parts 1-8.

______________________________________________________________

Disclosure

I receive a small contribution when you click on some of the links to vendors in my articles. This does NOT increase the price you pay but helps me to keep the lights on and this informational blog free for everyone. Please click on the links in the articles or to the vendors below if you are purchasing products or DNA testing.

Thank you so much.

DNA Purchases and Free Transfers

Genealogy Services

Genealogy Research