If you’re reading this article, congratulations. You’re a savvy shopper and you’re doing some research before purchasing a DNA test. You’ve come to the right place.
The most common question I receive is asking which test is best to purchase. There is no one single best answer for everyone – it depends on your testing goals and your pocketbook.
Testing Goals
People who want to have their DNA tested have a goal in mind and seek results to utilize for their particular purpose. Today, in the Direct to Consumer (DTC) DNA market space, people have varied interests that fall into the general categories of genealogy and medical/health.
I’ve approached the question of “which test is best” by providing information grouped into testing goal categories. I’ve compared the different vendors and tests from the perspective of someone who is looking to test for those purposes – and I’ve created separate sections of this article for each interest..
We will be discussing testing for:
- Ethnicity – Who Am I? – Breakdown by Various World Regions
- Adoption – Finding Missing Parents or Close Family
- Genealogy – Cousin Matching and Ancestor Search/Verification
- Medical/Health
We will be reviewing the following test types:
- Autosomal
- Y DNA (males only)
- Mitochondrial DNA
I have included summary charts for each section, plus an additional chart for:
- Additional Vendor Considerations
If you are looking to select one test, or have limited funds, or are looking to prioritize certain types of tests, you’ll want to read about each vendor, each type of test, and each testing goal category.
Each category reports information about the vendors and their products from a different perspective – and only you can decide which of these perspectives and features are most important to you.
You might want to read this short article for a quick overview of the 4 kinds of DNA used for genetic genealogy and DTC testing and how they differ.
The Big 3
Today, there are three major players in the DNA testing market, not in any particular order:
Each of these companies offers autosomal tests, but each vendor offers features that are unique. Family Tree DNA and 23andMe offer additional tests as well.
In addition to the Big 3, there are a couple of new kids on the block that I will mention where appropriate. There are also niche players for the more advanced genetic genealogist or serious researcher, and this article does not address advanced research.
In a nutshell, if you are serious genealogist, you will want to take all of the following tests to maximize your tools for solving genealogical puzzles. There is no one single test that does everything.
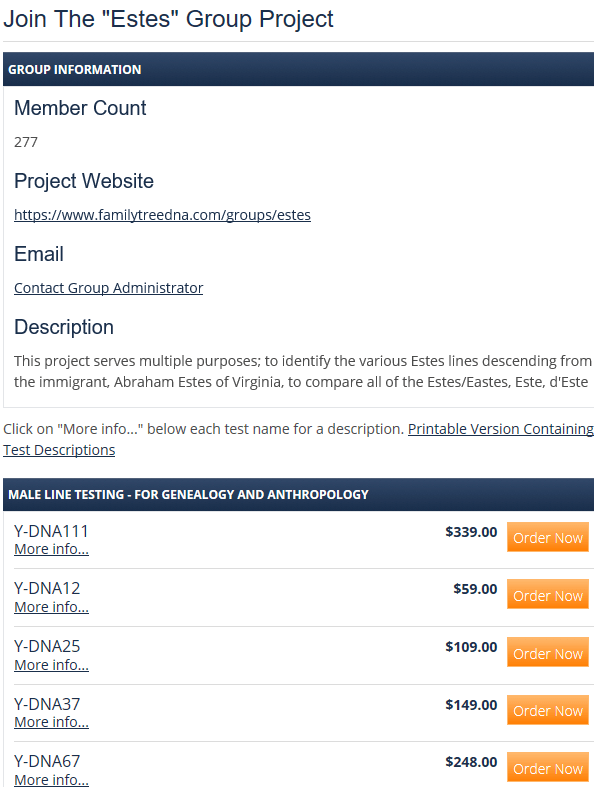
- Full mitochondrial sequence that informs you about your matrilineal line (only) at Family Tree DNA. This test currently costs $199.
- Y DNA test (for males only) that informs you about your direct paternal (surname) line (only) at Family Tree DNA. This test begins at $169 for 37 markers.
- Family Finder, an autosomal test that provides ethnicity estimates and cousin matching at Family Tree DNA. This test currently costs $89.
- AncestryDNA, an autosomal test at Ancestry.com that provides ethnicity estimates and cousin matching. (Do not confuse this test with Ancestry by DNA, which is not the same test and does not provide the same features.) This test currently costs $99, plus the additional cost of a subscription for full feature access. You can test without a subscription, but nonsubscribers can’t access all of the test result features provided to Ancestry subscribers.
- 23andMe Ancestry Service test, an autosomal test that provides ethnicity estimates and cousin matching. The genealogy version of this test costs $99, the medical+genealogy version costs $199.
A Word About Third Party Tools
A number of third party tools exist, such as GedMatch and DNAGedcom.com, and while these tools are quite useful after testing, these vendors don’t provide tests. In order to use these sites, you must first take an autosomal DNA test from a testing vendor. This article focuses on selecting your DNA testing vendor based on your testing goals.
Let’s get started!
Ethnicity
Many people are drawn to DNA testing through commercials that promise to ‘tell you who you are.” While the allure is exciting, the reality is somewhat different.
Each of the major three vendors provide an ethnicity estimate based on your autosomal DNA test, and each of the three vendors will provide you with a different result.
Yep, same person, different ethnicity breakdowns.
Hopefully, the outcomes will be very similar, but that’s certainly not always the case. However, many people take one test and believe those results wholeheartedly. Please don’t. You may want to read Concepts – Calculating Ethnicity Percentages to see how varied my own ethnicity reports are at various vendors as compared to my known genealogy.
The technology for understanding “ethnicity” from a genetic perspective is still very new. Your ethnicity estimate is based on reference populations from around the world – today. People and populations move, and have moved, for hundreds, thousands and tens of thousands of years. Written history only reaches back a fraction of that time, so the estimates provided to people today are not exact.
That isn’t to criticize any individual vendor. View each vendor’s results not as gospel, but as their opinion based on their reference populations and their internal proprietary algorithm of utilizing those reference populations to produce your ethnicity results.
To read more about how ethnicity testing works, and why your results may vary between vendors or not be what you expected, click here.
I don’t want to discourage anyone from testing, only to be sure consumers understand the context of what they will be receiving. Generally speaking, these results are accurate at the continental level, and less accurate within continents, such as European regional breakdowns.
All three testing companies provide additional features or tools, in addition to your ethnicity estimates, that are relevant to ethnicity or population groups.
Let’s look at each company separately.
Ethnicity – Family Tree DNA
Family Tree DNA’s ethnicity tool is called myOrigins and provides three features or tools in addition to the actual ethnicity estimate and associated ethnicity map.

Please note that throughout this article you can click on any image to enlarge.
On the myOrigins ethnicity map page, above, your ethnicity percentages and map are shown, along with two additional features.
The Shared Origins box to the left shows the matching ethnic components of people on your DNA match list. This is particularly useful if you are trying to discover, for example, where a particular minority admixture comes from in your lineage. You can select different match types, for example, immediate relatives or X chromosome matches, which have special inheritance qualities.
Clicking on the apricot (mitochondrial DNA) and green (Y DNA) pins in the lower right corner drops the pins in the locations on your map of the most distant ancestral Y and mitochondrial DNA locations of the individuals in the group you have selected in the Shared Origins match box. You may or may not match these individuals on the Y or mtDNA lines, but families tend to migrate in groups, so match hints of any kind are important.
A third unique feature provided by Family Tree DNA is Ancient Origins, a tool released with little fanfare in November 2016.

Ancient Origins shows the ancient source of your European DNA, based on genome sequencing of ancient DNA from the locations shown on the map.

Additionally, Family Tree DNA hosts an Ancient DNA project where they have facilitated the upload of the ancient genomes so that customers today can determine if they match these ancient individuals.

Kits included in the Ancient DNA project are shown in the chart below, along with their age and burial location. Some have matches today, and some of these samples are included on the Ancient Origins map.
| Individual |
Approx. Age |
Burial Location |
Matches |
Ancient Origins Map |
| Clovis Anzick |
12,500 |
Montana (US) |
Yes |
No |
| Linearbandkeramik |
7,500 |
Stuttgart, Germany |
Yes |
Yes |
| Loschbour |
8,000 |
Luxembourg |
Yes |
Yes |
| Palaeo-Eskimo |
4,000 |
Greenland |
No |
No |
| Altai Neanderthal |
50,000 |
Altai |
No |
No |
| Denisova |
30,000 |
Siberia |
No |
No |
| Hinxton-4 |
2,000 |
Cambridgeshire, UK |
No |
No |
| BR2 |
3,200 |
Hungary |
Yes |
Yes |
| Ust’-Ishim |
45,000 |
Siberia |
Yes |
No |
| NE1 |
7,500 |
Hungary |
Yes |
Yes |
Ethnicity – Ancestry
In addition to your ethnicity estimate, Ancestry also provides a feature called Genetic Communities.

Your ethnicity estimate provides percentages of DNA found in regions shown on the map by fully colored shapes – green in Europe in the example above. Genetic Communities show how your DNA clusters with other people in specific regions of the world – shown with dotted clusters in the US in this example.
In my case, my ethnicity at Ancestry shows my European roots, illustrated by the green highlighted areas, and my two Genetic Communities are shown by yellow and red dotted regions in the United States.
My assigned Genetic Communities indicate that my DNA clusters with other people whose ancestors lived in two regions; The Lower Midwest and Virginia as well as the Alleghenies and Northeast Indiana.
Testers can then view their DNA matches within that community, as well as a group of surnames common within that community.

The Genetic Communities provided for me are accurate, but don’t expect all of your genealogical regions to be represented in Genetic Communities. For example, my DNA is 25% German, and I don’t have any German communities today, although ancestry will be adding new Genetic Communities as new clusters are formed.
You can read more about Genetic Communities here and here.
Ethnicity – 23andMe
In addition to ethnicity percentage estimates, called Ancestry Composition, 23andMe offers the ability to compare your Ancestry Composition against that of your parent to see which portions of your ethnicity you inherited from each parent, although there are problems with this tool incorrectly assigning parental segments.
Additionally, 23andMe paints your chromosome segments with your ethnic heritage, as shown below.

You can see that my yellow Native American segments appear on chromosomes 1 and 2.
In January 2017, 23andMe introduced their Ancestry Timeline, which I find to be extremely misleading and inaccurate. On my timeline, shown below, they estimate that my most recent British and Irish ancestor was found in my tree between 1900 and 1930 while in reality my most recent British/Irish individual found in my tree was born in England in 1759.

I do not view 23andMe’s Ancestry Timeline as a benefit to the genealogist, having found that it causes people to draw very misleading conclusions, even to the point of questioning their parentage based on the results. I wrote about their Ancestry Timeline here.
Ethnicity Summary
All three vendors provide both ethnicity percentage estimates and maps. All three vendors provide additional tools and features relevant to ethnicity. Vendors also provide matching to other people which may or may not be of interest to people who test only for ethnicity. “Who you are” only begins with ethnicity estimates.
DNA test costs are similar, although the Family Tree DNA test is less at $89. All three vendors have sales from time to time.
Ethnicity Vendor Summary Chart
Ethnicity testing is an autosomal DNA test and is available for both males and females.
|
Family Tree DNA |
Ancestry |
23andMe |
| Ethnicity Test |
Included with $89 Family Finder test |
Included with $99 Ancestry DNA test |
Included with $99 Ancestry Service |
| Percentages and Maps |
Yes |
Yes |
Yes |
| Shared Ethnicity with Matches |
Yes |
No |
Yes |
| Additional Feature |
Y and mtDNA mapping of ethnicity matches |
Genetic Communities |
Ethnicity phasing against parent (has issues) |
| Additional Feature |
Ancient Origins |
|
Ethnicity mapping by chromosome |
| Additional Feature |
Ancient DNA Project |
|
Ancestry Timeline |
Adoption and Parental Identity
DNA testing is extremely popular among adoptees and others in search of missing parents and grandparents.
The techniques used for adoption and parental search are somewhat different than those used for more traditional genealogy, although non-adoptees may wish to continue to read this section because many of the features that are important to adoptees are important to other testers as well.
Adoptees often utilize autosomal DNA somewhat differently than traditional genealogists by using a technique called mirror trees. In essence, the adoptee utilizes the trees posted online of their closest DNA matches to search for common family lines within those trees. The common family lines will eventually lead to the individuals within those common trees that are candidates to be the parents of the searcher.
Here’s a simplified hypothetical example of my tree and a first cousin adoptee match.

The adoptee matches me at a first cousin level, meaning that we share at least one common grandparent – but which one? Looking at other people the adoptee matches, or the adoptee and I both match, we find Edith Lore (or her ancestors) in the tree of multiple matches. Since Edith Lore is my grandmother, the adoptee is predicted to be my first cousin, and Edith Lore’s ancestors appear in the trees of our common matches – that tells us that Edith Lore is also the (probable) grandmother of the adoptee.
Looking at the possibilities for how Edith Lore can fit into the tree of me and the adoptee, as first cousins, we fine the following scenario.

Testing the known child of daughter Ferverda will then provide confirmation of this relationship if the known child proves to be a half sibling to the adoptee.
Therefore, close matches, the ability to contact matches and trees are very important to adoptees. I recommend that adoptees make contact with www.dnaadoption.com. The volunteers there specialize in adoptions and adoptees, provide search angels to help people and classes to teach adoptees how to utilize the techniques unique to adoption search such as building mirror trees.
For adoptees, the first rule is to test with all 3 major vendors plus MyHeritage. Family Tree DNA allows you to test with both 23andMe and Ancestry and subsequently transfer your results to Family Tree DNA, but I would strongly suggest adoptees test on the Family Tree DNA platform instead. Your match results from transferring to Family Tree DNA from other companies, except for MyHeritage, will be fewer and less reliable because both 23andMe and Ancestry utilize different chip technology.
For most genealogists, MyHeritage is not a player, as they have only recently entered the testing arena, have a very small data base, no tools and are having matching issues. I recently wrote about MyHeritage here. However, adoptees may want to test with MyHeritage, or upload your results to MyHeritage if you tested with Family Tree DNA, because your important puzzle-solving match just might have tested there and no place else. You can read about transfer kit compatibility and who accepts which vendors’ tests here.
Adoptees can benefit from ethnicity estimates at the continental level, meaning that regional (within continent) or minority ethnicity should be taken with a very large grain of salt. However, knowing that you have 25% Jewish heritage, for example, can be a very big clue to an adoptee’s search.
Another aspect of the adoptees search that can be relevant is the number of foreign testers. For many years, neither 23andMe, nor Ancestry tested substantially (or at all) outside the US. Family Tree DNA has always tested internationally and has a very strong Jewish data base component.
Not all vendors report X chromosome matches. The X chromosome is important to genetic genealogy, because it has a unique inheritance path. Men don’t inherit an X chromosome from their fathers. Therefore, if you match someone on the X chromosome, you know the relationship, for a male, must be from their mother’s side. For a female, the relationship must be from the mother or the father’s mother’s side. You can read more about X chromosome matching here.
Neither Ancestry nor MyHeritage have chromosome browsers which allow you to view the segments of DNA on which you match other individuals, which includes the X chromosome.
Adoptee Y and Mitochondrial Testing
In addition to autosomal DNA testing, adoptees will want to test their Y DNA (males only) and mitochondrial DNA.
These tests are different from autosomal DNA which tests the DNA you receive from all of your ancestors. Y and mitochondrial DNA focus on only one specific line, respectively. Y DNA is inherited by men from their fathers and the Y chromosome is passed from father to son from time immemorial. Therefore, testing the Y chromosome provides us with the ability to match to current people as well as to use the Y chromosome as a tool to look far back in time. Adoptees tend to be most interested in matching current people, at least initially.
Working with male adoptees, I have a found that about 30% of the time a male will match strongly to a particular surname, especially at higher marker levels. That isn’t always true, but adoptees will never know if they don’t test. An adoptee’s match list is shown at 111 markers, below.

Furthermore, utilizing the Y and mitochondrial DNA test in conjunction with autosomal DNA matching at Family Tree DNA helps narrows possible relatives. The Advanced Matching feature allows you to see who you match on both the Y (or mitochondrial) DNA lines AND the autosomal test, in combination.

Mitochondrial DNA tests the matrilineal line only, as women pass their mitochondrial DNA to all of their children, but only females pass it on. Family Tree DNA provides matching and advanced combination matching/searching for mitochondrial DNA as well as Y DNA. Both genders of children carry their mother’s mitochondrial DNA. Unfortunately, mitochondrial DNA is more difficult to work with because of the surname changes in each generation, but you cannot be descended from a woman, or her direct matrilineal ancestors if you don’t substantially match her mitochondrial DNA.
Some vendors state that you receive mitochondrial DNA with your autosomal results, which is only partly accurate. At 23andMe, you receive a haplogroup but no detailed results and no matching. 23andMe does not test the entire mitochondria and therefore cannot provide either advanced haplogroup placement nor Y or mitochondrial DNA matching between testers.
For additional details on the Y and Mitochondrial DNA tests themselves and what you receive, please see the Genealogy – Y and Mitochondrial DNA section.
Adoption Summary
Adoptees should test with all 4 vendors plus Y and mitochondrial DNA testing.
- Ancestry – due to their extensive data base size and trees
- Family Tree DNA – due to their advanced tools, chromosome browser, Y and mitochondrial DNA tests (Ancestry and 23andMe participants can transfer autosomal raw data files and see matches for free, but advanced tools require either an unlock fee or a test on the Family Tree DNA platform)
- 23andMe – no trees and many people don’t participate in sharing genetic information
- MyHeritage – new kid on the block, working through what is hoped are startup issues
- All adoptees should take the full mitochondrial sequence test.
- Male adoptees should take the 111 marker Y DNA test, although you can start with 37 or 67 markers and upgrade later.
- Y and mitochondrial tests are only available at Family Tree DNA.
Adoptee Vendor Feature Summary Chart
|
Family Tree DNA |
Ancestry |
23andMe |
MyHeritage |
| Autosomal DNA – Males and Females |
|
|
|
|
| Matching |
Yes |
Yes |
Yes |
Yes – problems |
| Relationship Estimates* |
Yes – May be too close |
Yes – May be too distant |
Yes – Matches may not be sharing |
Yes – problematic |
| International Reach |
Very strong |
Not strong but growing |
Not strong |
Small but subscriber base is European focused |
| Trees |
Yes |
Yes |
No |
Yes |
| Tree Quantity |
54% have trees, 46% no tree (of my first 100 matches) |
56% have trees, 44% no tree or private (of my first 100 matches) |
No trees |
~50% don’t have trees or are private (cannot discern private tree without clicking on every tree) |
| Data Base Size |
Large |
Largest |
Large – but not all opt in to matching |
Very small |
| My # of Matches on 4-23-2017 |
2,421 |
23,750 |
1,809 but only 1,114 are sharing |
75 |
| Subscription Required |
No |
No for partial, Yes for full functionality including access to matches’ trees, minimal subscription for $49 by calling Ancestry |
No |
No for partial, Yes for full functionality |
| Other Relevant Tools |
|
New Ancestor Discoveries |
|
|
| Autosomal DNA Issues |
Many testers don’t have trees |
Many testers don’t have trees |
Matching opt-in is problematic, no trees at all |
Matching issues, small data base size is problematic, many testers don’t have trees |
| Contact Methodology |
E-mail address provided to matches |
Internal message system – known delivery issues |
Internal message system |
Internal message system |
| X Chromosome Matching |
Yes |
No |
Yes |
No |
| Y-DNA – Males Only |
|
|
|
|
| Y DNA STR Test |
Yes- 37, 67, and 111 markers |
No |
No |
No |
| Y Haplogroup |
Yes as part of STR test plus additional testing available |
No |
Yes, basic level but no additional testing available, outdated haplogroups |
No |
| Y Matching |
Yes |
No |
No |
No |
| Advanced Matching Between Y and Autosomal |
Yes |
No |
No |
No |
| Mitochondrial DNA- Males and Females |
|
|
|
|
| Test |
Yes, partial and full sequence |
No |
No |
No |
| Mitochondrial DNA Haplogroup |
Yes, included in test |
No |
Yes, basic but full haplogroup not available, haplogroup several versions behind |
No |
| Advanced Matching Between Mitochondrial and Autosomal |
Yes |
No |
No |
No |
Genealogy – Cousin Matching and Ancestor Search/Verification
People who want to take a DNA test to find cousins, to learn more about their genealogy, to verify their genealogy research or to search for unknown ancestors and break down brick walls will be interested in various types of testing
| Test Type |
Who Can Test |
| Y DNA – direct paternal line |
Males only |
| Mitochondrial DNA – direct matrilineal line |
Males and Females |
| Autosomal – all lines |
Males and Females |
Let’s begin with autosomal DNA testing for genealogy which tests your DNA inherited from all ancestral lines.
Aside from ethnicity, autosomal DNA testing provides matches to other people who have tested. A combination of trees, meaning their genealogy, and their chromosome segments are used to identify (through trees) and verify (through DNA segments) common ancestor(s) and then to assign a particular DNA segment(s) to that ancestor or ancestral couple. This process, called triangulation, then allows you to assign specific segments to particular ancestors, through segment matching among multiple people. You then know that when another individual matches you and those other people on the same segment, that the DNA comes from that same lineage. Triangulation is the only autosomal methodology to confirm ancestors who are not close relatives, beyond the past 2-3 generations or so.
All three vendors provide matching, but the tools they include and their user interfaces are quite different.
Genealogy – Autosomal – Family Tree DNA
Family Tree DNA entered DNA testing years before any of the others, initially with Y and mitochondrial DNA testing.
Because of the diversity of their products, their website is somewhat busier, but they do a good job of providing areas on the tester’s personal landing page for each of the products and within each product, a link for each feature or function.

For example, the Family Finder test is Family Tree DNA’s autosomal test. Within that product, tools provided are:
- Matching
- Chromosome Browser
- Linked Relationships
- myOrigins
- Ancient Origins
- Matrix
- Advanced Matching
Unique autosomal tools provided by Family Tree DNA are:
- Linked Relationships that allows you to connect individuals that you match to their location in your tree, indicating the proper relationship. Phased Family Matching uses these relationships within your tree to indicate which side of your tree other matches originate from.
- Phased Family Matching shows which side of your tree, maternal, paternal or both, someone descends from, based on phased DNA matching between you and linked relationship matches as distant as third cousins. This allows Family Tree DNA to tell you whether matches are paternal (blue icon), maternal (red icon) or both (purple icon) without a parent’s DNA. This is one of the best autosomal tools at Family Tree DNA, shown below.

- In Common With and Not In Common With features allow you to sort your matches in common with another individual a number of ways, or matches not in common with that individual.
- Filtered downloads provide the downloading of chromosome data for your filtered match list.
- Stackable filters and searches – for example, you can select paternal matches and then search for a particular surname or ancestral surname within the paternal matches.
- Common ethnicity matching through myOrigins allows you to see selected groups of individuals who match you and share common ethnicities.
- Y and mtDNA locations of autosomal matches are provided on your ethnicity map through myOrigins.
- Advanced matching tool includes Y, mtDNA and autosomal in various combinations. Also includes matches within projects where the tester is a member as well as by partial surname.
- The matrix tool allows the tester to enter multiple people that they match in order to see if those individuals also match each other. The matrix tool is, in combination with the in-common-with tool and the chromosome browser is a form of pseudo triangulation, but does not indicate that the individuals match on the same segment.

- Chromosome browser with the ability to select different segment match thresholds to display when comparing 5 or fewer individuals to your results.
- Projects to join which provide group interaction and allow individuals to match only within the project, if desired.
To read more about how to utilize the various autosomal tools at Family Tree DNA, with examples, click here.
Genealogy – Autosomal – Ancestry
Ancestry only offers autosomal DNA testing to their customers, so their page is simple and straightforward.

Ancestry is the only testing vendor (other than MyHeritage who is not included in this section) to require a subscription for full functionality, although if you call the Ancestry support line, a minimal subscription is available for $49. You can see your matches without a subscription, but you cannot see your matches trees or utilize other functions, so you will not be able to tell how you connect to your matches. Many genealogists have Ancestry subscriptions, so this is minimally problematic for most people.
However, if you don’t realize you need a subscription initially, the required annual subscription raises the effective cost of the test quite substantially. If you let your subscription lapse, you no longer have access to all DNA features. The cost of testing with Ancestry is the cost of the test plus the cost of a subscription if you aren’t already a subscriber.
This chart, from the Ancestry support center, provides details on which features are included for free and which are only available with a subscription.

Unique tools provided by Ancestry include:
- Shared Ancestor Hints (green leaves) which indicate a match with whom you share a common ancestor in your tree connected to your DNA, allowing you to display the path of you and your match to the common ancestor. In order to take advantage of this feature, testers must link their tree to their DNA test. Otherwise, Ancestry can’t do tree matching. As far as I’m concerned, this is the single most useful DNA tool at Ancestry. Subscription required.

- DNA Circles, example below, are created when several people whose DNA matches also share a common ancestor. Subscription required.

- New Ancestor Discoveries (NADs), which are similar to Circles, but are formed when you match people descended from a common ancestor, but don’t have that ancestor in your tree. The majority of the time, these NADs are incorrect and are, when dissected and the source can be determined, found to be something like the spouse of a sibling of your ancestor. I do not view NADs as a benefit, more like a wild goose chase, but for some people these could be useful so long as the individual understands that these are NOT definitely ancestors and only hints for research. Subscription required.
- Ancestry uses a proprietary algorithm called Timber to strip DNA from you and your matches that they consider to be “too matchy,” with the idea that those segments are identical by population, meaning likely to be found in large numbers within a population group – making them meaningless for genealogy. The problem is that Timber results in the removal of valid segments, especially in endogamous groups like Acadian families. This function is unique to Ancestry, but many genealogists (me included) don’t consider Timber a benefit.
- Genetic Communities shows you groups of individuals with whom your DNA clusters. The trees of cluster members are then examined by Ancestry to determine connections from which Genetic Communities are formed. You can filter your DNA match results by Genetic Community.
Genealogy – Autosomal – 23and Me
Unfortunately, the 23andMe website is not straightforward or intuitive. They have spent the majority of the past two years transitioning to a “New Experience” which has resulted in additional confusion and complications when matching between people on multiple different platforms. You can take a spin through the New Experience by clicking here.
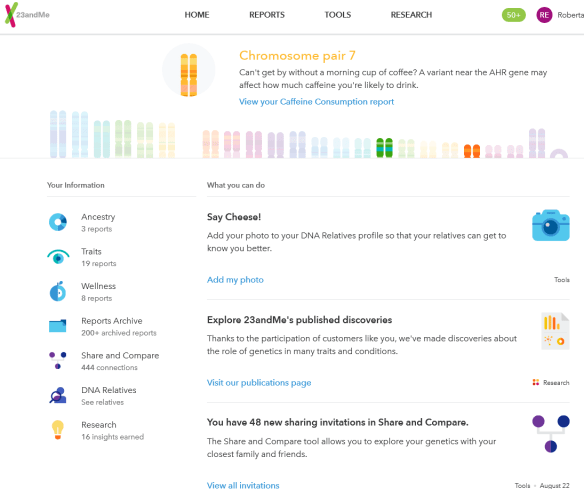
23andMe requires people to opt-in to sharing, even after they have selected to participate in Ancestry Services (genealogy) testing, have opted-in previously and chosen to view their DNA Relatives. Users on the “New Experience” can then either share chromosome data and results with each other individually, meaning on a one by one basis, or globally by a one-time opt-in to “open sharing” with matches. If a user does not opt-in to both DNA Relatives and open sharing, sharing requests must be made individually to each match, and they must opt-in to share with each individual user. This complexity and confusion results in an approximate sharing rate of between 50 and 60%. One individual who religiously works their matches by requesting sharing now has a share rate of about 80% of their matches in the data base who HAVE initially selected to participate in DNA Relatives. You can read more about the 23andMe experience at this link.
Various genetic genealogy reports and tools are scattered between the Reports and Tools tabs, and within those, buried in non-intuitive locations. If you are going to utilize 23andMe for matching and genealogy, in addition to the above link, I recommend Kitty Cooper’s blogs about the new DNA Relatives here and on triangulation here. Print the articles, and use them as a guide while navigating the 23andMe site.
Note that some screens (the Tools, DNA Relatives, then DNA tab) on the site do not display/work correctly utilizing Internet Explorer, but do with Edge or other browsers.
The one genealogy feature unique to 23andMe is:
- Triangulation at 23andMe allows you to select a specific match to compare your DNA against. Several pieces of information will be displayed, the last of which, scrolling to the bottom, is a list of your common relatives with the person you selected.
In the example below, I’ve selected to see the matches I match in common with known family member, Stacy Den (surnames have been obscured for privacy reasons.) Please note that the Roberta V4 Estes kit is a second test that I took for comparison purposes when the new V4 version of 23andMe was released. Just ignore that match, because, of course I match myself as a twin.

If an individual does not match both you and your selected match, they will not appear on this list.
In the “relatives in common” section, each person is listed with a “shared DNA” column. For a person to be shown on this “in common” list, you obviously do share DNA with these individuals and they also share with your match, but the “shared DNA” column goes one step further. This column indicates whether or not you and your match both share a common DNA segment with the “in common” person.
I know this is confusing, so I’ve created this chart to illustrate what will appear in the “Shared DNA” column of the individuals showing on the list of matches, above, shared between me and Stacy Den.

Clicking on “Share to see” sends Sarah a sharing request for her to allow you to see her segment matches.
Let’s look at an example with “yes” in the Shared DNA column.
Clicking on the “Yes” in the Shared DNA column of Debbie takes us to the chromosome browser which shows both your selected match, Stacy in my case, and Debbie, the person whose “yes” you clicked.
All three people, meaning me, Stacy and Debbie share a common DNA segment, shown below on chromosome 17.

What 23andMe does NOT say is that these people. Stacy and Debbie, also match each other, in addition to matching me, which means all three of us triangulate.
Because I manage Stacy’s kit at 23andMe, I can check to see if Debbie is on Stacy’s match list, and indeed, Debbie is on Stacy’s match list and Stacy does match both Debbie and me on chromosome 17 in exactly the same location shown above, proving unquestionably that the three of us all match each other and therefore triangulate on this segment. In our case, it’s easy to identify our common relative whose DNA all 3 of us share.
Genealogy – Autosomal Summary
While all 3 vendors offer matching, their interfaces and tools vary widely.
I would suggest that Ancestry is the least sophisticated and has worked hard to make their tools easy for the novice working with genetic genealogy. Their green leaf DNA+Tree Matching is their best feature, easy to use and important for the novice and experienced genealogist alike. Now, if they just had that chromosome browser so we could see how we match those people.
Ancestry’s Circles, while a nice feature, encourage testers to believe that their DNA or relationship is confirmed by finding themselves in a Circle, which is not the case.
Circles can be formed as the result of misinformation in numerous trees. For example, if I were to inaccurately list Smith as the surname for one of my ancestor’s wives, I would find myself in a Circle for Barbara Smith, when in fact, there is absolutely no evidence whatsoever that her surname is Smith. Yet, people think that Barbara Smith is confirmed due to a Circle having been formed and finding themselves in Barbara Smith’s Circle. Copying incorrect trees equals the formation of incorrect Circles.
It’s also possible that I’m matching people on multiple lines and my DNA match to the people in any given Circle is through another common ancestor entirely.
A serious genealogist will test minimally at Ancestry and at Family Tree DNA, who provides a chromosome browser and other tools necessary to confirm relationships and shared DNA segments.
Family Tree DNA is more sophisticated, so consequently more complex to use. They provide matching plus numerous other tools. The website and matching is certainly friendly for the novice, but to benefit fully, some experience or additional education is beneficial, not unlike traditional genealogy research itself. This is true not just for Family Tree DNA, but GedMatch and 23andMe who all three utilize chromosome browsers.
The user will want to understand what a chromosome browser is indicating about matching DNA segments, so some level of education makes life a lot easier. Fortunately, understanding chromosome browser matching is not complex. You can read an article about Match Groups and Triangulation here. I also have an entire series of Concepts articles, Family Tree DNA offers a webinar library, their Learning Center and other educational resources are available as well.
Family Tree DNA is the only vendor to provide Phased Family Matches, meaning that by connecting known relatives who have DNA tested to your tree, Family Tree DNA can then identify additional matches as maternal, paternal or both. This, in combination with pseudo-phasing are very powerful matching tools.
23andMe is the least friendly of the three companies, with several genetic genealogy unfriendly restrictions relative to matching, opt-ins, match limits and such. They have experienced problem after problem for years relative to genetic genealogy, which has always been a second-class citizen compared to their medical research, and not a priority.
23andMe has chosen to implement a business model where their customers must opt-in to share segment information with other individuals, either one by one or by opting into open sharing. Based on my match list, roughly 60% of my actual DNA matches have opted in to sharing.
Their customer base includes fewer serious genealogists and their customers often are not interested in genealogy at all.
Having said that, 23andMe is the only one of the three that provides actual triangulated matches for users on the New Experience and who have opted into sharing.
If I were entering the genetic genealogy testing space today, I would test my autosomal DNA at Ancestry and at Family Tree DNA, but I would probably not test at 23andMe. I would test both my Y DNA (if a male) and mitochondrial at Family Tree DNA.
Thank you to Kitty Cooper for assistance with parent/child matching and triangulation at 23andMe.
Genealogy Autosomal Vendor Feature Summary Chart
|
Family Tree DNA |
Ancestry |
23andMe |
| Matching |
Yes |
Yes |
Yes – each person has to opt in for open sharing or authorize sharing individually, many don’t |
| Estimated Relationships |
Yes |
Yes |
Yes |
| Chromosome Browser |
Yes |
No – Large Issue |
Yes |
| Chromosome Browser Threshold Adjustment |
Yes |
No Chromosome Browser |
No |
| X Chromosome Matching |
Yes |
No |
Yes |
| Trees |
Yes |
Yes – subscription required so see matches’ trees |
No |
| Ability to upload Gedcom file |
Yes |
Yes |
No |
| Ability to search trees |
Yes |
Yes |
No |
| Subscription in addition to DNA test price |
No |
No for partial, Yes for full functionality, minimal subscription for $49 by calling Ancestry |
No |
| DNA + Ancestor in Tree Matches |
No |
Yes – Leaf Hints – subscription required – Best Feature |
No |
| Phased Parental Side Matching |
Yes – Best Feature |
No |
No |
| Parent Match Indicator |
Yes |
No |
Yes |
| Sort or Group by Parent Match |
Yes |
Yes |
Yes |
| In Common With Tool |
Yes |
Yes |
Yes |
| Not In Common With Tool |
Yes |
No |
No |
| Triangulated Matches |
No – pseudo with ICW, browser and matrix |
No |
Yes – Best Feature |
| Common Surnames |
Yes |
Yes – subscription required |
No |
| Ability to Link DNA Matches on Tree |
Yes |
No |
No |
| Matrix to show match grid between multiple matches |
Yes |
No |
No |
| Match Filter Tools |
Yes |
Minimal |
Some |
| Advanced Matching Tool |
Yes |
No |
No |
| Multiple Test Matching Tool |
Yes |
No multiple tests |
No multiple tests |
| Ethnicity Matching |
Yes |
No |
Yes |
| Projects |
Yes |
No |
No |
| Maximum # of Matches Restricted |
No |
No |
Yes – 2000 unless you are communicating with the individuals, then they are not removed from your match list |
| All Customers Participate |
Yes |
Yes, unless they don’t have a subscription |
No – between 50-60% opt-in |
| Accepts Transfers from Other Testing Companies |
Yes |
No |
No |
| Free Features with Transfer |
Matching, ICW, Matrix, Advanced Matching |
No transfers |
No transfers |
| Transfer Features Requiring Unlock $ |
Chromosome Browser, Ethnicity, Ancient Origins, Linked Relationships, Parentally Phased Matches |
No Transfers |
No transfers |
| Archives DNA for Later Testing |
Yes, 25 years |
No, no additional tests available |
No, no additional tests available |
| Additional Tool |
|
DNA Circles – subscription required |
|
| Additional Tool |
|
New Ancestor Discoveries – subscription required |
|
| Y DNA |
Not included in autosomal test but is additional test, detailed results including matching |
No |
Haplogroup only |
| Mitochondrial DNA |
Not included in autosomal test but is additional test, detailed results including matching |
No |
Haplogroup only |
| Advanced Testing Available |
Yes |
No |
No |
| Website Intuitive |
Yes, given their many tools |
Yes, very simple |
No |
| Data Base Size |
Large |
Largest |
Large but many do not test for genealogy, only test for health |
| Strengths |
Many tools, multiple types of tests, phased matching without parent |
DNA + Tree matching, size of data base |
Triangulation |
| Challenges |
Website episodically times out |
No chromosome browser or advanced tools |
Sharing is difficult to understand and many don’t, website is far from intuitive |
Genealogy – Y and Mitochondrial DNA
Two indispensable tools for genetic genealogy that are often overlooked are Y and mitochondrial DNA.
The inheritance path for Y DNA is shown by the blue squares and the inheritance path for mitochondrial DNA is shown by the red circles for the male and female siblings shown at the bottom of the chart.

Y-DNA Testing for Males
Y DNA is inherited by males only, from their father. The Y chromosome makes males male. Women instead inherit an X chromosome from their father, which makes them female. Because the Y chromosome is not admixed with the DNA of the mother, the same Y chromosome has been passed down through time immemorial.
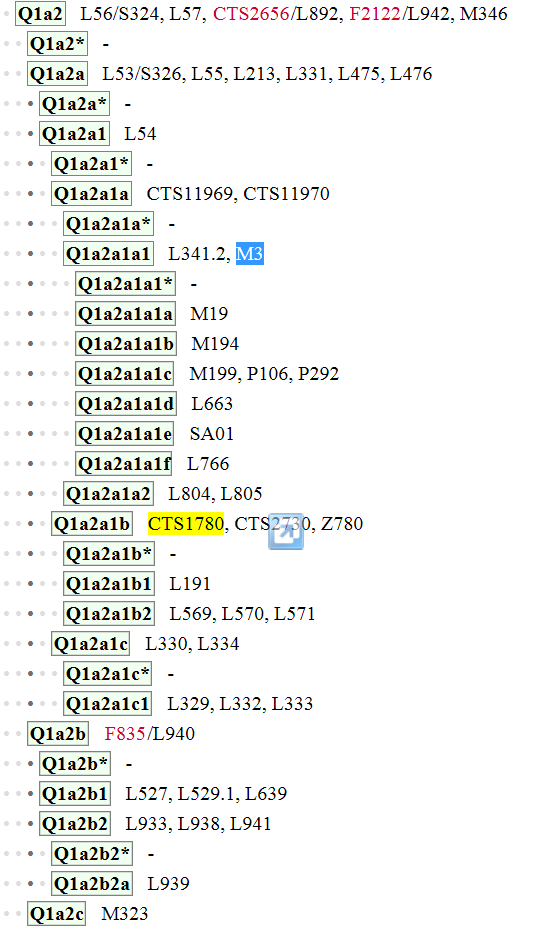
Given that the Y chromosome follows the typical surname path, Y DNA testing is very useful for confirming surname lineage to an expected direct paternal ancestor. In other words, an Estes male today should match, with perhaps a few mutations, to other descendants of Abraham Estes who was born in 1647 in Kent, England and immigrated to the colony of Virginia.
Furthermore, that same Y chromosome can look far back in time, thousands of years, to tell us where that English group of Estes men originated, before the advent of surnames and before the migration to England from continental Europe. I wrote about the Estes Y DNA here, so you can see an example of how Y DNA testing can be used.
Y DNA testing for matching and haplogroup identification, which indicates where in the world your ancestors were living within the past few hundred to few thousand years, is only available from Family Tree DNA. Testing can be purchased for either 37, 67 or 111 markers, with the higher marker numbers providing more granularity and specificity in matching.
Family Tree DNA provides three types of Y DNA tests.
- STR (short tandem repeat) testing is the traditional Y DNA testing for males to match to each other in a genealogically relevant timeframe. These tests can be ordered in panels of 37, 67 or 111 markers and lower levels can be upgraded to higher levels at a later date. An accurate base haplogroup prediction is made from STR markers.
- SNP (single nucleotide polymorphism) testing is a different type of testing that tests single locations for mutations in order to confirm and further refine haplogroups. Think of a haplogroup as a type of genetic clan, meaning that haplogroups are used to track migration of humans through time and geography, and are what is utilized to determine African, European, Asian or Native heritage in the direct paternal line. SNP tests are optional and can be ordered one at a time, in groups called panels for a particular haplogroup or a comprehensive research level Y DNA test called the Big Y can be ordered after STR testing.
- The Big Y test is a research level test that scans the entire Y chromosome to determine the most refined haplogroup possible and to report any previously unknown mutations (SNPs) that may define further branches of the Y DNA tree. This is the technique used to expand the Y haplotree.
You can read more about haplogroups here and about the difference between STR markers and SNPs here, here and here.
Customers receive the following features and tools when they purchase a Y DNA test at Family Tree DNA or the Ancestry Services test at 23andMe. The 23andMe Y DNA information is included in their Ancestry Services test. The Family Tree DNA Y DNA information requires specific tests and is not included in the Family Finder test. You can click here to read about the difference in the technology between Y DNA testing at Family Tree DNA and at 23andMe. Ancestry is not included in this comparison because they provide no Y DNA related information.
Y DNA Vendor Feature Summary Chart
|
Family Tree DNA |
23andMe |
| Varying levels of STR panel marker testing |
Yes, in panels of 37, 67 and 111 markers |
No |
| Test panel (STR) marker results |
Yes |
Not tested |
| Haplogroup assignment |
Yes – accurate estimate with STR panels, deeper testing available |
Yes –base haplogroup by scan – haplogroup designations are significantly out of date, no further testing available |
| SNP testing to further define haplogroup |
Yes – can purchase individual SNPs, by SNP panels or Big Y test |
No |
| Matching to other participants |
Yes |
No |
| Trees available for your matches |
Yes |
No |
| E-mail of matches provided |
Yes |
No |
| Calculator tool to estimate probability of generational distance between you and a match |
Yes |
No |
| Earliest known ancestor information |
Yes |
No |
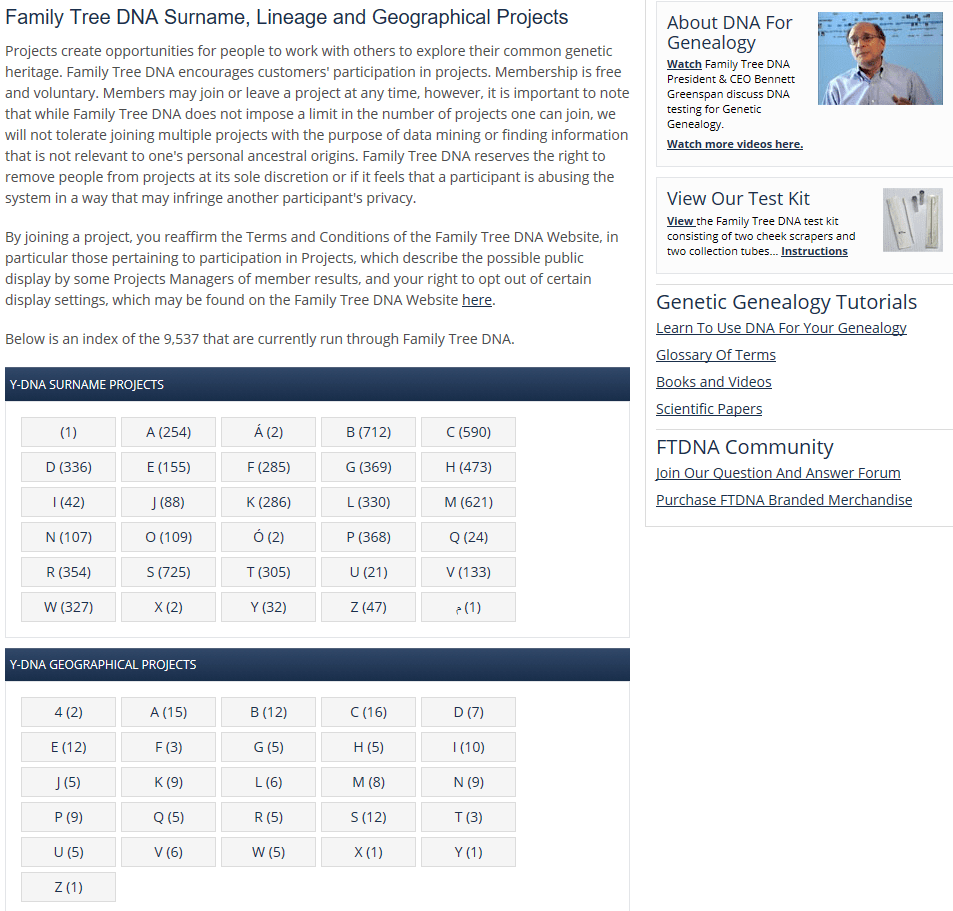
| Projects |
Surname, haplogroup and geographic projects |
No |
| Ability to search Y matches |
Yes |
No Y matching |
| Ability to search matches within projects |
Yes |
No projects |
| Ability to search matches by partial surname |
Yes |
No |
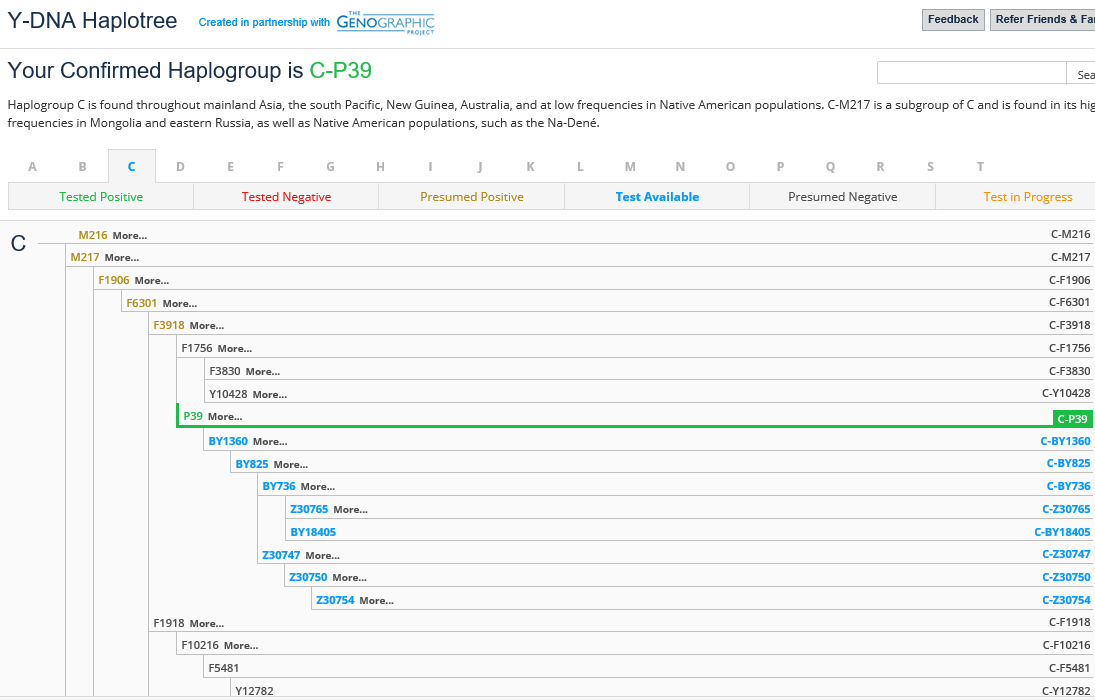
| Haplotree and customer result location on tree |
Yes, detailed with every branch |
Yes, less detailed, subset |
| Terminal SNP used to determine haplogroup |
Yes |
Yes, small subset available |
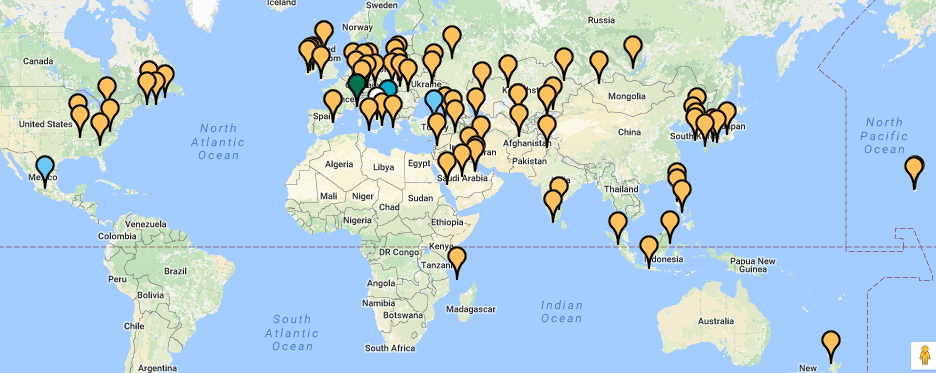
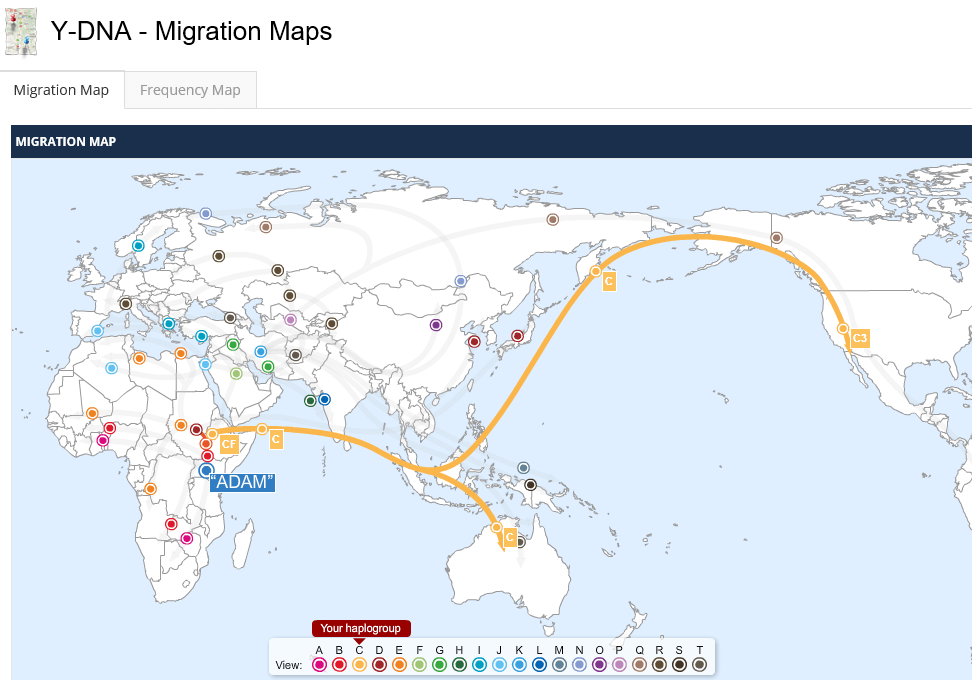
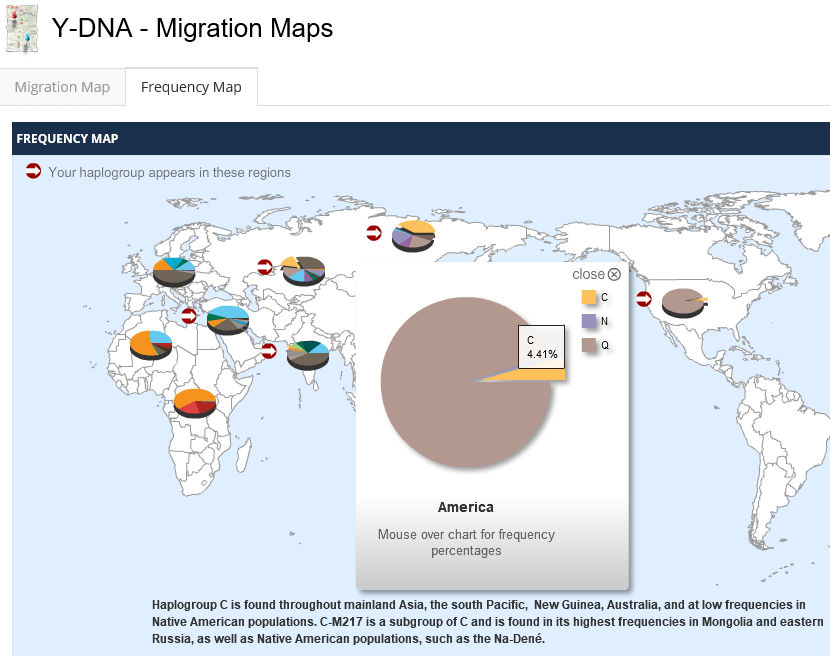
| Haplogroup Map |
Migration map |
Heat map |
| Ancestral Origins – summary by ancestral location of others you match, by test level |
Yes |
No |
| Haplogroup Origins – match ancestral location summary by haplogroup, by test level |
Yes |
No |
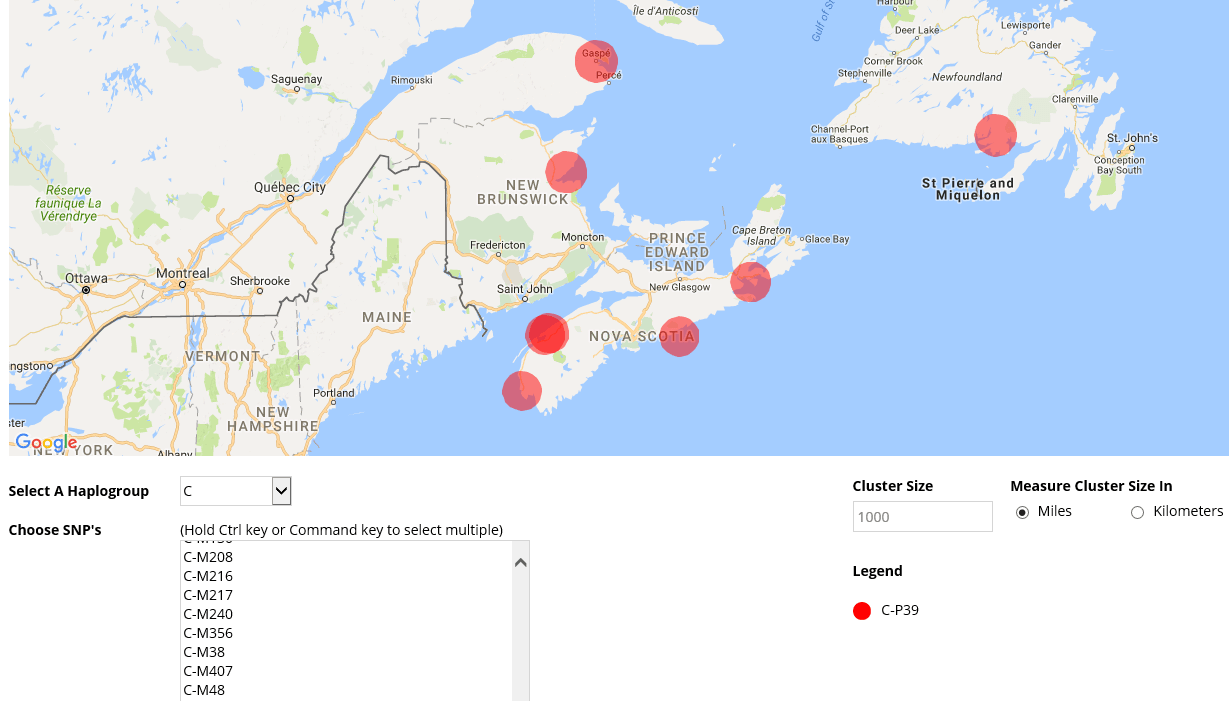
| SNP map showing worldwide locations of any selected SNP |
Yes |
No |
| Matches map showing mapped locations of your matches most distant ancestor in the paternal line, by test panel |
Yes |
No |
| Big Y – full scan of Y chromosome for known and previously unknown mutations (SNPs) |
Yes |
No |
| Big Y matching |
Yes |
No |
| Big Y matching known SNPs |
Yes |
No |
| Big Y matching novel variants (unknown or yet unnamed SNPs) |
Yes |
No |
| Filter Big Y matches |
Yes |
No |
| Big Y results |
Yes |
No |
| Advanced matching for multiple test types |
Yes |
No |
| DNA is archived so additional tests or upgrades can be ordered at a later date |
Yes, 25 years |
No |
Mitochondrial DNA Testing for Everyone
Mitochondrial DNA is contributed to both genders of children by mothers, but only the females pass it on. Like the Y chromosome, mitochondrial DNA is not admixed with the DNA of the other parent. Therefore, anyone can test for the mitochondrial DNA of their matrilineal line, meaning their mother’s mother’s mother’s lineage.
Matching can identify family lines as well as ancient lineage.
You receive the following features and tools when you purchase a mitochondrial DNA test from Family Tree DNA or the Ancestry Services test from 23andMe. The Family Tree DNA mitochondrial DNA information requires specific tests and is not included in the Family Finder test. The 23andMe mitochondrial information is provided with the Ancestry Services test. Ancestry is omitted from this comparison because they do not provide any mitochondrial information.
Mitochondrial DNA Vendor Feature Summary Chart
|
Family Tree DNA |
23andMe |
| Varying levels of testing |
Yes, mtPlus and Full Sequence |
No |
| Test panel marker results |
Yes, in two formats, CRS and RSRS |
No |
| Rare mutations, missing and extra mutations, insertions and deletions reported |
Yes |
No |
| Haplogroup assignment |
Yes, most current version, Build 17 |
Yes, partial and out of date version |
| Matching to other participants |
Yes |
No |
| Trees of matches available to view |
Yes |
No |
| E-mail address provided to matches |
Yes |
No |
| Earliest known ancestor information |
Yes |
No |
| Projects |
Surname, haplogroup and geographic available |
No |
| Ability to search matches |
Yes |
No |
| Ability to search matches within project |
Yes |
No projects |
| Ability to search match by partial surname |
Yes |
No |
| Haplotree and customer location on tree |
No |
Yes |
| Mutations used to determine haplogroup provided |
Yes |
No |
| Haplogroup Map |
Migration map |
Heat map |
| Ancestral Origins – summary by ancestral location of others you match, by test level |
Yes |
No |
| Haplogroup Origins –match ancestral location summary by haplogroup |
Yes |
No |
| Matches map showing mapped locations of your matches most distant ancestor in the maternal line, by test level |
Yes |
No |
| Advanced matching for multiple test types |
Yes |
No |
| DNA is archived so additional tests or upgrades can be ordered at a later date |
Yes, 25 years |
No |
Overall Genealogy Summary
Serious genealogists should test with at least two of the three major vendors, being Family Tree DNA and Ancestry, with 23andMe coming in as a distant third.
No genetic genealogy testing regimen is complete without Y and mitochondrial DNA for as many ancestral lines as you can find to test. You don’t know what you don’t know, and you’ll never know if you don’t test.
Unfortunately, many people, especially new testers, don’t know Y and mitochondrial DNA testing for genetic genealogy exists, or how it can help their genealogy research, which is extremely ironic since these were the first tests available, back in 2000.
You can read about finding Y and mitochondrial information for various family lines and ancestors and how to assemble a DNA Pedigree Chart here.
You can also take a look at my 52 Ancestors series, where I write about an ancestor every week. Each article includes some aspect of DNA testing and knowledge gained by a test or tests, DNA tool, or comparison. The DNA aspect of these articles focuses on how to use DNA as a tool to discover more about your ancestors.
Testing for Medical/Health or Traits
The DTC market also includes health and medical testing, although it’s not nearly as popular as genetic genealogy.
Health/medical testing is offered by 23andMe, who also offers autosomal DNA testing for genealogy.
Some people do want to know if they have genetic predispositions to medical conditions, and some do not. Some want to know if they have certain traits that aren’t genealogically relevant, but might be interesting – such as whether they carry the Warrior gene or if they have an alcohol flush reaction.
23andMe was the first company to dip their toes into the water of Direct to Consumer medical information, although they called it “health,” not medicine, at that time. Regardless of the terminology, information regarding Parkinson’s and Alzheimer’s, for example, were provided for customers. 23andMe attempted to take the raw data and provide the consumer with something approaching a middle of the road analysis, because sometimes the actual studies provide conflicting information that might not be readily understood by consumers.
The FDA took issue with 23andMe back in November of 2013 when they ordered 23andMe to discontinue the “health” aspect of their testing after 23andMe ignored several deadlines. In October 2015, 23andMe obtained permission to provide customers with some information, such as carrier status, for 36 genetic disorders.
Since that time, 23andMe has divided their product into two separate tests, with two separate prices. The genealogy only test called Ancestry Service can be purchased separately for $99, or the combined Health + Ancestry Service for $199.
If you are interested in seeing what the Health + Ancestry test provides, you can click here to view additional information.
However, there is a much easier and less expensive solution.
If you have taken the autosomal test from 23andMe, Ancestry or Family Tree DNA, you can download your raw data file from the vendor and upload to Promethease to obtain a much more in-depth report than is provided by 23andMe, and much less expensively – just $5.
I reviewed the Promethease service here. I found the Promethease reports to be very informative and I like the fact that they provide information, both positive and negative for each SNP (DNA location) reported. Promethease avoids FDA problems by not providing any interpretation or analysis, simply the data and references extracted from SNPedia for you to review.
I would be remiss if I didn’t mention that you should be sure you really want to know before you delve into medical testing. Some mutations are simply indications that you could develop a condition that you will never develop or that is not serious. Other mutations are not so benign. Promethease provides this candid page before you upload your data.

Different files from different vendors provide different results at Promethease, because those vendors test different SNP locations in your DNA. At the Promethease webpage, you can view examples.
Traits
Traits fall someplace between genealogy and health. When you take the Health + Ancestry test at 23andMe, you do receive information about various traits, as follows:

Of course, you’ll probably already know if you have several of these traits by just taking a look in the mirror, or in the case of male back hair, by asking your wife.
At Family Tree DNA, existing customers can order tests for Factoids (by clicking on the upgrade button), noted as curiosity tests for gene variants.

Family Tree DNA provides what I feel is a great summary and explanation of what the Factoids are testing on their order page:
“Factoids” are based on studies – some of which may be controversial – and results are not intended to diagnose disease or medical conditions, and do not serve the purpose of medical advice. They are offered exclusively for curiosity purposes, i.e. to see how your result compared with what the scientific papers say. Other genetic and environmental variables may also impact these same physiological characteristics. They are merely a conversational piece, or a “cocktail party” test, as we like to call it.”
| Test |
Price |
Description |
| Alcohol Flush Reaction |
$19 |
A condition in which the body cannot break down ingested alcohol completely. Flushing, after consuming one or two alcoholic beverages, includes a range of symptoms: nausea, headaches, light-headedness, an increased pulse, occasional extreme drowsiness, and occasional skin swelling and itchiness. These unpleasant side effects often prevent further drinking that may lead to further inebriation, but the symptoms can lead to mistaken assumption that the people affected are more easily inebriated than others. |
| Avoidance of Errors |
$29 |
We are often angry at ourselves because we are unable to learn from certain experiences. Numerous times we have made the wrong decision and its consequences were unfavorable. But the cause does not lie only in our thinking. A mutation in a specific gene can also be responsible, because it can cause a smaller number of dopamine receptors. They are responsible for remembering our wrong choices, which in turn enables us to make better decisions when we encounter a similar situation. |
| Back Pain |
$39 |
Lumbar disc disease is the drying out of the spongy interior matrix of an intervertebral disc in the spine. Many physicians and patients use the term lumbar disc disease to encompass several different causes of back pain or sciatica. A study of Asian patients with lumbar disc disease showed that a mutation in the CILP gene increases the risk of back pain. |
| Bitter Taste Perception |
$29 |
There are several genes that are responsible for bitter taste perception – we test 3 of them. Different variations of this gene affect ability to detect bitter compounds. About 25% of people lack ability to detect these compounds due to gene mutations. Are you like them? Maybe you don’t like broccoli, because it tastes too bitter? |
| Caffeine Metabolism |
$19 |
According to the results of a case-control study reported in the March 8, 2006 issue of JAMA, coffee is the most widely consumed stimulant in the world, and caffeine consumption has been associated with increased risk for non-fatal myocardial infarction. Caffeine is primarily metabolized by the cytochrome P450 1A2 in the liver, accounting for 95% of metabolism. Carriers of the gene variant *1F allele are slow caffeine metabolizers, whereas individuals homozygous for the *1A/*1A genotype are rapid caffeine metabolizers. |
| Earwax Type |
$19 |
Whether your earwax is wet or dry is determined by a mutation in a single gene, which scientists have discovered. Wet earwax is believed to have uses in insect trapping, self-cleaning and prevention of dryness in the external auditory canal of the ear. It also produces an odor and causes sweating, which may play a role as a pheromone. |
| Freckling |
$19 |
Freckles can be found on anyone no matter what the background. However, having freckles is genetic and is related to the presence of the dominant melanocortin-1 receptor MC1R gene variant. |
| Longevity |
$49 |
Researchers at Harvard Medical School and UC Davis have discovered a few genes that extend lifespan, suggesting that the whole family of SIR2 genes is involved in controlling lifespan. The findings were reported July 28, 2005 in the advance online edition of Science. |
| Male Pattern Baldness |
$19 |
Researchers at McGill University, King’s College London and GlaxoSmithKline Inc. have identified two genetic variants in Caucasians that together produce an astounding sevenfold increase of the risk of male pattern baldness. Their results were published in the October 12, 2008 issue of the Journal of Nature Genetics. |
| Monoamine Oxidase A (Warrior Gene) |
$49.50 |
The Warrior Gene is a variant of the gene MAO-A on the X chromosome. Recent studies have linked the Warrior Gene to increased risk-taking and aggressive behavior. Whether in sports, business, or other activities, scientists found that individuals with the Warrior Gene variant were more likely to be combative than those with the normal MAO-A gene. However, human behavior is complex and influenced by many factors, including genetics and our environment. Individuals with the Warrior Gene are not necessarily more aggressive, but according to scientific studies, are more likely to be aggressive than those without the Warrior Gene variant. This test is available for both men and women, however, there is limited research about the Warrior Gene variant amongst females. Additional details about the Warrior Gene genetic variant of MAO-A can be found in Sabol et al, 1998. |
| Muscle Performance |
$29 |
A team of researchers, led by scientists at Dartmouth Medical School and Dartmouth College, have identified and tested a gene that dramatically alters both muscle metabolism and performance. The researchers say that this finding could someday lead to treatment of muscle diseases, including helping the elderly who suffer from muscle deterioration and improving muscle performance in endurance athletes. |
| Nicotine Dependence |
$19 |
In 2008, University of Virginia Health System researchers have identified a gene associated with nicotine dependence in both Europeans and African Americans. |
Many people are interested in the Warrior Gene, which I wrote about here.
At Promethease, traits are simply included with the rest of the conditions known to be associated with certain SNPs, such as baldness, for example, but I haven’t done a comparison to see which traits are included.
Additional Vendor Information to Consider
Before making your final decision about which test or tests to purchase, there are a few additional factors you may want to consider.
As mentioned before, Ancestry requires a subscription in addition to the cost of the DNA test for the DNA test to be fully functional.
One of the biggest issues, in my opinion, is that both 23andMe and Ancestry sell customer’s anonymized DNA information to unknown others. Every customer authorizes the sale of their information when they purchase or activate a kit – even though very few people actually take the time to read the Terms and Conditions, Privacy statements and Security documents, including any and all links. This means most people don’t realize they are authorizing the sale of their DNA.
At both 23andMe and Ancestry, you can ALSO opt in for additional non-anonymized research or sale of your DNA, which you can later opt out of. However, you cannot opt out of the lower level sale of your anonymized DNA without removing your results from the data base and asking for your sample to be destroyed. They do tell you this, but it’s very buried in the fine print at both companies. You can read more here.
Family Tree DNA does not sell your DNA or information.
All vendors can change their terms and conditions at any time. Consumers should always thoroughly read the terms and conditions including anything having to do with privacy for any product they purchase, but especially as it relates to DNA testing.
Family Tree DNA archives your DNA for later testing, which has proven extremely beneficial when a family member has passed away and a new test is subsequently introduced or the family wants to upgrade a current test. Had my mother’s DNA not been archived at Family Tree DNA, I would not have Family Finder results for her today – something I thank Mother and Family Tree DNA for every single day.
Family Tree DNA also accepts transfer files from 23andMe, Ancestry and very shortly, MyHeritage – although some versions work better than others. For details on which companies accept which file versions, from which vendors, and why, please read Autosomal DNA Transfers – Which Companies Accept Which Tests?
If you tested on a compatible version of the 23andMe Test (V3 between December 2010 and November 2013) or the Ancestry V1 (before May 2016) you may want to transfer your raw data file to Family Tree DNA for free and pay only $19 for full functionality, as opposed to taking the Family Finder test. Family Tree DNA does accept later versions of files from 23andMe and Ancestry, but you will receive more matches if you test on the same chip platform that Family Tree DNA utilizes instead of doing a transfer.
Additional Vendor Considerations Summary Chart
|
Family Tree DNA |
Ancestry |
23andMe |
| Subscription required in addition to cost of DNA test |
No |
Yes for full functionality, partial functionality is included without subscription, minimum subscription is $49 by calling Ancestry |
No |
| Customer Support |
Good and available |
Available, nice but often not knowledgeable about DNA |
Poor |
| Sells customer DNA information |
No |
Yes |
Yes |
| DNA raw data file available to download |
Yes |
Yes |
Yes |
| DNA matches file available to download including match info and chromosome match locations |
Yes |
No |
Yes |
| Customers genealogically focused |
Yes |
Yes |
Many No |
| Accepts DNA raw data transfer files from other companies |
Yes, most, see article for specifics |
No |
No |
| DNA archived for later testing |
Yes, 25 years |
No |
No |
| Beneficiary provision available |
Yes |
No |
No |
Which Test is Best For You?
I hope you now know the answer as to which DNA test is best for you – or maybe it’s multiple tests for you and other family members too!
DNA testing holds so much promise for genealogy. I hesitate to call DNA testing a miracle tool, but it often is when there are no records. DNA testing works best in conjunction with traditional genealogical research.
There are a lot of tests and options. The more tests you take, the more people you match. Some people test at multiple vendors or upload their DNA to third party sites like GedMatch, but most don’t. In order to make sure you reach those matches, which may be the match you desperately need, you’ll have to test at the vendor where they tested. Otherwise, they are lost to you. That means, of course, that eventually, if you’re a serious genealogist, you’ll be testing at all 3 vendors. Don’t forget about Y and mitochondrial tests at Family Tree DNA.
Recruit family members to test and reach out to your matches. The more you share and learn – the more is revealed about your ancestors. You are, after all, the unique individual that resulted from the combination of all of them!
Update: Vendor prices updated June 22, 2017.
______________________________________________________________
Disclosure
I receive a small contribution when you click on some of the links to vendors in my articles. This does NOT increase the price you pay but helps me to keep the lights on and this informational blog free for everyone. Please click on the links in the articles or to the vendors below if you are purchasing products or DNA testing.
Thank you so much.
DNA Purchases and Free Transfers
Genealogy Services
Genealogy Research
Like this:
Like Loading...