Nine Autosomal Tools at Family Tree DNA

The introduction of the Phased Family Finder Matches has added a new way to view autosomal DNA results at Family Tree DNA and a powerful new tool to the genealogists toolbox.

The Phased Family Finder Matches are the 9th tool provided for autosomal test results by Family Tree DNA. Did you know where were 9?

Each of the different methodologies provides us with information in a unique way to assist in our relentless search for cousins, ancestors and our quests to break down brick walls.

That’s the good news.

The not-so-good news is that sometimes options are confusing, so I’d like to review each tool for viewing autosomal match information, including:

  • When to use each tool
  • How to use each tool
  • What the results mean to you
  • The unique benefits of each tool
  • The cautions and things you need to know about each tool including what they are not

The tools are:

  1. Regular Matching
  2. ICW (In Common With)
  3. Not ICW (Not In Common With)
  4. The Matrix
  5. Chromosome Browser
  6. Phased Family Matching
  7. Combined Advanced Matching
  8. MyOrigins Matching
  9. Spreadsheet Matching

You Have Options

Family Tree DNA provides their clients with options, for which I am eternally grateful. I don’t want any company deciding for me which matches are and are not important based on population phasing (as opposed to parental phasing), and then removing matches they feel are unimportant. For people who are not fully endogamous, but have endogamous lines, matches to those lines, which are valid matches, tend to get stripped away when a company employs population based phasing – and once those matches are gone, there is no recovery unless your match happens to transfer their results to either Family Tree DNA or GedMatch.

The great news is that the latest new option, Phased Family Matching, is focused on making easy visual comparisons of high quality parental matches which is especially useful for those who don’t want to dig deeply.

There are good options for everyone at all ranges of expertise, from beginners to those who like to work with spreadsheets and extract every teensy bit of information.

So let’s take a look at all of your matching options at Family Tree DNA. If you’re not taking advantage of all of them, you’re missing out. Each option is unique and offers something the other options don’t offer.

In case you’re curious, I’ll be bouncing back and forth between my kit, my mother’s kit and another family member’s kit because, based on their matches utilizing the various tools, different kits illustrate different points better.

Also, please note that you can click on any image to see a larger version.

Selecting Options

FF9 options

Your selection options for Family Finder are available on both your Dashboard page under the Family Finder heading, right in the middle of the page, and the dropdown myFTDNA menu, on the upper left, also under Family Finder.

Ok, let’s get started. 

#1 – Regular Matching

By regular matching, I’m referring to the matches you see when you click on the “Matches” tab on your main screen under Family Finder or in the dropdown box.

FF9 regular matching

Everyone uses this tool, but not everyone knows about the finer points of various options provided.

There’s a lot of information here folks. Are you systematically using this information to its full advantage?

Your matches are displayed in the highest match first order. All of the information we utilize regularly (or should) is present, including:

  • Relationship Range
  • Match Date
  • Shared CentiMorgans
  • Longest (shared) Block
  • X-Match
  • Known Relationship
  • Ancestral Surnames (double click to see entire list)
  • Notes
  • E-mail envelope icon
  • Family Tree
  • Parental “side” icon

The Expansion “+” at the right side of each match, shown below, shows us:

  • Tests Taken
  • mtDNA haplogroup
  • Y haplogroup

Clicking on your match’s profile (their picture) provides additional information, if they have provided that information:

  • Most distant maternal ancestor
  • Most distant paternal ancestor
  • Additional information in the “about me” field, sometimes including a website link

On the match page, you can search for matches either by their full name, first name, last name or click on the “Advanced Search” to search for ancestral surname. These search boxes can be found at the top right.

FF9 advanced search

The Advanced Search feature, underneath the search boxes at right, also provides you with the option of combining search criteria, by opening two drop down boxes at the top left of the screen.

FF9 search combo

Let’s say I want to see all of my matches on the X chromosome. I make that selection and the only people displayed as matches are those whom I match on the X chromosome.

You can see that in this case, there are 280 matches. If I have any Phased Family Matches, then you will see how many X matches I have on those tabs too.

The first selection box works in combination with the second selection box.

FF9 search combo 2

Now, let’s say I want to sort in Longest Block Order. That section sorts and displays the people who match me on the X chromosome in Longest Block Order.

FF9 longest block

Prerequisites

  • Take the Family Finder test or transfer your results from either 23andMe (V3 only) or Ancestry (V1 only, currently.)
  • Match must be over the matching threshold of 9cM if shared cM are less than 20, or, the longest block must be at least 7.69 cM if the total shared cM is 20 or greater.

Power Features

  • The ability to customize your view by combining search, match and sort criteria.

Cautions

  • It’s easy to forget that you’re ONLY working with X matches, for example, once you sort, and not all of your matches. Note the Reset Filter button above your matches which clears all of the sort and search criteria. Always reset, just to be on the safe side, before you initiate another sort.

FF9 reset filter

  • Please note that the search boxes and logic are in the process of being redesigned, per a conversation Michael Davila, Director of Product Development, on 7-20-2016. Currently, if you search for the name “Donald,” for example, and then do an “in common with” match to someone on the Donald match list, you’ll only see those individuals who are in common with “Donald,” meaning anyone without “Donald” as one of their names won’t show as a match. The logic will be revised shortly so that you will see everyone “in common with,” not just “Donald.” Just be aware of this today and don’t do an ICW with someone you’ve searched for in the search box until this is revised.

#2 – In Common With (ICW)

You can select anyone from your match list to see who you match in common with them.

This is an important feature because it gives me a very good clue as to who else may match me on that same genealogical line.

For example, cousin Donald is related on the paternal line. I can select Donald by clicking the box to the left of his profile which highlights his row in yellow. I can then select what I want to do with Don’s match.

FF9 ICW

You will see that Don is selected in the match selection box on the lower left, and the options for what I can do with Don are above the matches. Those options are:

  • Chromosome Browser
  • In Common With
  • Not in Common With

Let’s select “In Common With.”

Now, the matches displayed will ONLY be those that I match in common with Don, meaning that Donald and I both match these people.

FF9 ICW matches

As you can see, I’m displaying my matches in common with Don in longest block order. You can click on any of the header columns to display in reverse order.

There are a total of 82 matches in common with Don and of those, 50 are paternally assigned. We’ll talk about how parental “side” assignments happen in a minute.

Prerequisites

  • None

Power Features

  • Can see at a glance which matches warrant further inspection and may (or may not) be from a common genealogical line.

Cautions

  • An ICW match does NOT mean that the matching individual IS from the same common line – only genealogical research can provide that information.
  • An ICW matches does NOT mean that these three people, you, your match and someone who matches both of you is triangulated – meaning matching on the same segment. Only individual matching with each other provides that information.
  • It’s easy to forget that you’re not working with your entire match list, but a subset. You can see that Donald’s name appears in the box at the upper left, along with the function you performed (ICW) and the display order if you’ve selected any options from the second box.

# 3 – Not In Common With

Now, let’s say I want to see all of my X matches that are not in common with my mother, who is in the data base, which of course suggests that they are either on my father’s side or identical by chance. My father is not in the data base, and given that he died in 1963, there is no chance of testing him.

Keep in mind though that because X matches aren’t displayed unless you have another qualifying autosomal segment, that they are more likely to be valid matches than if they were displayed without another matching segment that qualifies as a match.

For those who don’t know, X matches have a unique inheritance pattern which can yield great clues as to which side of your tree (if you’re a male), and which ancestors on various sides of your tree X matches MUST come from (males and females both.) I wrote about this here, along with some tools to help you work with X matches.

To utilize the “Not In Common With” feature, I would select my mother and then select the “Not In Common With” option, above the matches.

FF9 NICW

I would then sort the results to see the X matches by clicking on the top of the column for X-Match – or by any other column that I wanted to see.

FF9 NICW X

I have one very interesting not in common with match – and that’s with a Miller male that I would have assumed, based on the surname, was a match from my mother’s side. He’s obviously not, at least based on that X match. No assuming allowed!

Prerequisites

  • None

Power Features

  • Can see at a glance which matches warrant further inspection and may be from a common genealogical line – or are NOT in common with a particular person.

Cautions

  • Be sure to understand that “not in common with” means that you, the person you match and the list of people shown as a result of the “Not ICW” do not all match each other.  You DO match the person on your match list, but the list of “not in common with” matches are the people who DON’T match both of you.  Not in common with is the opposite of “in common with” where your match list does match you and the person you’re matching in common with.
  • The X and other chromosome matches may be inherited from different ancestors. Every matching segment needs to be analyzed separately.

#4 – The Matrix

Let’s say that I have a list of matches, perhaps a list of individuals that I found doing an ICW with my cousin, and I wonder if these people match each other. I can utilize the Matrix grid to see.

Going back to the ICW list with cousin Donald, let’s see if some of those people match each other on the Matrix.

Let’s pick 5 people.

I’m selecting Cheryl, Rex, Charles, Doug and Harold.

Margaret Lentz chart

I’m making these particular selections because I know that all of these people, except Harold, are related to my mother, Barbara, shown on the bottom row of the chart above.  This chart, borrowed from another article (William is not in this comparison), shows how Cheryl, Rex, Charles and Barbara who have all DNA tested are related to each other.  Some are related through the Miller line, some through the dual Lentz/Miller line, and some just from the Lentz line.  Doug is related through the Miller line only, and at least 4 generations upstream. Doug may also be related through multiple lines, but is not descended from the Lentz line.

The people I’ve selected for the matrix are not all related to each other, and they don’t all share one common ancestral line.

Harold is a wild card – I have no idea how he is related or who he is related to, so let’s see what we can determine.

FF9 Matrix choices

As you make selections on the Matrix page, up to 10 selections are added to the grid.

FF9 Matrix grid

You can see that Charles matches Cheryl and Harold.

You can see that Rex matches Charles and Cheryl and Harold.

You can see that Doug matches only Cheryl, but this isn’t surprising as the common line between Doug and the known cousins is at least 4 generations further back in time on the Miller line.

The known relationship are:

  • Don and Cheryl are siblings, descended from the Lentz/Miller.
  • Rex is a known cousin on the Miller/Lentz line
  • Charles is a known cousin on the Lentz line only
  • Doug is a known cousin on the Miller line only

Let me tell you what these matches indicate to me.

Given that Harold matches Rex and Charles and Cheryl, IF and that’s a very big IF, he descends from the same lines, then he would be related to both sides of this family, meaning both the Miller and Lentz lines.

  • He could be a downstream cousin after the Lentz and Miller lines married, meaning a descendant of Margaret Lentz and John David Miller, or other Miller/Lentz couples
  • He could be independently related to both lines upstream. They did intermarry.
  • He could be related to Charles or Rex through an entirely separate line that has nothing to do with Lentz or Miller.

So I have no exact answer, but this does tell me where to look. Maybe I could find additional known Lentz or Miller line descendants to add to the Matrix which would provide additional information.

Prerequisites

  • None

Power Features

  • Can see at a glance which matches match each other as well.

Cautions

  • Matrix matches do NOT mean that these individuals match on the same segments, it just means they do match on some segment. A matrix match is not triangulation.
  • Matrix matches can easily be from different lines to different ancestors. For example, Harold could match each one of three individuals that he matches on different ancestral lines that have nothing to do with their common Lentz or Miller line.

#5 – Chromosome Browser

I want to know if the 5 individuals that I selected to compare in the Matrix match me on any of the same segments.

I’m going back to my ICW list with cousin Donald.

I’ve selected my 5 individuals by clicking the box to the left of their profiles, and I’m going to select the chromosome browser.

FF9 chromosome browser choices

The chromosome browser shows you where these individuals match you.

Overlapping segments mean the people who overlap all match you on that segment, but overlapping segments do NOT mean they also match each other on these same segments.

Translated, this means they could be matching you on different sides of your family or are identical by chance. Remember, you have two sides to your chromosome, a Mom’s side and a Dad’s side, which are intermingled, and some people will match you by chance. You can read more about this here.

The chromosome browser shows you THAT they match you – it doesn’t tell you HOW they match you or if they match each other.

FF9 chromosome browser view2

The default view shows matches of 5cM or greater. You can select different thresholds at the top of the comparison list.

You’ll notice that all 5 of these people match me, but that only two of them match me on overlapping segments, on chromosome 3. Among those 5 people, only those who match me on the same segments have the opportunity to triangulate.

This gives you the opportunity to ask those two individuals if they also match each other on this same chromosome. In this case, I have access to both of those kits, and I can tell you that they do match each other on those segments, so they do triangulate mathematically. Since I know the common ancestor between myself, Cheryl and Rex, I can assign this segment to John David Miller and Margaret Lentz. That, of course, is the goal of autosomal matching – to identify the common ancestor of the individuals who match.

You also have the option to download the results of this chromosome browser match into a spreadsheet. That’s the left-most download option at the top of the chromosomes. We’ll talk about how to utilize spreadsheets last.

The middle option, “view in a table” shows you these results, one pair of individuals at a time, in a table.

This is me compared to Rex. You will have a separate table for each one of the individuals as compared to you. You switch between them at the bottom right.

FF9 chromosome browser table2

The last download option at the furthest right is for your entire list of matches and where they match you on your chromosomes.

Prerequisites

  • None

Power Features

  • Can visually see where individuals and multiple people match you on your chromosomes, and where they overlap which suggests they may triangulate.

Cautions

  • When two people match you on the same chromosome segment, this does not mean that they also match each other on that segment. Matching on overlapping segments is not triangulation, although it’s the first step to triangulation.
  • For triangulation, you will need to contact your matches to determine if they also match each other on the same segment where they both match you. You may also be able to deduce some family matching based on other known individuals from the same line that you also match on that same segment, if your match matches them on that segment too.
  • The chromosome browser is limited to 5 people at a time, compared to you. By utilizing spreadsheet matching, you can see all of your matches on a particular segment, together.

#6 – Phased Family Matching

Phased Family Matching is the newest tool introduced by Family Tree DNA. I wrote about it here. The icons assigned to matches make it easy to see at a glance which side of your family, maternal or paternal, or both, a match derives from.

ff9 parental iconPhased Family Matching allows you to link the DNA results of qualified relatives to your tree and by doing so, Family Tree DNA assigns matches to maternal or paternal buckets, or sometimes, both, as shown in the icon above.

This phased matching utilizes both parental phasing in addition to a slightly higher threshold to assure that the matches they assign to parental sides can be done so with confidence. In order to be assigned a maternal or paternal icon, your match must match you and your qualifying relative at 9cM or greater on at least one of the same segments over the matching threshold. This is different than an ICW match, which only tells you that you do match, not how you match or that it’s on the same segment.

Qualifying relatives, at this time, are parents, grandparents, uncles, aunts and first cousins. Additional relatives are planned in the near future.

Icons are ONLY placed based on phased match results that meet the criteria.

These icons are important because they indicate which side of your family a match is from with a great deal of precision and confidence – beyond that of regular matching.

This is best illustrated by an example.

Phased FF2

In this example, this individual has their father and mother both in the system. You can see that their father’s side is assigned a blue icon and their mother’s side is assigned a pink (red) icon. This means they match this person on only one side of their family.  A purple icon with both a male and female image means that this person is related to you on both sides of your family.  Full siblings, when both parents are in the system to phase against, would receive both icons.

This sibling is showing as matching them on both sides of their family, because both parents are available for phasing.

If only one parent was available, the father, for example, then the sibling would only shows the paternal icon. The maternal icon is NOT added by inference. In Phased Family Matching, nothing is added by inference – only by exact allele by allele matching on the same segment – which is the definition of parentally phased matching.

These icons are ONLY added as a result of a high quality phased matches at or above the phased match threshold of 9cM.

You can read more about the Family Matching System in the Family Tree DNA Learning Center, here.

Prerequisites

  • You must have tested (or transferred a kit) for a qualifying relative. At this time qualifying relatives parents, grandparents, aunts, uncles and first cousins.
  • You must have uploaded a GEDCOM file or created a tree.
  • You must link the DNA of qualifying kits to that person your tree. I provided instructions for how to do this in this article.
  • You must match at the normal matching threshold to be on the match list, AND then match at or above the Phased Family Match threshold in the way described to be assigned an icon.
  • You must match on at least one full segment at or above 9cM.

Power Features

  • Can visually see which side of your family an individual is related to. You can be confident this match is by descent because they are phased to your parent or qualifying family member.

Cautions

  • If someone does not have an icon assigned, it does NOT mean they are not related on that particular side of the family. It only means that the match is not strong enough to generate an icon.
  • If someone DOES match on a particular side of the family, you will still need to do additional matching and genealogy work to determine which ancestor they descend from.
  • If someone is assigned to one side of your family, it does NOT preclude the possibility that they have a smaller or weaker match to your other side of the family.
  • If you upload a new Gedcom file after linking DNA to people in your tree, you will overwrite your DNA links and will have to relink individuals.
  • Having an icon assigned indicates mathematical triangulation for the person who tested, their parents or close relative against whom they were phased and their match with the icon.  However, technically, it’s not triangulation in cases where very close relatives are involved.  For example, parents, aunts, uncles and siblings are too closely related to be considered the third leg of the triangulation stool.  First cousins, however, in my opinion, could be considered the third leg of the three needed for triangulation.  Of course when triangulation is involved, more than three is always better – the more the merrier and the more certain you can be that you have identified the correct ancestor, ancestral couple, or ancestral line to assign that particular triangulated segment to.

# 7 – Combined Advanced Matching

One of the comparison tools often missed by people is Combined Advanced Matching.

Combined matching is available through the “Tools and Apps” button, then select “Advanced Matching.”

Advanced Matching allows you to select various options in combination with each other.

For example, one of my favorites is to compare people within a project.

You can do this a number of ways.

In the case of my mother, I’ll select everyone she matches on the Family Finder test in the Miller-Brethren project. This is a very focused project with the goal of sorting the Miller families who were of the Brethren faith.

FF9 combined matching

You can see that she has several matches in that project.

You can select a variety of combinations, including any level of Y or mtDNA testing, Family Finder, X matching, projects and “last name begins with.”

One of the ways I utilize this feature often is within a surname project, for males in particular, I select one Y level of matching at a time, combined with Family Finder, “show only people I match on all tests” and then the project name. This is a quick way to determine whether someone matches someone on Family Finder that is also in a particular surname project. And when your surname is Smith, this tool is extremely valuable. This provides a least a hint as to the possible distance to a common ancestor between individuals.

Another favorite way to utilize this feature is for non-surname projects like the American Indian project. This is perfect for people who are hunting for others with Native roots that they match – and you can see their Y and mtDNA haplogroups as a bonus!

Prerequisites

  • Must have joined the particular project if you want to use the project match feature within that project.

Power Features

  • The ability to combine matching criteria across products.
  • The ability to match within projects.
  • The ability to specify partial surnames.

Cautions

  • If you match someone on both Family Finder and either Y or mtDNA haplogroups, this does NOT mean that your common Family Finder ancestor is on that haplogroup line. It might be a good place to begin looking. Check to see if you match on the Y or mtDNA products as well.
  • All matches have their haplogroup displayed, not just IF you also match that haplogroup, unless you’ve specified the Y or mtDNA options and then you would only see the people you match which would be in the same major haplogroup, although not always the same subgroup because not everyone tests at the same level.
  • Not all surname project administrators allow people who do not carry that surname in the present generation to join their projects.

# 8 – MyOrigins Matching

One tool missed by many is the MyOrigins matching by ethnicity. For many, especially if you have all European, for example, this tool isn’t terribly useful, but if you are of mixed heritage, this tool can be a wonderful source of information.

Your matches (who have authorized this type of matching) will be displayed, showing only if they match you on your major world categories.  Only your matching categories will show.  For example, if my match, Frances, also has African heritage and I do not, I won’t see Frances’s African percentage and vice versa.

FF9 myOrigins

In this example, the person who tested falls into the major categories of European and Middle Eastern. Their matches who fall into either of these same categories will be displayed in the Shared Origins box. You may not be terribly excited about this – unless you are mixed African, Asian, European and Native American – and you have “lost ancestors” you can’t find. In that case, you may be very excited to contact other matches with the same ethnic heritage.

When you first open your myOrigins page, you will be greeted with a choice to opt in (by clicking) or to opt out (by doing nothing) of allowing your ethnic matches to view the same ethnic groups you carry. Your matches will not be able to see your ethnic groups that they don’t have in common with you.

FF9 myorigins opt in

You can also access those options to view or change by clicking on Account Settings, Privacy and Sharing, and then you can view or change your selection under “My DNA Results.”

FF9 myorigins security

Prerequisites

  • Must authorize Shared Origins matching.

Power Features

  • The ability to discern who among your matches shares a particular ethnicity, and to what degree.

Cautions

  • Just because you share a particular ethnicity does NOT mean you match on the shared ethnic line. Your common ancestor with that person may be on an entirely unrelated line.

# 9 – Spreadsheet Matching

Family Tree DNA offers you the ability to download your entire list of matches, including the specific segments where your matches match you, to a spreadsheet.

This is the granddaddy of the tools and it’s a tool used by all serious genetic genealogists. It’s requires the most investment from you both in terms of understanding and work, but it also yields the most information.

The power of spreadsheet comparisons isn’t in the 5 people I pushed through to the chromosome browser, in and of themselves, but in the power of looking at the locations where all of your matches match you and known relatives on particular segments.

Utilizing the chromosome browser, we saw that chromosome 3 had an overlap match between Rex (green) and Cheryl (blue) as compared to my mother (background chromosome.)

FF9 chr 3

We see that same overlap between Cheryl and Rex when we download the match spreadsheet for those 5 people.

However, when we download all of my mother’s matches, we have a much more powerful view of that segment, below. The 2 segments we saw overlapping on the chromosome browser are shown in green. All of these people colored pink match my mother on some part of the 37cM segment she shares with Rex.

FF9 spreadsheet match

This small part of my master spreadsheet combines my own results, rows in white, with those of my mother, rows in pink.

In this case, I only match one of these individuals that mother also matches on the same segment – Rex. That’s fine. It just means that I didn’t receive the rest of that DNA from mother – meaning the portions of the segments that match Sam, Cheryl, Don, Christina and Sharon.

On the first two rows, I did receive part of that DNA from mother, 7.64 of the 37cMs that Rex matches to Mom at a threshold of 5cM.

We know that Cheryl, Don and Rex all share a common ancestor on mother’s father’s side three generations removed – meaning John David Miller and Margaret Lentz. By looking at Cheryl, Don and Rex’s matches as well, I know that several of her matches do triangulate with Cheryl, Don and/or Rex.

What I didn’t know was how Christina fit into the picture. She is a new match. Before the new Phased Family Matching, I would have had to go into each account, those of Rex, Cheryl and Don, all of which I manage, to be sure that Christina matched all of them individually in addition to Mom’s kit.

I don’t have to do that now, because I can utilize the phased Family Matching instead. The addition of the Family Matching tool has taken this from three additional steps, assuming I have access to all kits, which most people don’t, to one quick definitive step.

Cheryl and Don are both mother’s first cousins, so matches can be phased against them. I have linked both of them to mother’s kit so she how has several individuals who are phased to Don and Cheryl which generate paternal icons since Don and Cheryl are related to mother on her father’s side.

Now, instead of looking at all of the accounts individually, my first step is to see if Christina has a paternal icon, which, in this case, means she phased against either Don and/or Cheryl since those are the only two people linked to mother who qualify for phasing, today.

FF9 parental phased match

Look, Christina does have a paternal icon, so I can add “Dad” into the side column for Christine in the spreadsheet for mother’s matches AND I know Christina triangulates to Mom and either Cheryl or Don, which ever cousin she phased against.

FF9 Christina chr 3

I can see which cousin she phased against by looking at the chromosome browser and comparing mother against Cheryl, Don and Christina.  As it turns out, Christina, in green, above, phased against both Cheryl and Don whose results are in orange and blue.

It’s a great day in the neighborhood to be able to use these tools together.

Prerequisites

  • Must download matches spreadsheet through the chromosome browser, adding new matches to your spreadsheet as they occur.
  • Must have a familiarity with Excel or another spreadsheet.
  • Must learn about matching, match groups and triangulation.

Power Features

  • The ability to control the threshold you wish to work with. For matches over the match threshold, Family Tree DNA provides all segment matches to 1cM with a total of 500 SNPs.
  • The ability to see trends and groups together.
  • The ability to view kits from all of your matches for more powerful matching.
  • The ability to combine your results with those of a parent (or sibling if parents not available) to see joint matching where it occurs.

Cautions

  • There is a comparatively steep learning curve if you’re not familiar with using spreadsheets, but it’s well worth the effort if you are serious about proving ancestors through triangulation.

Summary

I’m extremely grateful for the full complement of tools available at Family Tree DNA.

They provide a range of solutions for users at all levels – people who just want to view their ethnicity or to utilize matches at the vendor site as well as those who want tools like a chromosome browser, projects, ICW, not ICW, the Matrix, ethnicity matching, combined advanced matching and chromosome browser downloads for those of us who want actual irrefutable proof.  No one has to use the more advanced tools, but they are there for those of us who want to utilize them.

I’m sorry, I’m not from Missouri, but I still want to see it for myself. I don’t want any vendor taking the “trust me” approach or doing me any favors by stripping out my data. I’m glad that Family Tree DNA gives us multiple options and doesn’t make one size fit all by using a large hammer and chisel.

The easier, more flexible and informative Family Tree DNA makes the tools, the easier it will be to convince people to test or download their data from other vendors. The more testers, the better our opportunity to find those elusive matches and through them, ancestors.

The Concepts Series

I’ve been writing a “Concepts” series of articles. Recent articles have been about how to utilize and work with autosomal matches on a spreadsheet.

You might want to read these Concepts articles if you’re serious about working with autosomal DNA.

Concepts – How Your Autosomal DNA Identifies Your Ancestors

Concepts – Identical by…Descent, State, Population and Chance

Concepts – CentiMorgans, SNPs and Pickin’ Crab

Concepts – Parental Phasing

Concepts – Downloading Autosomal Data from Family Tree DNA

Concepts – Managing Autosomal DNA Matches – Step 1 – Assigning Parental Sides

Please join me shortly for the next Concepts article – Step 2 – Who’s Related to Whom?

In the meantime:

  • Make full use of the autosomal tools available at Family Tree DNA.
  • Test additional relatives meaning parents, grandparents, aunts, uncles, half-siblings, siblings, any cousin you can identify and talk into testing.
  • Take test kits to family reunions and holiday gatherings. No, I’m not kidding.
  • Don’t forget Y or mtDNA which can provide valuable tools to identify which line you might have in common, or to quickly eliminate some lines that you don’t have in common. Some cousins will carry valuable Y or mtDNA of your direct ancestral lines – and that DNA is full of valuable and unique information as well.
  • Link the DNA kits of those individuals you know to their place in your tree.
  • Transfer family kits from other vendors.

The more relatives you can identify and link in the system, the better your chances for meaningful matches, confirming ancestral relations, and solving puzzles.

Have fun!!!

______________________________________________________________

Disclosure

I receive a small contribution when you click on some of the links to vendors in my articles. This does NOT increase the price you pay but helps me to keep the lights on and this informational blog free for everyone. Please click on the links in the articles or to the vendors below if you are purchasing products or DNA testing.

Thank you so much.

DNA Purchases and Free Transfers

Genealogy Services

Genealogy Research

Margaret Lentz (1822-1903), The Seasons and the Sundays, 52 Ancestors #124

Margaret Elizabeth Lentz was born on December 31, 1822, New Year’s Eve, in Pennsylvania, probably in Cumberland County near Shippensburg, to Jacob Lentz and Johanna Fridrica Ruhle or Reuhle. Her mother went by the name Fredericka for her entire lifetime, with the exception of the 1850 census where she was listed as Hannah. Using the middle name is the normal German naming pattern.

Margaret Elizabeth, however, was different, parting for some reason with German naming tradition, she was always called by her first name, Margaret.

Margaret was the 7th of 10 children born to her parents, although two of her siblings had died before she was born. Her brother Johannes died as a small child in Germany in 1814, just two and a half years old. In 1813, Fredericka had a daughter, Elizabeth Katharina who would die on the ship coming to America at age 4 or 5. It appears that Margaret Elisabeth was named, in part, for her deceased sister.

Jacob and Fredericka had immigrated from Germany, beginning in the spring of 1817 and finally arriving in January 1819 after being shipwrecked in Norway and surviving two perilous voyages. Their trials and tribulations arriving in America are documented in Fredericka’s article. In 1822 when Fredericka had Margaret, the couple would have completed their indenture to pay for their passage and would likely have been farming on their own, although we don’t find them in either the 1820 nor the 1830 census in either Pennsylvania or Ohio.

Pennsylvania to Ohio

Jacob and Fredericka and their entire family moved from Shippensburg to Montgomery County in about 1829 or 1830.

Fredericka would have been about 7 or 8 years old and probably found riding in a wagon to a new home in a new location quite the adventure. Perhaps she laid in the back on her tummy, kicking her bare feet in the air and watched the scenery disappear.  Or perhaps she rode on the seat with the driver, probably her father or oldest brother, and watched the new landscape appear in the distance. Maybe she cradled a doll on her lap, or maybe a younger sibling.

Margaret Lentz map PA to Indiana

At about 10 miles a day, the trip would have taken about 40 days. They may have made better time, or worse, depending on the weather.

Margaret’s mother may have been pregnant for her last sibling, Mary. For all we know, Mary may have been delivered in that wagon. I shudder to think.

We find Margaret’s parents on tax records beginning in the mid-1830s in Madison Township in Montgomery County, Ohio where they would purchase land from their son, Jacob F. Lentz in 1841.

Margaret Lentz 1851 Montgomery co map

Cousin Keith Lentz provided the 1851 tract map above with an arrow pointing to Jacob Lentz’s land, with his name misspelled, but located in the correct location on Section 3, according to deeds.

Brethren

We don’t have much direct information about Margaret during this time, other than we know the family was Brethren. Jacob and Fredericka had been Lutheran when they left Germany, according to church records, but sometime after that and before their deaths, they converted to the Brethren religion.

Their two oldest children were not Brethren, but the rest of their children were practicing Brethren for the duration of their lifetimes, except for the youngest, Mary, who died a Baptist in Oklahoma – although she assuredly was raised Brethren if her older siblings were.

Jacob and Fredericka’s eldest children, Jacob L. and daughter Fredericka, were born in 1806 and 1809, respectively. Son Jacob remained Lutheran for his lifetime, from the age of 17, according to his obituary. This suggests that perhaps his parents converted when Jacob F. was a teenager, so maybe in the early/mid 1820s. If that is the case, Margaret would have been raised from childhood in the Brethren Church, so she likely never knew anything different.

The Brethren, as a general rule, avoided records like the plague, including church records and what we know today as civil records. They didn’t like to file deeds, wills and especially did not like to obtain marriage licenses. However, because Jacob and Fredericka did not begin life as Brethren and the German Lutherans recorded everything, perhaps they were more tolerant of those “necessary evils.” At least some of their children did obtain marriage licenses and deeds were registered, albeit a decade later, although Jacob had no will.

The Happy Corners Brethren Church was located about two miles from where Margaret lived with her family, at the intersection of current Shiloh Springs and Olive Road on the western edge of Dayton. At that time, Happy Corners was known as the Lower Stillwater congregation, named for nearby Stillwater River.

Lentz Jacob church to home

The current church was built in 1870. At the time Margaret attended, the church was a log cabin and Margaret had moved to Indiana decades before the new church was built.

Marriage

Margaret is recorded in the 1840 census with her family, or at least there is a female recorded in an “age appropriate” location for Margaret. On the last day of 1840, her 18th birthday, she married Valentine Whitehead III, the son of another Brethren family.

I can’t help but wonder if there is some significance to the fact that she married ON her 18th birthday. Was her family for some reason opposed to the union and this was the first day she could marry without her father’s signature? Did he refuse to sign on “Brethren” principles or for some other, unknown, reason?

Was this birthday marriage a celebration or a not-so-covert act of rebellion?

Valentine Whitehead was born on February 1, 1821, so he was about 23 months older than Margaret.

The Whitehead land can be seen on the 1851 plat map about a mile and a half distant from Jacob’s land, in section 12, to the east. The families would have been near-neighbors and given that there was only one Brethren Church in the vicinity, they assuredly attended the same church. Margaret and Valentine had probably known each other since they were children.

Elkhart County, Indiana

The newly married couple wasted little time leaving Ohio and settling in Elkhart County, Indiana. That trip took between a week and two weeks by wagon according to other settlers who undertook that same journey. They were among the pioneers in Elkhart County, but they weren’t the first who had arrived nearly a dozen years earlier and spent their first winter in lean-tos before they could build rudimentary cabins. Many of the earliest families were Brethren too, so by the time Margaret and Valentine arrived, a community had been established for a decade, was welcoming and thirsty for news and letters from “back home.”

An excerpt from the book, “The Story of a Family, Argus and Myrtle Whitehead” by William Eberly and Eloise Whitehead Eberly published in 1986 reads:

Adam Whitehead (Margaret’s brother-in-law) Whitehead…decided to leave Montgomery County and go west. he came to northern Indiana to seek land for himself and others in his family and purchased about 2000 aces west and soth of New Paris, in Elkhart County. Between 1832 and 1836, nine of he Whitehead brothers and sisters and their families moved to the New Parish area. The migration included Adam, John, Esther W. and Jacob Stutsman, Samuel, Peter, Lewis, Valentine III (Margaret’s husband), Mary W and Solomon Conrad nd Margaret W. and Adam Lentz.

Most (if not all) of thes families were members of he German Baptist Brethren church, now known as the Church of the Brethren. A churchhouse was uilt in 1854 n this Whitehead community which was known for a long time as the “Whitehead Church.” Peter gave half of hte land for the church building (the east side) while Lewis gave the west. John gave land on the north of the road for the cemetery.  Jacob Miller, the son-in-law of Lewis Whitehead was he head carpenter. The church and cemetery are located about the middle of the second mile wes of State Road 15 and County Road 46, southwest of New Paris. At first it ws one of the meeting houses of he Turkey Creek congregation, but in 1906 it becaem a separate congregation, taking the name of Maple Grove.

The original Whitehead churchbuilding was abut 36 by 44 feet, with no basement. The church was built with two doors on the north end of he building, one on each side of the center, oen for men and one for women. The men sat on the left side of he meetign house after coming in the door on the left. The women sat on the right. There were exceptions, however. At funerals the family could sit togethre and when young men brought their girlfriends, they could sit goether on the women’s side. Sometime later the two doors were boarded up and a large double door was put in the center of the churchbuilding. Still, for a long time, the men still sat on one side and the women on the other. A small kitchen was added on the south end of the building in which the communion beef was cooked and to store the communion utensils.

JDM whitehead church

The church, her husband and her children defined Margaret’s first several years in Indiana.

Early Life in Indiana

The 1850 census suggests that Margaret and Valentine can both read and write.  The final column showing to the right of the form designates ” persons over 20 years of age who cannot read and write.”  That column is not checked.  What we don’t know is whether than means English or German, or both.  We also don’t know how well they might have understood the census taker if the census taker didn’t speak German.

Margaret Lentz 1850 census

The 1850 census confirms that Margaret’s first child, Lucinda, was born on December 13, 1842 in Ohio, but her second child, Samuel, was born a year later in Indiana, as were the rest of their children. From this, we know that sometime between December 1842 and June 1844, at the ripe old age of 21 or 22, Margaret, Valentine and their baby made their way to the frontier grasslands of Elkhart County. She too may have been pregnant on that wagon ride.

Margaret Lentz OH to IN map

I have to wonder if Margaret ever saw her parents again. It’s very unlikely even though they only lived what is today about a 4 hour drive. There were men who made the trip back and forth a couple of times on horseback, bringing news and shepherding more settlers, but women were tied at home with children and tending livestock.

Margaret’s parents didn’t pass away for another 20+ years, 1863 for Fredericka and 1870 for Jacob, so Margaret would have spent a lot of years of missing them, or perhaps sending letters back and forth. Receiving a letter telling you about the death of your parents would be a devastating letter to receive. I can only imagine the excitement of receiving a letter combined with the dread of the news it might hold. Talk about mixed emotions. Did her hands shake as she opened letters as her parents aged? Was she able to read the letters herself, or did she have to have someone read them to her?

When I was a young mother, I was constantly asking my mother something…for family recipes, advice about how to deal with childhood illness or tantrums of a 2 year old, exasperating husbands, and more. I talked to Mother by phone or in person at least once a day. While I was all too happy to leave home as a teen, I grew up quickly and can’t imagine leaving my mother at that age, knowing I would never see or speak with her again. I left the area where my parents lived in my mid-20s, and it nearly killed me, even with telephones and returning to visit every couple of weeks, for decades. There is nothing like the security of knowing Mom lives nearby.

I don’t know if Margaret was brave or foolhearty. Regardless, she would have formed other bonds with older women with advice to offer within the church in Elkhart County. Furthermore, nearly all of the Whitehead family settled in Elkhart County, including Valentine’s parents and most of his siblings, one of whom was also married to Margaret’s brother, Adam. Adam Lentz married Margaret Whitehead who then became Margaret Lentz, which caused a great deal of confusion between Margaret Lentz Whitehead and Margaret Whitehead Lentz.

Adam’s wife, Margaret Whitehead Lentz, died in Elkhart County on July 17, 1844 and is buried in the Whitehead Cemetery under the name of Margaret Lentz and was mistaken for our Margaret Lentz Whitehead for many years.

Margaret Lentz Whitehead marriages

We know that our Margaret spoke German, possibly exclusively, as she lived in a German farming community. The Brethren Church in Elkhart County was still holding German language services into the 1900s and the Brethren families still spoke German, although by then, they spoke English too.  My mother remembered her grandmother, Margaret’s daughter Evaline, speaking German, but her primary language by that time, in the 1920s and 1930s, was English.

The first Brethren church services in Elkhart County were held in private homes and barns, so it’s entirely possible that Margaret took her turn and had “church” at her house, with the entire neighborhood attending and then having a good old-fashioned German “pot-luck” afterwards.

The Whitehead School was established in 1836.

From the book “Elkhart County One Room Schools, The 3 Rs” by Dean Garber, I found the following:

Whitehead School, district #6, began on he west side of present day CR 19 north of CR 48 in Sect 17. Samuel Whitehead 1811-1874 settled in what became known as the Whitehead settlement, southwest of New Paris, Indiana. About 1836 a round log cabin with a clapboard roof was built on his property. This first schoolhouse was about 12X16 in size and was replaced by a wood frame building and was in use until the 1880s when it was replaced by a brick school building. For some reason this school is not shown on any of the county maps before 1874. But it has been found that David B. Miller born in 1838 did attend this school in 1854. This school closed in 1913 because of the consolidation of the township schools.

In the 1850s, Valentine Whitehead taught at this school.

This 1874 plat map of Jackson Township in Elkhart County, below, shows a school on the D. Whitehead property on the northeast corner of Section 8, and the “D. Ch” across from a cemetery on the border between sections 8 and 17. “D Ch” means Dunker Church and the cemetery across from the church is the Whitehead Cemetery.

Margaret Lentz 1874 Jackson Twp map

The Whitehead descendants erected a marker in the cemetery in 1939 commemorating the early Whitehead settlers.

Margaret Lentz Whitehead memorial

The verbiage on the commemoration stone says that 9 of Valentine Whitehead’s children settled in Elkhart County with him, including Valentine Jr. and his wife, Margaret Lentz. Three of Valentine Sr.’s children remained in Ohio. According to Whitehead genealogists, the Whitehead family began purchasing land in Elkhart County the 1830s and moved from Ohio in the early 1840s. It’s likely that they formed the “Whitehead Wagon Train” and all relocated together to the prairie frontier so that they could mutually assist each other with clearing land, building homes and establishing farms. Land was plentiful in northern Indiana, but was all taken in Montgomery County, Ohio.

Cousin Keith Lentz visited Elkhart County in 2015 and located the land owned by Valentine Whitehead and Margaret Lentz Whitehead near the intersection of County Roads 50 and 21. Margaret’s brother, Adam Lentz who married Margaret Whitehead, owned land just a couple miles up the road.

Margaret Lentz Keith map

Thanks to Keith for providing this map.

Valentine Dies

The first decade of Margaret’s married life blessed her with 4 children and a migration to the Indiana frontier. Valentine and Margaret became established in their new community and like all farm families, lived by the routine of the seasons and the Sundays. Sunday was church and sometimes a bit of leisure or rest. Baths in washtubs were taken on Saturday night, hair was washed, and on Sunday morning, women wore their best dresses and prayer bonnets and rode in the wagon to church, after feeding the livestock of course. Little changed in the next hundred years, except you rode to church in a car or buggy.

The rest of the week was work from sunup to sundown, and sometimes longer by candlelight.

However, life was not to remain rosey for Margaret.

Margaret, the bride at 18 was a widow at 29 with 4 children and one on the way. Margaret was 2 months pregnant for Mary when Valentine died. Mary was born in February 1852 after Valentine’s death on July 24, 1851.

Margaret buried Valentine in the Whitehead Cemetery, just down the road from where they lived and across the road from the church she attended every Sunday.  I wonder if she sat in church and stared out at the cemetery, where he lay.  Did she wander over to visit his grave every Sunday after the church was built in 1854?

I surely wonder what took Valentine at age 30 in the middle of summer. I wonder about things like appendicitis, farm accidents, falling from a horse or perhaps something like typhoid.  The only clue we have is that Valentine did write a will on June 3rd, 1851, recorded in Will Book 1, page 59 and 60 wherein he does not name his wife but does name children Lucinda, Jacob, Samuel and Emanual.  This executor was Adam Lantz (Lentz) and Samuel Whitehead and Robert Fenton were the witnesses.  If Valentine was ill, then he was ill from June 3rd until August 10th when he died.

In the book, “The Midwest Pioneer, His Ills, Cures and Doctors” by Madge Pickard and R. Carlyle Buley published in 1946, we discover that Elkhart County was plagued by “bilious disorders” and typhoid.

For fifty years after their first settlement the river towns along the Ohio and the Wabash suffered from malarial diseases.

In the middle 1830’s the people of Elkhart County had an epidemic of typhoid and pneumonia and in 1838 almost half the population was affected with bilious disorders. The wave of erysipelas which enveloped the whole Northwest in the early 1840’s struck Indiana with unusual severity. Dysentery, scarlatina, phthisis (consumption), pneumonia, bronchitis, occasionally yellow and spotted fevers, whooping cough, and diphtheria appeared in many parts of the state. The summer of 1838 was a bad one, and “the afflicting dispensations of Providence” laid many low along the Ohio, the Wabash, the Illinois and lakes Michigan and Erie.

The Milwaukee Sentinel of October 9, 1838, boasted that, notwithstanding the fact that the season had been bad in most sections, Wisconsin had no prevailing diseases. The Sentinel and the Green Bay Wisconsin Democrat reported that canal work had been suspended in Illinois and Indiana, that the people were much too sick to harvest crops, and that there was nothing that looked like life, even in the populous towns. The Daily Chicago American, May 2, 1839, declared that “the whole West was unusually sickly” the preceding fall, that Michigan, Ohio, and Indiana suffered most, but that Illinois was affected only among the Irish laborers along the canal lines.

There were those who felt that the habits of the settlers were as much to blame for prevailing illness as the environment. James Hall of Vandalia, in years to come to be the West’s most famous historian and advocate, took this view. In his address at the first meeting of the Illinois Antiquarian and Historical Society in 1827 he stated that the pioneer’s exposure to the weather, his food — too much meat and not enough fresh vegetables, excessive use of ardent spirits, and lack of attention to simple diseases, were more responsible than the climate.

Again in 1845 came a “disastrous and melancholy sickly season” in the West; the South Bend St. Joseph Valley Register noted that it was the seventh year from the last bad outbreak, as if that explained it.

Granted, this doesn’t say anything about 1851, but it is suggestive of a recurring health issue in this area – and the family did live along Turkey Creek which fed the Elkhart River, emptying in a swampy area a few miles distant.

Margaret Lentz Valentine stone

Margaret’s children with Valentine were:

  • Lucinda born Dec. 13, 1842
  • Samuel born January 7, 1844
  • Jacob Franklin born October 10, 1846
  • Emmanuel born January 15, 1849
  • Mary J. born February 11, 1852

The book Pictorial and Biographical Memoirs of Elkhart and St. Joseph Counties of Indiana published by Goodspeed in 1893 says:

Valentine Whitehead removed to Indiana at an early day, having married Margaret Lentz in Ohio and settled on a woodland farm of 160 acres in Jackson Twp., Elkhart Co, which he did much to improve prior to his death which occurred July 24, 1851. He was a member of the German Baptist church, a democrat in early life and afterward became a Republican in political principles, although he but seldom exercised the privilege of suffrage. Five children were the result of this union, Lucinda wife of Joseph B. Haney was born Dec 13, 1842, Samuel, a carpenter of Goshen was born in 1845, Jacob is a farmer of Bates Co, Missouri, Emanuel of Kosciusko Co., Indiana is married to Elizabeth Ulery by whom he has 4 children, Argus, Jesse, Clayton and Calvin. Mary J., born February 11 1852, is the wife of John D. Ulery. After the death of her husband, Mrs. Whitehead married John D. Miller of New Paris who was born near Dayton Ohio in 1812, a son of David Miller. To her union with Mr. Miller 3 children were born, Evaline, Ira and Perry. Mr. and Mrs. Miller are residents of Jackson Twp., Elkhart Co.

We don’t know how Margaret survived after Valentine’s death. Her children were too young to help on the farm, at least not significantly, the oldest being 9.

However, Margaret’s father-in-law and eight of Valentine’s siblings lived in close proximity, as did some of Margaret’s siblings.

  • Adam Lentz and his wife, Margaret Whitehead were in Elkhart County by 1844 when Margaret Whitehead Lentz died. Adam remarried to Elizabeth Neff in 1845 and remained in Elkhart County until sometime between 1867 and 1870 when he moved on to Macoupin County, Illinois.
  • Benjamin Lentz moved to Elkhart County between 1854 and 1859 and remained until his death in 1903.
  • Margaret’s sister Mary who was married to Henry Overlease (Overleese) moved to Elkhart County between 1852 and 1854. She and Henry moved on to Illinois between 1866 and 1870.
  • If Louis or Lewis Lentz was Margaret’s brother, he was living a couple counties away, in Peru in Miami County – too far away to help Margaret. He moved from Ohio between 1857 and 1859.

Marriage to John David Miller

Five years later, on March 30, 1856, Margaret Lentz Whitehead married the Brethren widower, John David Miller. His wife had died a year earlier, in March of 1855, leaving him with 7 children, ages 4 to 22.

The Lentz and Miller families were both from Montgomery County before arriving in Elkhart County, so not only did they know each other, their families knew each other the generation before as well. Margaret and John David probably knew each other as children and attended the same church, although he was a decade older than Margaret.

Margaret Lentz John David Miller marriage

At the time of their marriage, their living children were stairstepped.

Margaret Lentz blended family

Hester Miller had already married, but the rest of the children were at home when Margaret married John David Miller. They had 11 children living with them between the ages of 4 and 18.

The 1860 census in Elkhart County shows the two families merged.  This census indicates that John David Miller can read and write, but Margaret cannot.

Margaret Lentz 1860 census

It’s no wonder census documents confuse genealogists. This was a blended family and although Margaret’s children from her first marriage are listed last, they are not listed with their Whitehead surname.

Three of Margaret’s children are listed, but two are missing. Jacob Whitehead was born in 1846, so would certainly still be living at home in 1860 as would Samuel who was born in 1844. Where are these children? They aren’t found living with relatives or elsewhere in the county either, and we know they survived to adulthood.

Furthermore, John D. Miller’s age looks for all the world to be 21, but he was 47. Maybe they wrote the 4 and forgot the 7. Lastly, some of the children’s ages are illegible as well, and Martha Miller, who would have been age 13, is missing entirely and we know she lived to marry and have children.

Margaret Lentz and John David Miller have had two children of their own by 1860, Louisa Evaline born March 29, 1857, my mother’s grandmother, and Ira, born July 26, 1859.

Margaret Lentz 1870 census

In the 1870 census, the last child born to Margaret and John David Miller, Perry, is also shown. I wonder where they came up with that name? It’s certainly not a family name. Perhaps Brethren naming traditions were changing a bit.

According to Rex Miller, Ira Miller’s grandson, Perry Miller born in 1862 died at the age of 18 from appendicitis, so about 1880.

The 1870 census does not show that Margaret is unable to read and write.

The 1880 census shows Margaret and John Miller with their three youngest children and a Whitehead grandson.

Margaret Lentz 1880 census

The 1880 census indicates that Margaret cannot read and write.

The 1900 census is our last census glimpse of the family before John and Margaret’s deaths. By now, both John and Margaret are elderly, with no children or grandchildren living with them. At their age, I don’t know if that is a blessing or a curse.

Margaret Lentz 1900 census

The 1900 census may hold the key to why 2 of the past 4 census schedules said Margaret could read AND write and 2 said she could not.  In 1900, the categories of read and write are separated and the census says Margaret can read but cannot write, and that she can speak English.  It also tells us that they have been married for 45 years, and that Margaret has had 9 children, with 8 living.

This also gives Margaret’s birth year and month as December 1821 which is a little perplexing because her death certificate gives her year of birth as 1822.

Interestingly enough, they had a boarder who was a medicine peddler. You know there’s a story there!

When Margaret married John David Miller, she moved to his farm. I don’t know what happened to the Valentine Miller land, but it stands to reason that his children would have inherited that land (or the proceeds therefrom) as soon as they were of age.

It’s not like Margaret had far to move.

On the 1874 plat map below, you can see the J. Miller (John David) property abutting the D.B. Miller property, in green. D. B. Miller is John David’s brother, David, based on the 1860 and 1870 census.

Margaret Lentz 1874 Jackson Twp map

You can see on the plat map above that John David Miller’s land was about a mile from the school and a little more than a mile from the church. A section of land is one mile square. The land owned by Margaret and Valentine was about another mile and a half or so further south, not shown on this part of the map.

The Whitehead School was located on the western edge of section 5 and 8. Both the Whitehead and Miller children would have attended this school as it was the only school in the area.  We know from the census that the children attended school.

The Brethren Church on the Whitehead land was the first Brethren Church, other than meeting within members’ homes, in Elkhart County. Margaret Lentz Whitehead and John David Miller would have known each other for decades, and been well acquainted since moving to Elkhart County. John David, I’m sure, was at Valentine Whitehead’s funeral, and Margaret would have attended Mary Miller’s.

I wonder if Margaret and John David’s marriage was one of love or convenience, or maybe a bit of both. It surely stands to reason that with a combined family when they married of 12 children, many of them small, they both needed a spouse badly in a culture and economy where couples shared work and responsibilities. Farming was almost impossible without a helpmate. Someone had to work the land and do the chores, daily, and someone had to cook and clean and watch the children. One person couldn’t do both.

To help put things in perspective, I’ve created the map below which shows the approximate locations of important landmarks.

Margaret Lentz Jackson Twp map

The top arrow is the Baintertown Cemetery, also known as the Rodibaugh Cemetery where most of the early Millers are buried including John David Miller, Margaret Lentz Whitehead Miller and John David’s first wife, Mary Baker. It stands to reason that the child born to Margaret and John David Miller that died is buried here as well, although the grave is not marked.

The bottom arrow is the land where Valentine Miller lived with Margaret Lentz Miller.

The arrow above that is the Whitehead Cemetery, also known as Maple Grove along with Maple Grove Church of the Brethren.  The arrow directly above that at the intersection of 142 and 21 is the location of John David Miller’s land where Margaret Lentz Whitehead Miller lived for more than half of her life.

The house built by John David Miller which incorporates the cabin first built when he first arrived in the 1830s still stands today. This is where Margaret Miller would live for almost half a century, the most stable period of her life, although it got quite “exciting” towards the end.

Margaret Lentz home

This property today is located at 67520 County Road 21, New Paris, Indiana. It sits sideways because the road has been substantially changed since the house was built.

John David Miller Photo

This is the only semi-decent picture we have of either Margaret or John David.

The above people are John David Miller and Margaret Lentz Whitehead Miller seated in the front row. Rear, left to right, Matilda Miller Dubbs, David Miller, Eva Miller Ferverda, Washington Miller and Sarah Jane Miller Blough. Matilda and Washington are children from John David’s first marriage and the other three are Margaret’s children with John David.

Margaret raised the Miller children and was their step-mother for substantially longer than their own mother, Mary Baker, was able to remain on this earth. I think after that long, and after raising step-children as your own, you tend to forget that they are step-children aren’t yours biologically – that is – until something brings it to light…which would happen soon for Margaret.

Margaret Lentz outside home2

These are two traditionally garbed Brethen elders, noting her full length skirt, apron and prayer bonnet and his beard, hat and dark clothing.

Rex Miller allowed me to scan this photo of John David Miller and Margaret by their home. The woman looks to be the same person as above and the part of the house looks to be the center section today, which Rex indicated was the log cabin portion.

Margaret was destined to outlive yet another husband.

John David Miller died on Feb. 10, 1902 of senile gangrene. He wrote his will in 1897, but in 1901, before his death, his son David B. Miller filed an injunction in court asking for a guardian to be provided for his father who, in his words, “had a substantial estate and could no longer manage his affairs.” I can only imagine what a ruckus this must have caused within the family. One knows that there had to be some event or situation arise to cause this level of concern. However, before the case was heard, John David died.

John David had a very controversial will that left everything to Margaret until her death, and then one third of John’s estate was to be divided between Margaret’s nephew and Margaret and John David’s three children, with the balance of two thirds of his estate to be divided among his children by his first wife.

Things don’t always work out as intended. By law, Margaret had the right to one third of his estate as her dower, in fee simple, meaning in full ownership. She elected to take her one third as indicated by the following widow’s election. The balance of John’s estate would them be divided according to the will.

Widow’s election recorded on page 111.

The undersigned widow of John D. Miller decd late of Elkhart County Indiana who died testate and whose last will and testament has been duly admitted to probate and record in the Elkhart Circuit Court hereby make election as such widow to hold and retain her right of dower in the personal estate of said decedent and to hold and retain her right to one third of the lands of which her husband died testate notwithstanding the terms of the said will, and she refuses to accept any devise or provision whatever made by said will in her favor, for, or in lieu of her said statutory right as widow in and to the personal property and real estate of said decedent.

Margaret (x her mark) E. Miller

Margaret was no push-over.

Recorded in Deed Book 108-422, Margaret then sells her dower to Eva Ferverdy, Ira and Miley Miller, Perry A. Miller and Edward E. Whitehead for $2241.66 which is 1/3rd of W ½ of NW ¼ and the N ½ of SE ¼ Section 5 Twp 35 Range 6e on Sept. 25, 1902.  She probably desperately needed that money to live, in the days before social security and retirement benefits of any type.

Later, recorded in book 112-440, the same group who bought the land above sells the land to George and Alice G. Method for $5000.

Margaret died on July 4th, 1903, just 17 months after John David. I’m sure the stress level on the poor woman with the infighting between her children and his children must have been nearly intolerable. Several of the children lived within the community and it’s not like Margaret could ever get away from the situation. It would have followed her to church, which was likely the only place she ever went. I’m sure it was the talk of the community, and it didn’t end until after her death.

Cousin Rex indicated that Perry died at age 18, but he was still alive when his parents died. In fact, Perry died at age 44 on December 22, 1906 in Goshen.

John David’s estate was controversial, to say the least, and eventually the bank became the estate’s administrator. One of the children, Perry, and Margaret’s nephew, Edward Whitehead, had done a great deal in the years before John’s death to help the elderly couple and had never been reimbursed for their efforts or expenses. They submitted receipts to the estate and those charges were disputed by the older set of children by Mary Baker. There was obviously a great deal of resentment between the two sets of children. Finally, in the end, Washington Miller refused to contribute $10 of his portion of the estate (near $1000 in the settlement) for his father’s tombstone. Edward Whitehead, the nephew, paid Washington Miller’s share. That is surely the last, final insult one could inflict on a parent. Edward Whitehead obviously cared a great deal for his uncle by marriage, John David Miller.

The inventory for John David’s estate is as follows, and the widow took everything except the wheat, rye and corn against her 1/3 dower. Otherwise, she would have been left with, literally, an empty house to live in until she died. At that time, all of the estate was considered to be the property of the man, so the contents of their entire house were listed and valued.

Number Items Appraised Value
1 Jewell oak heating stove 4.00
1 Eight day clock .25
1 Sewing machine .05
4 Rocking chairs 1.50
1 Bedstead and spring 1.25
1 Old rag carpet 25 yards .50
1 Bureau 1.00
1 Stand .10
1 Bedstead .05
1 Bedspring and bedding 2.00
1 Rag carpet 15 yards .50
1 Ingrain carpet 15 yards .50
12 Winsor chairs 1.50
1 Dining table .25
1 Cupboard .50
1 Dough tray .25
1 Kitchen sinc .10
1 Hanging lamp .25
1 Pantry safe .50
1 Churn .05
1 Milch trough 1.25
15 Milch crocks .45
1 Lounge .05
1 110 lb lard 11.00
1 Cooking stove and furniture .50
1 Cross cut saw and brush cythe .05
1 Bucksaw .10
1 Log chain .05
1 Horse 3.00
1 Cow 30.00
1 Ladder and maul 1.25
1 Wheelbarrow and ax .75
1 Spring seat .25
30 Chickens 7.50
30 Acres growing wheat land lord ½ 150.00
32 Acres rye landlords 2/5 40.00
66 Bushels corn 38.34
1 Small looking glass .05
A few Old dishes, spoons, knives and forks 1.00
20 Bushels corn in crib 9.00
Total 309.69

This is as close as we’ll ever get to a peek into Margaret’s house. We know from this inventory that she sewed, on a machine, which was valued at 5 cents, the same as a bedstead and half of a kitchen sink. It was worth one fifth of a chicken which was worth a quarter.

Rag carpets were homemade. My mother still made them throughout her lifetime. Ingrain carpets, on the other hand, were commercially made, causing me to wonder about that in a Brethren household too.

By Birmingham Museums Trust – Birmingham Museums Trust, CC BY-SA 3.0, https://commons.wikimedia.org/w/index.php?curid=39737099

I learned to sew on an old treadle sewing machine exactly like the one above, which was likely identical to Margaret’s machine. Electricity wasn’t available in farm country in the early 1900s, so a treadle machine which replaced hand sewing was a true luxury. I wonder how well this “convenience” was tolerated by the conservative Brethren who were very resistant to change.

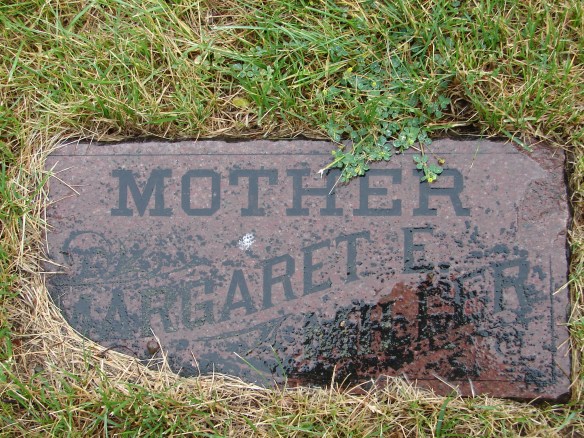
Margaret Lentz Whitehead Miller died on July 4, 1903 and is buried beside John David Miller in Baintertown Cemetery. It’s sad that her last year and several months were spent tied up in a family conflict that I’m sure mentally consumed her waking hours. She made several trips to the courthouse in that time period and she clearly took care of her three Miller children’s interests relative to their father’s estate.

Margaret Lentz signature

On one document located in John David’s estate packet, we find the signatures of Margaret plus her three Miller children. Margaret could not write, so she made her mark, a rather unsteady X.

Perry, Ira and Evaline bought their mother’s dower share of the estate and subsequently sold the land. Margaret did not have a will or an estate, so we don’t know what happened to that money, but I’m suspecting that she distributed it among her children before her death. Her children from her first marriage had already shared in their father’s estate and were already well established.

Margaret Lentz stone

As it turns out, John David’s tombstone was Margaret’s as well, with a small marker on either side for each of his wives.

Margaret Lentz Miller 07

It has always been stated that Margaret’s middle name was Elizabeth, but given that her daughter’s name was Evaline, now I’m wondering…

Margaret’s Children

Recently, Indiana death certificates have become available through Ancestry.  Previously, obtaining a death certificate for someone involved begging, then submitting 2 forms of ID, explaining why you wanted the death certificate, signing a form, swearing you were a direct descendant of that person, and more begging, waiting, and about $30 or so – with nu guarantee of results.  Oh and all while patting the top of your head and rubbing your belly while standing on your head…in a corner…taking a selfie.

Now all you have to do is sign on and search, although the indexing leaves much to be desired.  Death certificates provide us with a unique view of Margaret’s children, at least those who had the good judgement to die in Indiana.  Death certificates begin about 1899 and detecting trends might alert us to a health condition that could be hereditary.  Additionally, most death certificates provide a burial location.

1. Lucinda A. Whitehead, Margaret’s oldest daughter, was born on December 13, 1842 in Montgomery County, Ohio. She died on January 30, 1935 in Milford, Kosciusko County, Indiana, just over the border from Elkhart County at the age of 92 of a cerebral hemorrhage. She married Joseph B. Haney on October 7, 1860 in Elkhart County at the age of 17. He died in 1920.

Margaret Lentz Lucinda Whitehead

According to her death certificate, she was buried in the Baintertown Cemetery, also known as the Rodibaugh Cemetery, where Margaret is buried as well.

Margaret Lentz Lucinda Whitehead death

Lucinda had 4 known children:

  • Emma Rose Haney born in 1861.
  • Allen Ottis Haney born Sept. 24, 1862 in Milford, Kosciusko County, Indiana and died May 8, 1953 in Florida.
  • Harry Haney born in 1864.
  • Cecil Marie Haney born Sept. 4, 1884 in VanBuren, Kosciusko County, Indiana,  died February 9, 1977 in Rochester, Fulton County, Indiana and is buried in the Baintertown Cemetery. Cecil married Bert Eugene Dausman and had daughters:

Dorothy Loretta Dausman (1902-1987) who married Edward Poppenger or Pippinger and had one daughter

Helen Nadine Dausman (1905-1994) who married Joseph Osborn Perkins and had one daughter

Trella B. Dausman (1909-1983) who married Laddie Straka

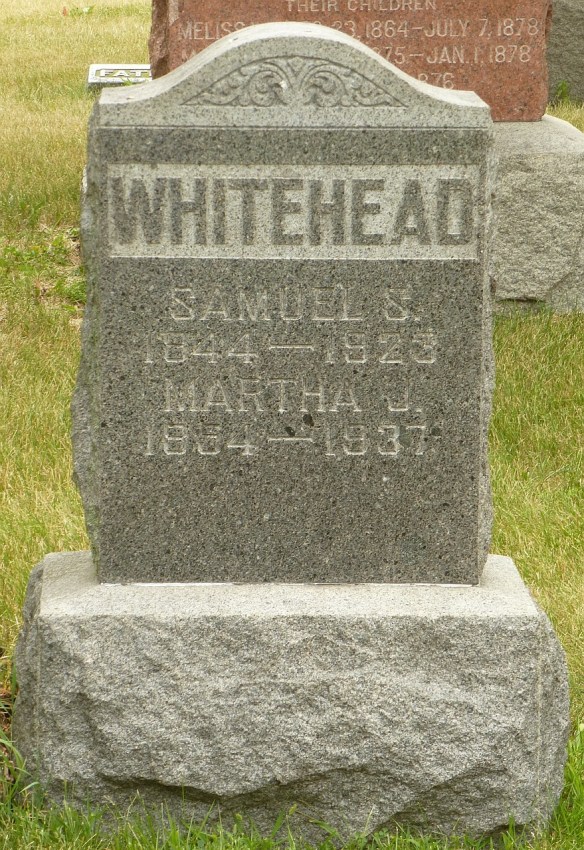
2. Samuel Whitehead, Margaret’s oldest son, was born June 7, 1844 in Elkhart County, Indiana and died on April 26, 1923 in Goshen, Elkhart County of chronic bronchitis.

Margaret Lentz Samuel Whitehead death

Sam was a carriagemaker with a shop in New Paris, Indiana. Eventually, he took a partner and operated under the name of Whitehead and Landgraver. He also owned a sawmill on the south end of New Paris.

Samuel is buried in the Baintertown Cemetery. He married Henrietta Dietz on November 18, 1865 in Elkhart, Indiana.

Margaret Lentz Samuel Whitehead stone

Samuel and Henrietta had:

  • Lizzie Whitehead (1867-1937)
  • Charlie Whitehead (1869-1939)

Samuel later remarried to Martha J. Vail on March 26, 1874 and they had the following children:

  • Earl R. Whitehead (1875-1945)
  • Mabel J. Whitehead (1883-1953)
  • Ina Whitehead (1886-1971)
  • Hazel Whitehead (1888-1958)
  • Ross Whitehead (1889-1958)
  • Boyd A. Whitehead (1894-1968)
  • Carlisle Whitehead (1897-1967)

3. Jacob Franklin Whitehead, Margaret’s second son, was born October 10, 1846 in Elkhart County and died on April 1, 1932, in Adrian, Bates County, Missouri where his uncle, Adam Lentz had settled. He is buried in the Crescent Hill, Cemetery He married Eva Bowser (1847-1933) on May 21, 1865 in Elkhart County.

Margaret Lentz Jacob Whitehead stone

They had:

  • John Bertus Whitehead (1879-1961)
  • Charles Whitehead born 1872
  • Maggie Whitehead born 1875
  • Claudie Whitehead born 1883

4. Emmanual Whitehead, Margaret’s third son, was born January 15, 1849 in Elkhart County, died on April 10, 1924 in Kosciusko County, Indiana and is buried in the Salem Cemetery.

Margaret Lentz Emanuel Whitehead stone

Emmanuel married Elizabeth Ullery, a school teacher on November 26, 1871 in Elkhart County, Indiana, and according to the Whitehead  book:

Elizabeth’s brother, Levi, recorded in his diary, “Lizzie Ulery’ wedding day. She was married to Emanuel Whiehead by John H. Miller at 2 p.m., and a large crowd attended the wedding.

Of course, Margaret would have been at that wedding. It might even have been held at her house.

Emanuel worked for his brother, Sam, in the sawmill, couldn’t read or write, but could do mathematical calculations in his head. It was reported that he could look at a tree and calculate the number of board feet of lumber that could be cut from the trunk.

When not working or farming, he loved to fish as did many of his Ulery kinsmen.

They had two baby daughters that dies shortly after birth, and then:

  • Argus Burtis Whitehead (1875-1962)
  • Jessie Whitehead born (1877-1947)
  • Clayton S. Whitehead born (1879-1949)
  • Calvin E. Whitehead (1881-1971)

Margaret Lentz Emanual Whitehead history

Emmanual Whitehead remarried on February 9, 1900 to Sarah Foster (1856-1940).

5. Mary Jane Whitehead, Margaret’s second daughter and last child by Valentine Whitehead, was born February 11, 1852. She died on Sept. 30, 1930 in Nappanee, Elkhart County, Indiana of angina pectoritis and was buried at the Union Center Brethren Church cemetery.

Margaret Lentz Mary Jane Whitehead death

Mary Jane married John D. Ullery (1846-1928) on March 10, 1872 in Elkhart, Indiana.

They had:

  • Edward W. Ulery (1872-1942)
  • Margaret Elizabeth Ulery (1874-1959) and married Albert Mutschler on June 10, 1897 in Elkhart County, Indiana. They had one daughter:

Mary L. born July 1898

  • David Leatherman, an adopted son, who died in 1903

It’s somehow ironic that my line of the family never heard the “shipwreck story” of Jacob and Fredericka Lentz, but buried in the John Ulery biography we find that same story, handed down for posterity – but somehow never making it to the current generation.

From the book, Pictorial and Biographical Memoirs of Elkhart and St. Joseph Counties, Indiana; Chicago, Goodspeed Brothers; 1893:

JOHN D. ULERY. During the forty-six years that have passed over the head of the gentleman whose name stands at the head of this sketch, he has witnessed a wonderful transformation in Elkhart county, and during all these years he has been an active observer of the trend of events. He has not been merely a “looker on in Venice,” but a citizen who has, through his enterprise, his integrity and his public ¬spirit, contributed his full share to the magnificent development of the section in which he resides. He comes of an honored ancestry, for the well-known old pioneer, Daniel Ulery, was his father, from whom he inherited many of his most worthy characteristics. He was the third of his children and first saw the light of day on the old home farm in Union township, February 3, 1846, and like the majority of farmer’s boys of that region, obtained his initiatory education in what was known far and near as the Ulery School. This he alternated with tilling the soil until he had almost attained man’s estate, when he quit school to devote his attention to agricultural pursuits, which calling occupied his time and attention until he was about twenty-seven years of age. He then, on March 10, 1872, united his fortunes with those of Mary J. Whitehead, who was the youngest child born to Valentine and Margaret (Lentz) Whitehead; the former was a son of Valentine and Elizabeth (Rodebaugh) Whitehead, who were of German descent and were early pioneers of Pennsylvania and Ohio. Valentine lost his wife, Elizabeth, in Ohio, after which he removed to the Hoosier State and died in Elkhart county in 1867, at which time he was a retired farmer and nearly ninety years of age. He was the father of eleven children, all of whom are dead, with the exception of three: Louis, Peter and David. Valentine, one of the children of the above mentioned family, was the father of Mrs. John Ulery. He removed to Indiana at an early day, having mar¬ried Margaret Lentz, in Ohio, and settled on a woodland farm of 160 acres in Jackson township, Elkhart county, which he did much to improve prior to his death, which occurred on July 24, 1851. He was a member of the German Baptist Church, a Democrat in early life and afterward became a Republican in political principle, although he but seldom exercised the privilege of suffrage. Five children were the result of his union: Lucinda, wife of Joseph B. Haney, was born December 13, 1842; Samuel, a carpenter of Goshen, was born in 1845; Jacob is a farmer of Bates county, Mo.; Emanuel, of Kosciusko county, Ind., is married to Elizabeth Ulery, by whom he has four children–Argus, Jesse, Clayton and Calvin; Mary J. is the wife of John D. Ulery. After the death of her husband, Mrs. Whitehead married John D. Miller, of New Paris, who was born near Dayton, Ohio, in 1812, a son of David Miller (a more complete sketch of this gentleman is found in the sketch of David B. Miller). He has resided for years in the vicinity of New Paris, where he is highly honored and esteemed. Mrs. Miller is now seventy-one years of age, but is still healthy and active. To her union with Mr. Miller three children were given: Evaline, Ira and Perry. Mr, and Mrs. Miller are residents of Jackson township, Elkhart county. Mrs. John D. Ulery was born in this county, February 11, 1852, and has presented her husband with two children : Edward W., born December 13, 1872, who has the principal charge of the home farm and is a steady, kindly and intelligent young man, and Lizzie, who was born November 28, 1874, and is an accomplished young lady. Mr. Ulery is classed among the foremost citizens of Union township, and is at the head of his business, owing to the energy and en¬terprise he has displayed. He owns an exceptionally fertile farm of 135 acres, on which are probably the best buildings of any farm in the township. He is a man of wealth and owns an interest in the Nappanee Furniture Company, as well as in other paying interests. He has followed in his father’s footsteps in regard to meeting with accidents, as well as in other respects, for on July 4, 1881, he was badly injured by a reaping machine and for about a year thereafter was an invalid. He is deservedly classed among the public-spirited and intelligent men of the county and is warm personal friends can be numbered by the score. Mrs. Ulery is a member of the German Baptist Church. Her maternal grandfather came to this country at an early day, having started from his native land a rich man. The voyage by water occupied nine months, and upon landing he found himself without means, owing to the tyranny and dishonesty of the captain of the vessel. On this voyage some three hundred souls died. Mr. and Mrs. Ulery took to rear as their own child, David A. Leatherman, who, at that time was six years of age, and the orphan son of John and Elizabeth Leatherman, gave him every advantage and provided means for him to graduate from the University at Valparaiso, Ind. He is a young man of much promise and at the present time is a traveling man. He remained with his foster parents until he was twenty years old and still holds them in grateful and honored remembrance, for they proved to him a friend in his need and were always as kind and thoughtful of his wants as though he were one of their own family. This is but one instance of the many kind and disinterested actions done by Mr. Ulery in his walk through life, and clearly indicated the true character of the man.

Margaret Lentz had 4 children with John David Miller, three of whom lived. We don’t know the name of the 4th child or when they were born, although I suspect 1861. John David’s obituary says that 4 children were born to Margaret and John David, 3 of whom survive, which is also confirmed by the 1900 census.

6. Evaline Louis Miller, Margaret’s first child with John David Miller was born March 29, 1857 in Elkhart County, Indiana and died on December 20, 1939 in Leesburg, Kosciusko County, Indiana of an inflammation of the heart (acute myocarditis) following a 3 month kidney infection (nephritis).

Margaret Lentz Evaline Miller Ferverda death

She is buried in the Salem Brethren Church cemetery.

Hiram and Eva Ferverda stone

Evaline married to Hiram B. Ferverda on March 10, 1876 in Goshen, Indiana.

Ferverda family

The photo above is Eva Miller Ferverda with her husband Hiram and their entire family, including my grandfather John Ferverda, 2nd from right in the rear. Hiram died in 1925, and their youngest child was born in 1902, so I’d estimate that this photo was taken close to 1920, or perhaps slightly earlier, based on the WWI stars in the window and a son in uniform.

Evaline Louise Miller Ferverda had 11 children:

  • Ira Otta Ferverda (1877-1950) who married Ada Pearl Frederickson.
  • Edith Estella Ferverda (1879-1955) who married Tom Dye. They had the following daughter:

Ruth Dye

  • Irvin Guy Ferverda (1881-1933) who married Jessie Hartman.
  • John Whitney Ferverda (1882-1962) who married Edith Barbara Lore.
  • Elizabeth Gertrude Ferverda (1884-1966) who married Louis Hartman and had the following daughters.

Louisa Hartman married Ora Tenney

Helen Tenney married Norman Nine

Lisa Nine

Roberta Hartman married Rulo Frush

Carol Frush married William Slaymaker

Nadine Slaymaker

                              Nancy Slaymaker

  • Chloe Evaline Ferverda (1886-1984) and married Rolland Robinson and had one daughter:

Charlotte Robinson married Bruce Howard

Susan Howard married Richard Higg

Mary Carol Howard married David Bryan

Kerrie Bryan

Julie Bryan

Sally Howard

  • Ray Edward Ferverda (1891-1975) who married Grace Driver.
  • Roscoe H. Ferverda (1893-1978) who married Effie Ringo and Ruby Mae Teeter.
  • George Miller Ferverda (1885-1970) who married Lois Glant.
  • Donald D. Ferverda (1899-1937) who married Agnes Ruple.
  • Margaret Ferverda (1902-1984) who married Chester Glant and had the following daughters:

Mary Glant married Varrill Wigner.

Kari Anne Wigner

Joyce Ann Glant married Delferd Zimmerman

Nancy Zimmerman

                      Beth Zimmerman

7. Ira J. Miller, Margaret’s 2nd child with John David Miller was born July 26, 1859 in Elkhart County and died on December 17, 1948 in Elkhart County of coronary breast disease.

Ira Miller death cert

Ira is buried in the Baintertown Cemetery.

Margaret Lentz Ira Miller stone

Ira married Rebecca Rodibaugh on November 23, 1882 in Elkhart and they had the following child:

  • Everett Miller born 1897

Margaret Lentz Ira Miller

The above photo is Ira J. Miller with his wife, Rebecca. The photo below includes Ira Miller and his sister, Evaline Louise Miller Ferverda.

Margaret Lentz Ira and Evaline Miller

Last row, rear left to right, Rebecca Rodibaugh Miller, Ira Miller, one of Eva Miller Ferverda’s children,

Middle row, Eva Miller’s child, Eva Miller Ferverda

Front row, Mame Smoker Miller and Everett Miller (son of Ira.)

8. Perry Miller, Margaret’s final surviving child was born on June 25, 1862 in Elkhart County and died on December 22, 1906 in Goshen, Indiana of a bowel obstruction.

Perry Miller death cert

Perry buried in the Violett Cemetery in Goshen.

Margaret Lentz Perry Miller stone

Perry married Mary Jane Lauer on October 2, 1881 in Elkhart, Indiana and they had the following children:

  • Maud Miller born 1882-1902, buried with her parents
  • Purl Miller born 1885-1960, a painter, buried in the Violett Cemetery
  • Otto M. (Ottie) Miller born 1889-1976, a railroad engineer

DNA – Mitochondrial and Autosomal

You’d think with all of the people who descend from Margaret, someone who descends through all females would have taken a mitochondrial DNA test, but apparently not. If anyone has, please let me know.

If you haven’t and you descend from Margaret through all females to the current generation, where males can test too, I have a DNA testing scholarship for you!

The individuals bolded in the section above descend through Margaret Lentz Whitehead Miller through all females.  These individuals or their descendants through all females from Margaret carry Margaret’s mitochondrial DNA and are eligible to test.

Testing for Margaret’s mitochondrial DNA will tell us about her deep ancestry and help us learn the path our ancestors took to and through Europe.

Margaret still has more secrets to reveal about herself.

Identifying Lentz DNA vs Miller DNA

One of the challenges we have in genetic genealogy is that when we autosomally test descendants of couples, like Margaret Lentz and John David Miller, we can’t tell which DNA comes from which parent.

However, because Margaret had children with a different husband, Valentine Whitehead, if some of the descendants of Margaret’s children with Valentine were to take an autosomal DNA test and they match the DNA of the descendants of Margaret through John David Miller – then we’ll know that the matching DNA comes from the Margaret’s Lentz line and not the Miller line.

Anyone descended from Jacob Lentz and Fredericka Reuhle Lentz through children other than Margaret who have DNA tested and match the descendants of Margaret and John David Miller – that DNA is also Lentz DNA as distinguished from Miller DNA.

Let’s do a little experiment to see if we can isolate snippets of Margaret Lentz’s DNA.

I have 4 people who have tested that are descendants of Margaret Lentz Miller, all through her children with John David Miller. I have two Lentz males who have tested that descend from different sons of Jacob Lentz and Fredericka Reuhle. People in the bottom row are all testers.

Margaret Lentz chart

Benjamin, Margaret and George Lentz are siblings. The relationship of the people in the pink box to the descendants of Benjamin and George in the next generation are 1st cousins. Within the pink box, the relationship is different. Evaline and Ira are siblings, but Evaline and Ira are 1st cousins to both Whitney and Ira (son of George) as are Ira (son of George) and Whitney to each other.

Let’s see if any of the two Lentz males match the DNA of the 4 descendants of Margaret Lentz Miller. If so, those matching segments would have been inherited from Margaret Lentz by her children.

In order to do this easily, we’re going to run the chromosome browser at Family Tree DNA for each of the Lentz men, William and C., individually, against all 4 of the people who descend from Margaret Lentz.

Ironically, the two Lentz males, William and C. Lentz, don’t match each other above the vendor’s testing threshold, but do match each of the other 4 individuals.

William and C. Lentz do, however, match each other on 3 segments above 6cM at GedMatch where you can adjust the matching thresholds.

Margaret Lentz Gedmatch

After selecting the four pink descendants of Margaret and comparing on the chromosome browser to each of the Lentz men, we’re going to download their matching segments to each of the Lentz men and drop those results into a common spreadsheet.

In this example, I’m using William Lentz as the background person we’re comparing against, and the 4 pink testers who descend from Margaret Lentz Miller are the 4 people being compared to William.  On William’s chromosome displayed below:

  • Rex=orange
  • Barbara=blue
  • Cheryl=green
  • Don=bright pink

Margaret Lentz chr browser

At the top of the chromosome browser you’ll see a selection on the left side next to the Chromosome Browser Tutorial that says “download to Excel (CSV format).” That selection will only download matching segments of the people you’re comparing, so I made that selection.

Margaret Lentz chr browser2

I repeated the process for C. Lentz as compared to these same 4 pink people, and combined the results into one spreadsheet where I color coded the results of the two Lentz men differently and deleted the segments below 3cM. C. Lentz is blue and William Lentz is apricot.

Margaret Lentz William and C

This chart took my breath away. We are literally looking at segments of Margaret Lentz’s DNA inherited by her descendants (assuming there no other family connection between these individuals.)

Let’s sort this in segment and chromosome order and see what we come up with.

Each of these rows is able to “stand alone” since we already know how these individuals are related.  They are closely related, 3rd cousins, and we’re trying to see which of their DNA is from a common source – meaning the Lentz DNA from Jacob Lentz and Fredericka Reuhl.

However, even though these individual matches work, due to the close known relationships, triangulation groups are always preferable.  But first, let’s look at matching groups.

Margaret Lentz match groups

In the chart above, I colored the 5 columns beginning with chromosome green when there is more than one match that includes any part of the same segment. Remember, we can’t see triangulation on this spreadsheet, because we only looking at matches to William and C. Lentz individually. These are just match groups at this point.

I added the column “Match Set” so that you can easily see the different matching groups. Because the green color used to indicate matching groups butts up against neighboring groups, it’s difficult to tell where one group ends and the next begins, so I’ve indicated that in the “Match Set” column by labeling each matching set of DNA.

The yellow match sets aren’t to siblings and may well triangulate.  The match sets colored green in the Match Set column are to both Don and Cheryl, who are siblings, and you can’t count matches to siblings in triangulation groups.

  • A match is when any two people match – like Barbara and William Lentz.
  • A match set is when any two pairs match on the same segment.
  • Triangulation occurs when any three people match on any portion of the same segment of DNA AND share a known common ancestor. Without the known ancestor or ancestral line, it’s just a match set.

Match set 1 doesn’t count as triangulation because William matches Don and Cheryl both who are siblings. Triangulation needs to occur between more distant matches.

Match set 2, which is yellow, could triangulate. To verify triangulation, we need to verify that Barbara matches Don on this part of the same segment.

I went back to Barbara’s chromosome browser and indeed, she does match Don on part of this same segment.  This segment does triangulate, as shown below – because all three people match each other on a portion of this same segment.

Margaret Lentz triangulation

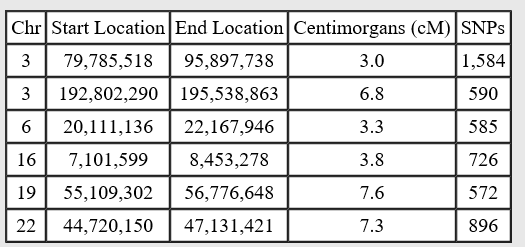
The actual overlapping segment between all three individuals is from 121,679, 417 through 128,527,507 for probably about 6cM.

Of course, now if I could just find a Lenz descendant from upstream of Jacob, or a Reuhl upstream of Fredericka that matches some of these folks, I could determine if Margaret’s DNA is Lenz (Lentz) or Reuhl.

If you’re thinking this could go on forever, you’re right – except that the further out in time, the less likely to find a match, let alone on a common segment. It’s a genetic genealogical end of line instead of a more traditional one. What a fun challenge though.  And hey, there’s always hope that someone from Germany or another line that immigrated will test and match. That’s the beauty of DNA. You can learn from autosomal matches, Y DNA matches and mitochondrial as well, so you have three genetic educational opportunities for each ancestor.

Summary

Margaret’s early life is shrouded in a bit of mystery, other than we know she was born in Pennsylvania and was raised Brethren. Her first entrance on her own is when she married on her 18th birthday. Celebration or rebellion, or both? We’ll never know, but marrying ON her 18th birthday does cause the question to be asked.

Margaret’s life seemed to be typical in every way, which for women of that timeframe means we find them in census records and not much else. However, that would change in July of 1851 when her husband, Valentine Whitehead, suddenly died.

Margaret was just two months pregnant at that time with her 5th child, a daughter that would never meet her father. Margaret probably farmed for the next 5 years as best she could, in addition to being a mother to her children. Yes, she had the resources of the Brethren community, but the fact that she did not hurriedly remarry suggests she might have been far more independent that most women of her time. She also didn’t sell out and go back home, to Ohio, to her parents. That must have been a temptation for a young widow under 30 with 5 children. Was she simply that iron-willed, resilient and determined?

Five years later, Margaret remarried to John David Miller. They combined their 12 children into a blended family and added 3 more of their own, for a total of 15 altogether. If the photo of John David and Margaret indeed is in front of the cabin portion of their home, they did not add on during their lifetime and lived in just the cabin portion – a small house for such a large family.

John David’s obituary tells us that Margaret had 4 children after their marriage, but only 3 survived. There was a span of 3 years between Ira and Perry, so the child who died was likely born in 1861. There are no candidate children buried either at Baintertown or in the Whitehead Cemetery, but many graves don’t have markers. It appears that Mary Baker Miller didn’t have a marker until John David Miller died, more than 50 years later.

However, looking at the births of Margaret’s children, she may have had one more. Her first child wasn’t born for 2 years after she was married – something almost unheard of at that time. She could well have had a first child that died and Lucinda, born two weeks shy of Margaret’s 20th birthday could have been her second child.  The 1900 census doesn’t reflect that in the number of birthed vs living children, but the census has been known to be incorrect.

Margaret may have buried her first child in the Happy Corners cemetery where her parents would later rest. If so, that grave too is unmarked.

Margaret bore her last child when she was just 6 months shy of her 40th birthday.

By the sunset years of Margaret’s life, her 8 children who survived childhood gave her 38 known grandchildren, at least one and likely seven whose funerals she attended. Multiple grandchildren are noted once in the census, and then no more. There were likely additional grandchildren born who didn’t live long enough for a census to be taken. Unfortunately, losing multiple children was a way of life and expected before the era of modern medicine, in particular, antibiotics.

Margaret and John David Miller both lived to be quite elderly. He apparently became senile before he died, just shy of his 90th birthday and Margaret died not long afterwards of progressive heart disease.

Unfortunately, the blended family that seemed to work so well, from outward appearances anyway, came unraveled before John’s death. His children from his first marriage petitioned the court for guardianship, which appears to have driven a significant wedge between the two sets of children. That rift never healed, and in fact, became worse after John David’s death, pushing Margaret to the point where she withdrew her dower rights from John’s estate, deeding that third to her Miller children. John’s children from his first marriage would have been far better to let the will stand uncontested, but they didn’t.

It’s through this contested will that we discover that while Margaret’s children can read and write, she cannot – or at least she can’t at 80 years of age. We don’t know if she could have signed her name when she was younger.

Margaret was no pushover – and if those 7 Miller children thought they could push their elderly step-mother around, they were wrong. I bet both John David’s and Margaret’s funerals were “interesting,” to say the least, given the division within the family.  John David’s funeral was at the house, not the church, so I’d wager that Margaret’s funeral took place at home too.  I have to wonder what she might have thought, watching from above.  Was she chuckling to herself, or was she angry?

Even at her advanced age and in ill health, it appears that Margaret was still something of a spit-fire. She didn’t let her Brethren religion keep her from going to the courthouse and taking care of business several times in her last year.

Margaret died of hydro pericardium, an accumulation of fluid in the membrane that surrounds the heart. She also had mitral incompetency which means the mitral valve of the heart does not close properly, eventually causing congestive heart failure.

Margaret Lentz death

This ailment would not have manifested itself suddenly. It’s likely that as she cared for her aging husband, she was short of breath herself. As the stressful situation following his death unfolded, her health was worsening as well.

Margaret passed away on the 4th of July. Independence Day indeed!  Margaret’s death leaves me wondering once again if this was her way of making a triumphant exit statement, much as her marriage on her 18th birthday was her grand entrance.

I suspect that Margaret was part rebel, in spite of her Brethren upbringing.  In any case, she appeared to be a lot more independent  than was acceptable for Brethren girls or women – and it showed from time to time!

Perhaps I came by that trait honestly and it’s carried from generation to generation in some of those DNA segments!

______________________________________________________________

Disclosure

I receive a small contribution when you click on some of the links to vendors in my articles. This does NOT increase the price you pay but helps me to keep the lights on and this informational blog free for everyone. Please click on the links in the articles or to the vendors below if you are purchasing products or DNA testing.

Thank you so much.

DNA Purchases and Free Transfers

Genealogy Services

Genealogy Research

Concepts – Parental Phasing

I recently used a technique called parental phasing as part of the proof that one Curtis Lore found in Pennsylvania was the same person as Curtis Benjamin Lore, found later in Indiana.  Given that I’ve already used parental phasing as part of a proof argument, I’d like to break it down further and explain the concepts behind parental phasing, what it is, why it is so important, and why it works so well.

For those of you who don’t have at least one parent available to test, I’m truly sorry, and not just because of the lost DNA opportunity. But please do read this article, because you may be able to substitute other family members and derive at least some of the benefits, although clearly not all.

What is Parental Phasing?

The fundamental concept of parental phasing is that the only way you can obtain your DNA is through one or the other of your parents, so every one of your matches should match you plus one of your parents. Right?

Should, yes, but that’s not exactly how autosomal matching works in real life.

You can match someone in one of two ways:

  1. Because you received the matching segment from one of your two parents, and they received that same segment from one of their two parents, a circumstance that is called identical by descent or IBD.
  2. Because your match’s DNA is zigzagging back and forth between the DNA you inherited from both of your parents, or your DNA is zigzagging back and forth between their parents, either of which is called identical by chance or IBC.

I wrote about his in the article titled, Concepts – Identical by…Descent, State, Population and Chance.

Here’s the matching “Identical By” cheat sheet since you may find it helpful in this article as well.

Identical by Chart

How Does Parental Phasing Work?

Parental phasing works by comparing your DNA against your matches DNA, then comparing your matches DNA against your parents DNA, and telling you which, if either, or both, parents they match in addition to you. Oh yes, and there’s one more tiny tidbit – they must match you and your parent(s) on the same segment(s).

As bizarre as it sounds, sometimes your match will match you on one segment, and match your parents on an entirely different segment.  While this was not an expected finding, it does happen, and frequently enough that it was found in every parental phasing test run – so it’s not an anomaly or something so rare you won’t see it.

Therefore, parental phasing may be a two part process, where:

  • Step 1 is determining whether or not your match matches either or both of your parents.
  • Step 2 is determining if your match matches you and your parent on the same segment(s), or at least part of the same segment? If not, then it’s not a phased IBD match – even though they do match you and your parent.

Conceptually, each of your matches will fall nice and cleanly into one, or both, of your parent’s buckets. Let’s look at a couple of examples.  For each of the people who match you, they will also match your parents on the same segment as follows:

Match Matches Your Mother Matches Your Father Matches Neither Parent Comment
Susie Yes No From Mom’s side, IBD
John No Yes From Dad’s side, IBD
Bob Yes Yes Matches both parents lines, IBD and may be IBP
Roxanne No No Yes Identical by Chance, IBC

Please Note: Your match list will change if you change your matching threshold, and so will your phased matches to your parents.  In other words, while someone might not match you and a parent both on the same segment at 15cM, you might well match on a common segment at a 10, 7 or 5cM threshold.

So in essence, parental phasing puts your matches into very useful buckets for you and helps eliminate false positives – or matches that appear real but aren’t.

How Can Someone Match Me But Not My Parents?

That’s a really good question. Sometimes you match someone because you received common DNA from an ancestor, through your parents, which means you’re identical by descent (IBD), a legitimate genealogical match.  But other times, you match someone just by chance because their DNA is matching pieces of both of your parents’ DNA, and not because you actually share a common ancestor.

Let’s take a look.

This first graphic shows you with an identical by descent match to your match’s father’s DNA. Your match’s father shares a common relative with (at least) one of your mother’s lines.

Phase IBD

In the most basic terms, an identical by descend (IBD) match looks like this, where your match is matching you on one of your parent’s strands of DNA. Both matching strands are colored green in this example.

Of course, your DNA does not come labeled as to which side is mother’s and which side is father’s. You can read more about that here. If it did, we wouldn’t even need to be having this discussion at all – because that’s what parental phasing does.  It tells you which side of your family your DNA match came from.

You can see in the above example that you and your match both share an actual strand of DNA. You inherited yours from your Mom and your match inherited theirs from their Dad, which means your Mom and their Dad share a common ancestor.  However, to be able to discern that fact, that your Mom and your match’s Dad share a common ancestor, you need to be able to phase the DNA of both you and your match to know which parent that strand came from.

In reality, your DNA and their DNA is entirely mixed in each of you, shown in the chart below, and without additional information, neither of you will know which strand of DNA you match on, or who you inherited it from.  Initially, you will only know THAT you match.

Phase IBD2

So here’s what your DNA really looks like. It’s up to the DNA matching software to look at the two strands of your DNA that’s mixed together, and the two strands of your match’s DNA that’s mixed together and see if there is a common grouping of DNA at each location that extends for at least 10 locations in length, which is the “threshold” for our example that signifies a match that is likely to be “real” versus IBC, or identical by chance.  In my example, that common grouping is the green “Matching Portions” column, above.

An identical by chance match looks like the chart below. You can see that the green matching DNA is zigzagging back and forth between your parents’ DNA.

Phase IBC

It can even be worse where your match’s Mom’s and Dad’s DNA is also zigzagging back and forth, but you can certainly get the idea that there are all kinds of ways to NOT match but only three ways to legitimately match – Mom’s side, Dad’s side, or both.

So you can see that indeed, you do technically match, but not because you share a DNA segment of any size with one parent, but because your match’s DNA matches part of your Mom’s DNA and part of your Dad’s, which means that DNA segment does NOT come from one common ancestor, meaning not IBD. However, the matching software can’t tell the difference, because your strands aren’t coded to Mom and Dad.

What parental phasing does is to assign your matches to “sides” or buckets based on whether they match your Mom or Dad in addition to you.

One Parent Matches

In my case, I only have one parent whose DNA is available. Therefore, all of my matches will either match both my mother and me, or not.  The balance that do not match me and my mother, both, will either match to my father or will be IBC, identical by chance matches.  Unfortunately, just by utilizing one-parent phasing, I can’t tell if the “non-Mom” matches are really to my father or are IBC.

Let’s look at an example.

Match Mom’s Side Dad or IBC Comment
Denny Yes Probably not Mom’s side, could also match on Dad’s side but we have no way to tell. My parents lines come from different parts of the world except that they both married into Native American lines.
Sally No Yes Can’t tell whether Dad’s side or IBC
Derrell No Yes Also matches cousin on Dad’s side on same segments, so Derrell is assigned to Dad’s side pending triangulation.

By using the ICW tool at Family Tree DNA, shown below, I can see who matches me and my matches, both – in this case, me and my mother.

No Parent Matches

If I have no parents in the system, but several other close family members, like uncles or cousins, I can easily see who else I match in common with my match.

In other words, without my mother to match, Denny will either match my Mom’s side family members, and I can tentatively group him there, my Dad’s side family members, and I can tentatively group him there, or neither, in which case I can’t do anything with him except note that fact.

An Example

I’m going to use my proven cousin Denny for my examples, because that’s who I used in my Curtis Lore case study and our connection is proven both genetically and genealogically.

Here’s Denny’s match list. My mother is Denny’s closest match and I’m his second closest.

Phase match list

Therefore, I can use the ICW technique to effectively put my matches into buckets that divide my DNA in half, if I have both parents.

If I have one parent, I can fill one bucket for sure by putting everyone who matches both my mother and me into the “mother” bucket. The balance will be in the “Father +IBC” bucket.

This is easy to do at Family Tree DNA by using the crossed arrow ICW tool to find everyone who matches me in common with my mother.

Phase iCW

If I don’t have either parent, but I have an uncle or a cousin, I can still assign some matches to buckets by utilizing this same ICW tool. What I can’t do without both parents is to eliminate IBC or identical by chance matches from my match list.  I need both parents or at least well fleshed out match groups to do that.  There are examples of using match groups to identify IBC matches in the article, Identical By…Descent, Chance, Population and State.

Furthermore, I will need to download my match lists for both my mother and myself to verify that each person matches both my mother and myself on a common segment.

Testing the Theory

Let’s use my real life example and see how this works. I’m going to utilize three generations, because this gives us the ability to see the parental phasing work twice.  In this illustration, below, four people have tested, Denny, Mother, Me and My Child.

Phase pedigree

Denny and my child, who are 3rd cousins once removed, match on the following DNA segments, utilizing the Family Tree DNA chromosome browser.  We are comparing against Denny, meaning he is the “background” black chromosome.  The orange illustrates where my child matches Denny.

Phase browser denny child

There are no matching segments on chromosomes 18-22.  I have not included X chromosome matching.

Here’s the same information in chart format.

Phase chart denny child

You can see that Denny and my child have several fairly significant segment matches, along with some smaller ones too. The question is, which of those segments are legitimate, meaning IBD and which are not, meaning IBC?

Let’s phase my child against my DNA and see which of these segment matches hold up.

My child is orange, and I am blue and we are both matching against cousin Denny.

phase browser denny child me

As you can see, many of those segments are legitimate because Denny matches both me and my child on the same segments. So they are not IBC, or identical by chance, but IBD, identical, literally, by descent – because my child received them from me.

In some cases, Denny matches only me, blue, which is fine because all that means is that either our matches are IBC or I didn’t pass that DNA to my child. Both matches on chromosome 3 are to me (blue) and not to my child (orange).

However, in the cases where Denny matches my child (orange,) and not me (blue,) on the same segments, that means that either Denny and my child share an ancestor that is through my child’s father or the matches are IBC.  Those matches are not through me.  In other words, those segments did not pass phasing.  You can see examples of that on chromosomes 1, 4 and 14, and partial matches on 11 and 12.

Chromosome 16 shows a really good example of a crossover event where my child, orange, received part of my DNA, blue, but about half way through my segment, it was divided and my child inherited part of mine and the other half from their father.  So, visually, you can see that my child only matches Denny on about half of the segment where I match Denny.

Matches Spreadsheet

I downloaded the results of both Denny’s matches to me and Denny’s matches to my child into one Matches Spreadsheet and have color coded them so that you can see the relationships.  If Denny matches both me and my child, you will see a common segment on that chromosome for both me and my child in the spreadsheet.  Rows where Denny matches my child are light orange and rows where Denny matches me are light blue, similar to the chromosome browser colors.

Denny Me Child

There are only three possible conditions and I have colored the chromosome column accordingly:

  • Denny matches me only – dark teal – may be a legitimate match but we don’t have enough information to tell at this point
  • Denny matches my child only, but not me – red – NOT a legitimate match – identical by chance (IBC)
  • Denny matches me and my child both – boxed green – a legitimate identical by descent (IBD) match

You’ll note that some of these matches are exact. For example on the first matching segment of chromosome 2, below, my child received this entire segment of my DNA.  It was not divided at all.

Denny Me Child 2

However, in the next two matching groups on chromosome 2, my child received most of the DNA I share with Denny, but some was shaved off, but not half.

Denny Me Child 2 shaved

On chromosome 16, my child received almost exactly half of the DNA segment that I share with Denny.

Denny Me Child 16

On chromosomes 11 and 17, my child shares more DNA with Denny than I do, which means that all of that DNA isn’t ancestral though me. In this case, either there are some fuzzy boundaries, a read error, part of the DNA is IBD and part is IBC or part of the DNA is matching through both parents.

Denny Me Child 17 c

On chromosome 14, I match Denny, but my child received none of that DNA, which is why I’ve added the color teal.

Denny Me Child 14 c

Now, let’s phase me against my mother and see how the DNA matches hold up in a third generation.

Adding the Next Generation

The view of the chromosome browser below shows Denny matching my child, in orange, me in blue and my mother in green.

Amazingly, many of these segments follow through all three generations.

phase browser denny child me mother

Let’s see how the various matches stacked up, pardon the pun.

I’ve added Denny’s matches to mother to the Matches Spreadsheet and her rows are colored green.

On the Matches Spreadsheet from the first example, there were several segments where Denny matched only me and not my child. They were colored teal.  In the chart below, so we can track those segments, I have colored them teal in the matchname column, and you can see the resolution of how they did or didn’t survive phasing against my mother in the chromosome column.

Of those 11 segments, 2 phased with my mother, the rest did not. That makes sense, since none of those are segments I passed on to my child, so they would be more likely to be IBC.

Denny me Child Mom SS

The legend for the spreadsheet above is as follows:

  • Dark teal in chromosome column – Denny matches Mom only – may be a legitimate match but we don’t have enough information to know (chromosomes 1, 2, 4, 5, 6, 7, 9, 12 and 15)
  • Dark teal in matchname column, plus red in chromosome column – previously Denny matched only me, now I do not phase against my mother, so this is an IBC match (chromosomes 1, 3, 4, 5, 6, 7, 10, 12 and 17)
  • Dark teal in matchname column, plus green box in chromosome column – previously Denny only matched me, but now this segment is parentally phased and considered legitimate (chromosomes 2 and 10)
  • Red in chromosome column – does not phase against parent, so not a legitimate match – IBC (chromosomes 1, 3, 4, 5, 6, 7, 10, 11, 12, 14 and 17)
  • Green box indicates a phased match – considered IBD and legitimate (chromosomes 1, 2, 10, 14, 15, 16 and 17)

Anomalies

*So what the heck happened with chromosome 11?

In the first example, this segment received a green box because Denny matched both me and my child on a partial segment, which means that partial segment is phased and considered legitimate.

denny me child mom ss 11 grn

When we moved to the next generation, phasing against my mother, Denny does not match my mother on this segment, so it could NOT have arrived in me and my child via my mother, so it is not IBD, even though it appeared that way initially. Because of this, I’ve changed the box color to red for a non-IBD match.

Denny me Child Mom SS 11

How could this happen?

First, it’s a very small segment overlap match, and second, Denny matched more to my child than to me, which is a neon warning sign that this segment match is suspect, especially those two conditions in combination with each other.

Here’s an example of how, genetically, a match could phase with a parent in one generation, but not hold into the next generation.

phase n o phase

This match matches both me and my child (gold), but not my mother, who has no gold. As you can see, the match does accrue 10 gold location matches in a row, but not 10 green ones, so doesn’t match my mother.  The larger the number of locations in a row required to be considered a match, the less likely this type of random matching will be to occur.

This is both the purpose and the quandry of thresholds.  Finding that sweet spot that doesn’t eliminate real matches, but is high enough to be useful in eliminating false positive (IBC) matches.  And I can tell you, there are just about as many opinions on what that threshold number should be as there are people giving opinions – and everyone seems to have one!  You can read more about this in the article, Concepts – CentiMorgans, SNPs and Pickin’ Crab.

Segment Survival

Let’s take a look and see how many of which size segments survived parental phasing.  Are some of those smaller segments legitimate matches, or did we lose them in phasing?

The chart below shows the results in segment size order, color coded as follows:

  • Red = segments that did not phase and were IBC
  • Teal = segments that match Mom only and may or may not be valid. We don’t have any way to know without additional matches.
  • Green = segments that phased and are IBD

Phased cMs by size

As you would expect, all of the larger segments phased, but surprisingly, so did several of the smaller segments, through three generations.

Given the fact that teal matches did not phase, for the most part, in the previous example, and given that the teal segments are mostly small, my suspicion would be that most of  these teal segments would not phase (with the probable exception of the 10.27 cm segment), if we have the opportunity to find out – which we don’t.

This example is for a non-endogamous line, or better stated, with distant endogamous groups in multiple lines. Endogamous results would probably be different.

Statistics

What do our statistics look like?

There were 58 matching segments between Denny, my child, me and my mother.

  Match To Whom # Segments # Phased %
Denny My Child 12 8 75
Denny Me 22 11 50
Denny Mother 24 Probably at least 11
Total 58

Of those 58 total matches, 16 were IBC meaning they did not match up through my mother.

  Total

Segment Matches

IBC (no phase) IBD (phase) Just Mother Match Groups 2 gen Groups 3 gen Groups
58 16 29 13 12 3 9
% 28% 50% 22% 25% 75%

Thirteen match just to mother (teal), of which one, on chromosome 12 for 10.27 centiMorgans, is the most likely to be legitimate, or IBD. The rest were smaller segments and none were passed to a the child, so they are less likely to be legitimate, or IBD.

There are a total of 12 matching groups, of which 3 are for only two generations, me and mother. In other words, not all of that DNA got passed on to my child, but at least some of it did 9 of those 12 times.

Does Size Matter?

I wanted to see how the small versus large segments faired in terms of three generations of parental phasing. Are smeller segments legitimate or not?  Do they stand up?  The “Phased cMs by Size” chart above was sorted in chromosome order, with teal being a match to mother only (so we don’t know if it phased), green meaning the segment DID phase and red meaning it DID NOT phase with the parent.

Removing the teal blocks, which match to mother only, meaning we don’t know if they would parentally phase or not, leaves us with the blocks that had the opportunity to phase, and whether they passed or failed. 100% of the blocks 3.57cM and above phased.  A natural dividing line seems to occur about the 3.5 cM level, shown below.

phased cms by size less teal

It’s interesting that all matches above 3.36 cM phased, several of them twice, through three generations or two transmission (inheritance) events. Of those, 9, or 43% were under the 10cM threshold suggested by some, and 7, or 33% were under the 7cM threshold.

Most of the segments 3.36 cM and below, did not pass phasing. Of those, 6 or 26% did pass phasing, while 17, or 74%, did not.  Note that this cM level is with the SNP threshold set to 500 SNPs, which is generally the lowest number I use.

Segment Size # of Segments # Segments Phased %
Larger than 3.5 cM 21 21 100
Smaller than 3.5 cM 23 6 26

Are these results a function of this particular family, or would this hold if more parental generational phasing studies were performed?

Let’s see. 

The Threshold Study

I was surprised by the seemingly low threshold of 3.5 cM that appeared to be the rough dividing line for cMs that passed parental phasing and those that did not. I undertook a small study of four additional 3 generation non-endogamous families.

I’ve included the Lore study that we discussed above in the first column.

I have also removed all duplicates in the results below, since the duplicates were an artifact of matching groups where we had three generations to match.

I completed 4 different three-generation studies in 4 unrelated non-endogamous families and noted the rough threshold for where matches seem to pass or fail phasing – in other words, the fall line. In all 4 examples below, the threshold was between 2.46 and 3.16 cM.  You could move it slightly higher, depending on what criteria you use for the “fall line,” which is why I’ve included the raw data.  In all cases, the SNP threshold was at 500 so you would not see any matches with fewer than 500 SNPs.

The black bar in the results below marks the location where the shift from fail to pass occurs in the various studies.

4 family phasing

Additionally, I have one 4-generation study available as well. The closest related of the 4 generations that were being matched against were first cousins, then first cousins once removed, then first cousins twice removed (equal to 2nd cousins) then 1st cousins three times removed (equal to second cousins once removed).

You can see, below, that the pass/fail threshold for this 4 generation, 3 transmission study was also at 3.69 cM for valid segments that survived. The segments labeled “2 match” mean that they did not get passed to the younger generations, so they only matched in the oldest two generations, 3 match the oldest 3 generations and 4 match meaning the match survived through all 4 generations.

It’s interesting that even some of the smaller segments held through all 4 generations.

4 gen phasing

Ethnicity Matters

Clearly, parental phasing is only successful when you have matches. Of the three data bases available for autosomal DNA comparisons today, Family Tree DNA and 23andMe likely have the largest representation of non-US participants, because the Ancestry.com test was not sold outside the US for quite some time.  The Family Tree DNA Family Finder test was sold in the most locations outside the US.

Family Tree DNA probably has the best representation of Jewish DNA of all of the data bases.

Family Tree DNA projects facilitate the grouping of individuals by self-selected interest which includes ethnic categories, making those relationships visible by virtue of project membership wherein they are not readily evident in other data bases.

Therefore, by virtue of who has tested, if your ancestry is not “US” meaning a melting pot type of environment who are not recent arrivals, then you are likely to have less matches, so less phased matches too.  If you have a high degree of any particular ethnicity, even if your ancestry is “US,” you may still have fewer matches.  For example, 3 of 4 of my mother’s grandparents were either German or Dutch, and she has 710 matches, or roughly half the matches that I have.  My father’s heritage was Appalachian, meaning Colonial American.

Here’s a quick chart showing the total matches as of April, 2016 for a number of individuals who contributed their match totals in Family Finder and who carry either no US heritage or a specific ethnicity.  For purposes of comparison, three individuals with typical mixed colonial US heritage are shown at the top.

Ethnicity match chart

People with high percentages of African heritage tend to have few matches today, as do those of purely European heritage. Unfortunately, not many Africans or African-Americans test their DNA and DNA testing is not as popular in Europe as it is in the US.  Many people in Europe are leary of DNA testing or don’t feel they need to test, because “we’ve always lived here.”   I’m hopeful that the sustained popularity of programs like Who Do You Think You Are and Finding Your Roots will encourage more people of all ethnicities and locations to test from around the globe.

People from highly endogamous populations have a different issue to deal with, as you can see from the very high number of Jewish matches in the chart above. Since these people descend from a common founder population, they share a lot of ancestral DNA that is identical by population, meaning they did receive it from an ancestor, so it’s not IBC, but they received that segment because that particular segment is very prevalent within that population.  Determining which ancestor contributed that piece of DNA is exceedingly difficult, if not impossible because several ancestors carried that same segment.

Therefore, while the segment is identical by descent, it’s probably not genealogically useful in a 100% endogamous scenario.

In an unpublished study, we discovered that while working with parentally phased Jewish results, it’s not unusual for up to half of the matches to not match the participant plus either parent on the same segments. Or conversely, they may match both parents, but the segments are comparatively small.  Matching to both parents in an endogamous population, without a known familial relationship, and without at least one relatively large segment, is an indicator of IBP, identical by population, matches.  For Jewish and other endogamous people, parental phasing is very promising, and will help them sort through irrelevant “diamond in the rough” matches indicated by no parent matches or smaller both parent matches to find the genealogically relevant gems.

In all parental phasing groups studied, no one lost less than 10% of their matches utilizing parental phasing and most people lost significantly more, up to half.  I would very much like to see these same kinds of 3 or 4 generation parental phasing studies done for groups of Jewish, other endogamous and African American families.  In order to do a study of one family, you need at least 3 generations who have tested and another known family member, like a first or second cousin perhaps, to match against.

In Summary

Dual parental phasing works wonderfully.  One parent phasing works pretty well too.  Even close relative phasing works, just not as well as parental phasing.  You can only work with the people you have available to test, so test every relative you can convince!

If you have one or both parents to test, by all means, do. You’ll be able to phase your matches against both of your parents individually and eliminate the majority of IBC matches.

If you have grandparents or their siblings available to test, do, and quickly so you don’t lose the opportunity. Test the oldest person/generation in each line that you can.

If you don’t have both parents, test your half and full siblings, all of them, the more the better, because they inherited parts of your parents DNA that you didn’t.

Find your closest relatives and test them, yes, all of them.

If you are testing parents, you don’t need to test their children too, because their children will only receive half of their parent’s DNA, and you already have the parents DNA.

Even if you can’t phase your matches utilizing your parents DNA, you can use the combination of your matches with other relatively close family members to assign or suggest matches to both sides of your family along family lines – creating match groups. For example, if your match matches you and your great-uncle Charlie on the same segment, then it’s very likely that match is from the common ancestral line shared by your common ancestor with great-uncle Charlie – your great-grandparents.  Triangulation, of course, will prove that.

Some of your relatives will be quite interested in DNA testing and others will be happy to test simply because it helps you, and they like to hear about the result of the genealogy research. I’ve discovered that providing a scholarship for the testing, especially for those people you really want to test, goes a very long way in convincing people that DNA testing for genealogy is something they might be interested in doing.  If you can’t personally afford a scholarship for everyone, try the old fashioned collection jar.  And no, I’m not kidding.  It works wonders and gives everyone an opportunity to participate and invest as well, as much as they can afford.

Ethnicity testing has a lot of sizzle for some folks too – so don’t just deliver the dry facts – be sure to talk about the sizzle too. Sizzle sells!  People get excited about the possibilities and of course, you’ll explain the result to them, so they get to visit with you a second time as well.  Something to look forward to at next summer’s picnic!

Be sure to take swab kits to family events; picnics, reunions, graduation parties, weddings and holiday gatherings. Believe me, I have a DNA kit in my purse or car at all times.  And maybe, if your extended family lives close by, resurrect the old-time Sunday afternoon tradition of “going calling.”  Not only can you collect DNA, you can collect family memories too and I guarantee, you’ll make a new discovery with every visit.  Take this opportunity to interview your relatives.

It’s amazing isn’t it, the things we do for this “DNA phase” that we’re all going through!

Acknowledgements

I want to thank Family Tree DNA for their ongoing support of projects and citizen scientists which makes these types of research studies possible. I also want to thank several individuals in the genetic genealogy community who provided their information and gave permission for me to incorporate their results into this article.  Without sharing and collaboration, these types of efforts would simply not be possible.

______________________________________________________________

Disclosure

I receive a small contribution when you click on some of the links to vendors in my articles. This does NOT increase the price you pay but helps me to keep the lights on and this informational blog free for everyone. Please click on the links in the articles or to the vendors below if you are purchasing products or DNA testing.

Thank you so much.

DNA Purchases and Free Transfers

Genealogy Services

Genealogy Research

Concepts – CentiMorgans, SNPs and Pickin’ Crab

In autosomal DNA testing, you’ll see the terms centiMorgans, represented as cMs and SNPs, which stands for single nucleotide polymorphism, combined.

These are two terms that are used to discuss thresholds and measurements of matching amounts of autosomal DNA segments.

These two terms, relative to autosomal DNA, are two parts of a whole, kind of like the left and right hand.

CentiMorgans are units of recombination used to measure genetic distance. You can read a scientific definition here.

For our conceptual purposes, think of centiMorgans as lines on a football field. They represent distance.

football fabric 2

SNPs are locations that are compared to each other to see if mutations have occurred.  Think of them as addresses on a street where an expected value occurs. If values at that address are different, then they don’t match.  If they are the same, then they do match.  For autosomal DNA matching, we look for long runs of SNPs to match between two people to confirm a common ancestor.

Think of SNPs as blades of grass growing between the lines on the football field.  In some areas, especially in my yard, there will be many fewer blades of grass between those lines than there would be on either a well-maintained football field, or maybe a manicured golf course.  You can think of the lighter green bands as sparse growth and darker green bands as dense growth.

If the distance between 2 marks on the football field is 5cM and there are 550 blades of grass growing there, you’ll be a match to another person if all of your blades of grass between those 2 lines match if the match threshold was 5cM and 500 SNPs.

So, for purposes of autosomal DNA, the combination of distance, centiMorgans, and the number of SNPs within that distance measurement determines if someone is considered a match to you. In other words, if the match is over the threshold as compared to your DNA, meaning the match is deemed to be relevant by the party setting the threshold.  Think of track and field hurdles.  To get to the end (match), you have to get over all of the hurdles!

hurdles

By Ragnar Singsaas – Exxon Mobil ÅF Golden League Bislett Games 2008, CC BY 2.0, https://commons.wikimedia.org/w/index.php?curid=5288962

For example, a threshold of 7 cM and 700 SNPs means that anyone who matches you OVER BOTH of these thresholds will be displayed as a match.  So centiMorgans and SNPs work together to assure valid matches.

Thresholds

These two numbers, cMs and SNPs, are used in conjunction with each other. Why?  Because the distribution of SNPs within cM boundaries is not uniform.  Some areas of the human genome have concentrations of SNPs, and some areas are known as “SNP deserts.”  So distance alone is not the only relevant factor.  How many blades of grass growing between the lines matters.

Each of the vendors selects a default threshold that they feel will give you the best mix of not too many false positives, meaning matches that are identical by chance, and not too many false negatives, meaning people who do actually match you genealogically that are eliminated by small amounts of matching DNA. Unfortunately, there is no line in the sand, so no matter where the vendor sets that threshold, you’re probably going to miss something in either or both directions.  It’s the nature of the beast.

Company Min cMs Min SNPs Comment
Family Tree DNA 7cM for any one segment + 20cM total 500 After the initial match, you can view down to 6 cM and 500 SNPs to people you match
23andMe 7cM 700
Ancestry 8cM after Timber and associated phasing routines Unknown Timber population based phasing removes matches they determine to be “too matchy” or population based
GedMatch User selectable – default is 7 User selectable – default is 700

2022 Update: MyHeritage began offering DNA testing and matching after this original article was published. Matches must have at least one 8 cM matching segment, but they show additional segments to 6 cM. There is no specified number of SNPs. Note that their imputation calculations sometimes cause the reported number of cM to be larger than for the same two people at other vendors.

As you might guess, there many opinions about the optimum threshold combinations to use – just about as many opinions as people!

These are important values, because the combined size of those matches to an individual allows you to roughly estimate the relationship range to the person you match.

As a general rule, the vendors do a relatively good job, with some exceptions that I’ve covered elsewhere and amount to beating a dead horse (Ancestry’s Timber, no chromosome browser). Of course, one of the big draws of GedMatch is that you can set your own cM and SNP matching thresholds.

Having said that, if you come from an endogamous population, you may want to raise your threshold to 10cM or even higher, depending on what you’re trying to accomplish

Effectively Using cMs and SNPs

Your personal goals have a lot to do with the thresholds you’ll want to select.

If you are new at genetic genealogy, you will first want to pursue your best matches, meaning the highest number of matching centiMorgans/SNPs, because they will be the low-hanging fruit and the easiest matches to connect genealogically. Said another way, you’ll match your closer relatives on bigger chunks of DNA, so concentrate on those first.  Successes are encouraging and rewarding!

Your match to a second cousin, for example, will have a significant amount of shared DNA, and second cousins share common great-grandparents – 2 of 8 people in that generation on your tree – so relatively easy to identify – as these things go.

The chart below shows the expected percentage of shared DNA in a given match pair, in this case, first and second cousins with a first-cousin-once-removed thrown in for good measure. Also shown is the expected amount of shared centiMorgans for the given relationship, the average amount of shared DNA from a crowd-sourced project titled The Shared cM Project by Blaine Bettinger, and the range of shared DNA found in that same project.

A pedigree chart of my family members fitting those categories is shown below, plus the actual amount of shared cMs of DNA to the right.

shared cM table

The chart below shows my DNA matches to my first-cousin-once-removed (1C1R), Cheryl.

Since we do match at Family Tree DNA above the match threshold, I can view all of my matching segments to Cheryl down to 1cM and 500 SNPs.

Cheryl chart

Just as a matter of interest, I’ve color coded the cM segments:

  • >10 cM = green
  • 7-10 cM = yellow
  • <7 = red

This means that if these were the largest matching segments, you would or would not be able to see them at the various thresholds of 7 and 10 cM.

If the matching threshold is at the default of 7cM, the green and yellow segments would be displayed.

If the matching threshold was set at 10, only the green cM segments are going to be shown.

At Family Tree DNA, you can select various threshold display options when using the chromosome browser tool, but not for initial matching. In other words, you have to match at their default threshold before you can see your smaller segments or alter your threshold display.

Some people want to see all of their DNA that matches, and some only want to see the large and compelling pieces, those green segments.  Neither choice is wrong, simply a matter of personal preference and individual goals.

The “large and compelling” part of that statement brings me back to why you’re participating in genetic genealogy in the first place, those individual goals.  The larger segments are going to lead to common ancestors who are generally easier to find and identify, unless you have an unidentified parent or a misattributed parental event.

You would never start with smaller segments in terms of matching, but that does not mean those smaller segments are never useful.  In fact, after you’ve managed to analyze all of your low hanging fruit, and you’re ready to research or concentrate on those ugly brick walls, groupings of those smaller segments in descendants may just be your lifesaver.

Surviving Phasing

However, now I’m curious. How many of those smaller segments do stand up to the test of parental phasing, meaning they match both me and my parent?  If my match (Cheryl) matches both me and my parent, then Cheryl does not match me by chance on that segment, so the match is genealogical in nature, the matching DNA proven to have descended to me from my mother.

Let’s see.

Cheryl Mom me chart

In order to phase my results with Cheryl against my mother, I copied Mother’s results into the same spreadsheet, above, color coding our rows so you can see them easier. “Cheryl matching Mom” rows are apricot and “Cheryl matching me” rows are yellow.

You can see that in some cases, like the first two rows, the two rows are identical which means I inherited all of Mom’s DNA in that segment and Cheryl inherited the same segment from her father, matching both Mom and me.

In other cases, I inherited part of Mom’s DNA on a particular segment.  I could also have inherited none of a particular segment.

In fact, of the 27 segments where I match Mom on any part of the segment, I match her on the entire segment 18 times, or 66.6% and on part of the segment 9 times, or 33.3%.

I left the color coding in the cM column the same as it was before, in my rows, to indicate small, medium and large segments. The small segments are red, which would be the most likely NOT to phase with my mother, in other words, the most likely to be Identical by Chance, not descent.  If Cheryl and I are Identical by Chance on these segments, it means that the reason I’m matching Cheryl is NOT because I inherited that chunk of DNA from mother. If Mom and I both match Cheryl, then Cheryl and I are Identical by Descent, meaning I inherited that piece of DNA from my mother, so the match is not because Cheryl’s DNA is randomly matching that of both of my parents.

In the spreadsheet below, I removed mother’s rows to eliminate clutter, but I color-coded mine. The rows that show red in the CHR and SNP columns BOTH are rows that did NOT phase with my mother, meaning these matches were indeed identical to Cheryl by chance.  The rows that are red ONLY in the cM column (and not in the CHR column) are small segments that DID phase with my mother, so those are identical by descent (IBD).

Cheryl Me phased chart

Here’s the interesting part.

  • All of the large segments, 10cM and over passed phasing. They are legitimate IBD matches.
  • One of 2 of the medium cM matches passed phasing.
  • Of the 15 smaller segments, ranging in size from 1.38 cM to 6.14 cM, more than half, 8, passed phasing. Seven did not. The smallest segment to pass phasing was 1.38 cM. I suspect that part of the reason that the smaller cM segments are passing phasing is that the SNP threshold is held steady at 500 SNPs. In another (unpublished) study, dropping the SNP threshold below 500 results in a dramatic increase in matches (roughly fourfold) and a very small percentage of those matches phase with parents.

Small Segments Guidelines

There has been a lot of spirited debate about the usage, or not, of small segments, so I’m going to provide some guidelines.  Let me preface this by saying that none of this is worth getting your knickers in a knot, so please don’t.  If you don’t want to include or utilize small segments, then just don’t.

  • What is and is not a small segment can vary depending on who you are talking to and the context of the conversation.
  • Small segments CAN and do survive parental phasing, as shown above.
  • Small segments CAN be triangulated to a particular ancestor. Triangulated in this sense means that this segment is found in the descendants of a group of people (3 or more) proven to descend from the same ancestor AND who all match each other on the same segment.
  • Not all small segments can be triangulated to a common ancestor.  But then again, the same can be said for larger segments too.  It’s more difficult and unlikely to be successful with smaller segments unless you are starting with a group of people who descend from a common ancestor and are looking for “ancestral DNA.”
  • Small segments, even after triangulation, can be found matching a different lineage. This is an indicator that while the descendants of the first group share this DNA segment from a specific ancestor, it may also be prevalent in a population in general, which would cause the same segment to show up matching in a second lineage from the same region as well. I have an example where my Acadian line also matches a different German line on a particular segment – which really isn’t surprising given the geography and history of Germany and France.
  • Small segments without the benefit of other tools such as parental phasing, triangulation and match groups are, at this time, a waste of time genealogically. This may not always be the case.
  • Never start with small segments.
  • Never draw conclusions from small segments alone, meaning without corroborating evidence.
  • Use small segments only in context of a combination of parental phasing, triangulation and match groups.
  • Just because you match a group of people, out of context, on a segment (small or otherwise) doesn’t mean that you share a common ancestor. The smaller the segment, the more likely it is to be either IBC or IBP. Situations where the DNA is exactly the same from both parents, meaning everyone has all As in that location, for example, are called runs of homozygosity and the smaller the segment, the more likely you are to encounter ROH segments which appear as phased matches.  Yes, another cruel joke of nature.

As a proof point relative to how deceptive small segment matching out of context can be, I ran my kit against my friend who is unquestionably 100% Jewish. I have no Jewish ancestry.  At 7cM/700 SNPs we have no matches, at 3cM/300SNPs we have 7 matching segments.

Me to Jewish match

However, matching this individual to my phased parents, none of these segments match both me and either one of my phased parent. Phased parent kits, at GEDMatch are kits reflecting the half of my parents DNA I received from that parent.  If you have one or both parents who have tested, you can create phased kits with instructions from this article.

Lowering the match threshold even further to 100 SNPs and 1cM, my Jewish friend and I match on a whopping 714 tiny matching segments, over 1100 cM total, but all very small pieces of DNA. Because of the absolute known 100% Jewish heritage of my friend, and my known non-Jewish heritage, these matches must be either IBC, identical by chance or perhaps some small segments of IBP, identical by population from a very long time ago when both of our ancestors lived in the Middle East, meaning thousands of years ago.  Bottom line, they are not genealogically relevant to either of us.  I repeated this same experiment with someone that is 100% Asian, with the same type of results.  You will match everyone at this threshold, including ancient DNA matches tens of thousands of years old.

The message here is that you can work from the “top down” with small segments, meaning in a known relationship situation like with my cousin and other relatives, but you cannot work from the bottom up with small segments as you have no way to differentiate the wheat from the chaff.

In the Crumley study, there are groups of small segments (greater than 3cM/300SNPs) that persist in multiple descendants of James Crumley, born in 1712.  In this case, because you can separate the wheat from the chaff with more than 50 participants, others who triangulate with those small segments and match the group of Crumley descendants may well share a common ancestor at some point in time, especially if they can phase with their parents on those segments to prove the match is not IBC.

  • Remember, your match on any segment to one person can be IBD, meaning you have identified the common ancestor, your match to another person on that same segment IBC, and yet to a third person, IBP where your match survives generational phasing, but you may never find the common ancestor due to the age of the segment or endogamy.
  • When utilizing small segments, I generally don’t drop the SNP threshold below 500, as the number of matches increases exponentially and the valid matches decrease proportionately as well. I’ll be publishing more on this shortly.
  • I do fully believe, within this set of cautionary criteria, that small segments can be useful. I also believe that small segments can be very easily misinterpreted. The use of matching segments has a lot to do with combining different pieces of evidence to build confidence in what the “match” is telling you. I wrote about the Autosomal DNA Matching Confidence Spectrum here.
  • Small segments should only be utilized after one has a good grasp of how genetic genealogy works and by utilizing the tools available to restrict those segments to genealogically descended DNA. In other words, small segments are for the advanced user. However, maintain those small segment groupings and triangulations in your spreadsheet, because when you have the level of experience needed to work with those small segments, they’ll be available for you to work with.  You may discover that most of your DNA triangulates by using large segments and you don’t need to utilize those small segments at all.
  • If you send me a list of matches from GedMatch with the cM set to 1 and the SNPs set to 100 and ask me what I think, I would simply to refer you to this article. But if I did reply, I would tell you that unless you have corroborating evidence, I think you’re wasting your time, but it’s your time and you’re welcome to do what you want with it. Life is about learning.
  • If you tell me you’ve drawn any conclusions from those types of matches (1cM and 100 SNPs), I’m going to be inconvincible without other tools such as genealogical proof,  parental phasing and triangulation groups that prove the segments to be valid to a specific ancestor for the people about whom you’re drawing conclusions. I might even suggest you look at the raw data in those segments to see if you’re dealing with runs of homozygosity.

Netting It Out

The net-net of this is that small segments can be useful, but it takes a lot more work because of the inherent questionable nature of small segment matches. This goes along with that old adage of “extraordinary claims require extraordinary evidence.”  Just be ready to roll up your shirt sleeves, because small segments are a lot more work!

Now having said all of that, I very much encourage continuing to triangulate your small segments and pay attention to them. You may notice patterns very relevant to your own genealogy, or you may learn that those patterns were somewhat deceptive – like IBD that turned into IBP.  Still useful and interesting, but perhaps not as originally intended.

Without continuing and ongoing research, we’ll never learn how to best utilize small segments nor develop the tools and techniques to sort the wheat from the chaff. Just be appropriately paranoid about conclusions based on small segments, especially small segments alone, and the smaller the segment, the more paranoid you should be!

There is a very big difference between working with small segments along with larger matching data and genealogy, which I encourage, and drawing conclusions based on small segment data alone and out of context, which I highly discourage.

Let’s hope that all of your matches come with large segments and matching ancestors in their trees!!!

Pickin’ Crab

You know, working with different cM levels and SNPs, especially as segments get smaller and more challenging, I’m reminded of “picking crab” at a good old North Carolina crab bake. You would never start out with a crab bake for breakfast.  You kind of have to work your way up to pickin’ crab – the same as small segments.  And you never pick crab alone. It’s a group activity, shared with friends and kin.  So is genetic genealogy.

You’ll need lessons, at first, in how to “pick crab” effectively. There’s a particular technique to it.  Friends teach friends.  You’ll find cousins you didn’t know you had, like Dawn in the brown shirt below, giving lessons to Anne.

Dawn lessons

A little practice and you’ll get it.

Just because it’s not easy doesn’t mean it’s not productive, especially when everyone works together!  And the results are “very good,” if you just have patience and work through the process.  If you decide that you “can’t pick crab,” then you’re right, you can’t pick crab, and you’ll just have to go hungry and miss out on all the fun!  Don’t let that happen.  Hint – sometimes the fun is in the pickin’!

Here’s hoping you can solve all of your brick walls with large cMs and large SNP counts, and if not, here’s hoping you enjoy “picking crab” with a group of friends and cousins and who will contribute to the ongoing research.

Pickin’ crab, or working on identifying difficult ancestors is always better when collaborating with others! Find cousins and fellow collaborators and enjoy!!! Genetic genealogy is not something you can do alone – it’s dependent on sharing.

crab pickin

Sometimes it’s as much about the friends and cousins you meet on the journey and the adventures along the way as it is about the answer at the end.

______________________________________________________________

Disclosure

I receive a small contribution when you click on some of the links to vendors in my articles. This does NOT increase the price you pay but helps me to keep the lights on and this informational blog free for everyone. Please click on the links in the articles or to the vendors below if you are purchasing products or DNA testing.

Thank you so much.

DNA Purchases and Free Transfers

Genealogy Services

Genealogy Research

Concepts – Identical by…Descent, State, Population and Chance

In genetic genealogy, what does it mean when someone says they are “identical by” something…and what are those various somethings?

In autosomal DNA, where your DNA on chromosomes 1-22 (and sometimes X) is compared to other people for matches of a size that indicates a genealogical relationship, you can actually match people in different ways, for different reasons.

But first, let’s make one thing perfectly clear. There is only one way to obtain your autosomal DNA – and that’s through your parents, 50% from each parent.  However, how much of their (and your) ancestor’s DNA you receive is not necessarily half of what they received from that ancestor.

If you receive ANY DNA from that ancestor, it MUST BE through your parents. There is no other way to inherit DNA.

Period.

No. Other. Way.

If you would like to read the Concepts article about inheritance and matching, click here. If you don’t understand autosomal DNA inheritance and matching concepts, you won’t be able to understand the rest of this article.

Identical by Descent (IBD)

When you match someone because you share DNA from a common ancestor, that is called Identical by Descent, or IBD. That’s what you want.  That’s a good thing, genealogically speaking.

Let’s take a look at how an IBD segment of DNA works. In the graphic below, the strand location is in the first column.  The next two pink columns are the two strands that your mother carries, one from her Mom and one from her Dad – and the values in each location from each parent.  Columns 4 and 5 are the two blue strands of DNA carried by your Dad, one from his Mom and one from his Dad.  The final two columns are what you inherited from both your mother and your father.  In this case, we made it easy and you simply inherited one of each of their strands entirely.  Yes, that does happen in some cases for a particular chromosome segment, but not all of the time.  Conceptually, for this example, it doesn’t matter.

Identical 1

Your Inheritance

In this example, you inherited strand 1 from your Mom, all As and strand 2 from Dad, all Gs. Your match, shown in the graphic below, matches you on all As, so also matches your mother.  This phenomenon is called parental phasing, which means we know it’s a legitimate match because the person matches both you and one of your parents.

For purposes of this conceptual discussion you must match on all 10 locations for this to be considered a matching segment. So in this case, your matching threshold is “10 locations.”

Identical 2

Your Match Matches You and Your Mother’s DNA – Identical by Descent

Now, understand that while I’ve shown “You” with your strands color coded so you can see who you received which pieces of DNA from – that’s not how your DNA really looks. There is no color coding in nature.  I’ve added color coding to make understanding these concepts easier.

This is how you and your parents DNA really look:

Identical 3

Notice that in your parents, their parent’s strands are mixed back and forth, so you really can’t tell which DNA came from whom.  It’s the same for you too.

What the matching software has to do is to look for a common letter between you and your match.

So, at location 1, you inherited an A and a G from your parents. Your match has an A and a T, so you and your match share a common A.  If you look at all of your matches locations, they share a common A with you on all of those locations.  It just so happens you received that A from your mother – but without your Mom to compare to – you have no way to know which parent that particular DNA value came from.  So, the best matching software can do is to tell you that indeed, you do match – on 10 locations in a row – so this is considered a match and will be reported as such on your match list.

Why you match is another matter altogether.

And, ahem….there is another way to match someone, aside from receiving ancestral DNA from your parents. I know, this is a bad joke isn’t it.  Yes, it is, but it’s real.

So, to summarize, there is no other way to obtain your DNA except 50% from one parent and 50% from the other.

However there are two ways to match someone:

  • Identical by Descent, IBD, meaning you match someone because you share the same DNA segment that you received from an ancestor through a parent, as shown above.
  • Identical by Chance, IBC, meaning that you match someone, but randomly – not by inheritance.  How the heck can that happen?

Let’s look at how that can happen.

Identical by Chance (IBC)

Because you receive a strand of DNA from each of your parents, but that DNA is all intermixed in you, you can possibly match someone else by virtue of the fact that they aren’t actually matching your ancestral DNA segment inherited from an ancestor, but by chance they are matching DNA that bounces back and forth between your parents’ DNA.

Identical 4

Your Match Matches Neither of your Parents’ Strands of DNA – Identical by Chance

In this example, you can see the that you inherited the same strands from your parents as in example 1 above, but your match is now matching you, not on your mother’s strand 1, all As, but on a combination of A from your mother and G from your father. Therefore, they don’t match either of your parents on this segment, because they are matching you by chance and not because you share a strand of DNA that you received from a common ancestor on this segment with your match.

This is easy to discern because while they match you, they won’t match either of your parents on that segment, because the match is not on an ancestral DNA segment, passed down from an ancestor. Using parental phasing, you compare your matches to your parents to see which “side” they fall on.  If they fall on neither parents’ side, then they are IBC or identical by chance.

Identical 5

Identical By Chance Identified Through Parental Phasing

In this example, you can see that you match all of these people. By using parental phasing, you can tell that you are identical by descent (IBD) to everyone except John, who matches neither of your parents, so your match to John is identical by chance (IBC).  We will talk more in an upcoming article about Parental Phasing.

If you don’t have your parents to compare to, and you match multiple people on the same segment, there should be 2 groups of people who all match each other on that segment – one group from your Mom’s side and one from your Dad’s side – even if you can’t identify your common ancestor. If there are people who don’t fit into either of those two groups, because they don’t match those group members, then the misfits are identical by chance.

Even if your parents are unavailable, this is a situation where testing other relatives helps, and the closer the better, because those relatives will also fall into those match groups and will help identify which group is from which side of your family, and which ancestral line.

In the example below, using the same people from the phased parent example above, we no longer have our parents to compare to, but we do have an aunt, Mom’s sister, and an uncle, Dad’s brother. By comparing those who match us to our close relatives – if everyone in the match group matches each other, then we know they are IBD and the come from Mom’s side of the family or Dad’s side of the family.

Identical 6

Identical By Chance Identified Through Close Family Match Groups

In general matching, meaning not on specific segments, just on your match list, if John and I match, but John doesn’t match mother’s sister, it could mean that John matches me on a different segment that my aunt didn’t inherit from my grandparents but that my mother did. So the match could be valid, even though he doesn’t match my aunt.

However, moving to the segment matching level, shown above, we can differentiate, at least for that segment.  This is yet another example of why segment analysis tools are so critically important.

If we only had one matching group, the green above, we would not be able to say that John was IBC on this segment, because John might be matching me on Dad’s side.

But in this case, we have proof points on both sides of this same segment, with two match groups, green from Mom and blue from Dad.  Mom’s side has a match group of 4+me (including her sister) who all match each other on this same segment, indicating that they all descend through my mother’s side of my tree.  On Dad’s side, we have his brother and two other people who match each other and me on those same segments.

Since John matches no one in either match group on either side, his match to me on this segment must be IBC.  You can read more about match groups and confidence here.

Identical by chance segments tend to be smaller segments, because the chances of matching more locations in a row by chance diminish as the number of locations increases.

Ok, so now you’ve got this – the two ways to match. Identical by descent (IBD) and identical by chance (IBC,) nature’s cruel joke.

So, what the heck are identical by state (IBS) and identical by population (IBP).

Good questions.

Identical by State (IBS)

Identical by state is really an archaic term now, but you’ll likely still run into it from time to time. Understand that genetic genealogy is still a really new field of discovery.  Initially, terms weren’t defined very well and have since evolved.  IBD was used to mean a match where you could find a common ancestral line.  IBS, or identical by state, was often used when one could not find the ancestral line.  What this implied was that the match was not genealogical in nature.  But that often wasn’t true.  Just because we can’t determine who the common ancestor is, doesn’t mean that common ancestor doesn’t exist.  After we have more matches, we may well figure out the common ancestor at a later time.

What are some reasons we might not be able to figure out who our common ancestor is?

  • There’s a NPE or undocumented adoption in one line or the other.
  • The pedigree chart of one or both people doesn’t go back far enough in time.
  • The pedigree chart of one or both people is incorrect.
  • Not enough people have tested to connect the dots between the DNA. For example, we may share a common surname, Dodson, but be unable to actually pinpoint which Dodson line/ancestor we share.
  • The match is identical by population (IBP) and not in a genealogical timeframe. We see this most often in highly endogamous populations.
  • The match is identical by chance (IBC) and there is no common ancestor.

The tendency in the past has been to assume that if you can’t find the ancestor, then the problem MUST be that the match is Identical by State. But the problem is that identical by state includes two categories that are mutually exclusive; Identical by Chance and Identical by Population.

Identical by chance means there is no common ancestor, as we illustrated above.

Identical by Population means there IS a common ancestor, and you did receive your DNA from that ancestor, but you may not be able to figure out who it was because it’s too far back in time and many people from that same population base share that DNA segment.

So, today, we don’t say IBS anymore, we say either IBD and if it’s not IBD then it’s either IBC or IBP, but not IBS. If someone says IBS, you need to ask and see if you can determine whether they mean, IBC or IBP, or if they are trying to say something else like “I can’t identify the common ancestor so it must be IBS.”

Identical by Population (IBP)

Identical by population means that a large portion of a population group shares a particular segment of DNA. Some people feel IBP segments are not useful and want all of these segments to be stripped away by population (or academic) based phasing software.

In some cases, if an individual is 100% Jewish, for example, they will have many IBP segments from within the highly endogamous Jewish population. They don’t have any other ancestral DNA segments from ancestors who aren’t Jewish to contrast against in their DNA, so their IBP segments are not useful to them, and are in fact, just in the opposite.  There are too many IBP segments and they are in the way – often referred to as “noise” because they are not genealogically useful, even though they are descended from an ancestor (IBD).  So, yes, IBP is a subset of IBD.

However, for someone who has the following genealogy, these same population based endogamous segments can be extremely useful and informative.

Identical 7

In this conceptual pedigree chart, the Jewish person married a non-Jewish person with deep colonial American ancestry. Their child “Colonial Jew” married someone who was mixed “Irish Asian.”  The person at the bottom, “me,” is not themselves endogamous but has several widely variant lines in their heritage including endogamous lines.

If I’m lucky enough to have an African population segment, that tells me very clearly which genealogical line that match is probably from. But if those IBP segments are removed, they can’t inform me in this situation.

Same with Jewish, or Asian, or Native American.

Let’s see how this might work in real matching.

Let’s say your mother’s A value is only found in African populations, and it’s found in very high proportions in African populations and much less frequently anyplace else in the world, except for where Africans settled.

Identical 8

Identical By Population Example Where Mother’s A Equals African

A few match outcomes are possible:

  1. You match with someone and you can discern a common ancestor or at least an ancestral line because you have only one African genealogical line – an ancestor in your mother’s line, like in the pedigree chart above.
  2. You match with someone and you cannot discern a common ancestor because many or all of your lines are African, similar to the Jewish example.
  3. You match with someone and you identify a common ancestor, but later a second genealogical line matches on that same segment because the segment is so common in the African population. This means you could have received that actual DNA segment from either ancestral line.
  4. Some DNA testing company runs academic or population based phasing software against your DNA and removes that segment entirely because they’ve decided that it occurs too frequently in a population to be useful. In this case, you won’t match that person at all.
  5. Some DNA testing company runs academic or population based phasing software against your DNA and removes that segment entirely because they’ve decided that particular segment in your results is “too matchy” so it must therefore be “invalid” and population based. This is often referred to as a “pile-up” and means that you have proportionally more matches on that segment than you do on other segments. If your “pile-up” segments are removed in this case, again, you won’t match at all. This is exactly what happened to my Acadian matches when Ancestry implemented their Timber phasing software, which removes pile-ups.

The graph below was provided to me at Ancestry DNA Day as an example of my own “pile-up” areas in my genome.

genome pileups

Ancestry with their Timber routine uses population phasing and removes your areas they deem “too matchy”? This helps Jewish and other heavily endogamous people by removing truly population based matches that are spurious and the contributing ancestor impossible to discern.  An endogamous individual could achieve much of the same effect by utilizing a higher matching threshold for their own matches, although that’s not an option at Ancestry.

However, for those of us who are not entirely endogamous, but who may have endogamous lines or lines from different parts of the world, population based phasing removes valuable informational segments and therefore, prevents valuable matches. When Ancestry ran Timber against my results, I lost all but one of my Acadian matches.  Yes, Acadians are heavily endogamous, but in my case, that line accounts for 1 of my 16 great-great-grandparents.  Believe me, if I had a tool to put all of my autosomal matches in one of 16 buckets, I would think it was a wonderful day!!!

16 gggrandparents

Because of endogamy, I actually carried MORE Acadian DNA that I would otherwise carry from a non-endogamous population – so yes, I am very matchy to my Acadian cousins, especially on smaller segments – or I was until Ancestry stripped all of that way.  Thankfully, I still have all of my matches at Family Tree DNA.

Why is endogamous DNA more matchy? Because endogamous populations only have the founders’ DNA and they just keep passing the same founder DNA around and around.

Ironically, another word for this kind of phasing is called “excess IBD” phasing. This means that “someone” decides unilaterally how much matching one “should” have and just chops the rest off at that threshold.  Clearly, that threshold for a fully Jewish person and me would be very different – and one size absolutely does NOT fit all.

I want to show you one more example of what population based phasing does. It chops the heart out of segments that would otherwise match.

People whose parents also test should match their parents on exactly 22 segments, one for each chromosome – because each child is a 100% match to their parents. If there is a read error or two (or three), then let’s say they could have as many as 25 matches, because some chromosomes are chopped in two because of a technical issue.  It occasionally happens.

At Ancestry, we’re seeing 80 to 120 matches for each parent/child pair, which means Timber is removing 58 to roughly 100 legitimate segments that you received from your parent.  One individual reported that they match one parent on 150 different segments, meaning that Ancestry removed 128 segments they decided are “too matchy” but are very clearly ancestral, or IBD, because all of your DNA must match your parents DNA on the strand they gave you.  However because of Timber’s removal of “too matchy” segments, the person no longer matches their parent on that removed segment – or on any of those 58 to 128 removed segments.  And remember, there is only one way to receive your DNA, so all of your DNA must match that of your parents.  You have no invalid matches to your parents DNA.  You can read more here.

Here’s a visual of what IBP phased matching does to you. Recall in our example that you need 10 contiguous matching locations to be considered a match.  I’m showing 20 locations in this example.

Identical 9

Normal Matching – No Population or Academic Phasing

In this first example, the DNA you inherited from your mother is a combination of T and A, where A=African. Notice that only part of what you inherited from your mother is the A this time.

In normal matching without IBP phasing, above, the matching threshold is still 10, but you match your match on a segment that totals 20 locations or units. Now it’s up to you to see if you can identify your common ancestor.

In the IBP phased example, below, your African DNA is removed as a result of population based phasing software. Your African DNA used to be where the red spot with no values is showing in the You 1 column.  Therefore, you still match on the Ts, but you only have a contiguous run of 7 Ts, then the 7 As phasing deleted, then 6 more matching Ts.  The problem is, of course, that instead of a nice matching segment of 20 units, above, you now have no match at all because you don’t have 10 matching locations in a row.  Of course, the same IBP phasing would apply to your mother, so your match would not match your mother either, which means that a valid parentally phased match is not reported.

Identical 10

Population Based Phased Matching Example Removing African

What’s worse, you’ll never have that opportunity to see if you can find your common ancestor, because you and your match will never be reported as a match. This is a lost opportunity.  In the first “normal matching” example, you may never BE able to find that common ancestor, but you have the opportunity to try.  In the second IBP phased matching example, you certainly won’t ever find your common ancestor because you’re not shown as a match.  When population based or academic phasing is involved, you’ll never know what you are missing.

This chopping phenomenon is not a rare occurrence with population based phasing. In fact, if you divide 100 removed segments by 22 chromosomes, there are approximately 4 artificial “chops” taken out of every one of your 22 chromosomes with each parent at Ancestry, and in some cases, more.  The person who now matches their parent on 150 segments has an average of 5.8 artifical phasing induced chops in each chromosome.  When Ancestry implemented Timber, many people lost between 80% and 90% of their total matches.  Mine went from 13,100 to 3,350, a loss of about 75%.  At least some of those were valid and we had identified common ancestral lines.

So, identical by population (IBP) doesn’t necessarily mean bad, unless you’re entirely endogamous. If you’re entirely endogamous, then IBP means challenging and can generally be overcome by looking at larger matching segments, which are less likely to be either IBP or IBC.

Identical by population can be very useful in someone not entirely endogamous in that it preserves ancestral DNA in a given population. In people who carry a combination of different endogamous lines, such as Jewish and Acadian, this phenomenon can actually be very useful, because it increases your chances of matching other individuals from that ancestral line – and being able to assign them appropriately.

Identical by What?

So, in summary, you are either identical because you received DNA from a common ancestor (IBD) or identical by chance (IBC) because nature is playing a mean joke on you and you match, literally, by chance because your match’s DNA is zigzagging back and forth between your parents’ DNA.  And by the way, you can match someone IBD on one segment and the same person IBC or IBP on others.

If you match someone but that person does not also match either of your parents, then it’s an IBC, identical by chance, match. Measuring a match against both yourself and your parents to determine if the match is IBC or IBD is called parental phasing.  We will have a Concepts article shortly about Parental Phasing, so stay tuned.

If you don’t have parents to match against, your matches on any segment should cleanly cluster into two matching groups where you match them and your matches also match each other on that same segment. One group for your mother’s side and one group for your father’s side.  Those who match you but don’t fall into one group or the other are identical by chance, like John in our example.  Of course, you won’t be able to sort these out until you have several matches on that segment.  This is also why testing all available upstream family members is so useful.

If you’re not IBC, you’re IBD meaning that you and your match received that DNA segment from a common ancestor, whether or not you can identify that ancestor.

Identical by population (IBP) is a type or subset of identical by descent (IBD) where many people from that same population group carry the same DNA segment. This is seen in its most pronounced fashion in heavily endogamous populations such as Ashkenazi Jews.

If you are from a highly endogamous population, you will have many IBP matches, generally on smaller segments that have been chopped up over time, and you will want to use a higher matching threshold, perhaps up to 10cM, for genealogical matching, or higher.

If you have endogamous lines in your tree, but are not entirely endogamous, IBP segments may actually be beneficial because you may be able to attribute matches to a specific line, even if not the specific ancestor in that line.

The smaller the segment, the more likely it is to be less useful to you, whether IBD or IBP – but that isn’t to say all small segments should be disregarded because they are assumed to be either IBC or not useful. That’s not the case.  Some are IBD and all IBD segments have the potential to be very useful.  Kitty Cooper just recently reported another wonderful success story using a 6cM triangulated segment.

If you’re highly endogamous, or only looking only for the low hanging fruit, which is more likely to be immediately rewarding, then work with only larger segment matches. They are less likely to be IBC or IBP and more likely to yield results more quickly.  I always begin with the largest matching segments, because not only are they easier to assign to an ancestor, but those matching people may also have smaller matching segments that I can tentatively (pending triangulation) attribute to that specific ancestor as well.

Here’s a handy-dandy cheat sheet if you’re having trouble remembering “Identical by What.”

Identical by Chart

Understand that working with genetic genealogy and autosomal DNA is much like panning for gold. You may get lucky and find a large nugget or two smiling at you from on top the pile, but the majority of your rewards will be as a result of hard work sifting and panning and accumulating those small golden flakes that aren’t immediately obvious and useful.  Cumulatively, they may well hold your family secrets and the keys to locks long ago frozen shut.

Here’s hoping all your matches are IBD!!!!!

______________________________________________________________

Disclosure

I receive a small contribution when you click on some of the links to vendors in my articles. This does NOT increase the price you pay but helps me to keep the lights on and this informational blog free for everyone. Please click on the links in the articles or to the vendors below if you are purchasing products or DNA testing.

Thank you so much.

DNA Purchases and Free Transfers

Genealogy Services

Genealogy Research

Autosomal DNA Matching Confidence Spectrum

Are you confused about DNA matches and what they mean…different kinds of matches…from different vendors and combined results between vendors.  Do you feel like lions and tigers and bears…oh my?  You’re not alone.

As the vendors add more tools, I’ve noticed recently that along with those tools has come a significant amount of confusion surrounding matches and what they mean.  Add to this issue confusion about the terminology being used within the industry to describe various kinds of matches.  Combined, we now have a verbiage or terminology issue and we have confusion regarding the actual matches and what they mean.  So, as people talk, what they mean, what they are trying to communicate and what they do say can be interpreted quite widely.  Is it any wonder so many people are confused?

I reached out within the community to others who I know are working with autosomal results on a daily basis and often engaged in pioneering research to see how they are categorizing these results and how they are referring to them.

I want to thank Jim Bartlett, Blaine Bettinger, Tim Janzen and David Pike (in surname alphabetical order) for their input and discussion about these topics.  I hope that this article goes a long way towards sorting through the various kinds of matches and what they can and do mean to genetic genealogists – and what they are being called.  To be clear, the article is mine and I have quoted them specifically when applicable.

But first, let’s talk about goals.

Goals

One thing that has become apparent over the past few months is that your goals may well affect how you interpret data.  For example, if you are an adoptee, you’re going to be looking first at your closest matches and your largest segments.  Distant matches and small segments are irrelevant at least until you work with the big pieces.  The theory of low hanging fruit, of course.

If your goal is to verify and generally validate your existing genealogy, you may be perfectly happy with Ancestry’s Circles.  Ancestry Circles aren’t proof, as many people think, but if you’re looking for low hanging fruit and “probably” versus “positively,” Ancestry Circles may be the answer for you.

If you didn’t stop reading after the last sentence, then I’m guessing that “probably” isn’t your style.

If your goal is to prove each ancestor and/or map their segments to your DNA, you’re not going to be at all happy with Ancestry’s lack of segment data – so your confidence and happiness level is going to be greatly different than someone who is just looking to find themselves in circles with other descendants of the same ancestor and go merrily on their way.

If you have already connected the dots on most of your ancestry for the past 4 or 5 generations, and you’re working primarily with colonial ancestors and those born before 1700, you may be profoundly interested in small segment data, while someone else decides to eliminate that same data on their spreadsheet to eliminate clutter.  One person’s clutter is another’s goldmine.

While, technically, the different types of tests and matches carry a different technical confidence level, your personal confidence ranking will be influenced by your own goals and by some secondary factors like how many other people match on a particular segment.

Let’s start by talking about the different kinds of matching.  I’ve been working with my Crumley line, so I’ll be utilizing examples from that project.

Individual Matching, Group Matching and Triangulation

There is a difference between individual matching, group matching and triangulation.  In fact, there is a whole spectrum of matching to be considered.

Individual Matching

Individual matching is when someone matches you.

confidence individual match

That’s great, but one match out of context generally isn’t worth much.  There’s that word, generally, because if there is one thing that is almost always true, it’s that there is an exception to every rule and that exception often has to do with context.  For example, if you’re looking for parents and siblings, then one match is all you need.

If this match happens to be to my first cousin, that alone confirms several things for me, assuming there is not a secondary relationship.  First, it confirms my relationship with my parent and my parent’s descent from their parents, since I couldn’t be matching my first cousin (at first cousin level) if all of the lines between me and the cousin weren’t intact.

confidence cousins

However, if the match is to someone I don’t know, and it’s not a close relative, like the 2nd to 4th cousins shown in the match above, then it’s meaningless without additional information.  Most of your matches will be more distant.  Let’s face it, you have a lot more distant cousins than close cousins.  Many ancestors, especially before about 1900, were indeed, prolific, at least by today’s standards.

So, at this point, your match list looks like this:

confidence match list

Bridget looks pretty lonely.  Let’s see what we can do about that.

Matching Additional People

The first question is “do you share a common ancestor with that individual?”  If yes, then that is a really big hint – but it’s not proof of anything – unless they are a close relative match like we discussed above.

Why isn’t a single match enough for proof?

You could be related to this person through more than one ancestral line – and that happens far more than I initially thought.  I did an analysis some time back and discovered that about 15% of the time, I can confirm a secondary genealogical line that is not related to the first line in my tree.  There were another 7% that were probable – meaning that I can’t identify a second common ancestor with certainty, but the surname and location is the same and a connection is likely.  Another 8% were from endogamous lines, like Acadians, so I’m sure there are multiple lines involved.  And of those matches (minus the Acadians), about 10% look to have 3 genealogical lines, not just two.  The message here – never assume.

When you find one match and identify one common genealogical line, you can’t assume that is how you are genetically related on the segment in question.

Ideally, at this point, you will find a third person who shares the common ancestor and their DNA matches, or triangulates, between you and your original match to prove the connection.  But, circumstances are not always ideal.

What is Triangualtion?

Triangulation on the continuum of confidence is the highest confidence level achievable, outside of close relative matching which is evident by itself without triangulation.

Triangulation is when you match two people who share a common ancestor and all three of you match each other on that same segment.  This means that segment descended to all three of you from that common ancestor.

This is what a match group would look like if Jerry matches both John and Bridget.

confidence example 1 match group

Example 1 – Match Group

The classic definition of triangulation is when three people, A, B and C all match each other on the same segment and share a known, identifiable common ancestor.  Above, we only have two.  We don’t know yet if John matches Bridget.

A matches B
A matches C
B matches C

This is what an exact triangulation group would look like between Jerry, John and Bridget.  Most triangulation matches aren’t exact, meaning the start and/or end segment might be different, but some are exact.

confidence example 2 triangulation group

Example 2 – Triangulation Group

It’s not always possible to prove all three.  Sometimes you can see that Jerry matches Bridget and Jerry matches John, but you have no access to John or Bridget’s kits to verify that they also match each other.  If you are at Family Tree DNA, you can run the ICW (in common with) tool to see if John and Bridget do match each other – but that tool does not confirm that they match on the same segment.

If the individuals involved have uploaded their kits to GedMatch, you have the ability to triangulate because you can see the kit numbers of your matches and you can then run them against each other to verify that they do indeed match each other as well.  Not everyone uploads their kits to GedMatch, so you may wind up with a hybrid combination of triangulated groups (like example 2, above) and matching groups (like example 1, above) on your own personal spreadsheet.

Matching groups (that are not triangulated) are referred to by different names within the community.  Tim Janzen refers to them as clusters of cousins, Blaine as pseudo triangulation and I have called them triangulation groups in the past if any three within the group are proven to be triangulated. Be careful when you’re discussing this, because matching groups are often misstated as triangulated groups.  You’ll want to clarify.

Creating a Match List

Sometimes triangulation options aren’t available to us.  For example, at Family Tree DNA, we can see who matches us, and we can see if they match each other utilizing the ICW tool, but we can’t see specifically where they match each other.  This is considered a match group.  This type of matching is also where a great deal of confusion is introduced because these people do match each other, but they are NOT (yet) triangulated.

What we know is that all of these people are on YOUR match list, but we don’t know that they are on each other’s match lists.  They could be matching you on different sides of your DNA or, if smaller segments, they might be IBC (identical by chance.)

You can run the ICW (in common with) tool at Family Tree DNA for every match you have.  The ICW tool is a good way to see who matches both people in question.  Hopefully, some of your matches will have uploaded trees and you can peruse for common ancestors.

The ICW tool is the little crossed arrows and it shows you who you and that person also match in common.

confidence match list ftdna

You can run the ICW tool in conjunction with the ancestral surname in question, showing only individuals who you have matches in common with who have the Crumley surname (for example) in their ancestral surname list.  This is a huge timesaver and narrows your scope of search immediately.  By clicking on the ICW tool for Ms. Bridget,  you see the list, below of those who match both the person whose account we are signed into and Ms. Bridget, below.

confidence icw ftdna

Another way to find common matches to any individual is to search by either the current surname or ancestral surnames.  The ancestral surname search checks the surnames entered by other participants and shows them in the results box.

In the example above, all of these individuals have Crumley listed in their surnames.  You can see that I’ve sorted by ancestral surname – as Crumley is in that search box.

Now, your match lists looks like this relative to the Crumley line.  Some people included trees and you can find your common ancestor on their tree, or through communications with them directly.  In other cases, no tree but the common surname appears in the surname match list.  You may want to note those results on your match list as well.

confidence match list 2

Of course, the next step is to compare these individuals in a matrix to see who matches who and the chromosome browser to see where they match you, which we’ll discuss momentarily.

Group Matching

The next type of matching is when you have a group of people who match each other, but not necessarily on the same segment of DNA.  These matching groups are very important, especially when you know there is a shared ancestor involved – but they don’t indicate that the people share the same segment, nor that all (or any) of their shared segments are from this particular ancestor.  Triangulation is the only thing that accomplishes proof positive.

This ICW matrix shows some of the Crumley participants who have tested and who matches whom.

confidence icw grid

You can display this grid by matching total cM or by known relationship (assuming the individuals have entered this information) or by predicted relationship range.  The total cMs shared is more important for me in evaluating how closely this person might be related to the other individual.

The Chromosome Browser

The chromosome browser at Family Tree DNA shows matches from the perspective of any one individual.  This means that the background display of the 22 Chromosomes (plus X) is the person all of the matches are comparing against. If you’re signed in to your account, then you are the black background chromosomes, and everyone is being compared against your DNA.  I’m only showing the first 6 chromosomes below.

confidence chromosome browser

You can see where up to 5 individuals match the person you’re comparing them to.  In this case, it looks like they may share a common segment on chromosome 2 among several descendants.  Of course, you’d need to check each of these individuals to insure that they match each other on this same segment to confirm that indeed, it did come from a common ancestor.  That’s triangulation.

When you see a grouping of matches of individuals known to descend from a common ancestor on the same chromosome, it’s very likely that you have a match group (cluster of cousins, pseudo triangulation group) and they will all match each other on that same segment if you have the opportunity to triangulate them, but it’s not absolute.

For example, below we have a reconstructed chromosome 8 of James Crumley, the common ancestor of a large group of people shown based on matches.  In other words, each colored segment represents a match between two people.  I have a lot more confidence in the matches shown with the arrows than the single or less frequent matches.

confidence chromosome 8 match group'

This pseudo triangulation is really very important, because it’s not just a match, and it’s not triangulation.  The more people you have that match you on this segment and that have the same ancestor, the more likely that this segment will triangulate.  This is also where much of the confusion is coming from, because matching groups of multiple descendants on the same segments almost always do triangulate so they have been being called triangulation groups, even when they have not all been triangulated to each other.  Very occasionally, you will find a group of several people with a common ancestor who triangulate to each other on this common segment, except one of a group doesn’t triangulate to one other, but otherwise, they all triangulate to others.

confidence triangulation issue

This situation has to be an error of some sort, because if all of these people match each other, including B, then B really must match D.  Our group discussed this, and Jim Bartlett pointed out that these problem matches are often near the vendor matching threshold (or your threshold if you’re using GedMatch) and if the threshold is lowered a bit, they continue to match.  They may also be a marginal match on the edge, so to speak or they may have a read error at a critical location in their kit.

What “in common with” matching does is to increase your confidence that these are indeed ancestral matches, a cousin cluster, but it’s not yet triangulation.

Ancestry Matches

Ancestry has added another level of matching into the mix.  The difference is, of course, that you can’t see any segment data at all, at Ancestry, so you don’t have anything other than the fact that you do match the other person and if you have a shakey leaf hint, you also share a common ancestor in your trees.

confidence ancestry matches

When three people match each other on any segment (meaning this does not infer a common segment match) and also share a common ancestor in a tree, they qualify to be a DNA Circle.  However, there is other criteria that is weighted and not every group of 3 individuals who match and share an ancestor becomes a DNA Circle.  However, many do and many Circles have significantly more than three individuals.

confidence Phoebe Crumley circle

This DNA Circle is for Phebe Crumley, one of my Crumley ancestors.  In this grouping, I match one close family group of 5 people, and one individual, Alyssa, all of whom share Phebe Crumley in their trees.  As luck would have it, the family group has also tested at Family Tree DNA and has downloaded their results to GedMatch, but as it stands here at Ancestry, with DNA Circle data only…the only thing I can do is to add them to my match list.

confidence match list 3

In case you’re wondering, the reason I only added three of the 5 family members of the Abija group to my match list is because two are children of one of the members and their Crumley DNA is represented through their parent.

While a small DNA Circle like Phebe Crumley’s can be incorrect, because the individuals can indeed be sharing the DNA of a different ancestor, a larger group gives you more confidence that the relationship to that group of people is actually through the common ancestor whose circle you are a member of.  In the example Circle shown below, I match 6 individuals out of a total of 21 individuals who are all interrelated and share Henry Bolton in their tree.

Confidence Henry Bolton circle

New Ancestor Discoveries

Ancestry introduced New Ancestor Discoveries (NADs) a few months ago.  This tool is, unfortunately, misnamed – and although this is a good concept for finding people whose DNA you share, but whose tree you don’t – it’s not mature yet.

The name causes people to misinterpret the “ancestors” given to them as genuinely theirs.  So far, I’ve had a total of 11 NADS and most have been easily proven false.

Here’s how NADs work.  Let’s say there is a DNA Circle, John Doe, of 3 people and you match two of them.  The assumption is that John Doe is also your ancestor because you share the DNA of his descendants.  This is a critically flawed assumption.  For example, in one case, my ancestors sister’s husband is shown as my “new ancestor discovery” because I share DNA with his descendants (through his wife, my ancestor’s sister.)  Like I said, not mature yet.

I have discussed this repeatedly, so let’s just suffice it to say for this discussion, that there is absolutely no confidence in NADs and they aren’t relevant.

Shared Matches

Ancestry recently added a Shared Matches function.

For each person that you match at Ancestry, that is a 4th cousin or closer and who has a high confidence match ranking, you can click on shared matches to see who you and they both match in common.

confidence ancestry shared matches

This does NOT mean you match these people through the same ancestor.  This does NOT mean you match them on the same segment.  I wrote about how I’ve used this tool, but without additional data, like segment data, you can’t do much more with this.

What I have done is to build a grid similar to the Family Tree DNA matrix where I’ve attempted to see who matches whom and if there is someone(s) within that group that I can identify as specifically descending from the same ancestor.  This is, unfortunately, extremely high maintenance for a very low return.  I might add someone to my match list if they matched a group (or circle) or people that match me, whose common ancestor I can clearly identify.

Shared Matches are the lowest item on the confidence chart – which is not to say they are useless.  They can provide hints that you can follow up on with more precise tools.

Let’s move to the highest confidence tool, triangulation groups.

Triangulation Groups

Of course, the next step, either at 23andMe, Family Tree DNA, through GedMatch, or some combination of each, is to compare the actual segments of the individuals involved.  This means, especially at Ancestry where you have no tools, that you need to develop a successful begging technique to convince your matches to download their data to GedMatch or Family Tree DNA, or both.  Most people don’t, but some will and that may be the someone you need.

You have three triangulation options:

  1. If you are working with the Family Inheritance Advanced at 23andMe, you can compare each of your matches with each other. I would still invite my matches to download to GedMatch so you can compare them with people who did not test at 23andMe.
  2. If you are working with a group of people at Family Tree DNA, you can ask them to run themselves against each other to see if they also match on the same segment that they both match you on. If you are a project administrator on a project where they are all members, you can do this cross-check matching yourself. You can also ask them to download their results to GedMatch.
  3. If your matches will download their results to GedMatch, you can run each individual against any other individual to confirm their common segment matches with you and with each other.

In reality, you will likely wind up with a mixture of matches on your match list and not everyone will upload to GedMatch.

Confirming that segments create a three way match when you share a common ancestor constitutes proof that you share that common ancestor and that particular DNA has been passed down from that ancestor to you.

confidence match list 4

I’ve built this confidence table relative to matches first found at Family Tree DNA, adding matches from Ancestry and following them to GedMatch.  Fortunately, the Abija group has tested at all 3 companies and also uploaded their results to GedMatch.  Some of my favorite cousins!

Spectrum of Confidence

Blaine Bettinger built this slide that sums up the tools and where they fall on the confidence range alone, without considerations of your goals and technical factors such as segment size.  Thanks Blaine for allowing me to share it here.

confidence level Blaine

These tools and techniques fall onto a spectrum of confidence, which I’ve tried to put into perspective, below.

confidence level highest to lowest

I really debated how to best show these.  Unfortunately, there is almost always some level of judgment involved. In some cases, like triangulation at the 3 vendors, the highest level is equivalent, but in other cases, like the medium range, it really is a spectrum from lowest to highest within that grouping.

Now, let’s take a look at our matches that we’ve added to our match list in confidence order.

confidence match list 5

As you would expect, those who triangulated with each other using some chromosome browser and share a common ancestor are the highest confidence matches – those 5 with a red Y.  These are followed by matches who match me and each other but not on the same segment (or at least we don’t know that), so they don’t triangulate, at least not yet.

I didn’t include any low confidence matches in this table, but of the lowest ones that are included, the shakey leaf matches at Ancestry that won’t answer inquiries and the matches at FTDNA who do share a common surname but didn’t download their information to be triangulated are the least confident of the group.  However, even those lower confidence matches on this chart are medium, meaning at Ancestry they are in a Circle and at FTDNA, they do match and share a common surname.  At Family Tree DNA, they may eventually fall into a triangulation group of other descendants who triangulate.

Caveats

As always, there are some gotchas.  As someone said in something I read recently, “autosomal DNA is messy.”

Endogamy

Endogamous populations are just a mess.  The problem is that literally, everyone is related to everyone, because the founder population DNA has just been passed around and around for generations with little or no new DNA being introduced.

Therefore, people who descend from endogamous populations often show to be much more closely related than they are in a genealogical timeframe.

Secondly, we have the issue pointed out by David Pike, and that is when you really don’t know where a particular segment came from, because the segment matches both the parents, or in some cases, multiple grandparents.  So, which grandparent did that actual segment that descended to the grandchild descend from?

For people who are from the same core population on both parent’s side, close matches are often your only “sure thing” and beyond that, hopefully you have your parents (at least one parent) available to match against, because that’s the only way of even beginning to sort into family groups.  This is known as phasing against your parents and while it’s a great tool for everyone to use – it’s essential to people who descend from endogamous groups. Endogamy makes genetic genealogy difficult.

In other cases, where you do have endogamy in your line, but only in one of your lines, endogamy can actually help you, because you will immediately know based on who those people match in addition to you (preferably on the same segment) which group they descend from.  I can’t tell you how many rows I have on my spreadsheet that are labeled with the word “Acadian,” “Brethren” and “Mennonite.”  I note the common ancestor we can find, but in reality, who knows which upstream ancestor in the endogamous population the DNA originated with.

Now, the bad news is that Ancestry runs a routine that removes DNA that they feel is too matchy in your results, and most of my Acadian matches disappeared when Ancestry implemented their form of population based phasing.

Identical by Population

There is sometimes a fine line between a match that’s from an ancestor one generation further back than you can go, and a match from generations ago via DNA found at a comparatively high percentage in a particular population.  You can’t tell the difference.  All you know is that you can’t assign that segment to an ancestor, and you may know it does phase against a parent, so it’s valid, meaning not IBC or identical by chance.

Yes, identical by population segment matching is a distinct problem with endogamy, but it can also be problematic with people from the same region of the world but not members of endogamous populations.  Endogamy is a term for the timeframe we’re familiar with.  We don’t know what happened before we know what happened.

From time to time, you’ll begin to see something “odd” happened where a group of segments that you already have triangulated to one ancestor will then begin to triangulate to a second ancestor.  I’m not talking about the normal two groups for every address – one from your Mom’s side and one from your Dad’s.  I’m talking, for example, when my Mom’s DNA in a particular area begins to triangulate to one ancestral group from Germany and one from France.  These clearly aren’t the same ancestors, and we know that one particular “spot” or segment range that I received from her DNA can only come from one ancestor.  But these segment matches look to be breaking that rule.

I created the example below to illustrate this phenomenon.  Notice that the top and bottom 3 all match nicely to me and to each other and share a common ancestor, although not the same common ancestor for the two groups.  However, the range significantly overlaps.  And then there is the match to Mary Ann in the middle whose common ancestor to me is unknown.

confidence IBP example

Generally, we see these on smaller segment groups, and this is indicative that you may be seeing an identical by population group.  Many people lump these IBP (identical by population) groups in with IBC, identical by chance, but they aren’t.  The difference is that the DNA in an IBP group truly is coming from your ancestors – it’s just that two distinct groups of ancestors have the same DNA because at some point, they shared a common ancestor.  This is the issue that “academic phasing” (as opposed to parental phasing) is trying to address.  This is what Ancestry calls “pileup areas” and attempts to weed out of your results.  It’s difficult to determine where the legitimate mathematical line is relative to genealogically useful matches versus ones that aren’t.  And as far as I’m concerned, knowing that my match is “European” or “Native” or “African” even if I can’t go any further is still useful.

Think about this, if every European has between 1 and 4% Neanderthal DNA from just a few Neanderthal individuals that lived more than 20,000 years ago in Europe – why wouldn’t we occasionally trip over some common DNA from long ago that found its way into two different family lines.

When I find these multiple groupings, which is actually relatively rare, I note them and just keep on matching and triangulating, although I don’t use these segments to draw any conclusions until a much larger triangulated segment match with an identified ancestor comes into play.  Confidence increases with larger segments.

This multiple grouping phenomenon is a hint of a story I don’t know – and may never know.  Just because I don’t quite know how to interpret it today doesn’t mean it isn’t valid.  In time, maybe its full story will be revealed.

ROH – Runs of Homozygosity

Autosomal DNA tests test someplace over 500,000 locations, depending on the vendor you select.  At each of those locations, you find a value of either T, A, C or G, representing a specific nucleotide.  Sometimes, you find runs of the same nucleotide, so you will find an entire group of all T, for example.  If either of your parents have all Ts in the same location, then you will match anyone with any combination of T and anything else.

confidence homozygosity example

In the example above, you can see that you inherited T from both your Mom and Dad.  Endogamy maybe?

Sally, although she will technically show as a match, doesn’t really “match” you.  It’s just a fluke that her DNA matches your DNA by hopping back and forth between her Mom’s and Dad’s DNA.  This is not a match my descent, but by chance, or IBC (identical by chance.)  There is no way for you to know this, except by also comparing your results to Sally’s parents – another example of parental phasing.  You won’t match Sally’s parents on this segment, so the segment is IBC.

Now let’s look at Joe.  Joe matches you legitimately, but you can’t tell by just looking at this whether Joe matches you on your Mom’s or Dad’s side.  Unfortunately, because no one’s DNA comes with a zipper or two sides of the street labeled Mom and Dad – the only way to determine how Joe matches you is to either phase against Joe’s parents or see who else Joe matches that you match, preferable on the same segment – in other words – create either a match or ICW group, or triangulation.

Segment Size

Everyone is in agreement about one thing.  Large segments are never IBC, identical by chance.  And I hate to use words like never, so today, interpret never to mean “not yet found.”  I’ve seen that large segment number be defined both 13cM and 15cM and “almost never” over 10cM.  There is currently discussion surrounding the X chromosome and false positives at about this threshold, but the jury is still out on this one.

Most medium segments hold true too.  Medium segment matches to multiple people with the same ancestors almost always hold true.  In fact, I don’t personally know of one that didn’t, but that isn’t to say it hasn’t happened.

By medium segments, most people say 7cM and above.  Some say 5cM and above with multiple matching individuals.

As the segment size decreases, the confidence level decreases too, but can be increased by either multiple matches on that segment from a common proven ancestor or, of course, triangulation.  Phasing against your parent also assures that the match is not IBD.  As you can see, there are tools and techniques to increase your confidence when dealing with small segments, and to eliminate IBC segments.

The issue of small segments, how and when they can be utilized is still unresolved.  Some people simply delete them.  I feel that is throwing the baby away with the bathwater and small segments that triangulate from a common ancestor and that don’t find themselves in the middle of a pileup region that is identical by population or that is known to be overly matchy (near the center of chromosome 6, for example) can be utilized.  In some cases, these segments are proven because that same small segment section is also proven against matches that are much larger in a few descendants.

Tim Janzen says that he is more inclined to look at the number of SNPs instead of the segment size, and his comfort number is 500 SNPs or above.

The flip side of this is, as David Pike mentioned, that the fewer locations you have in a row, the greater the chance that you can randomly match, or that you can have runs of heterozygosity.

No one in our discussion group felt that all small segments were useless, although the jury is still out in terms of consensus about what exactly defines a small segment and when they are legitimate and/or useful.  Everyone of us wants to work towards answers, because for those of us who are dealing with colonial ancestors and have already picked the available low hanging fruit, those tantalizing small segments may be all that is left of the ancestor we so desperately need to identify.

For example, I put together this chart detailing my matching DNA by generation. Interesting, I did a similar chart originally almost exactly three years ago and although it has seemed slow day by day, I made a lot of progress when a couple of brick walls fell, in particular, my Dutch wall thanks to Yvette Hoitink.

If you look at the green group of numbers, that is the amount of shared DNA to be expected at each level.  The number of shared cMs drops dramatically between the 5th and 6th generation from 13 cM which would be considered a reasonable matching level (according to the above discussion) at the 5th generation, and 3.32 cM at the 6th generation level, which is a small segment by anyone’s definition.

confidence segment size vs generation

The 6th generation was born roughly in 1760, and if you look to the white grouping to the right of the green group, you can see that my percentage of known ancestors is 84% in the 5th generation, 80% in the 6th generation, but drops quickly after that to 39, 22 and 3%, respectively.  So, the exact place where I need the most help is also the exact place where the expected amount of DNA drops from 13 to 3.32 cM.  This means, that if anyone ever wants to solve those genealogical puzzles in that timeframe utilizing genetic genealogy, we had better figure out how to utilize those small segments effectively – because it may well be all we have except for the occasional larger sticky segment that is passed intact from an ancestor many generations past.

From my perspective, it’s a crying shame that Ancestry gives us no segment data and it’s sad that 23andMe only gives us 5cM and above.  It’s a blessing that we can select our own threshold at GedMatch.  I’m extremely grateful that FTDNA shows us the small segment matches to 1cM and 500 SNPs if we also match on 20cM total and at least one segment over 7cM.  That’s a good compromise, because small segments are more likely to be legitimate if we have a legitimate match on a larger segment and a known ancestor.  We already discussed that the larger the matching segment, the more likely it is to be valid. I would like to see Family Tree DNA lower the matching threshold within projects.  Surname projects imply that a group of people will be expected to match, so I’d really like to be able to see those lower threshold matches.

I’m hopeful that Family Tree DNA will continue to provide small segment information to us.  People who don’t want to learn how to use or be bothered with small segments don’t have to.  Delete is perfectly legitimate option, but without the data, those of us who are interested in researching how to best utilize these segments, can’t.  And when we don’t have data to use, we all lose.  So, thank you Family Tree DNA.

Coming Full Circle

This discussion brings us full circle once again to goals.

Goals change over time.

My initial reason for testing, the first day an autosomal test could be ordered, was to see if my half-brother was my half-brother.  Obviously for that, I didn’t need matching to other people or triangulation.  The answer was either yes or no, we do match at the half-sibling level, or we don’t.

He wasn’t.  But by then, he was terminally ill, and I never told him.  It certainly explained why I wasn’t a transplant match for him.

My next goal, almost immediately, was to determine which if either my brother or I were the child of my father.  For that, we did need matching to other people, and preferably close cousins – the closer the better.  Autosomal DNA testing was new at that time, and I had to recruit cousins.  Bless those who took pity on me and tested, because I was truly desperate to know.

Suffice it to say that the wait was a roller coaster ride of emotion.

If I was not my father’s child, I had just done 30+ years of someone else’s genealogy – not a revelation I relished, at all.

I was my father’s child.  My brother wasn’t.  I was glad I never told him the first part, because I didn’t have to tell him this part either.

My goal at that point changed to more of a general interest nature as more cousins tested and we matched, verifying different lineages that has been unable to be verified by Y or mtDNA testing.

Then one day, something magical happened.

One of my Y lines, Marcus Younger, whose Y line is a result of a NPE, nonparental event, or said differently, an undocumented adoption, received amazing information.  The paternal Younger family line we believed Marcus descended from, he didn’t.  However, autosomal DNA confirmed that even though he is not the paternal child of that line, he is still autosomally related to that line, sharing a common ancestor – suggesting that he may have been born of a Younger female and given that surname, while carrying the Y DNA of his biological father, who remains unidentified.

Amazingly, the next day, a match popped up that matched me and another Younger relative.  This match descended not from the Younger line, but from Marcus Younger’s wife’s alleged surname family.  I suddenly realized that not only was autosomal DNA interesting for confirming your tree – it could also be used to break down long-standing brick walls.  That’s where I’ve been focused ever since.

That’s a very different goal from where I began, and my current goal utilizes the tools in a very different way than my earlier goals.  Confidence levels matter now, a great deal, where that first day, all I wanted was a yes or no.

Today, my goal, other than breaking down brick walls, is for genetic genealogy to become automated and much easier but without taking away our options or keeping us so “safe” that we have no tools (Ancestry).

The process that will allow us to refine genetic genealogy and group individuals and matches utilizing trees on our desktops will ultimately be the key to unraveling those distant connections.  The data is there, we just have to learn how to use it most effectively, and the key, other than software, is collaboration with many cousins.

Aside from science and technology, the other wonderful aspect of autosomal DNA testing is that is has the potential to unite and often, reunite families who didn’t even know they were families.  I’ve seen this over and over now and I still marvel at this miracle given to us by our ancestors – their DNA.

So, regardless of where you fall on the goals and matching confidence spectrum in terms of genetic genealogy, keep encouraging others to test and keep reaching out and sharing – because it takes a village to recreate an ancestor!  No one can do it alone, and the more people who test and share, the better all of our chances become to achieve whatever genetic genealogy goals we have.

______________________________________________________________

Disclosure

I receive a small contribution when you click on some of the links to vendors in my articles. This does NOT increase the price you pay but helps me to keep the lights on and this informational blog free for everyone. Please click on the links in the articles or to the vendors below if you are purchasing products or DNA testing.

Thank you so much.

DNA Purchases and Free Transfers

Genealogy Services

Genealogy Research

4 Generation Inheritance Study

I’ve recently had the opportunity to perform two, 4-generation, inheritance studies.

In both of these cases, we have the DNA of 4 generations: grandmother, parent, child and grandchild or grandchildren.  I’ll be using the second study because there are two great-grandchildren to compare.

Let me introduce you to the players.

4 gen pedigree

I wanted, with real data, to address some assertions and assumptions that I see being made periodically in the genetic genealogy community.  We need to know if these hold up to scrutiny, or not.  Besides that, it’s just fun to see what happens to DNA with 4 generations and 5 people to compare.

What kinds of information are we looking to confirm or refute in this study?

1 – That small segments don’t occur within a couple generations, meaning that that DNA can’t be or isn’t broken into small segments that quickly.

2 – That small segments can never be used genealogically and are not useful.

3 – That DNA is most of the time passed in 50% packages.  While this is true in the first generation, meaning a child does receive half of each parent’s DNA, they do not receive 25% of each grandparent’s DNA.

4 – That segments over a certain threshold, like 5 or 7 cM, are all reliable as IBD (identical by descent.)

5 – That segments under a certain threshold, like 5 or 7 cM are all unreliable and should never be used, in fact, cannot ever be used and should be discarded.

6 – That there is a rule that you cannot have more than two crossovers per chromosome.

All individuals tested at Family Tree DNA and we’ll be using the FTDNA chromosome browser for comparisons.

First, let’s look at the amount of expected DNA matching versus the actual amount of DNA matching, per generation.  The entire number of cM being measured is 6766.2, per the ISOGG Autosomal Statistics Wiki page.

Expected vs Actual Inheritance Chart

This chart compares the expected versus actual amount of DNA shared between person 1 and person 2,

Person 1 Person 2 Expected DNA Match cM/% Actual DNA Match
Grandmother Parent (grandmother’s child) 3383.1 / 50% 3384.03 / 50.01%
Grandmother Pink Child (grandmother’s grandchild) 1691.5 / 25% 1670.64 / 24.69%
Grandmother Blue Grandchild (grandmother’s great-grandchild) 845.775 / 12.5% 704.84 / 10.39%
Grandmother Green Grandchild (grandmother’s great-grandchild) 845.775 / 12.5% 842.64 / 12.45%

Chromosome Data

Now, let’s take a look at our chromosome data.  Keep in mind, everyone is being compared to the oldest generation – in this case – the great-grandmother’s DNA.

Legend

  • The background chromosome belongs to the great-grandmother of the youngest generation – meaning everyone is being compared to her.
  • Grandparent = orange – because the child receives 50% of each parent’s DNA, the orange child of the great-grandmother will match her DNA 100%.
  • Grandchild = pink – since the grandchild is being compared to the grandparent, and not their parent, we will see how much of the grandmother’s DNA the pink child received. The dark spaces are the “ghost image” of the grandfather’s DNA – identified by the lack of the grandmother’s DNA in that location.
  • Oldest great grandchild = blue
  • Youngest great grandchild = green

The two great grandchildren are full siblings.  None of the parents involved are related to each other or to other generational spouses.  This has been confirmed both by genealogy pedigree chart and by utilizing the tools at GedMatch for comparisons to each other as well as the “are your parents related” tool.

The first comparison, below, shows the 4 individuals compared to the great grandmother’s DNA at the Family Tree DNA with the match default set at 5cM

4 gen ftdna default

The image below, shows the same individuals after dropping the match criteria to 1cM.  Several small colored segments appear.

4 gen ftdna 1 cm

I downloaded all of the matching data for these individuals into a spreadsheet so that I could work with the actual chromosomal data.  I’m not boring you with that here, but I have used the raw matching data for the actual comparisons.

Crossover

Let’s talk about what a crossover is, because understanding crossovers are important

Crossover example 1 – A crossover is where you start/stop receiving DNA from one grandparent or the other.  This is easy to see if we look at chromosome 1.

4 gen crossover

In this example, the parent is orange and the child is pink but they are both being compared to the grandparent of the pink person, the mother of the orange person.

What this means is that while the orange person will always match the grey background chromosome of their mother, the pink person will only match their grandmother on the portion of the DNA they received from their mother that was from their grandmother.  The pink person received their grandfather’s DNA in some locations, and not their grandmother’s.  Where that transition happens is called a crossover and it is where the colored segment stops, as noted by the arrows above, and the back background begins, indicating no match to the grandmother.

You can see that the matches span the center of the chromosome where the grey area indicates there is no data being read.  There is also a second small grey area to the right of the center.  Ignore these grey areas.  They are in essence DNA deserts where there isn’t enough DNA to be read or useful.  Family Tree DNA (and other vendors) stitch the data on both sides together, so to speak, and matches on both sides of this area are considered to be contiguous matches.

You can see that the pink person has two crossover areas where they stopped receiving DNA from the mother’s mother (background chromosome being compared against) and instead started receiving DNA from the mother’s father.  How do we know that?  There only two people who contributed the orange parent’s DNA that the pink child inherited.  If the pink child did not inherit the orange parent’s Mom’s DNA on this segment, then the pink child had to have inherited the orange parent’s Dad’s DNA.

Crossover example 2 – A second kind of crossover is where you are still receiving DNA from the same parent, but from different ancestors on that parental line

I’ve created a chart to illustrate this phenomenon

The names in the charts at the bottom are the people who tested today.  All of these individuals are known cousins who are from my mother’s side.  The name at the top is the common ancestor of all of the testers.

In the first situation, in locations 1-5, Me, Charlie and David match.  None of the three of us match our cousin, Mary on those locations.  However, moving to locations 6-10, Me, Charlie and Mary match each other, but not David.  Looking at our pedigree charts, we can see that the cousins are matching on different ancestral lines.

4 gen generational crossover

Me, Charlie and David share a wife’s line, Sally (wife of John), that Mary does not share.  Me, Charlie and Mary share common DNA from George, a male further upstream in that line.  George’s son John married Sally.  Mary descends from George through a different child, which is why she does not match any of us on the segments we received from Sally, John’s wife.

Location Me Charlie David Mary
1 Sally Sally Sally No match
2 Sally Sally Sally No match
3 Sally Sally Sally No match
4 Sally Sally Sally No match
5 Sally Sally Sally No match
6 George George No match George
7 George George No match George
8 George George No match George
9 George George No match George
10 George George No match George

If you’re just looking at the question, “do Charlie and I match?” the answer would of course be yes, but until we look at a broader spectrum of cousins, we won’t know that our match is actually from two different people in the same descendancy line and that we have an ancestor crossover between locations 5 and 6.  However, we’re still receiving our DNA from the same parent, but which ancestor of that parent contributed the DNA has switched

How prevalent are crossovers?

Number of Crossover Events

These are all parent/child crossovers where the DNA donor switched.  We can only determine that this happened because we can compare generationally against the grey background great grandmother to the youngest generation

  • Orange parent to Pink child – 49
  • Pink child to Blue child – 47
  • Pink child to Green child – 39

The most segmented chromosome, chromosome 1, has 5 separate matching segments for the blue great grandchild (as compared to the great-grandmother), or 10 crossover events (because neither end was at the beginning or end, although start and end numbers are sometimes “fuzzy”).  You can see where a crossover event occurs when the DNA goes from matching to non-matching.

4 gen chr 1 crossovers

Results

I downloaded all of our matching data into a spreadsheet so that I can work with the segment matches individually.

Looking at the data, there are a few things that jump out immediately:

  • On chromosomes 4 and 14, the pink child received none of the orange grandmother’s DNA. That means that the pink child had to have received the grandfather’s DNA for all of chromosome 15. So, if anyone thinks that the 50% rule really works uniformly across generations – here’s concrete proof that it doesn’t. Furthermore, this occurred for an entire chromosome – twice out of 23 chromosomes, or 8.7% of the time.
  • On chromosome 11, the exact opposite happened. The pink child received all of the grandmother’s chromosome, but barely gave any to their blue child. The blue child received their mother’s DNA in that location. On chromosome 13, the pink child received almost all of the grandmother’s DNA.
  • Please note that while the averages of expected versus inherited DNA work out pretty closely, when averaging across all 23 chromosomes, as shown in the Expected vs Actual Inheritance Chart, the individual chromosomes and how much of which grandparent’s or great-grandparent’s DNA is inherited varies wildly from none to 100%.
  • There are several locations on 10 different chromosomes where the DNA has been passed generationally intact 2 or 3 times, without division.
  • Several small segments have been created within 3 transmission events.There are small green and blue segments on several different chromosomes which reflect very small amounts of the great grandmother’s DNA inherited by the green and blue great-grandchildren. This conclusively dismisses the theory that small segments aren’t ever created within a couple of generations.
  • Chromosome 10 is very choppy, including small blue and green grandchild segments that match the orange grandparent and the great-grandmother without having matches to the pink child. This means that those unconnected blue and green small segments are either identical by chance or there is a read issue with the pink person’s DNA on this chromosome.
  • There are a total of 31 small segments, meaning under 7cM. Of those, a total of 10 do not triangulate, meaning they match the grandmother but they do not match their parent.  The 7 pink segments appear to triangulate, but without another generation of transmission (like the blue and green great-grandchildren), or without the grandfather’s DNA, or without triangulation with a known relative on that segment, it’s impossible to tell for sure. Therefore, 14, or 45% are valid segments and do triangulate.
  • There are a total of 92 chromosomal transmission events that took place, meaning that 23 chromosomes got passed from the background person to their orange child, 23 from the orange child to their pink child, 23 from the pink child to the blue grandchild and 23 from the pink child to the green grandchild.
  • Furthermore, based on this limited study, at least 32.26% of the small segments do not triangulate and are not IBD, but are instead identical by chance.
  • In three instances, the exact DNA (from the great grandmother) was given to both the green and blue great grandchildren. In eight other events, the same DNA, without division, was given from a parent to one child.
  • There are several instances, on chromosomes 3, 4, 9, 14, 15, 16, 20, and 22 where the pink child passed none of their grandmother’s DNA to their child, even though they inherited the grandmother’s DNA.

Individual Chromosomes and Their Messages

I’d like to walk through several chromosomes and chat a little bit about what we’re seeing.

Chromosome 1

4 gen chr 1

First, I’d like to illustrate the difference between chromosome matches at the default level (the first chromosome, above) and at the 1cM level (the lower chromosome.)  At the lower match threshold, you will see additional small segment matches that are not shown at the higher threshold, noted by red arrows.

Let’s take a look at the messages held by our individual chromosomes.

On all of these chromosomes, you’ll see that the orange child matches thier mother, the background person being compared against, exactly, on every location that is measured.  Half of everyone’s DNA comes from their mother, so all of their DNA will match to her on any given chromosome.  Remember, we are only measuring matching DNA (half identical segments) – so the other half of the person’s DNA that matches their father is not shown.

I have left the orange segments in the graphics, even though they all match on the entire chromosome length, so you can see the continuity from generation to generation.  Pink is the orange person’s child, so you can see that the pink child inherited part of the DNA the orange person inherited from their mother, but not all.  The part that is black in the pink row, as compared to the orange segment, means that the pink child inherited that DNA from their grandfather at those locations – and not the grandmother being compared against

In one instance, on chromosome 1, the pink child gave their grandmother’s DNA to both of their children.  You can see that to the far left with the red arrow.

4 gen chr 1 grandmother transmission

You can also see that the blue grandchild only received a small part of their great grandmother’s DNA, but the green grandchild received a much larger segment.

In one area, the pink child clearly received their grandmother’s DNA, but didn’t give any of it to either the blue or green grandchild, shown below at the red arrow.  There is no blue or green matching the great-grandmother’s DNA.

4 gen chr 1 no transmission

To the right of the arrow, top, above, you can see where the pink child contributed their grandmother’s DNA to their blue child, but not to the green child.  The pink child contributed their other parent’s DNA in that instance, bottom, above, because their child does not match their orange mother – so that DNA had to come from the grandfather.

On the chromosome match that includes the smaller segments, below, you can see there are a total of 5 segments not shown with the higher threshold.

4 gen chr 1 small segments

The first two arrows, on the left, point to small segments shared by the blue and green grandchildren with their great-grandmother and their pink parent – so these triangulate and they are fine.

The third arrow, on the right hand side pointing to the green segment that does not match with the pink parent indicates a match that is identical by chance.  We’ll talk more about this in chromosome 3.

The fourth arrow, at the far right, shows a small segment of orange DNA that was passed to their pink child, but the pink child did not pass it on to either of their children.  This segment could be a legitimate segment by descent, but it could also be by chance.  We’ll talk about that more on chromosome 8.

Chromosome 2

4 gen chr 2

Chromosome 2 shows two small segments.  You can see that the pink child gave a significant portion of their grandmother’s DNA to the blue child, but only two small segments to the green child in that region, at the red arrows.  They do triangulate though, because they match their parents.  See how nicely the DNA stacks up between all of the generations.

Chromosome 3

4 gen chr 3

The pink child inherited very little of the grandmother’s DNA in this region.  Of the small amount the pink child did inherit, the pink child gave even less of it to their children.  One small piece to the green grandchild, shown at right, and none to the blue grandchild.

Why, then, is there a lonely blue segment on this comparison chromosome showing that the blue great-grandchild matches their orange grandmother and their great-grandmother, but not their pink parent?  This is the first example of an identical by chance segment (or a read error in the pink parent’s file).

4 gen chr 3 small seg

Three Kinds of DNA Match Segments

There are three kinds of DNA segment matches.

  1. Identical by descent (IBD) where you receive the segment from your ancestors and we can track it as far back up the tree as we have living people. This is the example where the small segment of the great-grandchildren (blue or green) match their parent (pink), their grandparent (orange) and their great-grandmother’s background chromosome being compared against.
  2. Identical by state (IBS) which sometimes is used to mean not identical by descent. What it actually means is that you can still match and receive the DNA from your ancestors, but the segment may be very prevalent in a specific community or ethnic group. An alternative explanation is that the DNA ‘state’ is so common that everyone in that area has it, so it’s virtually useless in identifying ancestors, because you can’t really tell which lines it came from. So IBS does triangulate, because it did come from a common ancestor, but you may match a large number of people at this location. Portions of chromosome 6 are known to fall into this category.  More often than not, I hear IBS used to indicate that there is a match, but the common ancestor isn’t known or hasn’t yet been identified.
  3. Identical by chance (IBC) is where a specific DNA combination is a match, but it’s not a match because it was handed down ancestrally, but simply by the luck of the draw.  Because everyone carries the DNA of both parents, sometimes people can match you by zigzagging back and forth between your father’s and mother’s DNA.  These matches aren’t ancestral, but just by luck or chance.  Shorter matches, meaning small segments, are much more likely to be identical by chance than longer matches. When you have both parents DNA, you can easily eliminate IBC segments because they won’t triangulate – as we have just demonstrated on chromosome 3.

You can read more about this here and here.

Chromosome 4

4 gen chr 4

Chromosome 4 is particularly interesting because the orange person matches their background mother, of course, but apparently their pink child inherited this entire chromosome from the pink person’s grandfather – because the pink person does not match their grandmother – there are no pink matching segments to the background grandmother.

Chromosome 5

On chromosome 5, the pink child matches the grandmother on almost the entire chromosome, except for a small part to the left of center.

4 gen chr 5

You may notice that there is a segment of blue that appears to extend beyond the pink bar at the left arrow – which would mean that the blue area matches the great-grandmother without matching the pink parent.  The segments on the chromosome map are not exactly to scale, and the beginnings and ends are sometimes what is referred to as fuzzy.  This means that they are not exact measurements but that they in essence the absence or presence of DNA in a bucket of a specific size.  If any part of your DNA is in that bucket, then your start or stop segment are the edges of that bucket.  In this case, the entire match is 47.51cM for the pink child and 49.82 for the blue grandchild, so the difference may or may not be relevant.

Although this actually is a small matching segment, or non-matching segment, you would never notice this if you were just looking at the blue grandchild matching to the great grandmother.  It’s only with the introduction of the parent’s pink DNA that you notice that the blue great grandchild’s DNA match with the great grandmother extends beyond that of the parent.

Chromosome 6

4 gen chr 6

Chromosome 6 is rather unremarkable except that the orange person seems to have had a read or file error of some sort.  The orange results are shown in two separate pieces, but we know that the orange person must match their mother 100%.  We know this issue is in the orange person’s file, because their pink child and both of the blue and green grandchildren match the background person, the orange persons’ mother, with no break in their DNA.

Chromosome 7

4 gen chr 7

Chromosome 7 shows another example of 5 generations matching with the stacking of orange, blue, green and pink against the background person’s chromosome, at right.  It also shows another example an identical by chance match, with the blue grandchild showing a match to their great-grandmother but no match to their pink parents, near the center at the red arrow.

Chromosome 8

4 gen chr 8

Chromosome 8 shows another example of the pink child having inherited a small segment of their grandmother’s DNA, but not passing it on to their children.

How do we know if this is a legitimate IBD segment, or if it something else?  Since the pink child will match their mother 100%, and they didn’t pass it on tho their children, how can we prove that the small pink segment where they match their grandmother is  IBD.

How could we prove this one way or the other?

First of all, it probably doesn’t matter, except as a matter of interest – or unless of course this one segment is THE one you need to identify that colonial ancestor.  If this was a normal match, we could just see if the match matched the child and the parent too, which would immediately phase the match against their parent – but we can’t do that when matching to a grandparent because the child will always match their parent 100%.

If you have the grandfather’s DNA at Family Tree DNA, you could compare the pink grandchild to their grandfather. On chromosome 8, the grandfather’s DNA in the pink row is identified by the dark grey – because it’s where the pink grandchild does not match their grandmother – so they must match their grandfather on that segment because their orange parent only had two pieces of DNA to give them, the piece from their mother or the piece from their father.

Therefore, if this is a valid segment, then you won’t see at match in the grandfather’s DNA on same portion of the segment.  If you see a match to both the grandmother and the grandfather, it’s likely that the small segment match to the grandmother is not identical by descent –  you but really don’t know for sure.

How could that be?  I asked David Pike that question and he pointed out that in one case, he discovered that the grandparents both shared the same DNA segment.  The child inherited it from one parent or the other, and passed it on to their child, but since the mother’s and father’s DNA was identical, there is no way to tell which grandparent the segment actually came from.  And in this case, the segment would match both grandparents.  That is a trait of endogamy and of IBS, or identical by population.  If you’re saying, BOO, HISS, about now, I totally understand.

After talking to David, I also realized that if your DNA at those locations just happens to be all homozygous, for example, all Ts, on both sides, for a run of SNPs in a row, and if your parents and grandparents have Ts in either location, you will match them…and anyone else who does too.

So here we have an example of a match that could be IBD if it truly is a small segment by descent and you don’t match the other grandparent at that location.  It could be IBC or IBS (by population) if you match both of your grandparents on this segment – but it might be IBD.  It’s IBD from one and IBC/IBS from the other – but which one is which?

However, since I don’t have the grandfather’s DNA at Family Tree DNA, my only other alternative is to move to GedMatch and create a phased kit for the grandfather by subtracting the grandmother’s DNA from her orange child, which will give me the DNA the orange child received from their father.  Then I can compare the pink grandchild to the grandfather’s phased kit – which is the father’s DNA that the orange child received.  This is fine, even if it is only half of the grandfather’s DNA – it s the half that the pink child’s mother received and passed a portion to the pink child.

I would suggest doing this entire exercise on either Family Tree DNA or on the GedMatch platform, and not jumping back and forth between the two.  The start and stop segments aren’t exactly the same, and sometimes the segments read differently, creating more segments at GedMatch than at FTDNA.  I’m not saying that is wrong, just that it isn’t consistent between the two platforms and when you are dealing with small segments, in particular, you need consistency.

Chromosome 9

4 gen chr 9

On chromosome 9, the pink child received little of the grandmother’s DNA, and gave none of it to their green child.  And yes, if you have a good eye the blue child’s right boundary is slightly beyond the their pink parents – so – you already know what that means.  Either a fuzzy boundary or a slight piece of DNA that happened to match with the great-grandmother identical by chance (IBC.)

Chromosome 10

4 gen chr 10

This chromosome is incredibly interesting because it’s comprised of all small segments.  In fact, this is the exact reason why you NEED to look at the 1cM range.  At the default setting, if there are no matches except the orange person to their mother.  It looks like none of the grandmother’s DNA was passed to the pink child, but in fact, may not be the case.  There are three segments passed to the pink child, although the pink child did not pass these on to either of their children.  See the discussion on segment 8 about how to tell for sure, if you need to.

The blue and green segments, since they do not match their pink parent are not IBD but are instead IBC.  The really interesting part of this is that in one case, the blue and green grandchildren’s DNA matches the orange grandmother on the same segments exactly, but does not match the pink parent.

How can this possible be, you ask, barring a file read issue?  Good question.  Remember, each child inherits half of their parent’s DNA.  In this case, both children apparently inherited the same DNA from both parents, but it wasn’t the orange DNA, but that of the pink child’s father.

It just happened, when the blue and green children’s DNA combined with that of their mother, it just happens to read as a match, for a small segment.  You can read about how this might happen in the article, “How Phasing Works and Determining IBD Versus IBS Matches.”

Unfortunately, all these comparisons can do is to tell us simply what does and does not match – they can’t tell us why.  Sometimes, based on other comparisons, like phasing and triangulation, we can figure out the “why” part of the puzzle – and sometimes, we can’t.

Chromosome 11

4 gen chr 11

On chromosome 11, the pink child inherited all of the grandmother’s DNA through their orange parent, but gave less than half to their green child and a small segment to the blue child.  The pink child gave the exact same segment in the center to both their blue and green children.

Chromosome 12

4 gen chr 12

On chromosome 12, the pink child inherited little of their grandmother’s DNA, but passed every bit of what they inherited to both of their children, shown by the nice stack at right.  The start and stop locations are exact between the three.

However, in addition, we have three small segments where the green and blue grandchildren match their orange grandmother without matching their pink parent – so those are IBC.

Chromosome 13

4 gen chr 13

The pink child inherited almost all of their grandmother’s entire chromosome, except for a very small bit at the far right end.  The pink child passed almost their entire chromosome 13 to their green child, but only a small amount to the blue child.

Chromosome 14

4 gen chr 14

This story is easy.  The pink child inherited their grandfather’s entire chromosome 14 because they do not match their grandmother’s DNA at all.

Chromosome 15

4 gen chr 15

This is a very “normal” chromosome.  The pink child inherited about half of their grandmother’s DNA and gave about half of what they inherited to their green child.  Of course, their blue child got left out altogether – but that looks to be a lot more “normal” than we once thought.

I am skipping chromosome 16-22, because they are more of what you’ve already seen and is, by now, quite familiar  Plus, you can take a look at the full chromosome comparison graphic and do your own analysis.

X Chromosome

The X chromosome is a bit different, and I’d like to take a look at that.

4 gen X

The X chromosome has special inheritance properties that other chromosomes don’t have.  In particular, women inherit an X just like they inherit their other chromosomes from 1-22 – one from Mom and one from Dad.  Men, however, only receive an X from their mother.  Therefore, there are relatives that you cannot inherit any X DNA from.  I wrote about this here and here along with examples and charts.

In this example, the inheritance path is such that it does not affect what can and cannot be inherited since we are comparing to a great-grandmother, but in other situations,  this would not be the case.

One last observation about the X chromosome.  I have found matching on the X to be particularly unreliable, and have found several situations, where, due to those special inheritance properties, we know beyond any doubt that the common ancestor on the X cannot be the same ancestor as has triangulated on the other chromosomes.  So word to the wise – be very vigilant and hesitant to draw conclusions from X matching.  I never utilize the X without corroborating autosomal matches and even then, I’m very reticent.

In Summary

On the average, we do inherit about half of our DNA from in each generation from each ancestral generation.  But the average and the actuality of what happens is two entirely different things.  Averages are made up of all of the outliers, and if you are one of those outliers, the average isn’t really relevant to you.  Kind of reminds me of “one size fits all” which really means “one size fits almost nobody well” and “everyone is some shade of unhappy.”

I wrote about generational inheritance and how it doesn’t always work the way we think, or expect.  It’s very important to pay close attention to your own DNA and not rely on averages unless you have absolutely no other choice – and only then understanding the averages are likely wrong in one direction or the other – but it’s the best we’ve got, under the circumstances.

So what can we apply to our genealogy from this little experiment.

  1. Some of the small segments across 4 generations are valid, meaning identical by descent or IBD.
  2. At least one third of the small segments aren’t valid and are identical by chance, or IBC.
  3. Without some form of triangulation or parental phasing, it’s impossible to tell which small segments are and are not valid, or identical by descent.
  4. Small segments are indeed formed within a 2 or 3 generation span, so they are not always a results of many generations of dividing.
  5. However, the further back in time your ancestor, the more likely that they will only be represented in your DNA by small segments, if any.
  6. Many small segments are valid and are not a result of IBC.  However, most are not and one needs to understand how to recognize signs of an IBC vs an IBD match.
  7. Disregarding small segments uniformly is like throwing away the only clues you may have to your most distant ancestors – which are likely your brick walls.
  8. The largest segment that was not valid was 3.14cM and 600 SNPs.
  9. The smallest valid segment was 1.25cM and 500 SNPs.

Getting the Most Out of Your DNA Experience

There is a lot more information available to us in our DNA results than is first apparent.  It takes a bit of digging and you need to understand how autosomal DNA works in order to ferret out those secrets.  Don’t discount or ignore evidence because it’s more difficult to use – meaning small segments.  The very piece or breadcrumb you need to solve a long-standing mystery may indeed be right there waiting for you.  Learn how to use your DNA information effectively and accurately – including those small segments.

You need to test every cousin you can find and convince to swab or spit.  It’s those cousin matches that help immensely with triangulation and confirming the validity of all DNA segments, matching them back to common ancestors.  You are building walkways or maybe pathways back in time, with your DNA as the steppingstones.  Genetic genealogy is not a one person endeavor.  It takes a village, hopefully of cousins willing to DNA test!

______________________________________________________________

Disclosure

I receive a small contribution when you click on some of the links to vendors in my articles. This does NOT increase the price you pay but helps me to keep the lights on and this informational blog free for everyone. Please click on the links in the articles or to the vendors below if you are purchasing products or DNA testing.

Thank you so much.

DNA Purchases and Free Transfers

Genealogy Services

Genealogy Research

Parent-Child Non-Matching Autosomal DNA Segments

Recently, I had the opportunity to compare 2 children’s autosomal DNA against both of their parents.  Since children obtain 50% of their DNA from each parent (except for the X chromosome in males), it stands to reason that all valid autosomal matches to these children not only will, but must match one parent or the other.  If not, then the match is not valid – in other words – it’s an identical match by chance.

If you remember, the definition of a match by chance, or IBC (identical by chance) is when someone matches a child but doesn’t match either parent.

This means that the DNA segments, or alleles, just happen to line up so that it reads as a match for the child, by zigzagging back and forth between the DNA of both parents, but it really isn’t a valid genealogical match.

You can read about how this works in my article, How Phasing Works and Determining IBD Versus IBS Matches and also in the article, One Chromosome, Two Sides, No Zipper.

The absolute best way to determine if a match is a valid match or not, valid meaning that the DNA was handed down by ancestors, not a match by chance, is to compare a child’s matches against both parents.  By doing that, we can quickly identify and isolate matches that aren’t real.

IBC

In the example above, you can see that Mom contributed all As to me and Dad contributed all Cs to me.  Joe has alternating As and Cs, so he is a match to me on every location.  However, he only matches my parents on half of their locations, so he is not a match to them, because it’s only chance that caused him to match me on those allele values in that order.

DNA matching programs have to take into consideration both allele values in their match routines, since you carry a value from your mother (A above) and a value from your father (C above), and they are not labeled as to which parent they come from.

Valid matches will also match one parent or the other.  After all, the child received all of their DNA from one parent or the other, so for someone to be a valid genealogical match a child, they must match a parent.

Some time back, when I was matching to my own mother’s DNA, I noticed that I matched her on about 40% of my matches, which left 60% to either be matches to my father or identical by chance.

Notice, I’m not talking about IBS, or identical by state, because that phrase is used to mean both identical by chance and identical by population.  Identical by population means that you did in fact inherit the DNA from an ancestor, but it’s either too far back in time to determine which ancestor, or that segment was present in a specific, probably endogamous population, and you could have inherited it from any number of ancestors.

So, identical by population is identical by descent, but we just can’t tell who we got received that DNA from.

  • IBC – identical by chance – not a valid match – you happen to match someone else on a particular segment, but it’s because the match software is jumping back and forth from your mother’s side to your father’s side.
  • IBD – Identical by descent – you share a common segment of DNA because you and another person(s) inherited that DNA segment from a common ancestor who you can identify
  • IBS – Identical by state – currently used to be both IBC and IBS, where IBS means that you did inherit this DNA from a common ancestor, but it’s so far back you can’t determine who, or that segment is so common within a particular population you could have inherited it from a number of people.

Now a 60-40 parental split is certainly possible, especially if one parent was from an endogamous population, which would mean more matches, or one parent was more recently immigrated from the old country, which would mean fewer matches.

However, without my father’s DNA, which is not available, we’ll never know.

Since that time, I have obtained access to 2 sets of child plus both parents DNA results, so I wanted to take a look at how IBD versus IBC stacked up.  These comparisons were done at Family Tree DNA.

Total Matches Non-Matching Either Parent Percent Non-Matching
Child 1 959 133 13.9
Child 2 1037 133 12.8

Based on other evidence I’ve seen, this percentage seems about right, but the amount of shared DNA and the largest segment size surprised me.  Keep in mind that the smallest possible segment size is 7cM which is Family Tree DNA’s lowest single segment threshold to be counted as a match (assuming you meet the 20cM total threshold first.)  If you match, they show you your matching DNA down to 1cM, but these tables are measurements by the 7cM matching criteria only.

In plain English, this means that in this case, 12% and 13% of these matches were identical by chance, or false matches.  These matches included people who shared up to 57cM of data and the largest block was 15cM.

Largest Shared cM Largest Longest Block
Child 1 46.87 14.38
Child 2 57.06 15.18

Could something else be causing this?  Certainly.  Some of these non-matches could be read errors in the files.  I’d certainly want to take a look at that if any of these became critical.  Another possibility could be that valid match segments are “stitched together” by IBC segments creating longer segments in the child.

An alternative to check validity would be to download the files to GedMatch and see if the pattern continues using the same match criteria.  Of course, testing at multiple labs and downloading the results to compare at GedMatch likely removes the issue of read errors in the first set of files.  And if you really, REALLY, want to know, you can look at the raw data files themselves.

Just so you know, this wasn’t an anomaly with just one high read.  Here are the highest 25 entries from Child 2, or about one fifth of her total mismatches.  Only a few were in the 3-5th cousin range.  None were closer.  Most were 4th or 5th to remote.

non-parent matching relationship range

If you want to do these comparisons yourself, they are easy to do if you have a child and both parents who have tested at Family Tree DNA.

On your Family Finder matches page, at the bottom, in the right corner, there is a button to download matches.

download button

I download the matches into separate spreadsheets for the child, mother and father.  I then color all of the rows pink in the mother’s results, and blue in the father’s results, then copy all three to a common spreadsheet.  You can then sort on the match name and this is what you’ll see.

non-match example

What you’re looking for is white (child) rows that don’t match either a blue row (father) or a pink row (mother.)  Don’t worry about pink or blue rows that don’t have matches. It’s normal for the DNA not to be passed to the child part of the time, so these are expected.

In this example, all white rows matched one parent or the other, except for Winnie Whines.  I colored this row red and added the Comment column where I entered the number of this non-matching entry.  When I’m finished comparing and coloring, then all I have to do is sort that column, bringing all of the nonmatching rows together.  I copied those nonmatching entries into a separate sheet so I could sort those alone and obtained the largest shared and longest segments.  To determine the percent, just divide the total number of nonmatches, in this case, 133, by the child’s total number of matches, in this case, 959, giving a non-parent-match percentage of 13.9%.

So, the take-home message is that not all small segment matches are genealogically irrelevant and not all larger segment matches are genealogically relevant.  Thank goodness we have tools and processes to begin to tell the difference.

So, if you don’t have both parents to compare to, and you’re wondering why you just can’t find a common ancestor with someone you match, the answer might be that they fall into your 12 or 13% that are IBC matches.

If you perform this little exercise, comparing a child to both parents, please feel free to post your results in the comments section along with any commentary about endogamous populations or special circumstances.  It really doesn’t take long, probably about an hour total, and the results are really interesting.  Plus, you’ll have eliminated all those irrelevant matches.

I’ll be writing more about this interesting experiment in coming days.

______________________________________________________________

Disclosure

I receive a small contribution when you click on some of the links to vendors in my articles. This does NOT increase the price you pay but helps me to keep the lights on and this informational blog free for everyone. Please click on the links in the articles or to the vendors below if you are purchasing products or DNA testing.

Thank you so much.

DNA Purchases and Free Transfers

Genealogy Services

Genealogy Research

A Study Utilizing Small Segment Matching

There has been quite a bit of discussion in the last several weeks, both pro and con, about how to use small matching DNA segments in genetic genealogy.  A couple of people are even of the opinion that small segments can’t be used at all, ever.  Others are less certain and many of us are working our way through various scenarios.  Evidence certainly exists that these segments can be utilized.

I’ve been writing foundation articles, in preparation for this article, for several weeks now.  Recently, I wrote about how phasing works and determining IBD versus IBS matches and included guidelines for telling the difference between the different kinds of matches.  If you haven’t read that article, it’s essential to understanding this article, so now would be a good time to read or review that article.

I followed that with a step by step article, Demystifying Autosomal DNA Matching, on how to do phasing and matching in combination with the guidelines about how to determine IBD (identical by descent) versus IBS (identical by chance) and identical by population matches when evaluating your own matches.

Now that we understand IBS, IBD, Phasing and how matching actually works on a case by case basis, let’s look at applying those same matching and IBS vs IBD guidelines to small data segments as well.

A Little History

So those of you who haven’t been following the discussion on various blogs and social media don’t feel like you’ve been dropped into the middle of a conversation with no context, let me catch you up.

On Thanksgiving Day, I published an article about identifying one of my ancestors, after many years of trying, Sarah Hickerson.

That article spurred debate, which is just fine when the debate is about the science, but it subsequently devolved into something less pleasant.  There are some individuals with very strong opinions that utilizing small segments of DNA data can “never be done.”

I do not agree with that position.  In fact, I strongly disagree and there are multiple cases with evidence to support small segments being both accurate and useful in specific types of genealogical situations.  We’ll take a look at several.

I do agree that looking at small segment data out of context is useless.  To the best of my knowledge, no genealogist begins with their smallest segments and tries to assemble them, working from the bottom up.  We all begin with the largest segments, because they are the most useful and the closest connections in our tree, and work our way down.  Generally, we only work with small segments when we have to – and there are times that’s all we have.  So we need to establish guidelines and ways to know if those small segments are reliable or not.  In other words, how can we draw conclusions and how much confidence can we put in those conclusions?

Ultimately, whether you choose to use or work with small segment data will be your own decision, based on your own circumstances.  I simply wanted to understand what is possible and what is reasonable, both for my own genealogy and for my readers.

In my projects, I haven’t been using small segment data out of context, or randomly.  In other words, I don’t just pick any two small segment matches and infer or decide that they are valid matches.  Fortunately, by utilizing the IBD vs IBS guidelines, we have tools to differentiate IBD (Identical by Descent) segments from IBS (Identical by State) by chance segments and IBD/IBS by population for matching segments, both large and small.

Studying small segment data is the key to determining exactly how small segments can reasonably be utilized.  This topic probably isn’t black or white, but shades of gray – and assuming the position that something can’t be done simply assures that it won’t be.

I would strongly encourage those involved and interested in this type of research to retain those small segments, work with them and begin to look for patterns.  The only way we, as a community, are ever going to figure out how to work with small segments successfully and reliably is to, well, work with them.

Discussing the science and scenarios surrounding the usage of small data segments in various different situations is critical to seeing our way through the forest.  If the answers were cast in concrete about how to do this, we wouldn’t be working through this publicly today.

Negative personal comments and inferences have no place in the scientific community.  It discourages others from participating, and serves to stifle research and cooperation, not encourage it.  I hope that civil scientific discussions and comparisons involving small segment data can move forward, with decorum, because they are critically needed in order to enhance our understanding, under varying circumstances, of how to utilize small segment data.  As Judy Russell said, disagreeing doesn’t have to be disagreeable.

Two bloggers, Blaine Bettinger and CeCe Moore wrote articles following my Hickerson article.  Blaine subsequently wrote a second article here.  Felix Immanuel wrote articles here and here.

A few others have weighed in, in writing, as well although most commentary has been on Facebook.  Israel Pickholtz, a professional genealogist and genetic consultant, stated on his blog, All My Foreparents, the following:

It is my nature to distrust rules that put everything into a single category and that’s how I feel about small segments. Sometimes they are meaningful and useful, sometimes not.

When I reconstructed my father’s DNA using Lazerus (described last week in Genes From My Father), I happily accepted all small segments of whatever size because those small segments were in the DNA of at least one of his children and at least one of his brother/sister/first cousin. If I have a particular small segment, I must have received it from my parents. If my father’s brother (or sister) has it as well, then it is eminently clear to me that I got it from my father and that it came to him and his brother from my grandfather. And it is not reasonable to say that a sliver of that small segment might have come from my mother, because my father’s people share it.

After seeing Israel’s commentary about Lazarus, I reconstructed the genome of both Roscoe and John Ferverda, brothers, which includes both large and small segments.  Working with the Ferverda DNA further, I wrote an article, Just One Cousin, about matching between two siblings and a first cousin, which includes lots of small data segments, some of which were proven to triangulate, meaning they are genuine, and some which did not.  There are lots more examples in the demystifying article, as well.

What Not To Do 

Before we begin, I want to make it very clear that am not now, and never have, advocated that people utilize small data segments out of context of larger matching segments and/or at least suspected matching genealogy.  For example, I have never implied or even hinted that anyone should go to GedMatch, do a “one to many” compare at 1 cM and then contact people informing them that they are related.  Anyone who has extrapolated what I’ve written to mean that either simply did not understand or intentionally misinterpreted the articles.

Sarah Hickerson Revisited

If I thought Sarah Hickerson caused me a lot of heartburn in the decades before I found her, little did I know how much heartburn that discovery would cause.

Let’s go back to the Sarah Hickerson article that started the uproar over whether small data segments are useful at all.

In that article, I found I was a member of a new Ancestry DNA Circle for Charles Hickerson and Mary Lytle, the parents of Sarah Hickerson.

Ancestry Hickerson match

Because there are no tools at Ancestry to prove DNA connections, I hurried over to Family Tree DNA looking for any matches to Hickersons for myself and for my Vannoy cousins who also (potentially) descended from this couple.  Much to my delight, I found  several matches to Hickersons, in fact, more than 20 – a total of 614 rows of spreadsheet matches when I included all of my Vannoy cousins who potentially descend from this couple to their Hickerson matches.  There were 64 matching clusters of segments, both small and large.  Some matches were as large as 20cM with 6000 SNPs and more than 20 were over 10cM with from 1500 to 6000 SNPs.  There were also hundreds of small segments that matched (and triangulated) as well.

By the time I added in a few more Vannoy cousins that we’ve since recruited, the spreadsheet is now up to 1093 rows and we have 52 Vannoy-Hickerson TRIANGULATED CLUSTERS utilizing only Family Tree DNA tools.

Triangulated DNA, found in 3 or more people at the same location who share a common ancestor is proven to be from that ancestor (or ancestral couple.)  This is the commonly accepted gold standard of autosomal DNA triangulation within the industry.

Here’s just one example of a cluster of three people.  Charlene and Buster are known (proven, triangulated) cousins and Barbara is a descendant of Charles Hickerson and Mary Lytle.

example triang

What more could you want?

Yes, I called this a match.  As far as I’m concerned, it’s a confirmed ancestor.  How much more confirmed can you get?

Some clusters have as many as 25 confirmed triangulated members.

chr 13 group

Others took issue with this conclusion because it included small segment data.  This seems like the perfect opportunity in which to take a look at how small segments do, or don’t stand up to scrutiny.  So, let’s do just that.  I also did the same type of matching comparison in a situation with 2 siblings and a known cousin, here.

To Trash…or Not To Trash

Some genetic genealogists discard small segments entirely, generally under either 5 or 7cM, which I find unfortunate for several reasons.

  1. If a person doesn’t work with small segments, they really can’t comment on the lack of results, and they’ll never have a success because the small segments will have been discarded.
  2. If a person doesn’t work with small segments, they will never notice any trends or matches that may have implications for their ancestry.
  3. If a person doesn’t work with small segments, they can’t contribute to the body of evidence for how to reasonably utilize these segments.
  4. If a person doesn’t work with small segments, they may well be throwing the baby out with the bathwater, but they’ll never know.
  5. They encourage others to do the same.

The Sarah Hickerson article was not meant as a proof article for anything – it was meant to be an article encouraging people to utilize genetic genealogy for not only finding their ancestor and proving known connections, but breaking down brick walls.  It was pointing the way to how I found Sarah Hickerson.  It was one of my 52 Ancestors Series, documenting my ancestors, not one of the specifically educational articles.  This article is different.

If you are only interested in the low hanging fruit, meaning within the past 5 or 6 generations, and only proving your known pedigree, not finding new ancestors beyond that 5-6 generation level, then you can just stop reading now – and you can throw away your small segments.  But if you want more, then keep reading, because we as a community need to work with small segment data in order to establish guidelines that work relative to utilizing small segments and identifying the small segments that can be useful, versus the ones that aren’t.

I do not believe for one minute that small segments are universally useless.  As Israel said, if his family did not receive those segments from a common family member, then where did they all get those matching segments?

In fact, utilizing triangulated and proven DNA relationships within families is how adoptees piece together their family trees, piggybacking off of the work of people with known pedigrees that they match genetically.  My assumption had been that the adoptee community utilized only large DNA segments, because the larger the matching segments, generally the closer in time the genealogy match – and theoretically the easier to find.

However, I discovered that I was wrong, and the adoptee community does in fact utilize small segments as well.  Here’s one of the comments posted on my Chromosome Browser War blog article.

“Thanks for the well thought out article, Roberta, I have something to add from the folks at DNAadoption. Adoptees are not just interested in the large segments, the small segments also build the proof of the numerous lines involved. In addition, the accumulation of surnames from all the matches provides a way to evaluate new lines that join into the tree.”

Diane Harman-Hoog (on behalf of the 6 million adoptees in this country, many of who are looking for information on medical records and family heritage).

Diane isn’t the only person who is working with small segment data.  Tim Janzen works with small segments, in particular on his Mennonite project, and discusses small segments on the ISOGG WIKI Phasing page.  Here is what Tim has to say:

“One advantage of Family Finder is that FF has a 1 cM threshold for matching segments. If a parent and a child both have a matching segment that is in the 2 to 5 cM range and if the number of matching SNPs is 500 or more then there is a reasonably high likelihood that the matching segment is IBD (identical by descent) and not IBS (identical by state).”

The same rules for utilizing larger segment data need to be applied to small segment data to begin with.

Are more guidelines needed for small segments?  I don’t know, but we’ll never know if we don’t work with many individual situations and find the common methods for success and identify any problematic areas.

Why Do Small Segments Matter?

In some cases, especially as we work beyond the 6 generation level, small segments may be all we have left of a specific ancestor.  If we don’t learn to recognize and utilize the small segments available to us, those ancestors, genetically speaking, will be lost to us forever.

As we move back in time, the DNA from more distant ancestors will be divided into smaller and smaller segments, so if we ever want the ability to identify and track those segments back in time to a specific ancestor, we have to learn how to utilize small segment data – and if we have deleted that data, then we can’t use it.

In my case, I have identified all of my 5th generation ancestors except one, and I have a strong lead on her.  In my 6th generation, however, I have lots of walls that need to be broken through – and DNA may be the only way I’ll ever do that.

Let’s take a look at what I can expect when trying to match people who also descend from an ancestor 5 generations back in time.  If they are my same generation, they would be my fourth cousins.

Based on the autosomal statistics chart at ISOGG, 4th cousins, on the average, would expect to share about 13.28 cM of DNA from their common ancestor.  This would not be over the match threshold at FTDNA of approximately 20 cM total, and if those segments were broken into three pieces, for example, that cousin would not show as a match at either FTDNA or 23andMe, based on the vendors’ respective thresholds.

% Shared DNA Expected Shared cM Relationship
0.781% 53.13 Third cousins, common ancestor is 4 generations back in time
0.391% 26.56 Third cousins once removed
20 cm Family Tree DNA total cM Threshold
0.195% 13.28 Fourth cousins, common ancestor is 5 generations back in time
7 cM 23andMe individual segment cM match threshold
0.0977% 6.64 Fourth cousins once removed
0.0488% 3.32 Fifth cousins, common ancestor is 6 generations back in time
0.0244 1.66 Fifth cousins once removed

If you’re lucky, as I was with Hickerson, you’ll match at least some relative who carries that ancestral DNA line above the threshold, and then they’ll match other cousins above the threshold, and you can build a comparison network, linking people together, in that fashion.  And yes you may well have to utilize GedMatch for people testing at various different vendors and for those smaller segment comparisons.

For clarification, I have never “called” a genealogy match without supporting large segment data.  At the vendors, you can’t even see matches if they don’t have larger segments – so there is no way to even know you would match below the threshold.

I do think that we may be able to make calls based on small segments, at least in some instances, in the future.  In fact, we have to figure out how to do this or we will rarely be able to move past the 5th or 6th generation utilizing genetics.

At the 5th generation, or third cousins, one expects to see approximately 26 cM of matching DNA, still over the threshold (if divided correctly), but from that point further back in time, the expected shared amount of DNA is under the current day threshold.  For those who wonder why the vendors state that autosomal matches are reliable to about the 5th or 6th generation, this is the answer.

I do not discount small segments without cause.  In other words, I don’t discount small segments unless there is a reason.  Unless they are positively IBS by chance, meaning false, and I can prove it, I don’t disregard them.  I do label them and make appropriate notes.  You can’t learn from what’s not there.

Let me give you an example.  I have one area of my spreadsheet where I have a whole lot of segments, large and small, labeled Acadian.  Why?  Because the Acadians are so intermarried that I can’t begin to sort out the actual ancestor that DNA came from, at least not yet…so today, I just label them “Acadian.”

This example row is from my master spreadsheet.  I have my Mom’s results in my spreadsheet, so I can see easily if someone matches me and Mom both. My rows are pink.  The match is on Mom’s side, which I’ve color coded purple.  I don’t know which ancestor is the most recent common ancestor, but based on the surnames involved, I know they are Acadian.  In some cases, on Acadian matches, I can tell the MRCA and if so, that field is completed as well.

Me Mom acadian

As a note of interest, I inherited my mother’s segment intact, so there was no 50% division in this generation.

I also have segments labeled Mennonite and Brethren.  Perhaps in the future I’ll sort through these matches and actually be able to assign DNA segments to specific ancestors.  Those segments aren’t useless, they just aren’t yet fully analyzed.  As more people test, hopefully, patterns will emerge in many of these DNA groupings, both small and large.

In fact, I talked about DNA patterns and endogamous populations in my recent article, Just One Cousin.

For me, today, some small segment matches appear to be central European matches.  I say “appear to be,” because they are not triangulated.  For me this is rather boring and nondescript – but if this were my African American client who is trying to figure out which line her European ancestry came from, this could be very important.  Maybe she can map these segments to at least a specific ancestral line, which she would find very exciting.

Learning to use small segments effectively has the potential to benefit the following groups of people:

  • People with colonial ancestry, because all that may be left today of colonial ancestors is small segments.
  • People looking to break down brick walls, not just confirm currently known ancestors.
  • People looking for minority ancestors more than 5 or 6 generations back in their trees.
  • Adoptees – although very clearly, they want to work with the largest matches first.
  • People working with ethnic identification of ancestors, because you will eventually be able to track ethnicity identifying segments back in time to the originating ancestor(s).

Conversely, people from highly endogamous groups may not be helped much, if at all, by small segments because they are so likely to be widely shared within that population as a group from a common ancestor much further back in time.  In fact, the definition of a “small segment” for people with fully endogamous families might be much larger than for someone with no known endogamy.

However, if we can identify segments to specific populations, that may help the future accuracy of ethnicity testing.

Let’s go back and take a look at the Hickerson data using the same format we have been using for the comparisons so far.

Small Segment Examples

These Hickerson/Vannoy examples do not utilize random small segment matches, but are utilizing the same matching rules used for larger matches in conjunction with known, triangulated cousin groups from a known ancestor.  Many cousins, including 2 brothers and their uncle all carry this same DNA.  Like in Israel’s case, where did they get that same DNA if not from a common ancestor?

In the following examples, I want to stress that all of the people involved DO HAVE LARGER SEGMENT MATCHES on other chromosomes, which is how we knew they matched in the first place, so we aren’t trying to prove they are a match.  We know they are.  Our goal is to determine if small segments are useful in the same situation, proving matches, as with larger segments.  In other words, do the rules hold true?  And how do we work with the data?  Could we utilize these small segment matches if we didn’t have larger matching segments, and if so, how reliable would they be?

There is a difference between a single match and a triangulated group:

  • Matches between two people are suggestive of a common ancestor but could be IBS by chance or population..
  • Multiple matches, such as with the 6 different Hickersons who descend from Charles Hickerson and Mary Lytle, both in the Ancestry DNA Circle and at Family Tree DNA, are extremely suggestive of a specific common ancestor.
  • Only triangulated groups are proof of a common ancestor, unless the people are  closely related known relatives.

In our Hickerson/Vannoy study, all participants match at least to one other (but not to all other) group members at Family Tree DNA which means they match over the FTDNA threshold of approximately 20 cM total and at least one segment over 7.7cM and 500 SNPs or more.

In the example below, from the Hickerson article, the known Vannoy cousins are on the left side and the Hickerson matches to the Vannoy cousins are across the top.  We have several more now, but this gives you an idea of how the matching stacked up initially.  The two green individuals were proven descendants from Charles Hickerson and Mary Lytle.

vannoy hickerson higginson matrix

The goal here is to see how small data segments stack up in a situation where the relationship is distant.  Can small segments be utilized to prove triangulation?  This is slightly different than in the Just One Cousin article, where the relationship between the individuals was close and previously known.  We can contrast the results of that close relationship and small segments with this more distant connection and small segments.

Sarah Hickerson and Daniel Vannoy

The Vannoy project has a group of about a dozen cousins who descend from Elijah Vannoy who have worked together to discover the identify of Elijah’s parents.  Elijah’s father is one of 4 Vannoy men, all sons of the same man, found in Wilkes County, NC. in the late 1700s.  Elijah Vannoy is 5 generations upstream from me.

What kind of evidence do we have?  In the paper genealogy world, I have ruled out one candidate via a Bible record, and probably a second via census and tax records, but we have little information about the third and fourth candidates – in spite of thoroughly perusing all existent records.  So, if we’re ever going to solve the mystery, short of that much-wished-for Vannoy Bible showing up on e-Bay, it’s going to have to be via genetic genealogy.

In addition to the dozen or so Vannoy cousins who have DNA tested, we found 6 individuals who descend from Sarah Hickerson’s parents, Charles Hickerson and Mary Lytle who match various Vannoy cousins.  Additionally, those cousins match another 21 individuals who carry the Hickerson or derivative surnames, but since we have not proven their Hickerson lineage on paper, I have not utilized any of those additional matches in this analysis.  Of those 26 total matches, at Family Tree DNA, one Hickerson individual matches 3 Vannoy cousins, nine Hickerson descendants match 2 Vannoy cousins and sixteen Hickerson descendants match 1 Vannoy cousin.

Our group of Vannoy cousins matching to the 6 Charles Hickerson/Mary Lytle descendants contains over 60 different clusters of matching DNA data across the 22 chromosomes.  Those 6 individuals are included in 43 different triangulated groups, proving the entire triangulation group shares a common ancestor.  And that is BEFORE we add any GedMatch information.

If that sounds like a lot, it’s not.  Another recent article found 31 clusters among siblings and their first cousin, so 60 clusters among a dozen known Vannoy cousins and half a dozen potential Hickerson cousins isn’t unusual at all.

To be very clear, Sarah Hickerson and Daniel Vannoy were not “declared” to be the parents of Elijah Vannoy, born in 1784, based on small segment matches alone.  Larger segment matches were involved, which is how we saw the matches in the first place.  Furthermore, the matches triangulated.  However, small segments certainly are involved and are more prevalent, of course, than large segments.  Some cousins are only connected by small segments.  Are they valid, and how do we tell?  Sometimes it’s all we have.

Let me give you the classic example of when small segments are needed.

We have four people.  Person A and B are known Vannoy cousins and person C and D are potential Hickerson cousins.  Potential means, in this case, potential cousins to the Vannoys.  The Hickersons already know they both descend from Charles Hickerson and Mary Lytle.

  • Person A matches person C on chromosome 1 over the matching threshold.
  • Person B matches person D on chromosome 2 over the matching threshold.

Both Vannoy cousins match Hickerson cousins, but not the same cousin and not on the same segments at the vendor.  If these were same segment matches, there would be no question because they would be triangulated, but they aren’t.

So, what do we do?  We don’t have access to see if person C and D match each other, and even if we did, they don’t match on the same segments where they match persons A and B, because if they did we’d see them as a match too when we view A and B.

If person A and B don’t match each other at the vendor, we’re flat out of luck and have to move this entire operation to GedMatch, assuming all 4 people have or are willing to download their data.

a and b nomatch

If person A and B match each other at the vendor, we can see their small segment data as compared to each other and to persons C and D, respectively which then gives us the ability to see if A matches C on the same small segment as B matches D.

a and b match

If we are lucky, they will all show a common match on a small segment – meaning that A will match B on a small segment of chromosome 3, for example, and A will match C on that same segment.  In a perfect world, B will also match D on that same segment, and you will have 4 way triangulation – but I’m happy with the required 3 way match to triangulate.

This is exactly what happened in the article, Be Still My H(e)art.  As you can see, three people match on chromosomes 1 and 8, below – two of whom are proven cousins and the third was the wife surname candidate line.

Younger Hart 1-8

The example I showed of chromosome 2 in the Hickerson article was where all participants of the 5 individuals shown on the chromosome browser were matching to the Vannoy participant.  I thought it was a good visual example.  It was just one example of the 60+ clusters of cousin matches between the dozen Vannoy cousins and 6 Hickerson descendants.

This example was criticized by some because it was a small segment match.  I should probably have utilized chromosome 15 or searched for a better long segment example, but the point in my article was only to show how people that match stack up together on the chromosome browser – nothing more.   Here’s the entire chromosome, for clarity.

hickerson vannoy chr 2

Certainly, I don’t want to mislead anyone, including myself.  Furthermore, I dislike being publicly characterized as “wrong” and worse yet, labeled “irresponsible,” so I decided to delve into the depths of the data and work through several different examples to see if small segment data matching holds in various situations.  Let’s see what we found.

Chromosome 15

I selected chromosome 15 to work with because it is a region where a lot of Vannoy descendants match – and because it is a relatively large segment.  If the Hickersons do match the Vannoys, there’s a fairly good change they might match on at least part of that segment.  In other words, it appears to be my best bet due to sheer size and the number of Elijah Vannoy’s descendants who carry this segment.  In addition to the 6 individuals above who matched on chromosome 15, here are an additional 4.  As you can see, chromosome 15 has a lot of potential.

Chrom 15 Vannoy

The spreadsheet below shows the sections of chromosome 15 where cousins match.  Green individuals in the Match column are descendants of Charles Hickerson and Mary Lytle, the parents of Sarah Hickerson.  The balance are Vannoys who match on chromosome 15.

chr 15 matches ftdna v4

As you can see, there are several segments that are quite large, shown in yellow, but there are also many that are under the threshold of 7cM, which are all  segments that would be deleted if you are deleting small segments.  Please also note that if you were deleting small segments, all of the Hickerson matches would be gone from chromosome 15.

Those of you with an eagle eye will already notice that we have two separate segments that have triangulated between the Vannoy cousins and the Hickerson descendants, noted in the left column by yellow and beige.  So really, we could stop right here, because we’ve proven the relationship, but there’s a lot more to learn, so let’s go on.

You Can’t Use What You Can’t See

I need to point something out at this point that is extremely important.

The only reason we see any segment data below the match threshold is because once you match someone on a larger segment at Family Tree DNA, over the threshold, you also get to view the small segment data down to 1cM for your match with that person. 

What this means is that if one person or two people match a Hickerson descendant, for example you will see the small segment data for their individual matches, but not for anyone that doesn’t match the participant over the matching threshold.

What that means in the spreadsheet above, is that the only Hickerson that matches more than one Vannoy (on this segment) is Barbara – so we can see her segment data (down to 1cM ) as compared to Polly and Buster, but not to anyone else.

If we could see the smaller segment data of the other participants as compared to the Hickerson participants, even though they don’t match on a larger segment over the matching threshold, there could potentially be a lot of small segment data that would match – and therefore triangulate on this segment.

This is the perfect example of why I’ve suggested to Family Tree DNA that within projects or in individuals situations, that we be allowed to reduce the match threshold – especially when a specific family line match is suspected.

This is also one of the reasons why people turn to GedMatch, and we’ll do that as well.

What this means, relative to the spreadsheet is that it is, unfortunately, woefully incomplete – and it’s not apples to apples because in some cases we have data under the match threshold, and in some, we don’t.  So, matches DO count, but nonmatches where small segment data is not available do NOT count as a non-match, or as disproof.  It’s only negative proof IF you have the data AND it doesn’t match.

The Vannoys match and triangulate on many segments, so those are irrelevant to this discussion other than when they match to Hickerson DNA.  William (H), descends from two sons of Charles Hickerson and Mary Lytle.  Unfortunately, he only matches one Vannoy, so we can only see his small segments for that one Vannoy individual, William (V).  We don’t know what we are missing as compared to the rest of the Vannoy cousins.

To see William (H)’s and William (V)’s DNA as compared to the rest of the Vannoy cousins, we had to move to GedMatch.

Matching Options

Since we are working with segments that are proven to be Vannoy, and we are trying to prove/disprove if Daniel Vannoy and Sarah Hickerson are the parents of Elijah through multiple Hickerson matches, there are only a few matching options, which are:

  1. The Hickerson individuals will not triangulate with any of the Vannoy DNA, on chromosome 15 or on other chromosomes, meaning that Sarah Hickerson is probably not the mother of Elijah Vannoy, or the common ancestor is too far back in time to discern that match at vendor thresholds.
  2. The Hickerson individuals will not triangulate on this segment, but do triangulate on other segments, meaning that this segment came entirely from the Vannoy side of the family and not the Hickerson side of the family. Therefore, if chromosome 15 does not triangulate, we need to look at other chromosomes.
  3. The Hickerson individuals triangulate with the Vannoy individuals, confirming that Sarah Hickerson is the mother of Elijah Vannoy, or that there is a different common unknown ancestor someplace upstream of several Hickersons and Vannoys.

All of the Vannoy cousins descend from Elijah Vannoy and Lois McNiel, except one, William (V), who descends from the proven son of Sarah Hickerson and Daniel Vannoy, so he would be expected to match at least some Hickerson descendants.  The 6 Hickerson cousins descend from Charles Hickerson and Mary Lytle, Sarah’s parents.

hickerson vannoy pedigree

William (H), the Hickerson cousin who descends from David, brother to Sarah Hickerson, is descended through two of David Hickerson’s sons.

I decided to utilize the same segment “mapping comparison” technique with a spreadsheet that I utilized in the phasing article, because it’s easy to see and visualize.

I have created a matching spreadsheet and labeled the locations on the spreadsheet from 25-100 based on the beginning of the start location of the cluster of matches and the end location of the cluster.

Each individual being compared on the spreadsheet below has a column across the top.  On the chart below, all Hickerson individuals are to the right and are shown with their cells highlighted yellow in the top row.

Below, the entire colorized chart of chromosome 15 is shown, beginning with location 25 and ending with 100, in the left hand column, the area of the Vannoy overlap.  Remember, you can double click on the graphics to enlarge.  The columns in this spreadsheet are not fully expanded below, but they are in the individual examples.

entire chr 15 match ss v4

I am going to step through this spreadsheet, and point out several aspects.

First, I selected Buster, the individual in the group to begin the comparison, because he was one of the closest to the common ancestor, Elijah Vannoy, genealogically, at 4 generations.  So he is the person at Family Tree DNA that everyone is initially compared against.

Everyone who matches Buster has their matching segments shown in blue.  Buster is shown furthest left.

When participants match someone other than Buster, who they match on that segment is typed into their column.  You can tell who Buster matches because their columns are blue on matching locations.  Here’s an example.

Me Buster match

You can see that in my column, it’s blue on all segments which means I match Buster on this entire region.  In addition, there are names of Carl, Dean, William Gedmatch and Billie Gedmatch typed into the cell in the first row which means at that location, in addition to Buster, I also match Carl and Dean at Family Tree DNA and William (descended from the son of Daniel Vannoy and Sarah Hickerson) at Gedmatch and Billie (a Hickerson) at Gedmatch.  Their name is typed into my column, and mine into theirs.  Please note that I did not run everyone against everyone at GedMatch.  I only needed enough data to prove the point and running many comparisons is a long, arduous process even when GedMatch isn’t experiencing problems.

On cells that aren’t colorized blue, the person doesn’t match Buster, but may still match other Vannoy cousin segments.  For example, Dean, below, matches Buster on location 25-29, along with some other cousins.  However, he does not match Buster on location 30 where he instead matches Harold and Carl who also don’t match Buster at that location. Harold, Carl and Dean do, however, all descend from the same son of Elijah so they may well be sharing DNA from a Vannoy wife at this location, especially since no one who doesn’t share that specific wife’s line matches those three at this location.

Me Buster Dean match

Remember, we are not working with random small data segments, but with a proven matching segment to a common Vannoy ancestor, with a group of descendants from a possible/probable Hickerson ancestor that we are trying to prove/disprove.  In other words, you would expect either a lot of Hickerson matches on the same segments, if Hickerson is indeed a Vannoy ancestral family, or virtually none of them to match, if not.

The next thing I’d like to point out is that these are small segments of people who also have larger matching segments, many of whom do triangulate on larger segments on other chromosomes.  What we are trying to discern is whether small segment matches can be utilized by employing the same matching criteria as large segment matching.  In other words, is small segment data valid and useful if it meets the criteria for an IBD match?

For example, let’s look at Daniel.  Daniel’s segments on chromosome 15, were it not for the fact that he matches on larger segments on other chromosomes, would not be shown as matches, because they are not individually over the match threshold.

Look at Daniel’s column for Polly and Warren.

Daniel matches 2

The segments in red show a triangulated group where Daniel and Warren, or Daniel, Warren and Polly match.  The segments where all 3 match are triangulated.

This proves, unquestionably, that small segments DO match utilizing the normal prescribed IBD matching criteria.  This spreadsheet, just for chromosome 15, is full of these examples.

Is there any reason to think that these triangulated matches are not identical by descent?  If they are not IBD, how do all of these people match the same DNA? Chance alone?  How would that be possible?  Two people, yes, maybe, but 3 or more?  In some cases, 5 or 6 on the same segment?  That is simply not possible, or we have disproven the entire foundation that autosomal DNA matching is based upon.

The question will soon be asked if small segments that triangulate can be useful when there are no larger matching segments to put the match over the initial vendor threshold.

Triangulated Groups

As you can see, most of the people and segments on the spreadsheet, certainly the Elijah descendants, are heavily triangulated, meaning that three or more people match each other on the same locations.  Most of this matching is over the vendor threshold at Family Tree DNA.

You can see that Buster, Me, Dean, Carl and Harold all match each other on the same segments, on the left half of the spreadsheet where our names are in each other’s columns.

triangulated groups

Remember when I said that the spreadsheet was incomplete?  This is an example.  David and Warren don’t match each other at a high enough total of segments to get them over the matching threshold when compared to each other, so we can’t see their small segment data as compared to each other.  David matches Buster, but Warren doesn’t, so I can’t even see them both in relationship to a common match.  There are several people who fall into this category.

Let’s select one individual to use as an example.

I’ve chosen the Vannoy cousin, William(V), because his kit has been uploaded to Gedmatch, he has Vannoy matches and because William is proven to descend from Sarah Hickerson and Daniel Vannoy through their son Joel – so we expect some Hickerson DNA to match William(V).

If William (V) matches the Hickersons on the same DNA locations as he matches to Elijah’s descendants, then that proves that Elijah’s descendant’s DNA in that location is Hickerson DNA.

At GedMatch, I compared William(V) with me and then with Dean using a “one to one” comparison at a low threshold, simply because I wanted as much data as I could get.  Family Tree DNA allows for 1 cM and I did the same, allowing 100 SNPs at GedMatch.  Family Tree DNA’s lowest SNP threshold is 500.

In case you were wondering, even though I did lower the GedMatch threshold below the FTDNA minimum, there were 45 segments that were above 1cM and above 500 SNPs when matching me to William(V), which would have been above the lowest match threshold at FTDNA (assuming we were over the initial match threshold.)  In other words, had we not been below the original match threshold (20cM total, one segment over 7.7cM), these segments would have been included at FTDNA as small segments.  As you can see in the chart below, many triangulated.

I colorized the GedMatch matches, where there were no FTDNA matches, in dark red text.  This illustrates graphically just how much is missed when the small segments are ignored in cases with known or probable cousins.  In the green area, the entry that says “Me GedMatch” could not be colorized red (because you can’t colorize only part of the text of a cell) so I added the Gedmatch designation to differentiate between a match through FTDNA and one from GedMatch.  I did the same with all Gedmatch matches, whether colorized or not.

Let’s take a look and see how small segments from GedMatch affect our Hickerson matching.  Note that in the green area, William (V) matches William (H), the Hickerson descendant, and William (V) matches to me and Dean as well.  This triangulates William (V)’s Hickerson DNA and proves that Elijah’s descendants DNA includes proven Hickerson segments.

William (V) gedmatch matches v2

In this next example, I matched William (H), the Hickerson cousin (with no Vannoy heritage) against both Buster and me.

William (H) gedmatch me buster

Without Gedmatch data, only two segments of chromosome 15 are triangulated between Vannoy and Hickerson cousins, because we can’t see the small data segments of the rest of the cousins who don’t match over the threshold.

You can see here that nearly the entire chromosome is triangulated using small segments.  In the chart below, you can see both William(V) and William (H) as they match various Vannoy cousins.  Both triangulate with me.

William V and William H

I did the same thing with the Hickerson descendant, Billie, as compared to both me and Dean, with the same type of results.

The next question would be if chromosome 15 is a pileup area where I have a lot of IBS matches that are really population based matches.  It does not appear to be.  I have identified an area of my chromosomes that may be a pileup area, but chromosome 15 does not carry any of those characteristics.

So by utilizing the small segments at GedMatch for chromosome 15 that we can’t otherwise see, we can triangulate at least some of the Hickerson matches.  I can’t complete this chart, because several individuals have not uploaded to GedMatch.

Why would the Hickerson descendant match so many of the Vannoy segments on chromosome 15?  Because this is not a random sample.  This is a proven Vannoy segment and we are trying to see which parts of this segment are from a potential Hickerson mother or the Vannoy father.  If from the Hickerson mother, then this level of matching is not unexpected.  In fact, it would be expected.  Since we cheated and saw that chromosome 15 was already triangulated at Family Tree DNA, we already knew what to expect.

In the spreadsheet below, I’ve added the 2 GedMatch comparisons, William (V) to me and Dean, and William (H) to me and Buster.  You can see the segments that triangulate, on the left.  We could also build “triangulated groups,” like GedMatch does.  I started to do this, but then stopped because I realized most cells would be colored and you’d have a hard time seeing the individual triangulated segments.  I shifted to triangulating only the individuals who triangulate directly with the Hickerson descendant, William(H), shown in green.  GedMatch data is shown in red.

chr 15 with gedmatch

I would like to make three points.

1.  This still is not a complete spreadsheet where everyone is compared to everyone.  This was selectively compared for two known Hickerson cousins, William (V) who descends from both Vannoys and Hickersos and William (H) who descends only from Hickersons.

2. There are 25 individually triangulated segments to the Hickerson descendant on just this chromosome to the various Vannoy cousins.  That’s proof times 25 to just one Hickerson cousin.

3.  I would NEVER suggest that you select one set of small segments and base a decision on that alone.  This entire exercise has assembled cumulative evidence.  By the same token, if the rules for segment matching hold up under the worst circumstances, where we have an unknown but suspected relationship and the small segments appear to continue to follow the triangulation rules, they could be expected to remain true in much more favorable circumstances.

Might any of these people have random DNA matches that are truly IBS by chance on chromosome 15?  Of course, but the matching rules, just like for larger segments, eliminates them.  According to triangulation rules, if they are IBS by chance, they won’t triangulate.  If they do triangulate, that would confirm that they received the same DNA from a common ancestor.

If this is not true, and they did not receive their common DNA from a common ancestor, then it disproves the fundamental matching rule upon which all autosomal DNA genetic genealogy is based and we all need to throw in the towel and just go and do something else.

Is there some grey area someplace?  I would presume so,  but at this point, I don’t know how to discern or define it, if there is.  I’ve done three in-depth studies on three different families over the past 6 weeks or so, and I’ve yet to find an area (except for endogamous populations that have matches by population) where the guidelines are problematic.  Other researchers may certainly make different discoveries as they do the same kind of studies.  There is always more to be discovered, so we need to keep an open mind.

In this situation, it helps a lot that the Hickerson/Vannoy descendants match and triangulate on larger segments on other chromosomes.  This study was specifically to see if smaller segments would triangulate and obey the rules. We were fortunate to have such a large, apparently “sticky” segment of Vannoy DNA on chromosome 15 to work with.

Does small segment matching matter in most cases, especially when you have larger segments to utilize?  Probably not. Use the largest segments first.  But in some cases, like where you are trying to prove an ancestor who was born in the 1700s, you may desperately need that small segment data in order to triangulate between three people.

Why is this important – critically important?  Because if small segments obey all of the triangulation rules when larger segments are available to “prove” the match, then there is no reason that they couldn’t be utilized, using the same rules of IBD/IBS, when larger segments are not available.  We saw this in Just One Cousin as well.

However, in terms of proof of concept, I don’t know what better proof could possibly be offered, within the standard genetic genealogy proofs where IBD/IBS guidelines are utilized as described in the Phasing article.  Additional examples of small segment proof by triangulation are offered in Just One Cousin, Lazarus – Putting Humpty Dumpty Together Again, and in Demystifying Autosomal DNA Matching.

Raising Elijah Vannoy and Sarah Hickerson from the Dead

As I thought more about this situation, I realized that I was doing an awful lot of spreadsheet heavy lifting when a tool might already be available.  In fact, Israel’s mention of Lazarus made me wonder if there was a way to apply this tool to the situation at hand.

I decided to take a look at the Lazarus tool and here is what the intro said:

Generate ‘pseudo-DNA kits’ based on segments in common with your matches. These ‘pseudo-DNA kits’ can then be used as a surrogate for a common ancestor in other tests on this site. Segments are included for every combination where a match occurs between a kit in group1 and group2.

It’s obvious from further instructions that this is really meant for a parent or grandparent, but the technique should work just the same for more distant relatives.

I decided to try it first just with the descendants of Elijah Vannoy.  At first, I thought that recreated Elijah would include the following DNA:

  • DNA segments from Elijah Vannoy
  • DNA segments from Elijah Vannoy’s wife, Lois McNiel
  • DNA segments that match from Elijah’s descendants spouse’s lines when individuals come from the same descendant line. This means that if three people descend from Joel Vannoy and Phoebe Crumley, Elijah’s son and his wife, that they would match on some DNA from Phoebe, and that there was no way to subtract Phoebe’s DNA.

After working with the Lazarus tool, I realized this is not the case because Lazarus is designed to utilize a group of direct descendants and then compare the DNA of that group to a second group of know relatives, but not descendants.

In other words, if you have a grandson of a man, and his brother.  The DNA shared by the brother and the grandson HAS to be the DNA contributed to that grandson by his grandfather, from their common ancestor, the great grandfather.  So, in our situation above, Phoebe’s DNA is excluded.

The chart below shows the inheritance path for Lazarus matching.

Lazarus inheritance

Because Lazarus is comparing the DNA of Son Doe with Brother Doe – that eliminates any DNA from the brother’s wives, Sarah Spoon or Mary – because those lines are not shared between Brother Doe and Son Doe.  The only shared ancestors that can contribute DNA to both are Father Doe and Methusaleh Fisher.

The Lazarus instructions allow you to enter the direct descendants of the person/couple that you are reconstructing, then a second set of instructions asks for remaining relatives not directly descended, like siblings, parents, cousins, etc. In other words, those that should share DNA through the common ancestor of the person you are recreating.

To recreate Elijah, I entered all of the Vannoy cousins and then entered William (V) as a sibling since he is the proven son of Daniel Vannoy and Sarah Hickerson.

Here is what Lazarus produced.

lazarus elijah 1

Lazarus includes segments of 4cM and 500 SNPs.

The first thing I thought was, “Holy Moly, what happened to chromosome 15?”  I went back and looked, and sure enough, while almost all of the Elijah descendants do match on chromosome 15, William (V), kit 156020, does not match above the Lazarus threshold I selected.  So chromosome 15 is not included.  Finding additional people who are known to be from this Vannoy line and adding them to the “nondescendant” group would probably result in a more complete Elijah.

lazarus elijah 2

Next, to recreate Sarah Hickerson, I added all of the Vannoy cousins plus William (V) as descendants of Sarah Hickerson and then I added just the one Hickerson descendant, William, as a sibling.  William’s ancestor is proven to be the sibling of Sarah.

I didn’t know quite what to expect.

Clearly if the DNA from the Hickerson descendant didn’t match or triangulate with DNA from any of the Vannoy cousins at this higher level, then Sarah Hickerson wasn’t likely Elijah’s mother.  I wanted to see matching, but more, I wanted to see triangulation.

lazarus elijah 3

I was stunned.  Every kit except two had matches, some of significant size.

lazarus elijah 4

lazarus elijah 5 v2

Please note that locations on chromosomes 3, 4 and 13, above, are triangulated in addition to matching between two individuals, which constitutes proof of a common ancestor.  Please also note that if you were throwing away segments below 7cM, you would lose all of the triangulated matches and all but two matches altogether.

Clearly, comparing the Vannoy DNA with the Hickerson DNA produced a significant number of matches including three triangulated segments.

lazarus elijah 6

Where Are We?

I never have, and I never would recommend attempting to utilize random small match segments out of context.  By out of context, I mean simply looking at all of your 1cM segments and suggesting that they are all relevant to your genealogy.  Nope, never have.  Never would.

There is no question that many small segments are IBS by chance or identical by population.  Furthermore, working with small segments in endogamous populations may not be fruitful.

Those are the caveats.  Small segments in the right circumstances are useful.  And we’ve seen several examples of the right circumstances.

Over the past few weeks, we have identified guidelines and tools to work with small segments, and they are the same tools and guidelines we utilize to work with larger segments as well.  The difference is size.  When working with large segments, the fact that they are large serves an a filter for us and we don’t question their authenticity.  With all small segments, we must do the matching and analysis work to prove validity.  Probably not worthwhile if you have larger segments for the same group of people.

Working with the Vannoy data on chromosome 15 is not random, nor is the family from an endogamous population.  That segment was proven to be Vannoy prior to attempts to confirm or disprove the Hickerson connection.  And we’ve gone beyond just matching, we’ve proven the ancestral link by triangulation, including small segments.  We’ve now proven the Hickerson connection about 7 ways to Sunday.  Ok, maybe 7 is an exaggeration, but here is the evidence summed up for the Vannoy/Hickerson study from multiple vendors and tools:

  • Ancestry DNA Circle indicating that multiple Hickerson descendants match me and some that don’t match me, match each other. Not proof, but certainly suggestive of a common ancestor.
  • A total of 26 Hickerson or derivative family name matches to Vannoy cousins at Family Tree DNA. Not proof, but again, very suggestive.
  • 6 Charles Hickerson/Mary Lytle descendants match to Vannoy cousins at Family Tree DNA. Extremely suggestive, needs triangulation.
  • Triangulation of segments between Vannoy and Hickerson cousins at Family Tree DNA. Proof, but in this study we were only looking to determine whether small segment matches constituted proof.
  • Triangulation of multiple Hickerson/Vannoy cousins on chromosome 15 at GedMatch utilizing small segments and one to one matching. More proof.
  • Lazarus, at higher thresholds than the triangulation matching, when creating Sarah Hickerson, still matched 19 segments and triangulated three for a total of 73.2cM when comparing the Hickerson descendant against the Vannoy cousins. Further proof.

So, can small segment matching data be useful? Is there any reason NOT to accept this evidence as valid?

With proper usage, small segment data certainly looks to provide value by judiciously applying exactly the same rules that apply to all DNA matching.  The difference of course being that you don’t really have to think about utilizing those tools with large segment matches.  It’s pretty well a given that a 20cM match is valid, but you can never assume anything about those small segment matches without supporting evidence. So are larger segments easier to use?  Absolutely.

Does that automatically make small segments invalid?  Absolutely not.

In some cases, especially when attempting to break down brick walls more than 5 or 6 generations in the past, small segment data may be all we have available.  We must use it effectively.  How small is too small?  I don’t know.  It appears that size is really not a factor if you strictly adhere to the IBD/IBS guidelines, but at some point, I would think the segments would be so small that just about everyone would match everyone because we are all humans – so the ultimate identical by population scenario.

Segments that don’t match an individual and either or both parents, assuming you have both parents to test, can safely be disregarded unless they are large and then a look at the raw data is in order to see if there is a problem in that area.  These are IBS by chance.  IBS segments by chance also won’t triangulate further up the tree.  They can’t, because they don’t match your parents so they cannot come from an ancestor.  If they don’t come from an ancestor, they can’t possibly match two other people whose DNA comes from that ancestor on that segment.

If both parents aren’t available, or your small segments do match with your parents, I would suggest that you retain your small segments and map them.

You can’t recognize patterns if the data isn’t present and you won’t be able to find that proverbial needle in the haystack that we are all looking for.

Based on what we’ve seen in multiple case studies, I would conclude that small segment data is certainly valid and can play a valid role in a situation where there is a known or suspected relationship.

I would agree that attempting to utilize small segment data outside the context of a larger data match is not optimal, at least not today, although I wish the vendors would provide a way for us to selectively lower our thresholds.  A larger segment match can point the way to smaller segment matches between multiple people that can be triangulated.  In some situations, like the person A, B, C, D Hickerson-Vannoy situation I described earlier in this article, I would like to be able to drop the match threshold to reveal the small segment data when other matches are suggestive of a family relationship.

In the Hickerson situation, having the ability to drop the matching thresholds would have been the key to positively confirming this relationship within the vendor’s data base and not having to utilize third party tools like GedMatch – which require the cooperation of all parties involved to download their raw data files.  Not everyone transferred their data to Gedmatch in my Vannoy group, but enough did that we were able to do what we needed to do.  That isn’t always the case.  In fact, I have an nearly identical situation in another line but my two matches at Ancestry have declined to download their data to Gedmatch.

This not the first time that small segment data has played a successful role in finding genealogy solutions, or confirming what we thought we knew – although in all cases to date, larger segments matched as well – and those larger segment matches were key and what pointed me to the potential match that ultimately involved the usage of the small segments for triangulation.

Using larger data segments as pointers probably won’t be the case forever, especially if we can gain confidence that we can reliably utilize small segments, at least in certain situations.  Specifically, a small segment match may be nothing, but a small segment triangulated match in the context of a genealogical situation seems to abide by all of the genetic genealogy DNA rules.

In fact, a situation just arose in the past couple weeks that does not include larger segments matching at a vendor.

Let’s close this article by discussing this recent scenario.

The Adoptee

An adoptee approached me with matching data from GedMatch which included matches to me, Dean, Carl and Harold on chromosome 15, on segments that overlap, as follows.

adoptee chr 15

On the spreadsheet above, sent to me by the adoptee, we can see some matches but not all matches. I ran the balance of these 4 people at GedMatch and below is the matching chart for the segment of chromosome 15 where the adoptee matches the 4 Vannoy cousins plus William(H), the Hickerson cousin.

  Me Carl Dean Harold Adoptee
Me NA FTDNA FTDNA GedMatch GedMatch
Carl FTDNA NA FTDNA FTDNA GedMatch
Dean FTDNA FTDNA NA FTDNA GedMatch
Harold GedMatch FTDNA FTDNA NA GedMatch
Adoptee GedMatch GedMatch GedMatch GedMatch NA
William (H) GedMatch GedMatch GedMatch GedMatch GedMatch

I decided to take the easy route and just utilize Lazarus again, so I added all of the known Vannoy and Hickerson cousins I utilized in earlier Lazarus calculations at Gedmatch as siblings to our adoptee.  This means that each kit will be compared to the adoptees DNA and matching segments will be reported.  At a threshold of 300 SNPs and 4cM, our adoptee matches at 140cM of common DNA between the various cousins.

adoptee vannoy match

Please note that in addition to matching several of the cousins, our adoptee also triangulates on chromosomes 1, 11, 15, 18, 19 and 21.  The triangulation on chromosome 21 is to two proven Hickerson descendants, so he matches on this line as well.

I reduced the threshold to 4cM and 200 SNPs to see what kind of difference that would make.

adoptee vannoy match low threshold

Our adoptee picked up another triangulation on chromosome 1 and added additional cousins in the chromosome 15 “sticky Vannoy” cluster and the chromosome 18 cluster.

Given what we just showed about chromosome 15, and the discussions about IBD and IBS guidelines and small matching segments, what conclusions would you draw and what would you do?

  1. Tell the adoptee this is invalid because there are no qualifying large match segments that match at the vendors.
  2. Tell the adoptee to throw all of those small segments away, or at least all of the ones below 7cM because they are only small matching segments and utilizing small matching segments is only a folly and the adoptee is only seeing what he wants to see – even though the Vannoy cousins with whom he triangulates are proven, triangulated cousins.
  3. Check to see if the adoptee also matches the other cousins involved, although he does clearly already exceeds the triangulation criteria to declare a common ancestor of 3 proven cousins on a matching segment. This is actually what I did utilizing Lazarus and you just saw the outcome.

If this is a valid match, based on who he does and doesn’t match in terms of the rest of the family, you could very well narrow his line substantially – perhaps by utilizing the various Vannoy wives’ DNA, to an ancestral couple.  Given that our adoptee matches both the Vannoys and the Hickersons, I suspect he is somehow descended from Daniel Vannoy and Sarah Hickerson.

In Conclusion

What is the acceptable level to utilize small segments in a known or suspected match situation?

Rather than look for a magic threshold number, we are much better served to look at reliable methods to determine the difference between DNA passed from our ancestors to us, IBD, and matches by chance.  This helps us to establish the reliability of DNA segments in individual situations we are likely to encounter in our genealogy.  In other words, rather that throw the entire pile of wheat away because there is some percentage of chaff in the wheat, let’s figure out how to sort the wheat from the chaff.

Fortunately, both parental phasing and triangulation eliminate the identical by chance segments.

Clearly, the smaller the segments, even in a known match situation, the more likely they are identical by population, given that they triangulate.  In fact, this is exactly how the Neanderthal and Denisovan genomes have been reconstructed.

Furthermore, given that the Anzick DNA sample is over 12,000 years old, Identical by population must be how Anzick is matching to contemporary humans, because at least some of these people do clearly share a common ancestor with Anzick at some point, long ago – more than 12,000 years ago.  In my case, at least some of the Anzick segments triangulate with my mother’s DNA, so they are not IBS by chance.  That only leaves identical by population or identical by descent, meaning within a genealogical timeframe, and we know that isn’t possible.

There are yet other situations where small segment matches are not IBS by chance nor identical by population.  For example, I have a very hard time believing that the adoptee situation is nothing but chance.  It’s not a folly.  It’s identical by descent as proven by triangulation with 10 different cousins – all on segments below the vendor matching thresholds.

In fact, it’s impossible to match the Vannoy cousins, who are already triangulated individually, by chance.  While the adoptee match is not over the vendor threshold, the segments are not terribly small and they do all triangulate with multiple individuals who also triangulate with larger segments, at the vendors and on different chromosomes.

This adoptee triangulated match, even without the Hickerson-Vannoy study disproves the blanket statement that small segments below 5cM cannot be used for genealogy.  All of these segments are 7.1cM or below and most are below 5.

This small segment match between my mother and her first cousins also disproves that segments under 5cM can never be used for genealogy.

Two cousins combined

This small segment passed from my mother to me disproves that statement too – clearly matching with our cousin, Cheryl.  If I did not receive this from my mother, and she from her parent, then how do we match a common cousin???

me mother small seg

More small segment proof, below, between my mother and her second cousin when Lazarus was reconstructing my mother’s father.

2nd cousin lazarus match

And this Vannoy Hickerson 4 cousin triangulated segment also disproves that 5cM and below cannot be used for genealogy.

vannoy hickerson triang

Where did these small segments come from if not a common ancestor, either one or several generations ago?  If you look at the small segment I inherited from my mother and say, “well, of course that’s valid, you got it from your mother” then the same logic has to apply that she inherited it from her parent.  The same logic then applies that the same small segment, when shared by my mother’s cousin, also came from the their common grandparents.  One cannot be true without the others being true.  It’s the same DNA. I got it from my mother.  And it’s only a 1.46cM segment, shown in the examples above.

Here are my observations and conclusions:

  • As proven with hundreds of examples in this and other articles cited, small segments can be and are inherited from our ancestors and can be utilized for genetic genealogy.
  • There is no line in the sand at 7cM or 5cM at which a segment is viable and useful at 5.1cM and not at 4.9cM.
  • All small segment matches need to be evaluated utilizing the guidelines set forth for IBD versus IBS by chance versus identical by population set forth in the articles titled How Phasing Works and Determining IBD Versus IBS Matches and Demystifying Autosomal DNA Matching.
  • When given a choice, large segment matches are always easier to use because they are seldom IBS by chance and most often IBD.
  • Small segment matches are more likely to be IBS by chance than larger matches, which is why we need to judiciously apply the IBD/IBS Guidelines when attempting to utilize small segment matches.
  • All DNA matches, not just small segments, must be triangulated to prove a common ancestor, unless they are known close relatives, like siblings, first cousins, etc.
  • When working in genetic genealogy, always glean the information from larger matches and assemble that information.  However, when the time comes that you need those small segments because you are working 5, 6 or 7 generations back in time, remember that tools and guidelines exist to use small segments reliably.
  • Do not attempt to use small segments out of context.  This means that if you were to look only at your 1cM matches to unknown people, and you have the ability to triangulate against your parents, most would prove to be IBS by chance.  This is the basis of the argument for why some people delete their small segments.  However, by utilizing parental phasing, phasing against known family members (like uncles, aunts and first cousins) and triangulation, you can identify and salvage the useable small segments – and these segments may be the only remnants of your ancestors more than 5 or 6 generations back that you’ll ever have to work with.  You do not have to throw all of them away simply because some or many small segments, out of context, are IBS by chance.  It doesn’t hurt anything to leave them just sit in your spreadsheet untouched until the day that you need them.

Ultimately, the decision is yours whether you will use small segments or not – and either decision is fine.  However, don’t make the decision based on the belief that small segments under some magic number, like 5cM or 7cM are universally useless.  They aren’t.

Whether small segments are too much work and effort in your individual situation depends on your personal goals for genetic genealogy and on factors like whether or not you descend from an endogamous population.  People’s individual goals and circumstances vary widely.  Some people test at Ancestry and are happy with inferential matching circles and nothing more.  Some people want to wring every tidbit possible out of genealogy, genetic or otherwise.

I hope everyone will begin to look at how they can use small segment data reliably instead of simply discarding all the small segments on the premise that all small segment data is useless because some small segments are not useful.  All unstudied and discarded data is indeed useless, so discarding becomes a self-fulfilling prophecy.

But by far, the worst outcome of throwing perfectly good data away is that you’ll never know what genetic secrets it held for you about your ancestors.  Maybe the DNA of your own Sarah Hickerson is lurking there, just waiting for the right circumstances to be found.

______________________________________________________________

Disclosure

I receive a small contribution when you click on some of the links to vendors in my articles. This does NOT increase the price you pay but helps me to keep the lights on and this informational blog free for everyone. Please click on the links in the articles or to the vendors below if you are purchasing products or DNA testing.

Thank you so much.

DNA Purchases and Free Transfers

Genealogy Services

Genealogy Research

Demystifying Autosomal DNA Matching

dna word cluster4

What, exactly, is an autosomal DNA match?

Answer:  It’s Relative

I’m sorry, I just had to say that.

But truthfully, it is.

I know this sounds like a very basic question, and it is, but the answer sometimes isn’t as straightforward as we would like for it to be.

Plus, there are differences in quality of matches and types of matches.  If you want to sigh right about now, it’s OK.

We’ve talked a lot about matching in various recent articles.  I have several people who follow this blog religiously, and who would rather read this than, say, do dishes (who wouldn’t).  One of our regulars recently asked me the question, “what, exactly, is a match and how do I tell?”

Darned good question and I wish someone had explained this to me so I wouldn’t have had to figure it out.

In the computer industry, where I spent many years, we have what we call flow charts or wernier diagrams which in essence are logic paths that lead to specific results or outcomes depending on the answers at different junctions.

flow chart

I had a really hard time deciding whether to use the beer decision-making flow chart or the procrastinator flow chart, but the procrastinator flow chart was just one big endless loop, so I decided on the beer.

What I’m going to do is to step you through the logic path of finding and evaluating a match, determining whether it’s valid, identical by descent or chance, when possible, and how to work with your matches and what they mean.

Let me also say that while I use and prefer Family Tree DNA, these matching techniques are universal and apply to results from 23andMe as well, but not for Ancestry who gives you no browser or tools to compare your DNA to anyone else.  So, you can’t compare your results at Ancestry.

Comparing DNA results is the lynchpin of genetic genealogy.  You’re dead in the water without it.  If you have tested at Ancestry, you can always transfer your results to Family Tree DNA, where you do have tools, and to GedMatch as well.  You’re always better, in terms of genealogy, to fish in as many ponds as possible.

Before we talk about how to work with matches, for those who need to figure out how to find matches at Family Tree DNA and 23andMe, I wrote about that in the Chromosome Browser War article.  This article focuses on working with matching DNA after you have found that you are a match to someone – and what those matches might mean.

Matching Thresholds

All autosomal DNA vendors have matching thresholds.  People who meet or exceed those thresholds will be shown on your match list.  People who do not meet the initial threshold will not be considered as a match to you, and therefore will not be on your match list.

Currently, at Family Tree DNA, their match threshold to be shown as a match is about 20cM of total matching DNA and a single segment of about 7.7cM with 500 SNPs or over. The words “about” are in there because there is some fuzziness in the rules based on certain situations.

After you meet that criteria and you are shown as a match to an individual, when you download your matching data, your matches to them on each chromosome will be shown to the 1cM and 500 SNP level

At 23andMe, the threshold is 7cMs/700 SNPs for the first segment.  However, 23andMe has an upper limit of people who can match you at about 1000 matches.  This can be increased by the number of people you are communicating or sharing with.  However, your smallest matches will be dropped from your list when you hit your threshold.  This means that it’s very likely that at least some of your matches are not showing if you have in excess of 1000 matches total.  This means that your personal effective cM/SNP match threshold at 23andMe may be much higher.

Step 1 – Downloading Your Matching Segments

For this comparison, I’m starting with two fresh files from Family Tree DNA, one file of my own matches and one of my mother’s matches.  My mother died before autosomal DNA testing was available, so her results are only at Family Tree DNA (and now downloaded to GedMatch,) because her DNA was archived there.  Thank you Family Tree DNA, 100,000 times thank you!!!

At Family Tree DNA, the option to download all matches with segment information is on the chromosome browser tab, at the top, at the right, shown below.

ftdna download button

If you have your parents DNA available to test and it hasn’t been tested, order a kit for them today.  If either or both parents have been tested, download their results into the same spreadsheet with yours and color code them in a way you will understand.

In my case, I only have my mother’s results, and I color coded my matches pink, because I’m the daughter.  However, if I had both parents, I might have colored coded Mother pink and Dad blue.

Whatever color coding you do, it’s forever in your master spreadsheet, so make a note of what it is.  In my case, it’s part of the match column header.  Why is it in my column header?  Because I screwed up once and reversed them in a download.

Step 2 – Preparing and Sorting Your Spreadsheet

In my master DNA spreadsheet, I have the following columns,

dna master header

The green cell matches are matches to me from 23andMe.  My cousin, Cheryl also tested at 23andMe before autosomal testing was offered at Family Tree DNA.

The Source column, in my spreadsheet, means any source other than FTDNA.  The Ignore column is an extraneous number generated at one time by downloads.  I could delete that column now.

The “Side” column is which side the match is from, Mom or Dad.  Mom’s I can identify easily, because I have her DNA to compare to.  I don’t identify a match as Dad’s without having identified an ancestral line, because I don’t have his DNA to compare to.

And no, you can’t just assume that if it doesn’t match Mom, it’s an automatic match to Dad because you may have some IBS, identical by chance, matches.

The Common Ancestors/Comments column is just that.  I include things like when I e-mailed someone, if the match is triangulated and if so, with whom, etc.

In my master spreadsheet, the first “name” column (of who tested) is deleted, but I’ve left it in the working spreadsheet (below) with my mother for illustration purposes.  That way, neither of us has to remember who is pink!

Step 3 – Reviewing IBD and IBS Guidelines

If you need a refresher on, phasing, IBD, identical by descent, IBS which can mean either identical by chance or identical by population, it would be a good time to read or reread the article titled How Phasing Works and Determining IBD Versus IBS Matches.

Let’s briefly review the IBD vs IBS guidelines, because we’ll be applying them in this article.

Identical by Chance – Can be determined if an individual you match does not match to one of your parents, if parents are available.  If parents are not available for matching, IBS by chance segments won’t triangulate with other known genealogical matches on a common segment.

Identical by Descent – Can be suggested if a common ancestor (or ancestral line) can be determined between any two people who are not known relatives. If the two people are known close relatives, and their DNA matches, identical by descent is proven.  IBD can be proven with previously unknown family or genealogical matches when any three people descending from that same ancestor or ancestral line all match each other on the same segment of DNA.  Three way matching is called triangulation.

Identical by Population – Can be determined when multiple people triangulate with you on a specific segment of DNA, but the triangulated groups are from proven different lineages and are not otherwise related.  This is generally found in smaller segments from similar regions of the world.  Identical by population is identical by descent, but the ancestors are so far back in time that they cannot be determined and may contribute the same DNA to multiple lineages.  This is particularly evident in Jewish genealogy and other endogamous groups.

Step 4 – Determining Parental Side and IBS by Chance

The first thing to do, if you have either or both parents, is to determine whether your matches phase to your parents or are IBS by chance.

In this context, phasing means determining whether a particular match is to your father’s side of the family or to your mother’s side of the family.

Remember, at every address in your DNA, you will have two valid matches to different lines, one from your mother and one from your father.  The address on your DNA consists of the chromosome number which equates to the street name, and then the start and end locations, which consists of a range of addresses on that street.  Think of it as the length of your property on the street.

First, let’s look at my situation with only my mother’s DNA for comparison.

It’s easy to tell one of three things.

  1. Do mother and I both match the person? If so, that means that DNA match is from mother’s side of the family. Mark it as such. They are green, below.
  2. If the individual does not match me and mother, both, and only matches me, then the match is either on my father’s side or it’s IBS by chance. Those matches are blue below. Because I don’t have my father’s DNA, I can’t tell any more at this step.
  3. Notice the matches that are Mom’s but not to me. That means that I did not receive that DNA from Mom, or I received a small part, but it’s not over the lowest matching threshold at Family Tree DNA of 1cM and 500 SNPs.

match mom

In this next scenario, you can see that mother and I both match the same individual, but not on all segments.  I selected this particular match between me, my mother and Alfred because it has some “problems” to work through.

match mom2

The segments shown in green above are segments that Mom carries that I don’t.  This means that I didn’t receive them from mother.  This also means they could be  matching to Alfred legitimately, or are IBS by chance.  I can’t tell anything more about them at this point, so I’ve just noted what they are.  I usually mark these as “mother only” in my master spreadsheet.

match mom3

The first of the two green rows above show a match but it’s a little unusual.  My segment is larger than my mothers.  This means that one of five things has happened.

  1. Part of this segment is a valid match.  At the end, where we don’t match, the match extends IBS by chance a bit at the end, in my case, when matching Alfred. The valid match portion would end where my mother’s segment ends, at 16,100,293
  2. There is a read error in one of the files.
  3. The boundary locations are fuzzy, meaning vendor calculations like ‘healing’ for no calls, etc..
  4. I also match to my father’s line.
  5. Recombination has occurred, especially possible in an endogamous population, reconnecting identical by population segments between me and Alfred at the end of the segment where I don’t match my mother’s segment, so from 16,100,293 to 16,250,884.

Given that this is a small segment, the most likely scenario would be the first, that this is partly valid and partly IBS by chance.  I just make the note by that row.

The second green segment above isn’t an exact match, but if my segment “fits within” the boundaries of my mother’s segments, then we know I inherited the entire segment from her.  Once again, my boundaries are off a bit from hers, but this time it’s the beginning.  The same criteria applies as in 1-5, above.

match mom4

The green segments above are where I match Alfred, but my mother does not.  This means that these segments are either IBS by chance or that they will match my father.  I don’t know which, so I simply label them.  Given that they are all small segments, they are likely IBS by chance, but we don’t know that.  If we had my father’s DNA, we would be able to phase against him, too, but we don’t.

Now, if I was to leave this discussion here, you might have the impression that all small segment matches have problems, but they don’t.  In fact, here’s a much more normal “rea life” situation where mother and I are both matching to our cousin, Cheryl, Mom’s first cousin.  These matches include both large and small segments.  Let’s take a look and see what we can tell about our matches.

match mom complete

Roberta and Barbara have a total of 83 DNA matches to Cheryl.

Some matches will be where Barbara matches Cheryl and Roberta doesn’t.  That’s normal, Barbara is Roberta’s mother and Roberta only inherits half of Barbara’s DNA.  These rows where only Barbara, the mother, matches Cheryl are not colorized in the Start, End, cM and SNP columns, so they show as white.

Some matches will be exact matches.  That too is normal.  In some cases, Barbara passes all of a particular segment of DNA to Roberta.  These matches are colored purple.

Some of these matches are partial matches where Roberta inherited part of the segment of DNA from Barbara.  These are colored green. There are two additional columns at right where the percentage of DNA that Roberta inherited from Barbara on these segments is calculated, both for cM and SNPs.

Some of the matches are where Roberta matches Cheryl and Barbara doesn’t.  Cheryl is not known to be related to Roberta on her father’s side, so assuming that statement is correct, these matches would be IBS, identical by state, meaning identical by chance and can be disregarded at legitimate matches.  These are colored rust.  Note that most of these are small segments, but one segment is 8.8cM and 2197 SNPs.  In this case, if this segment becomes important for any reason, I would be inclined to look at the raw data file of Barbara to see if there were no calls or a problem with reads in this region that would prevent an otherwise legitimate match.

Let’s look at how these matches stack up.

Number Percent (rounded) Comment
Exact Matches 26 31 100% of the DNA
Barbara Only 20 24 0% of the DNA
Partial Matches 29 35 11-98% of the actual DNA matches
Roberta Only (IBS by chance) 7 8 Not a valid match

I think it’s interesting to note that while, on the average, 50% of the DNA of any segment is passed to the child, in actuality, in this example of partial inheritance, meaning the green rows, inheritance was never actually 50%.  In fact, the SNP and cM percentages inherited for the same segment varied, and the actual amounts ranged from 11-98% of the DNA of the parent being inherited by the child.  The average of these events was 54.57143 (cM) and 54.21429 (SNPs) however.

On top of that, in 13 (26 rows) instances, Roberta inherited all of Barbara’s DNA in that sequence, and in 20 cases, Roberta inherited none of Barbara’s DNA in that sequence.

This illustrates that while the average of something may be 50%, none of the actual individual values may be 50% and the values themselves may include the entire range of possibilities.  In this case, 11-98% were the actual percentage ranges for partial matches.

Matching Both Parents

I don’t have my father’s DNA, but I’m creating this next example as if I did.

match both parents

Matches to mother are marked in green.

I have two matches where I match my father, so we can attribute those to his side, which I’ve done and marked in orange.

The third group of matches to me, at the bottom, to Julio, Anna, Cindy and George don’t match either parent, so they must be IBS by chance.

I label IBS by chance segments, but I don’t delete them because if I download again, I’ll have to go through this same analysis process if I don’t leave them in my spreadsheet

Step 5 – How Much of the DNA is a Match?

One person asked, “exactly how do I tell how much DNA is matching, especially between three people.”  That’s a very valid question, especially since triangulation requires matching of three people, on the same segment, proven to a common ancestral line.

Let’s look at the match of both me and my mother to Don, Cheryl and Robin.

match mom part

In this example, we know that Don, Cheryl and Robin all match me on my mother’s side, because they all three match me and my mother, both on the same segment.

How do we determine that we match on the same segment?

I have sorted this spreadsheet in order of end location, then start location, then chromosome number so that the entire spreadsheet is in chromosome order, then start location, then end location.

We can see that both mother and I match Cheryl partially on this segment of chromosome 1, but not exactly.  The start location is slightly different, but the end location matches exactly.

The area where we all three match, meaning me, Mom and Cheryl, begins at 176,231,846 and ends at the common endpoint of 178,453,336

On the chart below, you can see that mother and I also both match Don, Cheryl’s brother, on part of this same segment, but not all of the same segment.

match mom part2

The common matching areas between me, Mom and Don begins at 176,231,846 and ends at 178,453,336.

Next, let’s look at the third person, Robin.

Mom and I both match Robin on part of this same overlapping segment as well.  Note that my segment extends beyond Mom’s, but that does not invalidate the portion that does match between Robin, Mom and I.

match mom part3

Our common match area begins at the same location, but ends at 178,453,336, the same location as the common end area with Don and Cheryl

Step 6 – What Do Matches Mean? IBD vs IBS in Action

So, let’s look at various types of matches and what they tell us.

match mom example

Looking at our matching situation above, let’s apply the various IBD/IBS rules and guidelines and see what we have

1. Are these matches identical by chance?  No.  How do we know?

a. Because they all match both me and a parent.

2. Are these matches identical by descent? Yes. How do we know?

a. Because we all match each other on this segment, and we know the common ancestor of Cheryl, Don, Barbara and me is Hiram Ferverda and Evaline Miller.  We know that Robin descends from the same ancestral Miller line.

3. Are these matches identical by population.  We don’t know, but there is no reason at this point to think so. Why?

a. Because looking at my master spreadsheet, I see no evidence that these segments are also assigned to other lineages. These individuals are also triangulated on a large number of other, much larger, segments as well.

4. Are these matches triangulated, meaning they are proven to a common ancestor? Yes. How do we know?

a. Documented genealogy of Hiram Ferverda and Evaline Miller. Don, Barbara, Cheryl and me are known family since birth.
b. Documented genealogy of Robin to the same ancestral family, even though Robin was previously unknown before DNA matching.
c. Even without the documented genealogy, Robin matches a set of two triangulation groups of people documented to the same ancestral line, which means she has to descend from that same line as well.

In our case, clearly these individuals share a common ancestor and a common ancestral line.  Even though these are small segments on chromosome 1, there are much larger matching segments on other chromosomes, and the same rules still apply.  The difference might be at some point smaller segments are more likely to be identical by population than larger segments.  Larger segments, when available, are always safer to use to draw conclusions.  Larger groups of matching individuals with known common genealogy on the same segments are also the safest way to draw conclusions.

Step 7 – Matching With No Parents

Sometimes you’re just not that lucky.  Let’s say both of your parents have passed and you have no DNA from them.

That immediately eliminates phasing and the identical by chance test by comparing to your parents, so you’ll have to work with your matches, including your identical by chance segments.

A second way to “phase” part of your DNA to a side of your family is by matching with known cousins or any known family member.

In the situation above, matching to Cheryl, Don and Robin, let’s remove my mother and see what we have.

match no mom

In this case, I still match to both of my first cousins, once removed, Cheryl and Don.  Given that Cheryl and Don are both known cousins, since forever, I don’t feel the need for triangulation proof in this case – although the three of us are triangulated to our common ancestor.  In other words, the fact that my mother does match them at the expected 1st cousin level is proof enough in and of itself if we only had one cousin to test.  We know our common ancestor is Cheryl and Don’s grandparents, who are my great-grandparents, Hiram Ferverda and Evaline Miller.

When I looked at Robin’s pedigree chart and saw that Robin descended from Philip Jacob Miller and wife Magdalena, I knew that this segment was a Miller side match, not a Ferverda match.

Therefore, matching with someone whose genealogy goes beyond the common ancestor of Cheryl, Don and me proves this line through 4 more generations.  In other words, this DNA segment came through the following direct line to reach Me, Mother, Cheryl and Don.

  • Philip Jacob Miller and Magdalena
  • Daniel Miller
  • David Miller
  • John David Miller
  • Evaline Louise Miller who married Hiram Ferverda

Clearly, we know from the earlier chart that my mother carried this DNA too, but even if we didn’t know that, she obviously had to have carried this segment or I would not carry it today.

So, even though in this example, our parents aren’t directly available for IBS testing and elimination, we can determine that anyone who matches both me and Cheryl or me and Don will have also matched mother on that segment, so we have, in essence, phased those people by triangulation, not by direct parental matching.

Step 8 – Triangulation Groups

What else does this match group tell us?

It tells us that anyone else who matches me and any one of our triangulation group on that segment also descends from the Miller descendant clan, one way or another.

Why do they have to match me AND one of the triangulation group members on that segment?  Because I have two sides to my DNA, my Mom’s side and my Dad’s side.  Matching me plus another person from the triangulation group proves which side the match is on – Mom’s or Dad’s.

We were able to phase to eliminate any identical by chance segments people on Mom’s side, so we know matches to both of us are valid.

On Dad’s side, there are some IBS by chance people (or segments) thrown in for good measure because I don’t have my Dad’s DNA to eliminate them out of the starting gate.  Those IBS segments will have to be removed in time by not triangulating with proven triangulated groups they should triangulate with, if they were valid matches.

When you map matches on your chromosome spreadsheet, this is what you’re doing.  Over time, you will be able to tell when you receive a new match by who they match and where they fall on your spreadsheet which ancestral line they descend from.

GedMatch also includes a triangulation utility.  It’s a great tool, because it produces trios of people for your top 400 matches.  The results are two kits that triangulate to the third person whose kit number you are matching against.

The output, below, shows you the chromosome number followed by the two kit numbers (obscured) that triangulate at this location, and then the start and end location followed by the matching cMs.  The result is triangulation groups that “slide to the right.”

gedmatch triang group3

In the example above, all of the triangulation matches to me above the red arrow include either Mother, my Ferverda cousins or the Miller group that we discussed in the Just One Cousin article.  In other words they are all related via a common ancestor.

You can tell a great deal about triangulation groups by who is, and isn’t in them using deductive reasoning.  And once you’ve figured out the key to the group, you have the key to the entire group.

In this case, Mom is a member of the first triangulation group, so I know this group is from her side and not Dad’s side.  Both Ferverda cousins are there, so I know it’s Mom’s Dad’s side of the family.  The Miller cousins are there, so I know it’s the Miller side of Mom’s Dad’s side of the family.

Please also note that while this entire group triangulates within itself, that the group manages to slide right and the first triangulated group of 3 in the list may not overlap the DNA of the last triangulated group of 3.  In fact, because you can see the start and end points, you can tell that these two triangulated groups don’t overlap.  The multiple triangulation groups all do match some portion of the group above and below them (in this case,) and as a composite group, they slide to the right. Because each group overlaps with the group above and below them, they all connect together in a genetic chain.  Because there is an entire group that are triangulated together, in multiple ways, we know that it is one entire group.

This allows me to map that entire segment on my Mom’s side of my DNA, from 10,369,154 to 41,685,667 to this group because it is contiguously connected to me, triangulated and unbroken.  The most distant ancestor listed will vary based upon the known genealogy of the three people being triangulated  For example, part of this segment, may come from Philip Jacob Miller himself, the line’s founder,, but another part could come from his son’s wife, who is also my ancestor.  Therefore, the various pieces of this group segment may eventually be attributed to different ancestors from this particular line based upon the oldest common ancestor of the three people who have triangulated.

In our example above, the second group starts where the red arrow is pointing.  I have absolutely no idea which ancestor this second group comes from – except – I know it does not come from my mother’s side because her kit number isn’t there.

Neither are any of my direct line Estes or Vannoy relatives, so it’s probably not through that line either.  My Bolton cousins are also missing, so we’ve probably eliminated several possible lines, 3 of 4 great grandparents, based on who is NOT in the match group.  See the value of testing both close and distant cousins?  In this case, the family members not only have to test, they also have to upload their results to GedMatch.

Conversely, we could quickly identify at least a base group by the presence in the triangulation groups of at least one my known cousins or people with whom I’ve identified my common ancestor.  Two from the same line would be even better!!!

Endogamy

The last thing I want to show you is an example of what an endogamous group looks like when triangulated.

gedmatch endogamy

This segment of chromosome 9 is an Acadian matching group to my Mom – and the list doesn’t stop here – this is just the size of the screen shot.  These matches continue for pages.

How do I know this group is Acadian?  In part, because this group also triangulates with my known Lore cousin who also descends from the same Acadian ancestor, Antoine Lore, son of Honore Lore and Marie Lafaille.  Additionally, I’ve worked with some of these people and we have confirmed Honore Lore and Marie Lafaille as our common ancestor as well.  In other cases, we’ve confirmed upstream ancestors.

Unfortunately, the Acadians are so intermarried that it’s very difficult to sort through the most distant genetic ancestor because there tend to be multiple most distant ancestors in everyone’s trees.  There is a saying that if you’re related to one Acadian, you’re related to all Acadians and it’s the truth.  Just ask my cousin Paul who I’m related to 137 different ways.

Matches to endogamous groups tend to have very, very long lists of matches, even triangulated, which means proven, matches.

Oh, and by the way, just for the record, this lengthy group includes some of my proven Acadian matches that were trimmed, meaning removed, from my match list when Ancestry did their big purge due to their new and improved phasing.  So if there was ever any doubt that we did in fact lose at least some valid matches, the proof lies right here, in the triangulation of those exact same people at GedMatch

Summary

I hope this step by step article has helped take the Greek, or maybe the geek, out of matching.  Once you think of it in a step by step logical basis, it makes a lot of sense and allows you to reasonably judge the quality of your matches.

The rule of thumb has been that larger matches tend to be “legitimate” and smaller matches are often discarded en masse because they might be problematic.  However, we’ve seen situations where some larger matches may not be legitimate and some smaller matches clearly are.  In essence, the 50% average seldom applies exactly and rules of thumb don’t apply in individuals situations either.  Your situation is unique with every match and now you have tools and guidelines to help you through the matching maze.

And hey, since we made it to the end, I think we should celebrate with that beer!!!

beer

______________________________________________________________

Disclosure

I receive a small contribution when you click on some of the links to vendors in my articles. This does NOT increase the price you pay but helps me to keep the lights on and this informational blog free for everyone. Please click on the links in the articles or to the vendors below if you are purchasing products or DNA testing.

Thank you so much.

DNA Purchases and Free Transfers

Genealogy Services

Genealogy Research