The Autosomal Me – Who Am I?

This is Part 3 of a multi-part series.

Part 1 was “The Autosomal Me – Unraveling Minority Admixture” and Part 2 was “The Autosomal Me – The Ancestors Speak.”  Part 1 discussed the technique we are going to use to unravel minority ancestry, and why it works.  Part two gave an example of the power of fragmented chromosomal mapping and the beauty of the results.

This series focuses on answering the questions of identity through autosomal testing, in particular, for minority ancestry.  By minority, I mean any small, elusive amount of any type of ancestry you are seeking to discover in your heritage.  In my case, that’s both Native American and African.

This segment, Part 3, focuses on using pedigree charts to gauge expected results, how autosomal ethnic groups are determined and how fragmented minority admixture mapping is different from other techniques.  This leads us into Part 4 which shows the various results from different testing companies and how they differ.

Part 5 features third party analysis tools and Part 6 begins the analyses of the data that parts 3, 4 and 5 provide.

Let’s hope that with all of this information, we can answer at least part of the question: Who am I?  Who am I really?

A lot of who I am has to do with who my ancestors were, where they lived, what they did, choices they made.  Did they fight in the American or French Revolution?  On which side?  Were they Native?  Were they African?  Were they slaves?  So, who were they?

One of the reasons I began with genetic genealogy more than a decade ago was to confirm or disprove the persistent family history of Native American heritage that I had been unable to resolve using only traditional genealogy tools.  I have made inroads with that, in unexpected ways and places, because of and in addition to genetic genealogy.  Genetic genealogy and traditional genealogy go hand in hand.

It’s difficult tracking down each line to perform mitochondrial or Yline DNA tests.  Sometimes, it’s beyond difficult and it’s impossible.  Lines die out, people refuse to test or you simply can’t find the right people.  We need other tools.

Enter autosomal genetics. From the beginning, early in genetic genealogy, we had the CODIS type forensic and paternity type tests.  I reviewed the results of those early tests relative to my pedigree chart in a paper I wrote, Revealing American Indian and Minority Heritage Using Y-line, Mitochondrial, Autosomal and X Chromosomal Testing Data Combined with Pedigree Analysis published in JoGG in the Fall 2010 Issue.  We’ve come a long way since then.

In that article, I dissected my pedigree chart to determine how much of different types of ancestry I carried and how that compared with the testing that had been performed at that time.

Using the end of line ancestors pedigree analysis method described in the paper, which determines the percentage of ethnicity that each end-of-line ancestor contributed to me, my origins totals were as follows:

Geographic Origin Chart

Geographic origin chart

(1) The ethnic heritage of several lines could probably be inferred by surname or ethnicity of marriage partner.  However, I have avoided the temptation to make inferences within the United States, as the Native or African ancestry may well lie with one of these ancestors.  These are in fact the perfect candidates and to eliminate them from consideration by inferring origins would be a disservice.

In broader categories, and combining those that are similar, we find:

geographic origin summary

This is a useful exercize, not just for minority admixture, but to help evaluate the results you receive from the various testing companies.  For example, you might notice that there is no Scandinavian showing in my pedigree chart, which makes Ancestry’s 80% British and 12% Scandinavian suspect right off the bat.  It also makes results as high as 25% Native American reported in one of the earlier tests impossible.  This pedigree analysis tool helps you understand what is reasonable to expect in terms of ethnicity breakdown.

Now that we know what the majority ancestry looks like and any minority ancestry that we are aware of, let’s take a look at the various types of autosomal testing available.

Tests and Population Markers

In the paper, I reviewed the older results from companies using either CODIS or proprietary markers.  These low resolution tests are out of date now (although many are still being sold) and have been replaced by the much more thorough wide spectrum tests using chip based technology, allowing hundreds of thousands of DNA locations to be tested and evaluated.  Of course, the word evaluated is the loose cannon in that sentence, because the quality of the evaluation is key here.  And the evaluation is dependent upon accurate and widespread data bases to compare DNA results against to determine which populations have higher and lower frequencies of specific alleles (markers) occurring in their populations.

For example, let’s compare a population in Siberia that shows 100% of a specific marker value, let’s say a value of 10 at marker location ZZZ.  Now let’s compare that result to a population from Africa at that same marker location, but with a value never found in Siberia, let’s say a value of 7.  Each of thousands of markers are evaluated this way, creating patterns.  Now, you have a tester who doesn’t know where their ancestors are from, whose results at marker location ZZZ have a value of 10.  Would you say they are more likely to have ancestry in Siberia or Africa?

This participant’s marker results for ZZZ go in the “very strongly Siberia” bucket.  Of course, other markers they carry might indicate Africa, or Europe, or elsewhere, because we are a Heinz 57 mix of all of our ancestors.  But this is, in essence, how our ethnicity is determined by autosomal DNA testing.  Needless to say, you can be a lot more accurate with thousands of markers than with the 15 or 21 CODIS markers, or even the 300+ in some of the proprietary tests.

BGA Testing

Using autosomal results to determine ethnicity is called BGA testing, or Biogeographical Ancestry testing.  It has been used for years to determine percentages of ethnicity.  So, how is what I’m doing different and what makes it unique and new to genetic genealogy?

1. Traditional BGA testing deals in percentages of ethnicity, meaning generally 1% or more.  Small amounts are difficult to track in the best of circumstances.  When dealing with small amounts of admixture, not all tests will be able to identify the minority ethnicity in question.  We’re using these tests, plus additional BGA chromosomal painting tools combined with some spreadsheet comparison techniques to cross that 1% threshold.

2.  The prevailing winds in this industry have been that anything smaller than 1% was undetectable, and that any amount of admixture less than 7cM, 5cM or 3.5cM (depending on the source) was usless.  While this is relatively accurate (but not always) when determining a genealogical relationship within the past few generations, it’s not true when looking beyond the accepted 6 to 7 generation threshold where the 1% ethnicity issue comes into play.  At that point, we know we can’t identify the minority ancestor genealogically, so we have to identify them by their membership in a minority population group.  I am using a variety of tools and techniques to reach across that threshold.

3.  Instead of using these various tools to try to establish a genealogical relationship with another tester (such as we share a common great-grandfather), I am using these tools to attempt to identify which line or lines carry minority admixture.  If you already know who in your family tree contributes that admixture, you don’t need this technique.  If you are looking to confirm minority admixture below 1%, searching for the minority admixture contributing line, or trying to figure out which of your known ancestors contributed minority admixture, then this technique is for you.

Typically these tools have been used to track segments from known ancestors, like a Jewish grandmother, for example.  These segments are large and evident.  That’s not the case with small amounts of minority admixture.  Using several BGA tools together helps to eliminate the possibility of one tool picking up on these small segments and another one missing it.  We are bringing all of the resources from various camps together to bear on the situation.  This is the ultimate form of recycling, using the shreds that were left on the cutting room floor and deemed to be usless when in actuality, they are diamonds in the rough.  We’re reassembling them and looking at them from a different perspective.  It’s a new kind of quilting!

A New Name

As I’ve worked through this process, it seems that Minority Admixture Mapping best suits what we are doing, so MAP it is.  It makes sense and you can say it.

I still want to know who I am, so in Part 4, we begin our data analysis by looking at the autosomal ethnicity results of the various testing companies and how they compare.

______________________________________________________________

Disclosure

I receive a small contribution when you click on some of the links to vendors in my articles. This does NOT increase the price you pay but helps me to keep the lights on and this informational blog free for everyone. Please click on the links in the articles or to the vendors below if you are purchasing products or DNA testing.

Thank you so much.

DNA Purchases and Free Transfers

Genealogy Services

Genealogy Research


The Autosomal Me – The Ancestors Speak

This is Part 2 in the series, “The Autosomal Me.”  Part 1 was “The Autosomal Me – UnRaveling Minority Admixture.”

Every Sunday, I write something called a Sunday Story.  I’ve done this for years.  I send them to my kids and I delude myself into thinking they read them.  I’m really writing them for my grandkids someday and hopefully, some as yet unborn descendants I’ll have that will care about finding out about the life and times of their a-few-greats grandmother who lived along with the dinosaurs in the last half of the 1900s and first half of the 2000s.  I know, I’m optimistic.

I decided that perhaps I would share this weeks Sunday story with all of you.  This way, I know that at least someone will read it.  Actually, aside from my husband, it’s my daughter-in-law who comments the most often.  So welcome to my Sunday Story!  You are all honorary cousins!

**********

I know that a great deal of what I do with genetics is lost on my friends and family members.  That’s OK, because it’s very specialized.  However, I wanted to take a little bit of time to share with you an aspect of the genetics I work with that I think is very beautiful in both a literal and a spiritual way.

The point of genetic genealogy, of course, is to learn about our ancestors, who they were and our connection to them.  There are various ways to do this, but most of the time it’s through various matches to other people who share a common ancestor either recently or perhaps further back in time.

Of course, therein lies the rub – how long ago are two people related and who was their common ancestor?  Some people who carry minority ancestry are at a distinct disadvantage, because the testing that provides matches and ethnicity generally relies on amounts in excess of 1%, which equates to about 6 or 7 generations.  While many of us know that we carry minority ancestry, we would be hard pressed to say that our “pure” Native (or other minority) ancestor fell into that 6 or 7 generation bracket.  Six or 7 generations equates to about 150-175 years before our birth, or about 1775-1800 for most of us.  By then, many Native people were already admixed and many already lived outside of a traditional tribal unit.  Some people carry Native heritage from multiple lines, but since it comes from multiple ancestors, it too is often quite fragmented, so it doesn’t really improve the situation much unless some of those fragments happen to fall together to make larger segments.

Therefore, we are looking for very small amounts of admixture that often don’t show on traditional tests, or if they do, it’s in miniscule amounts.

Enter chromosome painting.

Without going in to boring detail, I’ve recently been working with a new methodology of identifying these fragmented and very small segments.  I am using several chromosome painting tools.  I’ll be blogging soon enough about how all of this is done, but I just wanted to share with you a couple of beautiful pieces of DNA, through which our ancestors are speaking, and we can see them, in a manner of speaking.

On the graph below, which is my chromosome painting of one a small part of one of my chromosomes on the top, and my mother’s showing the exact same segment on the bottom, the various types of ethnicity are colored, or painted.  You can see that both of us have a primary ethnicity of North European, shown by the teal.

ancestors speak

The grid shows location 120 on the chromosome.  Think of this number as a house number on a street.  It’s numbered so we can keep track of where we are on the chromosome.  For genealogy purposes, the smallest segment normally considered as relevant is 7 mb or marker segments long.  Each tick mark equals one segment or address, so a segment 7 mb long would be from 120-127 which takes you right over to the legend.  As you can see, the primary ethnicity has no problem reaching way beyond the contiguous 7 threshold, but the minority ethnicity would not be counted because it’s too small.

However, by the very definition of what minority ancestry is, these small segments are not only present, providing critical information, they are essential in our search and very informative.  Let’s see what they are saying to us.

First, let’s talk for a minute about ancestry.  There is no line in the sand very often between populations.  There are generally only degrees of difference.  So in the case of Native American, which is yellow on this chart, we also expect to see it “drift back in time” by being found in conjunction with Siberian (putty), South Asian (red) and East Asian (emerald green).  Native Americans were not dropped from alien spaceships, they evolved over time from these other Asian populations, so we would expect to see some of their genetics in Native American people.

So let’s take a look at what we do actually see in the DNA.

The first brightly colored segment in the top band is mine.  It includes Native American (yellow), South Asian (red), a big chunk of East Asian (emerald Green), a little bit from the Caucus (ginger) which is the Middle East area, and a piece of West African (light green).

There are two messages from the ancestors in this piece of DNA.  First, this segment absolutely, positively does NOT come from mother.  We can see this clearly because she has nothing but North European (teal) in that section of her DNA.  So, this little gem came from Dad.

The second piece of information is that the ancestor who provided this DNA to Dad was very likely admixed, Native and African.

Of course, if you’re thinking ahead at this point, you’ll be asking, “Which one of your Dad’s other relatives has this same segment?” because, yes, that’s exactly how we will tell which of his lines contributed the Native ancestry.  But you’re getting ahead of the story, and well, that is a story for another time.  This story today, is about the direct messages of the ancestors and the beauty of our DNA itself.

Let’s look at the next segment of minority DNA.  It starts about location 123.  Mom’s is much more pronounced than mine and much richer.  This tells us that I didn’t receive much of Mom’s.  Instead I received mostly North European (teal), along with some East Asian (emerald).

Mom has almost a perfect Native segment here.  By perfect, I mean we find a progression from Native back through time through all 4 categories I would expect to find.  I consider this entire segment “Native” because it indicates Native heritage.  You can see the emerald green (East Asian), putty (Siberian), red (South Asian) and yellow (North American Indian and Arctic) nestled together with no other minority ancestry in close proximity.  This means it’s not part of a different kind of Asian segment.  Remember, part of Europe was settled by the Mongol Hordes and the Huns, so we do see Asian and western Asian DNA in Europe, along with DNA from the Caucus, but we don’t see isolated segments like this, with just eastern Asian DNA and Native American.  So this little beauty is the perfect Native indicator, positively, even though it is only about 4 segments long.

Now take a look at my DNA in that same region in the top row.  It’s kind of hard to see the emerald green against the teal, but I only inherited the East Asian (emerald) segments from Mom.  Of note, however, is that I also have an East Asian (green) segment that Mom doesn’t have.  My East Asian starts about 122 where hers doesn’t begin until 123.  So good old Dad contributed a bit here as well.  Again, we know this because Mom only has North European at that segment.

And now of course for the kicker.  Your DNA looks this same way.  How boringly teal it is, or how beautifully rainbow multi-colored depends on how much minority ancestry you have, from how many different lines, and which of your parents you received it from.

I hope you can see why I’m so excited to be developing this new technique to work with highly fragmented DNA to find our ancestors.  They are there, they have a voice, and they are speaking to us.  All we have to do is figure out how to listen.

I am simply in awe of the beauty of this technique, literally as well as figuratively.  While I certainly understand and appreciate logically that matching other people means we’re related, there is something awe-inspiring and tangible about being able to see the painted graphs and view the layers of ancestry nestled together, life forces reaching through time, protecting that DNA with its precious message for us over many generations.  All this time, just waiting for us to be able to understand the most personal message from our ancestors, delivered, from them, in our genes, to each of us.  This is the voice of our ancestors.

______________________________________________________________

Disclosure

I receive a small contribution when you click on some of the links to vendors in my articles. This does NOT increase the price you pay but helps me to keep the lights on and this informational blog free for everyone. Please click on the links in the articles or to the vendors below if you are purchasing products or DNA testing.

Thank you so much.

DNA Purchases and Free Transfers

Genealogy Services

Genealogy Research

The Autosomal Me – Unraveling Minority Admixture

haystack

You’re invited to come along with me on a journey.  It’s an epic event, a journey into the deepest recesses of our cells, into the smallest pieces of our DNA, into the part previously thought to be useless because it’s so tiny.  It’s the journey to find minority admixture.  Minority in this case means small amounts of admixture.  In my personal situation, this means both Native American and African.

People who have larger amounts of admixture don’t necessarily have to do this, although it can still provide useful information.  If your autosomal percentages are uniformly recognized and reported by most or all of the testing companies, meaning over 1%, you probably know which of your relatives contributed your minority heritage and you don’t need to look for that proverbial needle in a haystack.  Not everyone is that fortunate.  I’m not.  I know of Native heritage through my mother’s Acadian ancestors, but the ones in my father’s side have consistently eluded identification.  It’s there, but where?  It’s haystack time for me!

This past year or two, genetic genealogy has been hallmarked by advances in autosomal DNA and the supporting technologies using tools like 23andMe and Family Tree DNA’s Family Finder tests.  In order to figure out how people are related to you, what level of cousins they are, and which genealogical line they come from, we’ve been using independent tools like phasing, where you compare your DNA to that of your parents or other close known relatives to see who gave you which pieces, or segments, of DNA.  Then, when someone matches you on that segment, you can tell which side of yoru family it came from, and sometimes which genealogical line it came from.  This sets the stage for one day being able to have this conversation with someone:

“Hi John, I see that we are 117th cousins and we have a match at location 17,387,426 on chromosome 3.”  Beth

“Hi Beth, why yes, we are indeed cousins, but we’re actually 115th cousins, 11 times removed instead of 117th cousins.  Our match is through Attilla the Hun’s 37th concubine.”  John

Ok, so maybe I’m dreaming a bit…but this conversation is not just a possibility, it’s a certainty 10 years from now, but perhaps with less dramatic cousinships:)

To date, the rule of thumb for finding ancestors has been that small matches should be disregarded because they are probably identical by state (IBS), not identical by descent (IBD), meaning not useful genealogically.

What’s IBS you ask?  It’s a segment that is typically too small to be counted as an IBD, or identical by descent, segment.  This means that you and the person you match on this small segment descend from a common population, not necessarily that you share a common ancestor within the past several generations.  Genealgoically relevant segments are recognizable because they are larger.  To understand why and how this works, refer to my article, “Autosomal Results, the Basics.”

There is no absolute line in the sand, but generally segments smaller than 7cM (centimorgans) or 700 SNPs (some say 5cM and 500 SNPs) fall into this category.  Dr. Tim Janzen, the genealogical “father of phasing” discards all matches in his spreadsheets less than 3.5cM.  That’s because he’s looking for positive genealogical matches and does not want the data to be cluttered up by possible IBS matches.

However, when you have small amounts of minority ancestry, it stands to reason that these small tidbits could be very useful in identifying which of your genealogical lines produced these small amounts of admixture.  If you can identify which lines provided this minority admixture, then you’re well on the way to identifying which ancestor contributed the minority admixture.

When looking for minority admixture in two related people, finding these small segments in the same location should provide meaningful information and confirm minority heritage.  Said another way, if you both have less than 1% Native heritage, both share a common ancestor, and both carry your less than 1% on the same segment….one might say it’s not likely to be coincidence, especially if there is a pattern across multiple chromosomes/segments.  Identifying the common segments of your common ancestor can lead to identifying the specific family line, especially if you match others as well.  In essence, this is the genetic equivalent of “surround and conquer.”

Let me give a very short example here.

Let’s say I match my mother on part of chromosome 1 that is Native.

Then let’s say I match her first cousin (my first cousin once removed) on mother’s mother’s side on a smaller piece of that same segment.  This immediately tells me that this particular bit of Native heritage is not from mother’s father’s side.

autosomal Hill

Another match to a more distant Hill cousin further defines the path of Native ancestry,  showing that the Native heritage came through mother’s grandfather’s mother’s line.  You can see how we track this ancestry and whittle down the possible sources.

So, I’ve set out to test this minority ancestry tracking theory.  Because we are dealing with such small segments of DNA, “rooting around in the weeds,” as Bennett Greenspan so aptly put it, and have no mechanized tools, this journey is long, tiresome and tedious.  It’s also thrilling.

As with all experiments, I have wondered many times if I was wasting my time.  I’ve completed steps and then redone them a different way when I realized there was a better or more revealing method.  More than once.  That comes with the territory.

I debated about how to share this new technique.  In the past, I would have published this as an academic paper, but with the delays surrounding the publication of JoGG, and the fact that the last paper through JoGG took 18 months to get out the door, much of this information would be stale by then.  I thought about publishing as an e-book as well, but I finally settled on my blog.  I feel that I can reach more people in a much more timely fashion this way.  I also really like the blog because I can write in a more relaxed fashion than I could in any other venue and it gives you the opportunity to interact as well.

I also don’t know what to call this new methodology.  I have just been referring to it as the weeds method, but that’s not very scientific.  I considered the APM technique – Ancestry Population Mapping.  Sounds too nonspecific.  The PTM – Personal Torture Method – nah – puts people off even if it is true.  MAT – Minority Ancestry Tracking – that’s a possibility but isn’t very specific.  Fragmented Chromosome Mapping, FCM, has possibilities.  So, I’m open to suggestions.  If at the end of this series, it’s still the weeds method….well, then weeds it is.

Over the next few weeks, I’ll be writing about this journey, my discoveries, and sharing techniques with step by step instructions so that you can use the same tools.  Join me for the multi-part series, “The Autosomal Me.”

______________________________________________________________

Disclosure

I receive a small contribution when you click on some of the links to vendors in my articles. This does NOT increase the price you pay but helps me to keep the lights on and this informational blog free for everyone. Please click on the links in the articles or to the vendors below if you are purchasing products or DNA testing.

Thank you so much.

DNA Purchases and Free Transfers

Genealogy Services

Genealogy Research

Lost Colony, Hyde County and Lumbee Berry Families

I am very hopeful that one of our subscribers can help solve this mystery. As you will see, several members of the Lost Colony Research Group (via the Berry and Lost Colony DNA Project) are working on this puzzle, but we currently need Berry family members ancestral to both Robison and Hyde Counties in North Carolina to DNA test.

There are two Berry families who claim descent from the Lost Colonists of Roanoke Island in 1587, Henry and Richard Berry, who are presumed to be related to each other.

The progenitor of the first line is Henry Berry or O’Berry who is first found owning land in the 1730s in what is today Robison County, NC. This is the Lumbee Berry line. Priscilla Berry Lowery, the unconfirmed sister of Henry Berry/O’Berry reportedly talked about her family’s oral history of descending from Henry Berry, the colonist. I began writing a report about the various pieces of oral history and documentation that surround this legend and that is what started this Berry comparison project. That report is lengthy and will be published in a future article.

We do have two people who believe they descend from this Lumbee Berry line and their DNA does match. We are working with the Berry Family DNA project. This is the group known as the English Colony Berry’s by the Berry family DNA project. Scroll down on this link to find “English Colony Berry Family” — there are seven men in this group, Berry project ID #43, 61, 107, 112, 138, 140, 181.  http://freepages.genealogy.rootsweb.ancestry.com/~langolier/BerryDNA/family_dna_results.html

We do not have a Berry from the confirmed Lumbee line, but one of our members is attempting to find one. I do believe this is the correct line. We have one person from Craven County where Henry Berry’s son inherited his land and one from SC where other families from this group were known to have moved.

A second Berry line carries a very strong oral history of descent from Richard Berry, the second Berry colonist. This family is from the New Bern/Hyde County, North Carolina, region. Researcher Faye “Mary” Fulford Moore descends from this line. This family was introduced in 1937 when the Lost Colony play opened as the living descendants of the colonists. Unfortunately, Mary has no living Berry people to test. However, her father used to go to Hyde County when she was young and visit the Berry family there whom he claimed to be related to. One of them was a mortician. Mary’s father also duck hunted with a Mr. Stotesbury whom he also referred to as “cousin.”

Sharron Brace’s father was a Berry, also from Hyde County and this line has DNA tested.

In the Berry DNA project, this is known as the Spartanburg line and it does not match the English Colony Berry Family line to which the Lumbee Berrys are assigned. http://freepages.genealogy.rootsweb.ancestry.com/~langolier/BerryDNA/Family_yAncestry/spartanburg_co_sc_yancestry.html

Sharron tracked down the line of the mortician’s family and she cannot prove that this line descends from or is related to her line using documentation alone. We need someone to DNA test that we can prove is genealogically connected to the same line as the mortician, whom Mary’s father said they were related to.

Here is what Sharron found about the mortician’s genealogy:

“The funeral director in Swan Quarter in 1944 was Dan Berry. In the 1930 census I found Daniel Berry, age 44, living on Main Street in Swan Quarter with his wife Noi. At that time he was a general store merchant. He died in September 2, 1959. His father was listed in the death record as James Edward Berry Sr. and his mother was Evelyn Benjamin Williamson. According to Jim Berry’s website, James Edward Berry Sr. is the son of John Berry Jr. and Sally Stotesbury.  John Jr. is the son of John Berry Sr. and Rebecca Benson.  John Berry Sr. born in 1778 is the son of William Berry and Sarah Green.”

The John Berry born in 1778 may or may not be the brother of Sharon Brace’s ancestor, William Berry born in 1786-88 so we still don’t know if the two Berry lines were related.

So, we need a Berry male to take the DNA test who descends from John Berry born in 1778 through any of his son’s lines. I expect this line will match Sharron’s line, but it may not.

If Henry Berry and Richard Berry, the colonists, were indeed brothers or from the same paternal line (like uncle/nephew, etc.) their DNA will match each other, and their descendants DNA will match each other as well.

Sharron’s Hyde County line does not match that of the Henry Berry Lumbee line. The John Berry 1778 Hyde County line could match Sharron’s line, or could match Henry Berry’s line, or could be a completely different line.

What we need is someone to test from the John 1778 line. Because we know that Faye “Mary” Fulford Moore’s Berry family claimed to be related to this Berry line, the person who tests from the Swan Quarter John Berry (1778) line is representing the Richard Berry “potential colonist” line.

Solving this mystery is quite within reach if we can just find and test the right people.  Here’s hoping that the key lies with one of you!

______________________________________________________________

Disclosure

I receive a small contribution when you click on some of the links to vendors in my articles. This does NOT increase the price you pay but helps me to keep the lights on and this informational blog free for everyone. Please click on the links in the articles or to the vendors below if you are purchasing products or DNA testing.

Thank you so much.

DNA Purchases and Free Transfers

Genealogy Services

Genealogy Research

Proving Native American Ancestry Using DNA

Every day, I receive e-mails very similar to this one.

“My family has always said that we were part Native American.  I want to prove this so that I can receive help with money for college.”

The reasons vary, and not everyone wants to prove their heritage in order to qualify for some type of assistance.  Some want to find their tribe and join to reclaim their lost heritage.  Some want to honor their persecuted and hidden ancestors, undoing some of the wickedness of the past, and some simply seek the truth.  Regardless of why, they are all searching for information lost to them.

I’d like to talk about three topics in proving Native Ancestry.  First, I’d like to do some myth-busting.  Second, I’d like to talk a little about conventional research and third, I’d like to discuss what DNA can, and can’t, do for you.

As you read this blog, please click on the links.  I’m not going to repeat something I’ve already covered elsewhere.

Myth-Busting

Myth 1 – Free College

There is no free college for Native Americans.  There are sometimes scholarships and grants available, mostly by the individual tribes themselves, for their official members.

Myth 2 – Joining a Tribe

Many people think that if they can only figure out which tribe their ancestor descends from, they can join.  This is untrue.  Each tribe is a sovereign nation, and they get to determine their criteria for membership.  Most tribes require a specific percentage of Native “blood,” called blood quantum, in addition to being able to document which tribal member you descend from.  Some tribes require as much as 25% Native heritage, and most require at least 1/16th Native heritage, which is one great-great grandparent.  If you don’t know who in your family was a tribal member it’s unlikely that you would be able to meet the blood quantum requirement.

Myth 3 – DNA Testing Will Reveal my Tribe

Generally, DNA testing does not provide us with the information needed to determine a tribe, although it can clearly tell, using y-line or mitochondrial DNA testing, whether your direct paternal or maternal line was or was not Native.  Sometimes you will be able to infer a tribe based on your matches and their documented history, but the definition of tribes, their names and locations have changed over time.  We are working on improving this ability, but the science simply isn’t there yet and the number of Native people who have tested remains small.

Simply put, most federally recognized tribes aren’t interested in more tribal members.  More members mean a smaller piece of the pie for existing members.  The pot of resources, whatever resources you’re discussing, is only so large and it must be shared by all tribal members.

What is a Tribe?

Tribes in the US fall into two categories.  When most people think about tribes they are talking about federally recognized tribes.  Those are tribes that have some continuity with the past, such as they have always been a tribe, or they still retain tribal lands, etc., and the federal government recognizes them as such.  These are the tribes that qualify for government programs and many own casinos.  As you might imagine, with the influx of casino money, the desire to join a tribe has increased significantly.

The second category is non-federally recognized tribes.  Some are state recognized and others, not at all.  State recognition does not in any way guarantee federal or state funding and there are no universal standards for state recognition.  In other words, your mileage may vary, widely.  Non-federally recognized tribes are often run as non-profit entities.  In many cases, these tribes will help people research and document their genealogy and may be more open to tribal membership for those connecting with their Native heritage.

Be aware that some “tribes” that fall into the non-federally recognized category may be less than ethical.  Some tend to come and go.  In one case, to apply to join, one had to provide information such as social security numbers and a complete family pedigree including your children. In some cases, membership is very expensive, hundreds of dollars, but is available to almost anyone for the right price.  When evaluating tribes that are not federally recognized, if something sounds fishy, it probably is.  Caution is the watchword.

In general, the federally recognized tribes do not feel kindly towards the non-federally recognized tribes and view them as “fake,” interlopers trying to get part of that pie.  Of course, the non-federally recognized tribes feel differently; that they are reclaiming their heritage denied them.  Native American politics is nothing new and is fraught with landmines.

No federally recognized tribes, to the best of my knowledge, have considered DNA testing as a criteria for membership.  No federally recognized tribe has endorsed or participated in DNA testing that I’m aware of.  This does not mean that individuals have not privately tested.

Traditional Genealogy Research

Given the criteria for membership in federally recognized tribes, traditional genealogy is the only way to obtain the type of information required.  If your family history includes a tribal name, and east of the Mississippi, that most often is Cherokee, contact the various Cherokee tribes to inquire about membership criteria.  If the membership criteria is 25% blood quantum, and you must live on the reservation, you’re toast…..no need to continue that line of research if your goal is to join the tribe.

If your goal is simply to find your Native ancestor, that’s another matter entirely.  Begin by using the traditional research tools.

First, look at where your ancestor or that family line was located.  Did they migrate from elsewhere?  How were they listed in the census?  Was someone listed as other than white, indicating mixed race?  Check the records where they lived, tax records and others to see if there is any indication of non-European heritage.  Remember that your non-white ancestor would have retained their “darker” countenance for at least 2 generations after being admixed.  Many Native people were admixed very early.

So first, check the normal genealogy records and look for hints and traces of non-European ancestry.

Second, turn to Native resources that might reflect the Native people in the areas where your family is or was found.  The Access Genealogy site is absolutely wonderful and has an amazingly complete set of records including searchable tribal rolls.  In addition, I add information almost daily to the Native Heritage Project at www.nativeheritageproject.com, which is searchable.  There are many more resources including several collections at Ancestry.com.

Hopefully, these records will help narrow your focus in your family tree to a particular person or two, not just a general branch.  Family rumors like “Grandma was a Cherokee Princess” are particularly unuseful.  What they more likely mean is that there was indeed some Native ancestry someplace in her line.  Cherokee has become a generic word like Kleenex.  It may also have meant that Indian heritage was claimed to cover much less desirable African heritage.  Institutionalized discrimination existed against any people of color in pre-1967 America, but Indians generally retained some rights that people of African ancestry did not.  Laws varied by state and time.  Take a look at my blog about Anti-Miscegenation Laws and when they were overturned.

Now, let’s look at DNA testing to see what it can do for you.

DNA Testing to Prove Native Ancestry

There are three types of DNA testing that you can do to prove Native Ancestry.  Two are very focused on specific family lines, and one is much more general.

  • Mitochondrial for your direct maternal line.
  • Y-line for your direct paternal line – if you are a male. Sorry ladies.
  • Autosomal to test your ethnic mix and one direct marker test for Native ancestors.

On a pedigree chart, these genealogical lines look like this:

adopted pedigree

You can see the path that the blue Y chromosome takes down the paternal line to the brother and the path the red mitochondrial DNA takes down the maternal line to both the brother and the sister.  Autosomal tests the DNA of all of the 16 ancestral lines shown here, but in a different sort of way.

Let’s look at each type of testing separately.

Y-Line DNA – For Paternal Line Testing for Males

The Y-line testing tests the Y chromosome which is passed intact from father to son with no DNA from the mother. This is the blue square on the pedigree chart. In this way, it remains the same in each generation, allowing us to compare it to others with a similar surname to see if we are from the same “Smith” family, for example, or to others with different surnames, in the case of adoption or Native heritage.  Native American genetics isn’t terribly different than adoptees in this situation, because different English surnames were adopted by various family members, into the late 1800s and sometimes into the early 1900s, depending on the location.

Y-line DNA can tell you whether or not you descend from a common male genealogically when compared to another testing participant.  Small mutations do take place and accumulate over time, and we depend on those so that we don’t all “look alike” genetically.  It can also tell you by identifying your deep ancestral clan, called a haplogroup, whether or not you descend from early Native Americans who were here before contact with Europeans.  For that matter, it can also tell you if you descend from those of African, European or Asian ancestry.

Scientists know today that there are only two primary haplogroups indicating deep ancestry that are found among Native American males who were here prior to contact with Indo-Europeans, and those haplogroups are C and Q3.  It is not accurate to say that all C and Q3 individuals exist only in the American Native population, but the American Native population is part of the larger group worldwide that comprises C and Q3.  We find some haplogroup C and Q3 in Europe but none in African populations, although we do learn more every single day in this infant science.

This sometimes becomes confusing, because the single most common male haplogroup among current Cherokee tribal members who have tested is R1b.  How can this be, you ask?  Clearly, one of three possibilities exists:

  1. The Cherokee (or those tribes who were assimilated into the Cherokee) adopted a European male into the tribe or a European male fathered a child that was subsequently raised as Cherokee.
  2. The R1b ancestor was not adopted into the tribe, maintained their European/American identity but married a Cherokee individual woman and their descendants are recognized as Cherokee today.
  3. There is some level of R1b admixture in the Native population that preceded contact with Europeans that we have not yet identified.

Because of the unique haplogroups for Native Americans who preceded European contact, Y-line is the only way to positively confirm that a specific line is or is not of Native American descent.  This obviously applies to all of the individuals in the pedigree chart who directly descend from the oldest known ancestor in this paternal line.

Y-line testing does not indicate anything about the contributions of the other ancestors in this family tree.  In other words, you could be 3/4th Native, with only the direct paternal line being European, and this test would tell you nothing at all about those other three Native lines.

When ordering DNA tests at Family Tree DNA, which is where I recommend that you test, everyone is encouraged to join projects.  There are several types of projects, but to begin with, you should join your surname project.  Not only does this group you with others whom you are likely to match, but this also assures that you receive the project based discounts.  I blogged about how to find and join relevant projects.

You can test at 12, 25, 37, 67 or 111 marker “locations” on the Y chromosome. I generally recommend 37 or 67 to begin which gives you enough to work with but isn’t terribly expensive.  At Family Tree DNA, you can always upgrade later, but it’s less expensive in total to test more initially.

Family Tree DNA provides significant tools for Y-line DNA as well as Mitochondrial DNA. At Family Tree DNA, for all their tests, you are provided with the e-mail addresses of your matches. At Ancestry and 23andMe, you contact matches through their internal message system. My experience has been that direct e-mails have a better response rate.

The person looking for Native Heritage will be most interested in their haplogroup designation.  If your haplogroup is either Q or C, you’ll want to join your haplogroup project, minimally, as well as other relevant Native American projects, and work with the administrators for further testing.  Remember, neither haplogroup Q nor C are always Native, so deeper testing may be in order.  You may also match others with confirmed Native heritage, including a tribe.

If the haplogroup is not Native, then you’ll have to take a look at possible reasons why.

One can never interpret non-Native haplogroup results of any one line to answer the much broader questions of, “do I have Native heritage”, “how much” and “where?”  What you can do at that point is to continue to test other lines in order to discover the identity of your Native American ancestor.

Obviously, the Y-line test is only for males. Ladies, I feel your pain. However, these next tests are for both sexes.

Mitochondrial DNA – For Direct Maternal Line Testing for Both Sexes

Mitochondrial DNA is inherited by all children from their mother only, with no admixture from the father. Women obtain their mitochondrial DNA from their mother, who got it from their mother, on up the line into infinity. This is the red circle on the right hand side of the pedigree chart. Like Y-line DNA, mitochondrial DNA is passed intact from one generation to the next, except for an occasional mutation that allows us to identify family members and family lines.

Unfortunately, it does not follow any surname. In fact the surname changes with every generation when women marry. This makes it more challenging to work with genealogically, but certainly not impossible. Because of the surname changes in every generation, there are no “surname” projects for mitochondrial DNA, per se, but there are other types of projects.  For example, the Mothers of Acadia project is using mitochondrial DNA to reconstruct the Acadian families including those of Native American heritage.

There are three levels of testing you can take for mitochondrial DNA at Family Tree DNA, which is where I recommend that you test. The mtDNA, the mtDNAPlus and the Full Sequence. The mtDNA test is a starter test that will provide you with a base haplogroup, but will leave people searching for Native ancestry needing a more complete test for full haplogroup identification confirming Native ancestry. I strongly recommend the full sequence test, but if the budget just won’t allow that, then the mtDNAPlus will do until you can afford to upgrade. Family Tree DNA is the only major lab that tests the full sequence region, plus, they have the largest matching data base in the industry.

To put this in perspective for you, the mtDNA and the mtDNAPlus tests both test about 10% of your mitochondrial DNA and the full sequence test tests all of your 16,569 mitochondrial locations. You can then compare them with other people who have taken any of those 3 tests.  Pricing for the mtDNAPlus is currently $139 and the full sequence is $199.

MtDNA testing is not as popular as Y-line testing because it’s more difficult to use genealogically as last names change every generation.  When you look at your matches, you have no idea whatsoever if you might be related to these people in a genealogically relevant time frame by looking at their last names.  Those who have invested the effort to collaboratively work on their mtDNA matches, assuming a full sequence match and a shared geographical history as well, have been pleasantly surprised by what they’ve found.

A haplogroup assigning deep ancestry is provided through mitochondrial testing, so like the Y-line, depending on the haplogroup assigned, you will know if your ancestors were here before European contact.  Maternal haplogroups that indicate Native heritage include A, B, C, D and X.  Like Y-line DNA testing, none of these haplogroups are exclusive to Native Americans, so a full sequence level test will be required to confirm a Native American subgroup.

After you receive your results, you can enter the mtDNA and mtDNAPlus portions into public data bases. There are no public data bases for the full sequence segment because there may be medical implications in some of those mutations, so they are not displayed publicly although they are compared privately within the Family Tree DNA data base. You will want to enter your data and check for matches at www.mitosearch.org (upload directly from your matches page at Family Tree DNA), www.smgf.org and www.ancestry.com, although beware of Ancestry’s accuracy issues.

Update: As of 2019, mitosearch and SMGF no longer exist and Ancestry no longer sells Y and mitochondrial DNA tests, having destroyed their database.

Testing the Y-line and mitochondrial DNA individually gives us a great deal of very specific information about 2 lines in your pedigree chart.  The best method of identifying Native American ancestors is indeed to test as many lines on your DNA pedigree chart using this methodology as possible.  Let’s take a minute to look at how to create a DNA pedigree chart.

DNA Pedigree Chart

If your Y-line and mitochondrial DNA have proven not to be Native, that doesn’t mean that the rest of your lines aren’t.

Let’s take a look at how to create a DNA pedigree chart so that you can focus your Y-line and mitochondrial DNA testing for other lines.

The purpose of a DNA pedigree chart is to provide guidance in terms of inheritance and also to provide a way of documenting your progress.  My chart is shown below, as an example.

DNA Pedigree

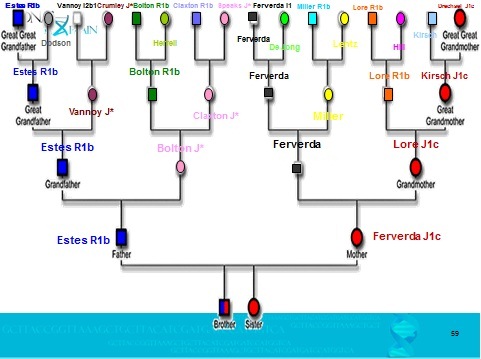
You can see the Y-line of my father and the mitochondrial line of my mother, on both ends of the pedigree chart.  At the top of each line, I have recorded the haplogroup information for each family.  Color coding each line helps in tracking descendants who would carry the DNA of the ancestor of that line.  For example, my mother’s father’s mother’s line is the yellow Miller line.  I need to find a daughter of my grandfather’s sisters, or their children, or their daughter’s children, to test for that mitochondrial DNA line.  Which reminds me, I need to call my cousin.  Family reunions, picnics and holidays are great for this type of thing.  Sadly, so are funerals.

I blogged about how to put together your own DNA pedigree chart. If you’re Native and adopted, then refer to the adoptee blog instead, or in addition.

But sometimes, we can’t find the right people in order to test, so we move to autosomal testing to help us fill in the blanks.

Autosomal Testing – For Both Sexes – The Rest of the Story 

Autosomal DNA testing tests all of your 23 pairs of chromosomes that you inherit from both of your parents. You get half of each chromosome from each parent. You can see this pattern on the pedigree chart, represented by all of the 16 genealogical lines. Therefore, as you move up that tree, you should have inherited about 25% of your DNA from each grandparent, about 12.5% of your DNA from each great-grandparent, as have all of their other great-grandchildren.

Therefore beginning with your parents, you carry the following approximate amount of DNA from each of these ancestors. I say approximate, because while you do receive exactly 50% of your DNA from each parent, there is no guarantee that their parents DNA was admixed in your parents such that you receive exactly 25% from each grandparent, but it’s close.  You can see the percentages in the chart below.

Generation Relationship % of Their DNA You Carry

1

Parents

50

2

Grandparents

25

3

Great-grandparents

12.5

4

GG-grandparents

6.25

5

GGG-grandparents

3.125

6

GGGG-grandparents

1.56

7

GGGGG-Grandparents

0.78

Given this chart, if the Native percentage is back beyond 6 generations and drops below the 1% threshold, it’s extremely difficult to discern today.

Autosomal testing will pick up relationships reliably back to about the 6th or 7th generations, and sporadically beyond that.

Autosomal testing provides you minimally with two things.  First, with a list of “cousin matches” by percentage and estimated relationship.  Second, percentages of ethnicity.  It’s this second part that’s most important for the person seeking to prove Native American heritage.

Percentages of Ethnicity

As the field of genetic genealogy has moved forward, research has begun to indicate that certain autosomal markers are found in higher or lower frequencies in different ethnic populations.

For example, if someone has the Duffy Null allele, or genetic marker, we know they positively have African admixture.  We don’t know how much African admixture, or from which line, or when that individual with African admixture entered their family tree, but we know for sure they existed.

Attempting to determine the population frequency of varying markers and what that means relative to other populations is the key to this analysis.  Few markers are simply present or absent in populations, but are found in varying frequencies.  Some populations are widely studied in the research literature, and others are virtually untouched.  Thousands have only been recently discovered as part of the National Geographic, Genographic project.

The process of compiling this information in a meaningful manner so that it can be analyzed is a formidable task, as the information is often found in nearly inaccessible academic and forensic research publications.  It’s difficult to determine sometimes if the DNA analysis of 29 individuals in a small village in northern Italy is, for example, representative of that village as a whole, of northern Italy, or more broadly for all of Italy.  Is it representative of Italy today or Italy historically?  These and other similar questions have to be answered fully before the data from autosomal testing can be useful and reliable.

Let’s take a look at all 3 of the contemporary autosomal tests and what they have to offer.

Note: as of 2019, MyHeritage is also a major player in the autosomal DNA testing space.

Family Tree DNA

Family Tree DNA sells the Family Finder test. Right now it is priced at $79 or bundled with attractive pricing with either the Y-line or mitochondrial DNA tests. I often like to use this tool in conjunction with the Y-line and mitochondrial DNA tests to see, if you match someone closely, whether you are actually related to them in a recent timeframe or if it is further back. Family Tree DNA is the only one of the autosomal testing companies that has the ability to do this type of advanced comparison.  Compared to 23andMe and Geno 2.0, they are the only ones to offer traditional Y-line and mitochondrial DNA testing which provides individual marker results and matches.

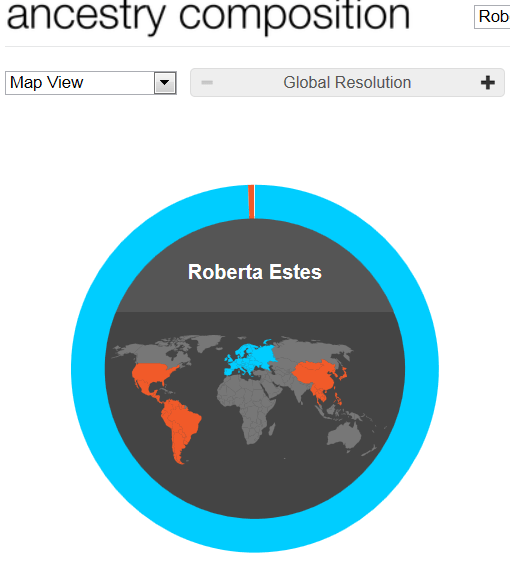
In addition to a list of autosomal matches, you will receive your breakdown of ethnicity, by percent.  The results below are for the same man with Native ancestry whose Geno 2.0 results are shown in the Geno 2.0 – First Peek blog.

native pop finder

You can read more about the Family Tree DNA autosomal product on their FAQ.

23andMe

Another company that sells autosomal testing is http://www.23andme.com. In addition to a list of cousins, you also receive admixture percentages, and their specialty, health traits.  You also receive a paternal and maternal haplogroup, but with no markers for personal comparison.  These Y-line and mitochondrial results are not as accurate at the Geno 2.0 nor the Family Tree DNA Y-line and mitochondrial DNA full sequence tests.

Be aware that while people who test at Family Tree DNA are interested in genealogy, the typical person at 23andMe tested for the health portion, not the genealogy portion, and may not answer contact requests or may know very little about their family history.

Right now, their test is $99, and you can download your results and upload them to Family Tree DNA for an additional $89, making the total price similar to the Family Tree DNA test. However, you need to be somewhat technically savvy to complete the download/upload process.

23andMe recently released a new version of their software which added quite a bit of resolution after years of being woefully behind.  Native American wasn’t even a category previously.

Ancestry

Ancestry.com recently introduced an autosomal test.  You receive matches and ethnicity percentages.  However, their ethnicity percentages have significant issues and I would not recommend them at this time.  Their cousin matches come with no analysis tools.  So for now, just skip Ancestry and concentrate on the other resources.

One Last Autosomal Test

One marker value in particular, known as D9S919 is present in about 30% of the Native people.  The value of 9 at this marker is not known to be present in any other ethnic group, so this mutation occurred after the Native people migrated across Beringia into the Americas, but long enough ago to be present in many descendants.  You can test this marker individually at Family Tree DNA, which is the only lab that offers this test.  If you have the value of 9 at this marker, it confirms Native heritage, but if you don’t carry 9, it does NOT disprove Native heritage.  After all, many Native people don’t carry it.

To order this test, for existing Family Tree DNA clients, click on the “Order Upgrade” orange button on the right hand side of your personal page, then on “Advanced Test”, then enter “autosomal” in the drop down box, then you will see the list below. D9S919 is the last one and it costs $15.  There may be a $10 one time transfer fee as well if your DNA sample is not in the Houston lab.

native d9s919 order

Swimming in Many Pools

As you can see there are lots of tools available to you that can be used individually or in conjunction with each other.  Like anything else, the more work and effort you are willing to devote to the search, the more likely you are to be successful.

Most people test their Y-line and mitochondrial DNA, not just for Native ancestry, but to learn more about the lines they can test for themselves without reaching out to other family members.

Use your DNA pedigree chart to plan who to ask in your extended family to test for which lines.

Plan to test with multiple autosomal testing companies.  Autosomal testing in particular is still in its infancy. I like to use the results of multiple companies, especially when you are dealing with small amounts of admixture.  They use different markers, combinations, analysis tools and reference populations, so you can expect slightly different results.  One company may pick up slight minority admixture while another may not.  This has happened repeatedly with both my Native and African minority admixture.

GedMatch

After you obtain your results from either Family Tree DNA or 23andMe, you’ll want to download your raw data results and then upload the file to www.gedmatch.com. This is a privately run “donation” site, not associated with any of the testing companies, meaning there is no subscription or fee to use the tools, but they do appreciate and are funded by donations.

After uploading your results you can utilize several admixture tools to compare and contrast your results.

Getting Help

If you’re struggling with working through your family possibilities for who to test, I do offer a DNA Test Plan service.

If you would like a Personalized DNA Report for Y-line or mitochondrial results, those are available as well.

If you have what amounts to a quick question that I can answer in less than an hour, including prep, I offer the Quick Consult service.

For more extensive consulting, contact me.  You can see my services here.

In Summary

Finding our Native ancestors is a way to pay homage to their lives and to the culture that was stripped from their descendants, ironically, by using their own DNA that has been gifted from them to us.  Native people, after contact with Europeans were marginalized, and that’s the best that can be said.  Many were killed, either intentionally or by European diseases, or enslaved.  The results are that Native people left few if any individual records and those that might be available often can’t be identified or linked to them personally.  For those who cannot unearth their Native ancestry using conventional genealogical means, genetic testing is the last hope left.  Fortunately, the tools and our knowledge improve every day.  We’re making great strides with what we can do, enlarging what was a pinhole into a keyhole, allowing us to peer into the past.  So, click your heels, order your tests and let’s see where your DNA takes you.

______________________________________________________________

Disclosure

I receive a small contribution when you click on some of the links to vendors in my articles. This does NOT increase the price you pay but helps me to keep the lights on and this informational blog free for everyone. Please click on the links in the articles or to the vendors below if you are purchasing products or DNA testing.

Thank you so much.

DNA Purchases and Free Transfers

Genealogy Services

Genealogy Research

New Worldview at 23andMe

23andMe released a new version of their Ancestry Composition – and guess what – my Native Ancestry is shown for the first time.  Yahoo!  It was previously shown at 23andMe as Asian, and the chromosomal locations have changed somewhat as well.

23andMe has greatly improved their product offering, moving from a significantly outdated 3 step ethnicity approach, European, African and Asian, to a multi-tiered, regional platform.

Let’s take a look at what we have today.

Here’s me in my new worldview at 23andMe under the Ancestry Composition tab.  The regions where I have ancestry are brightly colored.

rje world 23andme

Looking at my ethnic breakdown, shown on the right on my page, but shown below here, you can see that I’m 99.4% European, 0.5% Native American and 0.1% unassigned.

rje world 23andme 2

The worldwide breakdown into regions is quite interesting as well.

rjeregion23andme

By highlighting any region item, above, it shows you the corresponding region on your worldview, below.  Pretty cool.

rjeregion23andme2

They’ve updated the Chromosome View as well.  Previously, my Chromosome View looked like this:

rjechromosome view old 23andme

Now, it looks like this, reflecting the new regional ethnicity information.

rjechromosome view 23andme new

Another setting that you can manipulate is found in the drop down box in the upper right corner. It has 3 options, standard estimate, conservative estimate and speculative.  In my case, this changes the results very little, the Native moving around a bit, but the regions within Europe do change.  Be sure to take a look at all of these.  The drop down box is easy to miss.

One thing I do really like about this new rollout is that the X chromosome is included.  You can see it at the bottom of the list.  This is new and has been promised for a long time.

One feature that I would very much like to see is the ability to determine which, if any, of my matches actually match me on the segments determined to be Native American.  I realize that not everyone at 23andMe is interested in genealogy, but if you could contact them and say, “Hey, we match on my Native segment – let’s see if we can find some common ancestry,” it might generate enough interest to garner a response.  I would like to find a way to use these results more effectively.  I think there is a lot of unrecognized potential just waiting to be harvested.

All in all, a significant step forward for 23andMe.  For me, not a lot of new information.  I discovered that I have some Native genes on chromosome 2 in addition to chromosome 1.  My African ancestry picked up elsewhere is missing here.  Fortunately, my Native American heritage is now classified as such, and not Asian.  However, on the speculative view, I still have a smidgen of Asian, likely from the Native American heritage.  I really like the 3 choices in how to display results, conservative, standard and speculative.

As soon as the National Geographic Geno 2.0 ethnicity information is available, I’ll be comparing all the results from the various companies against my known genealogical heritage and taking a look at all of those results combined.  Stay tuned….things are really getting interesting!

______________________________________________________________

Disclosure

I receive a small contribution when you click on some of the links to vendors in my articles. This does NOT increase the price you pay but helps me to keep the lights on and this informational blog free for everyone. Please click on the links in the articles or to the vendors below if you are purchasing products or DNA testing.

Thank you so much.

DNA Purchases and Free Transfers

Genealogy Services

Genealogy Research

Family Tree DNA Conference 2012 – Native American Focus Meeting

Wow.  Talk about drinking from a firehose.  From the minute we arrived in the lobby Friday afternoon until we got back to the airport Sunday evening, we barely had time to breathe.

This was an amazing conference in many ways.  I’ll try to hit the high points in a separate blog, but in this posting, I want to cover the Native American Focus meeting and talk a little bit about the interests of the different attendees.

The first event, at 4 on Friday afternoon, was a small meeting of people who are admins or have a specific interest in Native American heritage.   Rebekah Canada, haplogroup Q project administrator, coordinated this meeting and a hearty thank you goes to her for her efforts.  We have never attempted this type of event before, and we all agreed, we need to do it again.

Unfortunately, many projects that are focused on or include Native results did not have a project administrator here and were not represented.

Peter Roberts is the administrator of the Bahamas project.  The Bahamas are rich with Native history, but evidence they existed in the DNA record is slim.  The Lucayan Indians were removed from the Island by the Spanish.  While we know they existed, their results, surprisingly, are not showing up directly in the yline or mtdna results.  We also know that some Seminoles arrived later from Florida and others came from the mainland as well.  Low levels of Native heritage are showing up in autosomal testing.

David Pike discovered his Native heritage quite by accident.  His father turned out to be 3.4% Native.  He believes it is probably MicMac (Mi’kmaq) or perhaps Beothuk, a now extinct tribe, in Newfoundland, but is still researching.  Dave mentioned an opportunity for tribal membership in Canada for those who can prove Micmac heritage and will be providing that information.  I will blog it when that arrives.

Marie Rundquist is the administrator of the AmerIndian Ancestors out of Acadia project which began in 2006.  I love this project, somewhat from a selfish perspective, since I’ve connected so many of my Acadian ancestors, and Native ancestors, through this project.  This is also one the most successful mitochondrial DNA projects, if not the most successful, there is.  Marie’s project has served to prove or disprove several Native rumors, and has found other Native people quite by accident.  She wrote a book, titled Revisiting Anne Marie and I’ve blogged about her success with the Doucet results.  This project is not just for Acadians in Canada, but reaches to Louisiana, and families with Acadian heritage outside of the primary relocation areas.

Kathy Johnson’s cousin came back with a haplogroup Q results.  Subsequent testing revealed 4 new SNPS in her sample.  This Pembrook family is believed to be from the Mohawk River area in New York.

Georgia and Tom Bopp, administrators of the Hawaii project, from Hawaii, attended.  Frankly, I had never thought about them and Native ancestry, but certainly Hawaii did have a Native population.  They had a very interesting situation where one of their early tester’s mitochondrial results came back as haplogroup B.  They were told they were Native American, then they were told they were Polynesian.  Native was reasonable, but Polynesian somewhat confounding given that their ancestor was a slave in Maryland.  Eventually, it was discovered their maternal ancestor was from Matagascar.  Georgia will send the information and we’ll do a blog about this in the future.  How very interesting.

Rob and Dyann Noles administer the Lumbee Tribe and Wiregrass Georgia projects.  Rob maintains a data base of over 250,000 individuals related to these projects.  While the Lumbee project is named as such, it is not endorsed by the Lumbee tribe itself.  However, numerous individuals descended from those who are early tribal founders have tested.

As haplogroup Q project administrator, Rebekah has been instrumental in the ongoing testing of haplogroup Q individuals.  Many members have been SNP tested and more than a few have participated in the WTY (Walk the Y)) which has resulted in many new haplogroup subgroups being discovered.  We’ve made more progress in the past two years than in the previous 10 in haplogroup Q.  Someday, I hope we’ll be able to identify at least members of different Native language groups by results.  Maybe I’m dreaming here, but goals are good!

I shared my work with the Native Heritage project and my ongoing transcriptions into the Native Names data base.  We now have over 8,000 different surnames and well over 30,000 people, and I’m no place near “done.”  Of course, it’s always a great day when I find a proven Native surname of someone who has tested Native in our haplogroup Q project.

We discussed the reluctance of recognized tribes to test and their concerns.  We all respect their decisions, although from a genetic genealogy perspective, we are glad when descendants test.

I suspect that many of the Native genetic lines have become extinct.  The Native people, aside from having to survive in a harsh, cold climate upon arriving from Asia, have had to endure multiple genocidal attempts (Native as well as European) in addition to many epidemics.  Some epidemics wiped out entire tribes.  In 1838, a smallpox epidemic took half of the powerful Cherokee.  No one was immune.  That combined with intermarriage, assimilation, and adoption through either traditional cultural means or kidnapping have caused the “Native” DNA results to not always be what we expect.

We are hopeful that ancient DNA will shed a light on extinct lines as well as answer the ever-present question about whether European or perhaps African DNA was present in the Native population before the traditional dates of European contact

I want to thank everyone who attended for their participation and sharing, and encourage anyone else who is interested to let either Rebekah or I know.

______________________________________________________________

Disclosure

I receive a small contribution when you click on some of the links to vendors in my articles. This does NOT increase the price you pay but helps me to keep the lights on and this informational blog free for everyone. Please click on the links in the articles or to the vendors below if you are purchasing products or DNA testing.

Thank you so much.

DNA Purchases and Free Transfers

Genealogy Services

Genealogy Research

Native American DNA News

It’s a good DNA day for Native American DNA research.

Yesterday, I was talking to Bennett Greenspan at Family Tree DNA.  He knows of my interest in Native heritage.  Our conversation turned to the new Geno 2.0 chip, now called the GenoChip, and the expected ethnicity results relative to Native heritage.

It turns out that Bennett and Spencer Wells had just been talking about the same thing.  Spencer said that the GenoChip is exceptionally good at picking up Native American ancestry and that it’s one of the key features built into the autosomal SNPs they chose and the resulting admixture analyses.  Spencer says that as long as the admixture is above 2%, we’ll see it.

Two percent equates to between 5 and 6 generations.

I can’t wait to compare Geno 2.0 results of people who previously tested at 23andMe and with Family Tree DNA’s Family Finder, and especially those who showed the Middle Eastern percentage with the Family Finder test.

This information dovetails nicely with a new paper to be published in the American Journal of Human Genetics, the February 10th edition.

In this new paper, Dr. Theodore Schurr has used Y and mitochondrial DNA evidence collected from 500 Siberian people living in remote villages and more than 2500 Native Americans from Canada, the US and Mexico.  The paper confirms the homeland of the Native people in the Americans was originally the Altay Mountains in Siberia (photo above).  This isn’t new news, but it’s nice to have confirmation and it will be interesting to see the details in the paper.

In an article published this week by the National Geographic Society titled “Is this Russian Landscape the Birthplace of Native Americans?”, they mention that there is one marker in a male Y-line that mutated about 18,000 years ago and is still carried by Native men today.

http://news.nationalgeographic.com/news/2012/01/120203-native-americans-siberia-genes-dna-science/

I know that many recently discovered Y-line SNPs were included for haplogroup Q on the new GenoChip.  I’m very hopeful that the DNA of the Siberian people was vetted for new autosomal SNPs and included as well.  It’s likely, as Dr. Schurr, in addition to his work at the University of Pennsylvania is also the North American Director for the Genographic Project.

______________________________________________________________

Disclosure

I receive a small contribution when you click on some of the links to vendors in my articles. This does NOT increase the price you pay but helps me to keep the lights on and this informational blog free for everyone. Please click on the links in the articles or to the vendors below if you are purchasing products or DNA testing.

Thank you so much.

DNA Purchases and Free Transfers

Genealogy Services

Genealogy Research

Native and African American Houses – University of Illinois at Urbana-Champaign

This week I was honored to speak at the University of Illinois at Urbana-Champaign.  These speaking engagements were different than anything I’ve ever participated in.  I’ve done quite a bit of university speaking, but generally conferences.  These events were different because the students themselves from these two Houses invited me and funded my visit.  To say I felt a great obligation to find a way to connect to them is an understatement.

Normally my audience consists of genealogists, and sometimes civic groups, but generally not young people ranging in age from 18 to 22 or so, plus grad students.  These folks were born in the 1990s for the most part and ancient history to them is anything before cell phones.  They were only about 10 years old when social networking in the form of My Space was launched, so they’ve never know a world without the internet, electronic gadgetry and social networking.  I was extremely glad I had my two blogs to offer them.

I thought about how they might perceive DNA and genealogy, and I changed the presentation entirely, approaching it from a different perspective – that of personal genetics.  While this new field started in 1999 as a genealogical endeavor (thank you Bennett Greenspan), it has moved far from its original genesis.  Today we have a toolbox full of tools that can answer different questions for us, in various ways.  For these bright young people full of potential, personal genetics will be with them their entire lives and it won’t be a frontier like it is for us, but a way of life.  My presentation was entitled “The Gift of You” and it discussed genealogy of course, but deep ancestry, health, ethnicity and “cousinship” using fun examples.  I also passed out candy when I got answers, which helped a lot:)  Food, the most common denominator.

While all 4 sessions were sponsored by both the African American and Native American Houses, 2 sessions were held at the Bruce B. Nesbitt African American Cultural Center, 1 at the Native American House and the final presentation in a larger auditorium venue.  All sessions were open to all students and the public as well, and indeed were attended by a wide variety of people with very interesting and diverse backgrounds.

I was particularly impressed with the regular luncheon, with speakers, held by the African American House, entitled “Food for the Soul.”  I wish I lived close enough to attend as many of the topics are very interesting.  This event was very well attended.

After each of the 4 sessions, several people stayed and discussed various aspects of genetic testing, genealogy and career paths.

I can’t even begin to express how hopeful this trip made me.  These young people who attended these sessions are bright and forward thinkers.  They are involved in supportive and nurturing programs through the two Houses as well as the academic curriculum at the University of Illinois.  They are encouraged to reach beyond the known horizons.  And yes, some of them are interested in genealogy too.  I’m hopeful that there will be someone to pass that torch to someday!

I want to share with you a conversation I had with one young man who stayed after the session at the Native American House.  He is mixed Caucasian, Peruvian, Chinese and Jewish, born in California, an extremely culturally diverse place.  He is a graduate student in the Communications/Medical program meaning at the end of 8 long years, he comes out the other end with an MD degree and a PhD.  And he is bright, very, very bright, compassionate and pleasant.  I don’t know where he’s going to practice, but I want him to be my doctor!

He shared with me part of his story.  Between his undergrad and graduate school, he embarked on a journey of discovery.  He tracked his grandmother’s life backwards. He began at her grave in Israel, journeyed through China where they sought refuge from the holocaust, and where his grandmother’s mother died of a “female disease.”  From there he went back to Germany where the family had escaped the holocaust.  During this time he discovered that his mother and he both carry the BRCA1 gene which produces a hereditary breast-ovarian cancer syndrome.  Another family member indeed has this disease today.  His profound interest in his family history and this mutation led to a discussion about epigenetics and the ENCODE project which revealed that what was once considered to be junk DNA isn’t junk afterall.  And then, the question:

“What if we could use epigenetics to turn OFF the BRCA1 gene?”

I told him, I’m way beyond my level of expertise, but the fact that this extremely talented young man is pondering this question, and has a very personal impetus to answer it is one of the most promising and hopeful events I’ve witnessed in a very long time.  This truly is the gift of our ancestors, in so many unseen and unspoken ways.

The art at the beginning of this article, titled “Elevator”, by Sol Aquino, 2003 (acrylic on canvas) featured on the SACNAS brochure I picked up at the Native American House portrays this connection is a most profound way.

During these two days, I got to spend time with Rory James, the Director of the Bruce B. Nesbitt Center, and with Jamie Singson, the Director of the Native American House, and the staff and volunteer students at both facilities.  I was extremely impressed with the knowledge of both of these gentlemen and their heartfelt concern for the students, their education and their futures.  I know that these men and their staff will shepherd these students and provide them with ongoing opportunities to learn about their history and how it connects with their futures as they complete their more structured academic studies.  I wish facilities like this had been in place when I was a student.

The attendees were extremely diverse, in terms of racial and cultural makeup, in terms of student versus community members, age, and in terms of their interests relative to personal genetics.  Their stories were both amazing and inspirational.

I think that Jamie Singson summed it up perfectly at the end of the final session as we walked through the cool evening air back to the Native American House from the auditorium.  People had stayed for an additional couple of hours after the presentation and a small group of about 5 of us had a very enlightening and lovely discussion.  Jamie said, “What I take away from this is how much everyone wants to belong and to find the place where they fit in.”

______________________________________________________________

Disclosure

I receive a small contribution when you click on some of the links to vendors in my articles. This does NOT increase the price you pay but helps me to keep the lights on and this informational blog free for everyone. Please click on the links in the articles or to the vendors below if you are purchasing products or DNA testing.

Thank you so much.

DNA Purchases and Free Transfers

Genealogy Services

Genealogy Research

Lenny Trujillo: The Journey of You

In the fall of 2010, Lenny Trujillo embarked on a journey unaware that he was going anyplace.  That was the journey to discover himself, his ancestry….and what a journey it has been.  Lenny was unique, very unique.

After Lenny’s results came back, he purchased a DNA Report.  In the process of analyzing his DNA, I realized what an opportunity was at hand.  Lenny was Native American  and his Y DNA likely harbored new SNPs that would identify a new sub-haplogroup, and we needed to take a look.  When I wrote Lenny and asked if he would consider a Walk the Y (WTY) test, he told me that he had retired that very day.  My heart sunk, because I presumed that meant “no”, that he’d be making financial adjustments like so many retirees.  But then Lenny went on to say that he wanted to proceed in order to leave a legacy for his grandchildren.

And what a legacy Lenny has to leave them.  Lenny made history and advanced science.  Indeed, by comparing Lenny’s DNA to another European man in haplogroup Q1a3, 7 new SNPs were discovered. I wrote a paper about this process and Lenny’s contribution.  This was a red letter day for Native American ancestry, as well as for Lenny, delivered as fate would have it, Christmas week.

However, Lenny’s remarkable story doesn’t end there.  That’s only the beginning.  But, I’ll let Lenny tell his own story, in his own words.  He wrote an article for the Los Angeles Beat which was published today.   His story is so heartwarming and inspirational and the records that document his Native ancestry that Lenny has been able to find have been absolutely amazing.

Lenny also tells his story on the Family Tree DNA YouTube Channel in various segments for those who haven’t yet seen Family Tree DNA’s infomercial.

So whether you read it or watch it, or both, come along, share Lenny’s journey, and enjoy!

______________________________________________________________

Disclosure

I receive a small contribution when you click on some of the links to vendors in my articles. This does NOT increase the price you pay but helps me to keep the lights on and this informational blog free for everyone. Please click on the links in the articles or to the vendors below if you are purchasing products or DNA testing.

Thank you so much.

DNA Purchases and Free Transfers

Genealogy Services

Genealogy Research