2013 Family Tree DNA Conference Day 1

This article is probably less polished than my normal articles.  I’d like to get this information out and to you sooner rather than later, and I’m still on the road the rest of this week with little time to write.  So you’re getting a spruced up version of my notes.  There are some articles here I’d like to write about more indepth later, after I’m back at home and have recovered a bit.

Max Blankfield and Bennett Greenspan, founders, opened the conference on the first day as they always do.  Max began with a bit of a story.

13 years ago Bennett started on a quest….

Indeed he did, and later, Bennett will be relating his own story of that journey.

Someone mentioned to Max that this must be a tough time in this industry.  Max thought about this and said, really, not.  Competition validates what you are doing.

For competition it’s just a business opportunity – it was not and is not approached with the passion and commitment that Family Tree DNA has and has always had.

He said this has been their best year ever and great things in the pipeline.

One of the big moves is that Arpeggi merged into Family Tree DNA.

10th Anniversary Pioneer Awards

Quite unexpectedly, Max noted and thanked the early adopters and pioneers, some of which who are gone now but remain with us in spirit.

Max and Bennett recognized the administrators who have been with Family Tree DNA for more than 10 years.  The list included about 20 or so early adopters.  They provided plaques for us and many of us took a photo with Max as the plaques were handed out.

Plaque Max and Me 2013

I am always impressed by the personal humility and gratitude of Max and Bennett, both, to their administrators.  A good part of their success is attributed, I’m sure, to their personal commitment not only to this industry, but to the individual people involved.  When Max noted the admins who were leaders and are no longer with us, he could barely speak.  There were a lot of teary eyes in the room, because they were friends to all of us and we all have good memories.

Thank you, Max and Bennett.

The second day, we took a group photo of all of the recipients along with Max and Bennett.

With that, it was Bennett’s turn for a few remarks.

Bennett remarks

Bennett says that having their own lab provides a wonderful environment and allows them to benchmark and respond to an ever changing business environment.

Today, they are a College of American Pathologists certified lab and tomorrow, we will find out more about what is coming.  Tomorrow, David Mittleman will speak about next generation sequencing.

The handout booklet includes the information that Family Tree DNA now includes over 656,898 records in more than 8,700 group projects. These projects are all managed by volunteer administrators, which in and of itself, is a rather daunting number and amount of volunteer crowd-sourcing.

Session 1 – Amy McGuire, PhD, JD – Am I My Brother’s Keeper?

Dr. McGuire went to college for a very long time.  Her list of degrees would take a page or so.  She is the Director of the Center for Medical Ethics and Health Policy at Baylor College of Medicine.

Thirteen years ago, Amy’s husband was sitting next to Bennett’s wife on an airplane and she gave him a business card.  Then two months ago, Amy wound up sitting next to Max on another airplane.  It’s a very small world.

I will tell you that Amy said that her job is asking the difficult questions, not providing the answers.  You’ll see from what follows that she is quite good at that.

How is genetic genealogy different from clinical genetics in terms of ethics and privacy?  How responsible are we to other family members who share our DNA?

What obligations do we have to relatives in all areas of genetics – both clinical, direct to consumer that related to medical information and then for genetic genealogy.

She referenced the article below, which I blogged about here.  There was unfortunately, a lot of fallout in the media.

Identifying Personal Genomes by Surname Inference – Science magazine in January 2013.  I blogged about this at the time.

She spoke a bit about the history of this issue.

Mcguire

In 2004, a paper was published that stated that it took only 30 to 80 specifically selected SNPS to identify a person.

2008 – Can you identify an individual from pooled or aggregated or DNA?  This is relevant to situations like 911 where the DNA of multiple individuals has been mixed together.  Can you identify individuals from that brew?

2005 – 15 year old boy identifies his biological father who was a sperm donor.  Is this a good thing or a bad thing?  Some feel that it’s unethical and an invasion of the privacy of the father.  But others feel that if the donor is concerned about that, they shouldn’t be selling their sperm.

Today, for children conceived from sperm donors, there are now websites available to identify half-siblings.

The movement today is towards making sure that people are informed that their anonymity may not be able to be preserved.  DNA is the ultimate identifier.

Genetic Privacy – individual perspectives vary widely.  Some individuals are quite concerned and some are not the least bit concerned.

Some of the concern is based in the eugenics movement stemming from the forced sterilization (against their will) of more than 60,000 Americans beginning in 1907.  These people were considered to be of no value or injurious to the general population – meaning those institutionalized for mental illness or in prison.

1927 – Buck vs Bell – The Supreme court upheld forced sterilization of a woman who was the third generation institutionalized female for retardation.  “Three generations of imbeciles is enough.”  I must say, the question this leaves me with is how institutionalized retarded women got pregnant in what was supposed to be a “protected” environment.

Hitler, of course, followed and we all know about the Holocaust.

I will also note here that in my experience, concern is not rooted in Eugenics, but she deals more with medical testing and I deal with genetic genealogy.

The issues of privacy and informed consent have become more important because the technology has improved dramatically and the prices have fallen exponentially.

In 2012, the Nonopore OSB Sequencer was introduced that can sequence an entire genome for about $1000.

Originally, DNA data was provided in open access data bases and was anonymized by removing names.  The data base from which the 2013 individuals were identified removed names, but included other identifying information including ages and where the individuals lived.  Therefore, using Y-STRs, you could identify these families just like an adoptee utilizes data bases like Y-Search to find their biological father.

Today, research data bases have moved to controlled access, meaning other researchers must apply to have access so that their motivations and purposes can be evaluated.

In a recent medical study, a group of people in a research study were informed and educated about the utility of public data bases and why they are needed versus the tradeoffs, and then they were given a release form providing various options.  53% wanted their info in public domain, 33 in restricted access data bases and 13% wanted no data release.  She notes that these were highly motivated people enrolled in a clinical study.  Other groups such as Native Americans are much more skeptical.

People who did not release their data were concerned with uncertainly of what might occur in the future.

People want to be respected as a research participant.  Most people said they would participate if they were simply asked.  So often it’s less about the data and more about how they are treated.

I would concur with Dr. McGuire on this.  I know several people who refused to participate in a research study because their results would not be returned to them personally.  All they wanted was information and to be treated respectfully.

What  the new genetic privacy issues are really all about is whether or not you are releasing data not just about yourself, but about your family as well.  What rights or issues do the other family members have relative to your DNA?

Jim Watson, one of the discoverers of DNA, wanted to release his data publicly…except for his inherited Alzheimer’s status.  It was redacted, but, you can infer the “answer” from surrounding (flanking regions) DNA.  He has two children.  How does this affect his children?  Should his children sign a consent and release before their father’s genome is published, since part of it is their sequence as well? The academic community was concerned and did not publish this information.  Jim Watson published his own.

There is no concrete policy about this within the academic community.

Dr McGuire then referenced the book, “The Immortal Life of Henrietta Lacks”.  Henrietta Lacks was a poor African-American woman with ovarian cancer.  At that time, in the 1950s, her cancer was considered “waste” and no release was needed as waste could be utilized for research.  She was never informed or released anything, but then they were following the protocols of the time.  From her cell line, the HeLa cell line, the first immortal cell line was created which ultimately generated a great deal of revenue for research institutes. The family however, remained impoverished.  The genome was eventually fully sequenced and published.  Henrietta Lacks granddaughter said that this was private family information and should never have been published without permission, even though all of the institutions followed all of the protocols in place.

So, aside from the original ethics issues stemming from the 1950s – who is relevant family?  And how does or should this affect policy?

How does this affect genetic genealogy?  Should the rules be different for genetic genealogy, assuming there are (will be) standard policies in place for medical genetics?  Should you have to talk to family members before anyone DNA tests?  Is genetic information different than other types of information?

Should biological relatives be consulted before someone participates in a medical research study as opposed to genetic genealogy?  How about when the original tester dies?  Who has what rights and interests?  What about the unborn?  What about when people need DNA sequencing due to cancer or another immediate and severe health condition which have hereditary components.  Whose rights trump whose?

Today, the data protections are primarily via data base access restrictions.

Dr. Mcguire feels the way to protect people is through laws like GINA (Genomic Information Nondiscrimination Act) which protects people from discrimination, but does not reach to all industries like life insurance.

Is this different than people posting photos of family members or other private information without permission on public sites?

While much of Dr. McGuire’s focus in on medical testing and ethics, the topic surely is applicable to genetic genealogy as well and will eventually spill over.  However, I shudder to think that someone would have to get permission from their relatives before they can have a Y-line DNA test.  Yes, there is information that becomes available from these tests, including haplogroup information which has the potential to make people uncomfortable if they expected a different ethnicity than what they receive or an undocumented adoption is involved.  However, doesn’t the DNA carrier have the right to know, and does their right to know what is in their body override the concerns about relatives who should (but might not) share the same haplogroup and paternal line information?

And as one person submitted as a question at the end of the session, isn’t that cat already out of the bag?

Session 2 – Dr. Miguel Vilar – Geno 2.0 Update and 2014 Tree

Dr. Vilar is the Science manager for the National Geographic’s Genographic Project.

“The greatest book written is inside of us.”

Miguel is a molecular anthropologist and science writer at the University of Pennsylvania. He has a special interest in Puerto Rico which has 60% Native mitochondrial DNA – the highest percentage of Native American DNA of any Caribbean Island.

The Genographic project has 3 parts, the indigenous population testing, the Legacy project which provides grants back to the indigenous community and the public participation portion which is the part where we purchase kits and test.

Below, Dr. Vilars discussed the Legacy portion of the project.

Villars

The indigenous population aspect focuses both on modern indigenous and ancient DNA as well.  This information, cumulatively, is used to reconstruct human population migratory routes.

These include 72,000 samples collected 2005-2012 in 12 research centers on 6 continents.  Many of these are working with indigenous samples, including Africa and Australia.

42 academic manuscripts and >80 conference presentations have come forth from the project.  More are in the pipeline.

Most recently, a Science paper was published about the spread of mtDNA throughout Europe across the past 5000 years.  More than 360 ancient samples were collected across several different time periods.  There seems to be a divide in the record about 7000 years ago when several disappear and some of the more well known haplogroups today appear on the scene.

Nat Geo has funded 7 new scientific grants since the Geno 2.0 portion began for autosomal including locations in Australia, Puerto Rico and others.

Public participants – Geno 1.0 went over 500,000 participants, Geno 2.0 has over 80,000 participants to date.

Dr. Vilar mentioned that between 2008 and today, the Y tree has grown exponentially.  That’s for sure.  “We are reshaping the tree in an enormous way.”  What was once believed to very homogenous, but in reality, as it drills down to the tips, it’s very heterogenous – a great deal of diversity.

As anyone who works with this information on a daily basis knows, that is probably the understatement of the year.  The Geno 2.0 project, the Walk the Y along with various other private labs are discovering new SNPs more rapidly than they can be placed on the Y tree.  Unfortunately, this has led to multiple trees, none of which are either “official” or “up to date.”  This isn’t meant as a criticism, but more a testimony of just how fast this part of the field is emerging.  I’m hopeful that we will see a tree in 2014, even if it is an interim tree. In fact, Dr. Vilars referred to the 2014 tree.

Next week, the Nat Geo team goes to Ireland and will be looking for the first migrants and settlers in Ireland – both for Y DNA and mitochondrial DNA.  Dr. Vilars says “something happened” about 4000 years ago that changed the frequency of the various haplogroups found in the population.  This “something” is not well understood today but he feels it may be a cultural movement of some sort and is still being studied.

Nat Geo is also focused on haplogroup Q in regions from the Arctic to South America.  Q-M3 has also been found in the Caribbean for the first time, marking a migration up the chain of islands from Mexico and South America within the past 5,000 years.  Papers are coming within the next year about this.

They anticipate that interest will double within the next year.  They expect that based on recent discoveries, the 2015 Y tree will be much larger yet.  Dr. Michael Hammer will speak tomorrow on the Y tree.

Nat Geo will introduce a “new chip by next year.”  The new Ireland data should be available on the National Geographic website within a couple of weeks.

They are also in the process up updating the website with new heat maps and stories.

Session 3 – Matt Dexter – Autosomal Analyses

Matt is a surname administrator, an adoptee and has a BS in Computer Science.  Matt is a relatively new admin, as these things go, beginning his adoptive search in 2008.

Matt found out as a child that he was adopted through a family arrangement.  He contacted his birth mother as an adult.  She told him who his father was who subsequently took a paternity test which disclosed that the man believed to be his biological father, was not.  Unfortunately, his ‘father’ had been very excited to be contacted by Matt, and then, of course, was very disappointed to discover that Matt was not his biological child.

Matt asked his mother about this, and she indicated that yes, “there was another guy, but I told him that the other guy was your father.’  With that, Matt began the search for his biological father.

In order to narrow the candidates, his mother agreed to test, so by process of elimination, Matt now knows which side of his family his autosomal results are from.

Matt covers how autosomal DNA works.

This search has led Matt to an interest in how DNA is passed in general, and specifically from grandparents to grandchildren.

One advantage he has is that he has five children whose DNA he can then compare to his wife and three of their grandparents, inferring of course, the 4th grandparent by process of elimination.  While his children’s DNA doesn’t help him identify his father, it did give him a lot of data to work with to learn about how to use and interpret autosomal DNA.    Here, Matt is discussing his children’s inheritance.

Matt dexter

Session 4 – Jeffrey Mark Paul – Differences in Autosomal DNA Characteristics between Jewish and Non-Jewish Populations and Implications for the Family Finder Test

Dr.Jeffrey Paul, who has a doctorate in Public Health from John Hopkins, noticed that his and his wife’s Family Finder results were quite different, and he wanted to know why.  Why did he, Jewish, have so many more?

There are 84 participants in the Jewish project that he used for the autosomal comparison.

What factors make Ashkenazi Jews endogamous.  The Ashkenazi represent 80%of world’sJewish population.

Arranged marriages based on family backgrounds.  Rabbinical lineages are highly esteemed and they became very inbred with cousins marrying cousins for generations.

Cultural and legal restrictions restrict Jewish movements and who they could marry.

Overprediction, meaning people being listed as being cousins more closely than they are, is one of the problems resulting from the endogamous population issue.  Some labs “correct” for this issue, but the actual accuracy of the correction is unknown.

Jeffrey compared his FTDNA Family Finder test with the expected results for known relatives and he finds the results linear – meaning that the results line up with the expected match percentages for unrelated relatives.  This means that FTDNA’s Jewish “correction” seems to be working quite well.  Of course, they do have a great family group with which to calibrate their product.  Bennett’s family is Jewish.

Jeffrey has downloaded the results of group participants into MSAccess and generates queries to test the hypothesis that Jewish participants have more matches than a non-Jewish control group.

The Jewish group had approximately a total of 7% total non-Ashkenazi Jewish in their Population Finder results, meaning European and Middle Eastern Jewish.  The non-Jewish group had almost exactly the opposite results.

  • Jewish people have from 1500-2100 matches.
  • Interfaith 700-1100 (Jewish and non)
  • NonJewish 60-616

Jewish people match almost 33% of the other Jewish people in the project.  Jewish people match both Jewish and Interfaith families.  NonJewish families match NonJewish and interfaith matches.

Jeffrey mentioned that many people have Jewish ancestry that they are unaware of.

This session was quite interesting.  This study while conducted on the Jewish population, still applies to other endogamous populations that are heavily intermarried.  One of the differences between Jewish populations and other groups, such as Amish, Brethren, Mennonite and Native American groups is that there are many Jewish populations that are still unmixed, where most of these other groups are currently intermixed, although of course there are some exceptions.  Furthermore, the Jewish community has been endogamous longer than some of the other groups.  Between both of those factors, length of endogamy and current mixture level, the Jewish population is probably much more highly admixed than any other group that could be readily studied.

Due to this constant redistribution of Jewish DNA within the same population, many Jewish people have a very high percentage of distant cousin relationships.

For non-Jewish people, if you are finding match number is the endogamous range, and a very high number of distant cousins, proportionally, you might want to consider the possibility that some of your ancestors descend from an endogamous population.

Unfortunately, the photo of Dr. Paul was unuseable.  I knew I should have taken my “real camera.”

Session 5 – Finding Your Indian Prince(ss) Without Having to Kiss Too Many Frogs

This was my session, and I’ll write about it later.

Someone did get a photo, which I’ve lifted from Jennifer Zinck’s great blog (thank you Jennifer), Ancestor Central.  In fact, you can see her writeup for Day 1 here and she is probably writing Day 2’s article as I type this, so watch for it too.

 Estes Indian Princess photo

Session 6 – Roundtable – Y-SNPs, hosted by Roberta Estes, Rebekah Canada and Marie Rundquist

At the end of the day, after the breakout sessions, roundtable discussions were held.  There were several topics.  Rebekah Canada, Marie Rundquist and I together “hostessed” the Y DNA and SNP discussion group, which was quite well attended.  We had a wide range of expertise in the group and answered many questions.  One really good aspect of these types of arrangements is that they are really set up for the participants to interact as well.  In our group, for example, we got the question about what is a public versus a private SNP, and Terry Barton who was attending the session answered the question by telling about his “private” Barton SNPs which are no longer considered private because they have now been found in three other surname individuals/groups.  This means they are listed on the “tree.”  So sometimes public and private can simply be a matter of timing and discovery.

FTDNA roundtable 2013

Here’s Bennett leading another roundtable discussion.

roundtable bennett

Session 7 – Dr. David Mittleman

Mittleman

Dr. Mittleman has a PhD in genetics, is a professor as well as an entrepreneur.  He was one of the partners in Arpeggi and came along to Gene by Gene with the acquisition.  He seems to be the perfect mixture of techie geek, scientist and businessman.

He began his session by talking a bit about the history of DNA sequencing, next generation sequencing and a discussion about the expectation of privacy and how that has changed in the past few years with Google which was launched in 2006 and Facebook in 2010.

David also discussed how the prices have dropped exponentially in the past few years based on the increase in the sophistication of technology.  Today, Y SNPs individually cost $39 to test, but for $199 at Nat Geo you can test 12,000 Y SNPs.

The WTY test, now discontinued tsted about 300,000 SNPs on the Y.  It cost between $950 (if you were willing to make your results public) and $1500 (if the results were private,)

Today, the Y chromosome can be sequenced on the Illumina chip which is the same chip that Nat Geo used and that the autosomal testing uses as well.  Family Tree DNA announced their new Big Y product that will sequence 10 million positions and 25,000 known SNPs for an introductory sale price of $495 for existing customers.  This is not a test that a new customer would ever order.  The test will normally cost $695.

Candid Shots

Tech row in the back of the room – Elliott Greenspan at left seated at the table.

tech row

ISOGG Reception

The ISOGG reception is one of my favorite parts of the conference because everyone comes together, can sit in groups and chat, and the “arrival” adrenaline has worn off a bit.  We tend to strategize, share success stories, help each other with sticky problems and otherwise have a great time.  We all bring food or drink and sometimes pitch in to rent the room.  We also spill out into the hallways where our impromptu “meetings” generally happen.  And we do terribly, terribly geeky things like passing our iPhones around with our chromosome painting for everyone to see.  Do we know how to party or what???

Here’s Linda Magellan working hard during the reception.  I think she’s ordering the Big Y actually.  We had several orders placed by admins during the conference.

magellan.jpg

We stayed up way too late visiting and the ISOGG meeting starts at 8 AM tomorrow!

______________________________________________________________

Disclosure

I receive a small contribution when you click on some of the links to vendors in my articles. This does NOT increase the price you pay but helps me to keep the lights on and this informational blog free for everyone. Please click on the links in the articles or to the vendors below if you are purchasing products or DNA testing.

Thank you so much.

DNA Purchases and Free Transfers

Genealogy Services

Genealogy Research

Determining Ethnicity Percentages

Recently, as a comment to one of my blog postings, someone asked how the testing companies can reach so far back in time and tell you about your ancestors.  Great question.

The tests that reliably reach the furthest back, of course, are the direct line Y-Line and mitochondrial DNA tests, but the commenter was really asking about the ethnicity predictions.  Those tests are known as BGA, or biogeographical ancestry tests, but most people just think of them or refer to them as the ethnicity tests.

Currently, Family Tree DNA, 23andMe and Ancestry.com all provide this function as a part of their autosomal product along with the Genographic 2.0 test.  In addition, third party tools available at www.gedmatch.com don’t provide testing, but allow you to expand what you can learn with their admixture tools if you upload your raw data files to their site.  I wrote about how to use these ethnicity tools in “The Autosomal Me” series.  I’ve also written about how accurate ethnicity predictions from testing companies are, or aren’t, here, here and here.

But today, I’d like to just briefly review the 3 steps in ethnicity prediction, and how those steps are accomplished.  It’s simple, really, in concept, but like everything else, the devil is in the details.devil

There are three fundamental steps.

  • Creation of the underlying population data base.
  • Individual DNA extraction.
  • Comparison to the underlying population data base.

Step 1:  Creation of the underlying population data base.

Don’t we wish this was as simple as it sounds.  It isn’t.  In fact, this step is the underpinnings of the accuracy of the ethnicity predictions.  The old GIGO (garbage in, garbage out) concept applies here.

How do researchers today obtain samples of what ancestral populations looked like, genetically?  Of course, the evident answer is through burials, but burials are not only few and far between, the DNA often does not amplify, or isn’t obtainable at all, and when it is, we really don’t have any way to know if we have a representative sample of the indigenous population (at that point in time) or a group of travelers passing through.  So, by and large, with few exceptions, ancient DNA isn’t a readily available option.

The second way to obtain this type of information is to sample current populations, preferably ones in isolated regions, not prone to in-movement, like small villages in mountain valleys, for example, that have been stable “forever.”  This is the approach the National Geographic Society takes and a good part of what the Genograpic Geno 2.0 project funding does.  Indigenous populations are in most cases our most reliable link to the past.  These resources, combined with what we know about population movement and history are very telling.  In fact, National Geographic included over 75,000 AIMs (Ancestrally Informative Markers) on the Geno 2.0 chip when it was released.

The third way to obtain this type of information is by inference.  Both Ancestry.com and 23andMe do some of this.  Ancestry released its V2 ethnicity updates this week, and as a part of that update, they included a white paper available to DNA participants.  In that paper, Ancestry discusses their process for utilizing contributed pedigree charts and states that, aside from immigrant locations, such as the United States and Canada, a common location for 4 grandparents is sufficient information to include that individuals DNA as “native” to that location.  Ancestry used 3000 samples in their new ethnicity predictions to cover 26 geographic locations.  That’s only 115 samples, on average, per location to represent all of that population.  That’s pretty slim pickins.  Their most highly represented area is Eastern Europe with 432 samples and the least represented is Mali with 16.  The regions they cover are shown below.

ancestry v2 8

Survey Monkey, a widely utilized web survey company, in their FAQ about Survey Size For Accuracy provides guidelines for obtaining a representative sample.  Take a look.  No matter which calculations you use relative to acceptable Margin of Error and Confidence Level, Ancestry’s sample size is extremely light.

23andMe states in their FAQ that their ethnicity prediction, called Ancestry Composition covers 22 reference populations and that they utilize public reference datasets in addition to their clients’ with known ancestry.

23andMe asks geographic ancestry questions of their customers in the “where are you from” survey, then incorporates the results of individuals with all 4 grandparents from a particular country.  One of the ways they utilize this data is to show you where on your chromosomes you match people whose 4 grandparents are from the same country.  In their tutorial, they do caution that just because a grandparent was born in a particular location doesn’t necessarily mean that they were originally from that location.  This is particularly true in the past few generations, since the industrial revolution.  However, it may still be a useful tool, when taken with the requisite grain of salt.

23andme 4 grandparents

The third way of creating the underlying population data base is to utilize academically published information or information otherwise available.  For example, the Human Genome Diversity Project (HGDP) information which represents 1050 individuals from 52 world populations is available for scrutiny.  Ancestry, in their paper, states that they utilized the HGDP data in addition to their own customer database as well as the Sorenson data, which they recently purchased.

Academically published articles are available as well.  Family Tree DNA utilizes 52 different populations in their reference data base.  They utilize published academic papers and the specific list is provided in their FAQ.

As you can see, there are different approaches and tools.  Depending on which of these tools are utilized, the underlying data base may look dramatically different, and the information held in the underlying data base will assuredly affect the results.

Step 2:  Your Individual DNA Extraction

This is actually the easy part – where you send your swab or spit off to the lab and have it processed.  All three of the main players utilize chip technology today.  For example, 23andMe focuses on and therefore utilizes medical SNPs, where Family Tree DNA actively avoids anything that reports medical information, and does not utilize those SNPs.

In Ancestry’s white paper, they provide an excellent graphic of how, at the molecular level, your DNA begins to provide information about the geographic location of your ancestors.  At each DNA location, or address, you have two alleles, one from each parent.  These alleles can have one of 4 values, or nucleotides, at each location, represented by the abbreviations T, A, C and G, short for Thymine, Adenine, Cytosine and Guanine.  Based on their values, and how frequently those values are found in comparison populations, we begin to fine correlations in geography, which takes us to the next step.

ancestry allele snps

Step 3:  Comparison to Underlying Population Data Base

Now that we have the two individual components in our recipe for ethnicity, a population reference set and your DNA results, we need to combine them.

After DNA extraction, your individual results are compared to the underlying data base.  Of course, the accuracy will depend on the quality, diversity, coverage and quantity of the underlying data base, and it will also depend on how many markers are being utilized or compared.

For example, Family Tree DNA utilizes about 295,000 out of 710,000 autosomal SNPs tested for ethnicity prediction.  Ancestry’s V1 product utilized about 30,000, but that has increased now to about 300,000 in the 2.0 version.

When comparing your alleles to the underlying data set one by one, patterns emerge, and it’s the patterns that are important.  To begin with, T, A, C and G are not absent entirely in any population, so looking at the results, it then becomes a statistics game.  This means that, as Ancestry’s graphic, above, shows, it becomes a matter of relativity (pardon the pun), and a matter of percentages.

For example, if the A allele above is shown is high frequencies in Eastern Europe, but in lower frequencies elsewhere, that’s good data, but may not by itself be relevant.  However if an entire segment of locations, like a street of DNA addresses, are found in high percentages in Eastern Europe, then that begins to be a pattern.  If you have several streets in the city of You that are from Eastern Europe, then that suggests strongly that some of your ancestors were from that region.

To show this in more detailed format, I’m shifting to the third party tool, GedMatch and one of their admixture tools.  I utilized this when writing the series, “The Autosomal Me” and in Part 2, “The Ancestor’s Speak,” I showed this example segment of DNA.

On the graph below, which is my chromosome painting of one a small part of one of my chromosomes on the top, and my mother’s showing the exact same segment on the bottom, the various types of ethnicity are colored, or painted.

The grid shows location, or address, 120 on the chromosome and each tick mark is another number, so 121, 122, etc.   It’s numbered so we can keep track of where we are on the chromosome.

You can readily see that both of us have a primary ethnicity of North European, shown by the teal.  This means that for this entire segment, the results are that our alleles are found in the highest frequencies in that region.

Gedmatch me mom

However, notice the South Asian, East Asian, Caucus, and North Amerindian. The important part to notice here, other than I didn’t inherit much of that segment at 123-127 from her, except for a small part of East Asian, is that these minority ethnicities tend to nest together.  Of course, this makes sense if you think about it.  Native Americans would carry Asian DNA, because that is where their ancestors lived.  By the same token, so would Germans and Polish people, given the history of invasion by the Mongols. Well, now, that’s kind of a monkey-wrench isn’t it???

This illustrates why the results may sometimes be confusing as well as how difficult it is to “identify” an ethnicity.  Furthermore, small segments such as this are often “not reported” by the testing companies because they fall under the “noise” threshold of between about 5 and 7cM, depending on the company, unless there are a lot of them and together they add up to be substantial.

In Summary

In an ideal world, we would have one resource that combines all of these tools.  Of course, these companies are “for profit,” except for National Geographic, and they are not going to be sharing their resources anytime soon.

I think it’s clear that the underlying data bases need to be expanded substantially.  The reliability of utilizing contributed pedigrees as representative of a population indigenous to an area is also questionable, especially pedigrees that only reach back two generations.

All of these tools are still in their infancy.  Both Ancestry and Family Tree DNA’s ethnicity tools are labeled as Beta.  There is useful information to be gleaned, but don’t take the results too seriously.  Look at them more as establishing a pattern.  If you want to take a deeper dive by utilizing your raw data and downloading it to GedMatch, you can certainly do so. The Autosomal Me series shows you how.

Just keep in mind that with ethnicity predictions, with all of the vendors, as is particularly evident when comparing results from multiple vendors, “your mileage may vary.”  Now you know why!

______________________________________________________________

Disclosure

I receive a small contribution when you click on some of the links to vendors in my articles. This does NOT increase the price you pay but helps me to keep the lights on and this informational blog free for everyone. Please click on the links in the articles or to the vendors below if you are purchasing products or DNA testing.

Thank you so much.

DNA Purchases and Free Transfers

Genealogy Services

Genealogy Research

You Might Be A Pict If….

…if what Dr. Jim Wilson, announced via press release instead of the more standard academic publication, is true.

Pict Daughter

“A Young Daughter of the Picts” attributed to Jacques le Moyne de Morgues, circa 1585.

Dr. Wilson indicates that he, in conjunction with Scotland’s DNA, an ancestry testing company that he is affiliated with, a new SNP, S530 has been discovered and it is a Pict marker.  He says that this marker is evidence that the Picts are living among us today and can be identified genetically.  As proof, he offers that 10% of the 1000 Scottish men tested carry this marker, while it is found in only .8% of English men and about 3% of the men in Northern Ireland.  Dr. Wilson indicates that this marker is 10 times more prevalent in men with Scottish grandfathers than men with English grandfathers.  You can read the articles in “The Scotsman” and “The Telegraph and the press release by Scotland’s DNA here.”

The Picts were Scotland’s earliest known people.  It’s unknown what the Picts called themselves, but the Roman’s gave them the name Picts, meaning “painted ones.”  They were Celts, but their early history in the British Isles is unclear.  By the time they entered recorded history, they were in Scotland, north of the Forth and Clyde, beyond the stronghold of the Roman empire with whom they fought bitterly on their borders.  Their kingdoms in about 800 and 900 CE are shown on the map below.

pict map

Eventually, in about the 1100s, and rather gradually, the Picts disappeared from the records as a separate people, having assimilated as fully Gaelic Scots, their Pictish heritage forgotten, into the mainstream of the British Isles, along with other Celts, Angles, Saxons and Vikings.

Dr. Wilson says that S530, the newly discovered Pictish marker parallels the Pictish locations, in Fife, Perthshire, Tayside and the Northeast and around Moray Firth coastlands.

Normally, this kind of an announcement would be met with an extremely positive reaction in the genetic genealogy community, but in this case, not so much.  It seems that Dr. Wilson along with Britain’s DNA and Scotland’s DNA have been involved in some less than reputable actions recently, and one has to wonder if this is legitimate.

By legitimate, I mean whether, if provided with the same data and opportunities, another independent academic researcher could reproduce the same results and if unbiased, would come to the same conclusions.  This, of course, is part of the purpose of peer review during the academic publication process.  This isn’t the first time this has happened, either.  For more information about these companies, their issues, their scientific announcements via the media and resulting scuttlebutt, check the following links.

http://dna-explained.com/2012/12/20/britains-dna-caveat-emptor/

http://www.genomesunzipped.org/2012/12/exaggerations-and-errors-in-the-promotion-of-genetic-ancestry-testing.php

Be sure to read the comments by Debbie Kennett on the link above, and the article below, on Debbie’s blog.

http://cruwys.blogspot.com/2013/06/britainsdna-times-and-prince-william.html

I checked the Scotland’s DNA website, and fully expected to find a new “Pict” test, but it’s not there yet.  Unless I’m terribly off the mark, I’m betting it will be soon, which might have something to do with circumventing the academic publication process, aside from the minor details of peer review and accuracy.  Academic publication takes about 18 months to write the paper and shepherd it through the peer review process.  Not trivial, and there is no “big splash” so to speak about an academic paper appearing in a little known scientific journal.  Much bigger splash this way and one can offer a product immediately, no waiting.  The problem is that science isn’t a “trust me” type of field and this type of science-in-the-media announcement with no documentation flies against all of the safeguards built into the scientific publication process.

So, you just might be a Pict if Jim Wilson is correct and you carry S530….but until an academic paper is published, there is no way to know for sure unless of course, you’re into “trust me.”

However, if you’re dying to know, and can’t wait, I have a hint for you, this SNP was discovered earlier this year, at Family Tree DNA.  It’s also called SNP L1335, and is equivalent to S530.  Kind of sheds a different light on the big announcement doesn’t it.  If you need to know, and you’re a haplogroup R1b male, just order this SNP for $39 from Family Tree DNA and you’ll know if you carry this marker, or not.  However, until Dr. Wilson publishes a paper and makes his data available for review, you won’t know if you are a Pict or just another L1335 Scottish male.

______________________________________________________________

Disclosure

I receive a small contribution when you click on some of the links to vendors in my articles. This does NOT increase the price you pay but helps me to keep the lights on and this informational blog free for everyone. Please click on the links in the articles or to the vendors below if you are purchasing products or DNA testing.

Thank you so much.

DNA Purchases and Free Transfers

Genealogy Services

Genealogy Research

New Y DNA Haplogroup Naming Convention

In late 2012, the way haplogroups were being named and referenced began changing.  Before the introduction of the Geno 2.0 test in July 2012, there were approximately 850 SNPs identified on the haplotree, meaning 850 haplogroup names that all began with the letter of the haplogroup, but then had alternating numbers and letters that were added as new haplogroup branches were discovered.

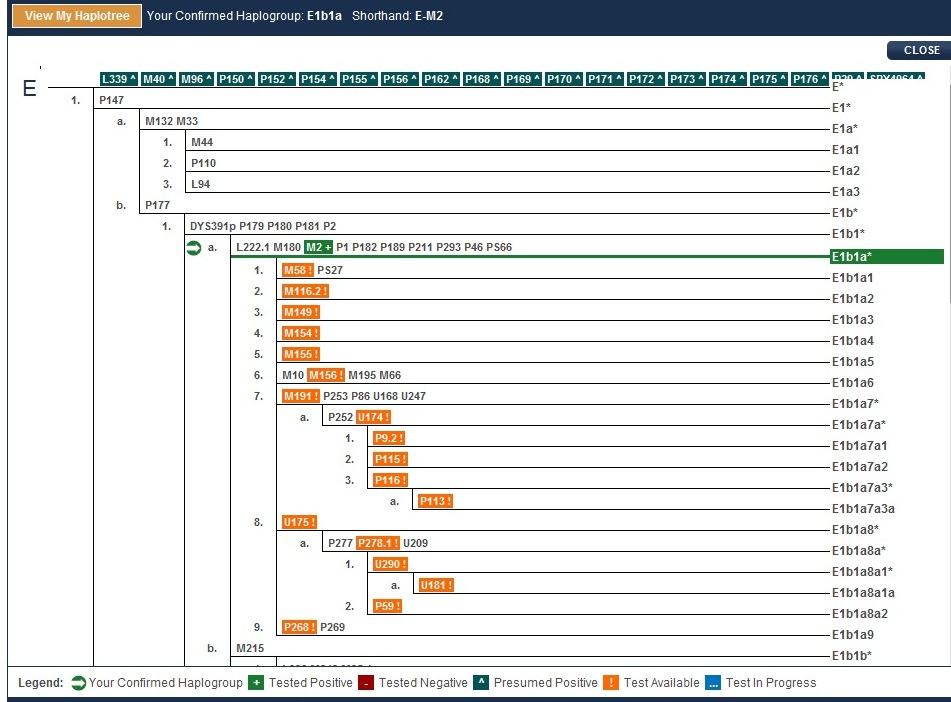
The most common one in Europe is R1b1a2.  This means that after haplogroup R itself was discovered, then another haplogroup, R1 was discovered, then R1b, and so forth.  But now, for the fly in the ointment.  Let’s say that a new haplogroup has been discovered and it needs to be inserted between haplogroup R1 and haplogroup R1b.  What happens?  This naming methodology is not conducive to insertions.  It’s only been a couple of years that the tree was entirely rewritten, redrawn.  Haplogroups that were previously called E3a became E1b1a.  To say it was a large and very disconcerting shift is an understatement.  Add to this that all of the academic papers on which we depend are written in the lingo of the time.  So something that references haplogroup J1a in 2002 may not be talking about the same J1a, as defined by a SNP, in 2013 or some time in the future.

Now for the jolt.  The Genographic project utilized over 10,000 new SNPs not before known or utilized for a total of over 12,000 Y DNA SNPs in their Geno 2.0 test introduced in July of 2012 .  Therefore, the tree was going to have to be entirely drawn with the haplogroup branches renamed, once again.  This was going to be a much bigger shift than before, simply due to the sheer magnitude, and more SNPs are being discovered almost daily.  Therefore, a new methodology was needed.

Every haplogroup, such as R1b1a2, is defined by a specific SNP, in this case, M269.  This SNP and haplogroup name have a specific location on the haplotree.  The SNP locations can change without a problem, but the names of the haplogroups that need to change are the problem.  This has already led to different trees maintained by different organizatiosn being out of sync with each other.

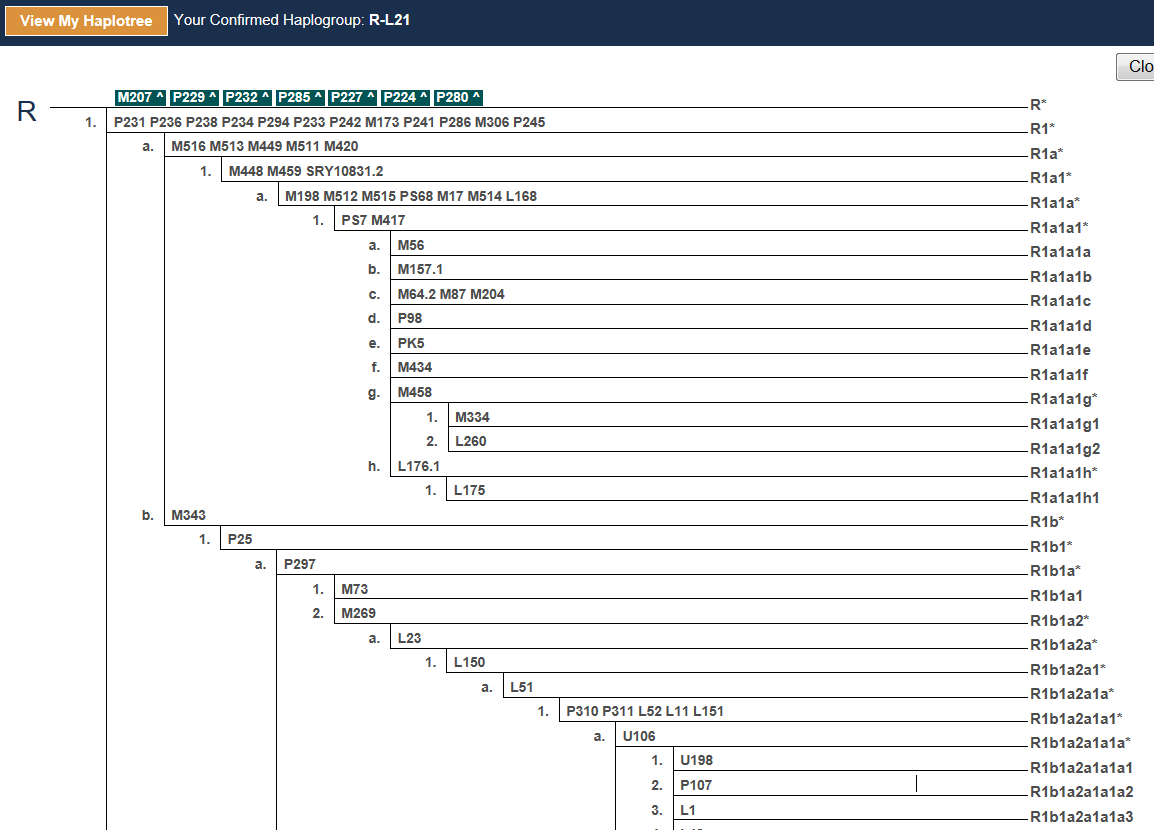
Today, at Family Tree DNA, this is what the top part of the haplogroup R tree looks like.

new hap name

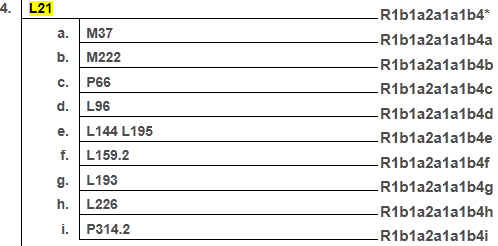
As new SNPs are discovered and inserted into the tree, there will no longer be a name assigned, shown in the right hand column.  As the names are obsoleted because of shuffling of branches on the tree, they will not be renamed.  Already, at Family Tree DNA, they are using just the SNP name as the haplogroup indicator, as you can see in the top bar where is says “Your confirmed haplogroup R-L21.  This means haplogroup R, SNP L21, which occurs further down on the tree.

Today,  R-L21 is still shown on the tree with its name, R1b1a2a1a1b4, but as the tree branches shuffle and this name no longer applies to R-L21, the name will be obsoleted and the haplogroup will only referenced as R-L21.

new hap name 1

Max Blankfeld and Bennett Greenspan of Family Tree DNA recently wrote this explanation which is found on the haplogroup pages at Family Tree DNA.

Long time customers of Family Tree DNA have seen the YCC-tree of Homo Sapiens evolve over the past several years as new SNPs have been discovered. Sometimes these new SNPs cause a substantial change in the “longhand” explanation of your terminal Haplogroup. Because of this confusion, we introduced a shorthand version a few years ago that lists the branch of the tree and your terminal SNP, i.e. J-L147, in lieu of J1c3d. Therefore, in the very near term, Family Tree DNA will discontinue showing the current “longhand” on the tree and we will focus all of our discussions around your terminal defining SNP.

This changes no science – it just provides an easier and less confusing way for us all to communicate.

Obviously, more than a decade’s worth of information exists that references the haplogroups in both formats.  Other companies in this space are not doing this level of testing and do not yet need to address this type of issue, so their data bases and references will likely stay the same, at least for the time being.  For some time to come, we will be dealing in a dual world where both methodologies are utilized and yes, some amount of confusion will certainly result.  In preparation, I wanted you to understand what has happened in the past, the recent changes, what the future holds, and why.

______________________________________________________________

Disclosure

I receive a small contribution when you click on some of the links to vendors in my articles. This does NOT increase the price you pay but helps me to keep the lights on and this informational blog free for everyone. Please click on the links in the articles or to the vendors below if you are purchasing products or DNA testing.

Thank you so much.

DNA Purchases and Free Transfers

Genealogy Services

Genealogy Research

Transferring Results from National Geographic to Family Tree DNA

There are several reasons why you might want to transfer your National Geographic Genographic Geno version 1.0 and 2.0 results to Family Tree DNA.

Please note these are only valid for the Geno 2.0 version, prior to the Helix tests that began in November of 2016.

If you’re not a Family Tree DNA client, there is a whole new genetic genealogy world just waiting on you, and transferring your results is free. National Geographic test version 1.0, which is no longer available, included a 12 marker Y DNA test, and version 2.0, currently available, includes extensive haplogroup (clan) information that complements the 12-111 marker tests at Family Tree DNA, as well as other information. If you haven’t yet taken the 12 marker or other Y DNA tests at Family Tree DNA, you will be offered that opportunity in order to find your matches. After transferring your results to Family Tree DNA, you will be able to order additional tests, contact your matches via e-mail and share your genealogy information.  It’s an exciting time in genetic genealogy!

YDNA SNPs

If you are already a Family Tree DNA customer, then you’ll want to download your data for a different reason. The Geno 2.0 chip includes an extensive list of Y DNA SNPs that are tested, far beyond what Family Tree DNA offers, and you will want to integrate this data into your results pages at Family Tree DNA.

Mitochondrial DNA

If you have not yet tested your mitochondrial DNA, Geno 2.0 provides you with your haplogroup, your deep ancestral clan information.  The markers required to define your haplogroup will transfer to Family Tree DNA. If you want, you can then order the mtDNA, mtDNAPlus or the full mitochondrial sequence test to see what personal mutations you carry, and who you match.

If you have taken any mitochondrial DNA test at Family Tree DNA, none of the Geno 2.0 information will transfer, including updated haplogroup information.  The Full Mitochondrial Sequence test at Family Tree DNA is more extensive than the Geno 2.0 haplogroup only test.

Autosomal Results

The two autosomal tests, the one provided by Family Tree DNA (Family Finder) and the one included in the Geno 2.0 product are entirely different beasts. The Family Finder test provides you with a list of cousin matches with numerous matching tools and an ethnicity report.

The Geno 2.0 product also provides an ethnicity report but uses different comparison populations and markers than Family Tree DNA, so they serve different purposes, the Family Tree DNA Family Finder product being more focused towards genealogy and the National Geographic product being more focused towards anthropology or deep ancestry. I mean, let’s face it, you’re probably not going to be able to go back far enough in time to tack a pure Neanderthal or a pure Denisovan on your family tree, your favorite brother-in-law excepted:)

How to Transfer Your Results

In order to facilitate the transfer, you’ll need to set up an account at National Geographic, and you’ll need your National Geographic kit numbers. So find those before you start. If all else fails, find that lovely black box your Geno 2.0 test kit arrived in. Your participant number is on the inside of the front cover. And you thought it was just another pretty box!

You’ll also need your Family Tree DNA kit number and password for the kit you want these results to transfer into.

Go to the Genographic website at http://www.genographic.com and click on
“Check Results.” You’ll be prompted through setting up your account at National Geographic. Whether or not you want to transfer data, you need to set up your account because if you don’t, and you lose your Nat Geo kit number, you’re toast.

After you enter your kit ID and set up your account, you’ll see the main results screen.  This is mine, and no, my paternal results aren’t missing…there aren’t any because as a female, I don’t carry a Y chromosome!

Geno transfer 1

Now click on “Profile” in the upper right hand corner of the screen.  You’ll see the profile screen below.

Geno trnsfer 2

You’ll see your profile, along with your kit numbers. You’ll need these for the next step so you’ll want to be sure to write them down. I’ve greyed mine above, but you can see where they were.  Note that if you have already transferred your Geno 1.0 results previouisly, adding that kit number here has been reported to generate an error.  If so, then try again without the 1.0 kit number.

Next, click on “Expert Options” at the top right of the screen. You’ll see “Download Data” and “Transfer Data to Family Tree DNA.”

geno transfer 3

Click on “Transfer Data to Family Tree DNA.” You’re almost done!!! You will be transferred to a screen on the Family Tree DNA site.

geno transfer 4

The kit numbers that you need are the numbers are displayed in your National Geographic account settings screen that I suggested you write down – plus – of course – your Family Tree DNA kit number and password that you want your National Geographic results associated with.

Complete this and click on next. You will see an order screen that looks like you are placing an order. Don’t worry, the order is free, but you do need to complete the form. Click through the options and at the end, the free order for your transfer will be complete.

It takes about 24 hours before you can see your results on your personal page at Family Tree DNA.

Y SNPs

Currently, as of January 12, 2013, you will be able to see your terminal SNP on your Haplotree and SNP tab if your terminal SNP is one that Family Tree DNA tests for in their lab.

geno transfer 5

However, if your SNP is new on the Geno 2.0 chip, then you won’t be able to see your terminal SNP on your personal page at Family Tree DNA, yet, so be sure to make note of your terminal SNP from your National Geographic results. Some Geno 2.0 results at Family Tree DNA today show an upstream SNP, and others show no SNP at all.

This is one of those good news/bad news situations. The good news is that we are functioning on the leading, sometimes bleeding edge of science and get to play a very important role, which is exciting. The bad news is that we’re bleeding a bit right now.  Family Tree DNA really can’t fix this problem until a new haplotree is in place.

green giantThe problem is that haplogroup/subgroup discoveries are being made so rapidly that the haplotree is in a bit of a state of flux….OK, a big state of flux, which will take some time to sort through.  More, many more, discoveries than ever expected continue to be made as more kits are run through the process.  Let’s just say we’re having some minor growing pains.  But what a great problem to have.  We already knew that Geno 2.0 would change the tree dramatically, but we really had no idea HOW dramatically.  Now I’m wondering if we’ll even recognize it!  What we thought was a tree was only a sprout.  And it’s still growing!

Why I do believe, why yes, I do hear….In the Valley of the Jolly, Ho, Ho. Ho

______________________________________________________________

Disclosure

I receive a small contribution when you click on some of the links to vendors in my articles. This does NOT increase the price you pay but helps me to keep the lights on and this informational blog free for everyone. Please click on the links in the articles or to the vendors below if you are purchasing products or DNA testing.

Thank you so much.

DNA Purchases and Free Transfers

Genealogy Services

Genealogy Research

Britains DNA – Caveat Emptor

Recently, a client contacted me who had tested with both companies, Britains DNA and GeneBase, and couldn’t figure out what to make of his results or if the two even connected with each other.

When I saw what he sent me, I immediately understood why, and I felt very badly for him.

I often wonder how people make decisions regarding DNA testing and the companies they choose.  In some cases, I know.  For example, Ancestry has a lot of subscribers, so subscribers make up the majority of their customers.  But that’s not always the case.

I hadn’t actually been able to see results from Britains DNA before, so this was a great opportunity, but I am sorely disappointed.

While I was in this evaluation process, the following article titled  “Exaggerations and Errors in the Promotion of Genetic Ancestry Testing” was published which I found extremely concerning.

http://www.genomesunzipped.org/2012/12/exaggerations-and-errors-in-the-promotion-of-genetic-ancestry-testing.php

Let’s take a look at what you actually receive from Britains DNA.

For 170 pounds, which equates to about $266 US, in a 3 page boilerplate report, you learn the identity of 4 of your haplogroup SNPs.  They tell you that “Your Fatherline is Berber” and “Your YDNA markers are M35+M81+,” and that’s it for customization, other than your name and one line on page three that says “These are the markers we tested which define your group:  M96+  P29+  M35+ and M81+.”  The rest of the three pages is entirely a boilerplate story.  And what a “story” it is.

The first thing you see is a map, but not until the last paragraph of page 3 does it tell you that the map shows where “your group” is found today, but what is meant by “your group” is unclear.  I’m presuming here that the map is either showing M35 or M81.  For $266 dollars, the customer should not have to presume.

britains dna map

Part of the ensuing “story” is questionable.  For example, describing the after-effects of the eruption of Mount Toba in 70,000 BC, “Only in east-central Africa, in the shelter of the great rift valleys, did tiny remnant bands of people survive where perhaps as few at 5000 outlived the sunless summers.”

What is stated here as fact is assuredly one of the theories, but it’s far from an established scientific fact and is highly controversial.  There are no words here like “may have been” or “are believed by some” – just the recantation of a story using the tone one might use to tell a fanciful bedtime story to a believing child. Except these people are adults and paid a lot of money to receive a scientific explanation of their DNA results, not something that reads like a modern day fairy tale.

http://en.wikipedia.org/wiki/Toba_catastrophe_theory

Another example is their introduction of marker M81.  “Men with your marker, with M81, made a dramatic entry into recorded history.  Led by one of the greatest generals the world has seen, Berber cavalry fought in the Carthaginian army as it struggled with Rome in the 3rd century BC for control of the Mediterranean.”

Really?  That was their introduction?

Arredi et al in 2004 in the paper, “A Predominantly Neolithic Origin for Y-Chromosomal DNA Variation in North Africa” linked M81 with the spread of Neolithic food producing technologies.  So if M81 existed in the Neolithic, which began about 10,000 years ago in the Middle East, it clearly wasn’t introduced in the 3rd century BC with the unnamed Berber general, or the Carthaginians.  Maybe the story of the Carthaginians was just a more interesting tale.  The problem is that it’s misleading and inaccurate.

Reading this “story” from the perspective of one experienced with genetic genealogy, I feel like this was written for an audience they felt was unable to comprehend the “complicated truth.”  Except, the truth isn’t all that complicated.  People can understand it just fine, thank you, and I find that approach very insulting.

Near the end of the story, in the “marker” section, they say that  “SNP is another word for marker” and that these markers are unique events in human history showing you where your ancestors were in the past and where your “group” is found today.  There is no further explanation.

Personally, I found this entire 3 pages arrogantly condescending.  Judging from that article, I’m not alone.  Moreover, this high priced, low value, fanciful product worries me because I’m concerned that genetic genealogy will all be painted and tarred with the same brush once the consuming public catches on and the word gets out.  You know, that bad apple thing.  I hope that Britains DNA will either improve their product or exit the marketplace before they damage an already nervous European population relative to DNA testing.  And what’s worse, this is Brits preying on other Brits when they will likely attempt to invoke a trust relationship with potential buyers.  “Buy from us, we’re Brits and we’re local.”  To put this in perspective, the cost of 4 SNP markers at Family Tree DNA, the only company who tests SNP markers boutique style, is $29 each, for a total of $116.

My client, not knowing quite what to make of all this, then tested at Genebase.  For another $119, he obtained STR markers for 27 locations.  He had no idea how to tie this together with the results from Britain’s DNA, or what to do with these markers.  He wanted to know if the two tests supported each other, or if they were different, and what they told him.  That’s when he found me.

I did best I could for him with what I had to work with by using Whit Athey’s haplogroup predictor, YSearch and the haplogroup project for E-M35.  Thank you, Whit and Family Tree DNA for these tools.

In the end, what I finally told him, among other things, is that he needs to spend another $119 so that he can test at Family Tree DNA.  I hated to do this, because with my fee added, this man has now paid over $400 US.  Testing at Family Tree DNA would get him 37 markers, a personal page, a haplogroup and provide him the ability to join an Italian project, a surname project and a haplogroup project.  He needs to be able to work with haplogroup project administrators to determine if he needs deep clade (or similar) SNP testing. He needs to be able to look at the haplogroup origins page, the ancestral origins page, and the matches map to see where his own people were both further back in time and more recently.  He needs matches, and to be able to contact his matches to see if he can make connections and discern trends.  He needs a community.

Never, until today, until I saw this man’s piecemeal results, fanciful boilerplate story and his desire to patch it all together, did I fully appreciate all that Family Tree DNA provides, in one place, integrated, through their products and webpages, and charitably, through the foundation they provide for their project administrators, Ysearch, Mitosearch and the support of other clients and volunteers who guide people through the discovery process.

A very, very big thank you to Bennett Greenspan and Max Blankfeld, founders of Family Tree DNA, and to all of those unnamed volunteers and project administrators who work together and separately to make all of this possible.

For my client, though, and others like him, I’m not quite sure what to say or how to prevent this in the future.  I guess the words “buyer beware” also have to be applied to purchasing genetic genealogy products.  As with any other items where consumers are drawn to purchase something, if there is money and demand, there will be scam artists and less than ethical people looking to take advantage of a naïve consuming public.  For me, it’s personally painful when those people fall into the category of “scientists” because like doctors, that professional label alone engenders trust.  This product certainly trembles on the line of betrayal of that trust.  Some would say it crosses that line.  Perhaps it is a fine line.  The customer did discover his “fatherline” and receive a story, even if the story was more fluffy than scientific and the price exorbitant for what he received.

Caveat emptor!

______________________________________________________________

Disclosure

I receive a small contribution when you click on some of the links to vendors in my articles. This does NOT increase the price you pay but helps me to keep the lights on and this informational blog free for everyone. Please click on the links in the articles or to the vendors below if you are purchasing products or DNA testing.

Thank you so much.

DNA Purchases and Free Transfers

Genealogy Services

Genealogy Research

Geno 2.0 Results – Kicking the Tires

Update: Please note that the Genographic Project discontinued public sales of kits in 2019. I am leaving this article for historical context.

Yesterday, my husband’s Geno 2.0 results arrived.  I bought his kit for him for Christmas initially, but couldn’t wait that long so had him swab the very day it arrived.  So much for Santa’s surprise.  But wait, maybe his results will hold a surprise – and isn’t this the first day of Christmas?  Oh, it’s not?  Well, I’ve decided to establish a new tradition this year, that it is the first day of Christmas and this year we will simply have 15 days of Christmas.  The extra three days will be dedicated to Y-line SNPs, a mitochondrial haplogroup and ethnicity results.  Who wants a bird in a pear tree anyway?

Geno Kick JimMeet Jim.  Since you’re going to be looking as his “innards,” so to speak, I think you should formally meet him.  Pretty soon you’re going to be wondering what a Neanderthal, Denisovan, German, Greek, Mediterranean Hun looks like.  I wanted to use the photo of him kissing the dolphin in the Carribbean, but he wouldn’t let me.  Harumph.  I guess Huns have no sense of humor.

There’s a lot of information included on the new Genographic results webpage with some very cool features.  We’re not going to look at everything in-depth today, but we’ll do a flyover so you can see everything.  Right now, because everyone is checking the status of their results, the Genographic webpage is experiencing difficulties.  So if you click and wait, well, go get a cup of coffee.  It will eventually respond and multiple clicks only cause buffer problems when it does respond.  I know this from experience.  How many times have I said that patience is not a virtue attributed to me!

Oh yes, and I had much better luck with the webpage using Chrome as opposed to Internet Explorer 7.

The first screen you see is “Your Story.”  It’s large so I’ll break it into three parts for review.  Notice the 5 tabs at the top of the page.  You’ll be using those.  Actually, if you follow the story line, the story walks you through them all.

Geno kick story

The middle portion of this page shows your mitochondrial DNA, autosomal in the center, followed by your Y-line, if you’re a male.  Your haplogroup is displayed as well for mitochondrial, and your terminal SNP for males, which is the SNP that ultimately defines the deepest level of your haplogroup.  Well, at least until a new terminal SNP is discovered.

geno kick story 2

There are a couple of items of note here.

The tab titled “Your Map” simply won’t load, using either browser.  I’ve sent a note to National Geographic.  I know this is loading for other folks though.  I wonder if it has anything to do with Jim’s haplogroup.

Second, for Jim’s paternal line, CTS11962 is a new SNP not previously tested at Family Tree DNA.  CTS stands for Chris Tyler-Smith, a researcher in the UK at the Sanger Institute who discovered this particular SNP, and named it.

We knew in advance that the new standard for both the Geno 2.0 and also Family Tree DNA will be to only provide the terminal SNP and no longer rename the haplogroups in the way they used to be, such as R1a or R1b1a2.  However, the problem with this approach is that someone looking at this terminal SNP has no reference whatsoever at this point.  There isn’t even a “main” haplogroup branch given, nor a link to any explanation, or at least not that I can find.

After transferring Jim’s results to Family Tree DNA, I noticed that he is now labelled R1a1a1g on his Family Tree DNA haplogroup page.  It looked like his mitochondrial results didn’t transfer initially, but this morning after the Family Tree DNA webpage update, he does have results on his mtDNA Haplogroup Origins page, which is about all you can do with haplogroup only information.  Nat Geo, of course, does not test beyond haplogroup designation for mitochondrial.  However, it looks like his autosomal results didn’t transfer anyplace.  Hmmm….maybe a bug.  I’ll have to contact the helpdesk who is probably swamped this morning.

geno kick ftdna snp

Looking at his Family Tree DNA Haplogroup and SNPs page, all of the SNPs Jim was tested for at Nat Geo appear to be listed, but CTS11962, his terminal SNP, seems to be missing, so others may be as well.  Family Tree DNA updated the data base and web page today, but this didn’t seem to be resolved with the update this morning.  It also looks like it might be a page real estate issue in that this section of his page is quite full.

The bottom portion of the introductory Geno 2.0 page provides an interesting tidbit.

geno kick story 3

Yesterday, when one of my blog followers sent me his initial results, the “you are 1 of” number was 524,384, and that number had been used for some time, so it’s not dynamic.  This new number appeared a few hours later, so I’m thinking that the answer to the number of Geno 2.0 kits sold might be someplace in the ballpark of 35,131.  Just speculation on my part.

Let’s go back now and look at each section.

The mitochondrial DNA area provides a basic description of the haplogroup’s journey, then you can click to see the map.

Since his map won’t load, taking a look at another account I have access to, we see the following map information.

geno kick mito map

See the “share” button on the top right hand side of the next page?  This allows you to send e-mails or a number of other types of messages to friends with a nice summary page of your results.  Be sure to type a message in the message box with your full name because otherwise the recipient will have no idea whose info they are viewing.

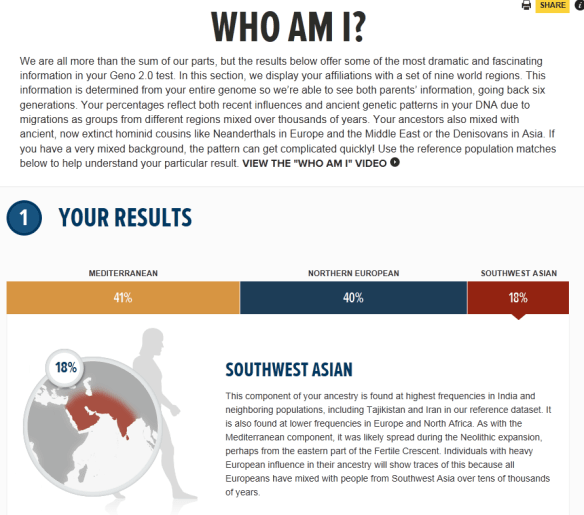
Moving to the autosomal section, we see that they have divided the world into 9 regions, plus Neanderthal and Denisovan.

Geno kick auto 1

Jim is Mediterranean, Northern European and Southwest Asian.  His genealogy is entirely German and Hungarian.   He’s a second generation immigrant, so none of his genealogy is lost here in the US.  Of course, the term Hungarian should translate into “churning people” because the devastation of multiple wars spanning centuries has disrupted this population significantly.  The same holds true for Germany.  I would suggest that Germanic and Slavic would perhaps be a better description of his heritage.

In any case, the Mediterranean and Southwest Asian were somewhat of a surprise, but when you look at migration patterns, maybe not so much.  After all, we all came through the Middle East on our way out of African and if your ancestors migrated to Germany, they probably went through the Mediterranean unless they went over the Caucus Mountains instead. And that would give you Southwest Asian heritage most likely.

The only problem is, now Jim wants to go on another Mediterranean cruise to commune with his ancestral homeland.  DNA cruises anyone???

The next section explains what the results mean.  This is actually quite interesting because it compares you to the actual reference population.  In his case, in Germany.

geno kick auto 2

His second reference population was somewhat of a surprise.  It’s Greek.  Perhaps it’s the best reference population they have for “Mediterranean” as the Greeks are truly a mixture of just about everyone in the Mediterranean basin.

geno kick auto 3

They do provide links here to more information.  By clicking on the overview of all reference populations, they provide information about how these populations as a whole are made up today.

geno kick ref

I counted and there are 43 populations.  Another option is to click to review the 9 world regions.

geno kick world 1geno kick world 2

The Neanderthal and Denisovan ancestry is particularly interesting since it has been only recently, in the past couple of years, that humans were believed to have interbred with either group.  Neanderthals have been found throughout most of Europe and western Asia, and Denisovans lived in the Altai Mountains of Siberia.  If you click on the little links imbedded in many place on your page, you’ll see that there is more information about almost every topic.  For example, they tell us that everyone outside of Africa carries some Neanderthal and Denisovan.

geno kick hominid

On Jim’s Genographic page, the terminal SNP shown is M458, shown below the map.  Referring now to the ISOGG Y tree, we see that this equates to haplogroup R1a1a1b1a1.  I didn’t expect CTS11962 to be on the ISOGG tree just yet, and it isn’t, but neither is it anyplace else, so we basically have our hands tied relative to where this falls on the R tree until someone places it someplace.  I know that there is what is affectionately referred to as the “Big Paper” in the works that reworks the haplotree, and I surely hope it’s published sooner than later.  Yes, I know, that patience thing again…..sigh.

geno kick y map

You can also view this haplogroup information as a heatmap.

geno kick heat map

Under the “future” button, they ask you to complete your profile and contribute your story.  You may have noticed that these options are stepping you across the tabs at the top of the introductory page.

geno kick next

Under the “Our Story” tab, which is where the “Contribute Your Story” link takes you, they explain about the community and social networking aspects of Geno 2.0.

geno kick our story

Most interesting is the relationship circle, which looks like either a 45RPM record, a CD/DVD or the front of an i-pod, depending on your age.  The stars and planets are the people who are “related” to you and the larger planets are those with stories attached.  You just click on a planet to see their “story.”  The closer they are to the center, the more closely related they are to you, but I’m unsure how “related” is gauged.  For example if you click on the CTS11962 link, does this mean that everyone carries that mutation, or that it’s the terminal SNP for everyone listed?  If it’s the terminal SNP for everyone listed, wouldn’t they all be equally as closely related?  Jim’s V link doesn’t work, but the same questions apply.

geno kick circle

And at the bottom of this page, you can add your own story.

geno kick your story

I understand in the future that one will be able to contact these “related” people.  If so, and if they haven’t tested their STR markers or their mitochondrial DNA at Family Tree DNA, we can encourage them, or invite them, to do so.

And speaking of which, the one thing I really DON’T like is what they’ve done with the download to Family Tree DNA option.  In Geno 1.0, the transfer option said something like “to learn more,” but was tiny and obscure, at the bottom of a page where you had to scroll multiple times.  I’m sure the reason that only 20% of the people ever transferred to Family Tree DNA was because only 20% of the people stumbled across the link and followed it.  Actually, the fact that 20% actually found it is pretty amazing and speaks highly of how interested people actually are in the Genographic project and their results.  This function and where it’s located is even worse in this version.

To initiate a transfer to Family Tree DNA, first, you have to know that you want to do this. There is no enticing “advertising” or education like there is for other information.  This would be a wonderful opportunity for a nice video or at least a writeup and a link that at least says “to learn more” encourages people to investigate.  Now, you need to go to your Profile link, and under the profile link, click on the Advanced Options.

Nope, I don’t think even 20% of the people will find this.  I’ve very disappointed and hope they will reconsider and rework this option.

I am very hopeful that with some constructive and pleasant feedback that perhaps Nat Geo will reconsider and bring this transfer option into line with the otherwise wonderfully designed and world-class project pages.  Their e-mail address is genographic@ngs.org.

Genographic has so much to offer and Family Tree DNA’s customers and project administrators have played a huge role in recruiting for both Geno 1.0 and 2.0.  I’d really like to be sure that all Geno 2.0 participants receive everything they can out of the total genetic genealogy and anthropology experience.  After all, this is the story of all of us, the human population, and we’re all connected.  The only question is how closely we’re related, and when we get close enough in that tree, can we put names and faces on our ancestors, preferably with a few dates and locations as well?  Hence, it’s a continuum from anthropology to genealogy.  It needs to be a continuum from Nat Geo to FTDNA too.

One thing is for sure, we’re getting closer and closer as we learn more and more.  The tools keep improving and one by one, those brick walls are falling.

Well, we’ve kicked the tires a bit and I think this one is a keeper.  I think National Geographic has done a wonderful job of making a topic that has become increasingly complex over the past few years understandable to the average citizen who will take this test and look at their results with a sense of adventure and curiosity.  The website is beautifully designed.  Don’t shortchange yourself by hurrying through and not taking time to look at all of the photos, stories and videos, and be sure to click on the little “i” icon which means more information.  There’s a lot here to savor, slowly, like a connoisseur of fine food or a wonderfully spellbinding book.

I think what I’ve decided though, relative to autosomal DNA testing and ethnicity is that there is no one answer, there is really only a matter of degrees.  Today, with the different testing companies using different population data references, we receive differing results. I don’t worry too much unless they are significantly different, then I have to scratch my head a bit.

When my own results come back I’ll be doing some comparisons on how minority admixture stacks up using the different autosomal tests and analysis tools available.  We kicked the tires today, but soon, we’ll be taking a test drive to see what we can actually do with all of this. So, stay tuned and in the mean time, savor those results!  After all, on the first day of Christmas, my true love gave to me, a new SNP on my own family tree.

______________________________________________________________

Disclosure

I receive a small contribution when you click on some of the links to vendors in my articles. This does NOT increase the price you pay but helps me to keep the lights on and this informational blog free for everyone. Please click on the links in the articles or to the vendors below if you are purchasing products or DNA testing.

Thank you so much.

DNA Purchases and Free Transfers

Genealogy Services

Genealogy Research

Family Tree DNA Conference 2012 – Nits and Grits

First things first!  I want to thank Max and Bennett for graciously hosting the 8th Annual Genetic Genealogy Conference in Houston, Texas!  This is actually the 9th year, but a pesky hurricane interfered one year.  Max and Bennett are very generous with their time and resources and heavily subsidize this conference for us.  We’re registering in the photo above.

Georgia Kinney Bopp said it best.  At some point during this amazing conference, someone tweeted an earlier quote from a conversation between Ann Turner and Georgia:

“it’s hard to realize you’re living history while it happens…”

This was ever so true this weekend.  Even my husband (who is not genetic genealogy crazy) realized this.  I’m not sure everyone at the conference did, or realized the magnitude of what they were hearing, as we did have a lot of newbies.  Newbies are a good thing.  It means our obsessive hobby and this industry have staying power and there will be people to pass the torch to someday.

I’ve already covered the Native American focus meeting in an earlier blog.

For those of you who want the nitty gritty play by play as it happened at the conference, go to www.twitter.com and search for hashtag #ftdna2012.  If you want some help with Twitter, I blogged about that too.  Twitter is far from perfect, but it is near-realtime as things are happening.

As always, Family Tree DNA hosts a reception on Friday evening.  This helps break the ice and allows people to put faces with names.  So many of us “know” each other by our e-mail name and online presence alone.

We had a special guest this year too, Nina, a little puppy who was rescued by Rebekah Canada just a few days before the conference.  Nina behaved amazingly well and many of us enjoyed her company. 

Bennett opened the conference this year, and in the Clint Eastwood political tradition, spoke to his companion, the chair named Max.  The real Max, it turns out, was losing his voice, but that didn’t prevent him from chatting with us and answering questions from time to time.

While Bennett was very low key with this announcement, it was monumental.  He indicated that the parent company of Family Tree DNA has reorganized a bit.  It has changed its name to Gene by Gene and now has 4 divisions.  You can check this out at www.genebygene.com.  This isn’t the monumental part.

The new division, DNADTC’s new products are the amazing parts.  Through this new division, they are the first commercial company to offer a full genome sequence test.  The price, only $5495.  For somewhat less, $695, they are offering the exome, which are your 20,000 genes.  Whoever though it would be a genetic genealogy company who would bring this to the public.  Keep in mind that the human genome was only fully sequenced in 2003 at a cost of 3 billion dollars.

The amazing part is that a full genome sequence cost about 3 million in 2007 and the price will continue to fall.  While consumers will be able to order this, if they want, it comes with no tools, as it is focused at the research community who would be expected to have their own analytical tools.  However, genetic genealogists being who and what they are, I don’t expect the research market will outweigh the consumer market for long, especially when the price threshold reaches about $1000.

Bennett also said that he expects that National Geographic will, in 2013 sometime, decide to allow upgrades from Family Tree DNA clients for the Geno 2.0 product.  This will allow those people who cannot obtain a new sample to participate as well.  However, an unopened vial will be required.  No promises as to when, and the decision is not his to make.

The first session was Spencer Wells via Skype from Italy.  Spencer has just presented at two conferences within the week, one in San Francisco and one in Florence, Italy.  Fortunately, he was able to work us into his schedule and he didn’t even sound tired.

Of course, his topic was the Geno 2.0 test which is, of course, run on the new GenoChip.  The first results are in the final stages of testing, so we should see them shortly.  Sometime between the 19th and the end of the month.

This product comes with all new migration maps.  He showed one briefly, and I noticed that one of the two Native Y-lines are now showing different routes than before.  One across Siberia, which hasn’t changed, and one up the pacific rim.  Hmmm, can’t wait for that paper.

The new maps all include heat maps which show frequency by color.  The map below is a haplogroup Q heat map, but it is NOT from the Geno project.  I’m only using it as an example.

Spencer indicated that the sales of the 2.0 product rival those of the 1.0 product and that they have sold substantially more than 10K and substantially less than 100K kits so far.  In total, they have sold more than 470,000 kits in over 130 countries.  And that’s just the public participation part, not the indigenous samples.  They have collected over 75,000 indigenous samples from more than 100 populations resulting in 36 publications to date with another half dozen submitted but not yet accepted.  Academic publication is a very long process.

Nat Geo has given 62 legacy grants to indigenous communities that have participated totaling more than 1.7 million dollars.  That money comes in part from the public participation kits, meaning Geno 1.0 and now 2.0.

Geno 2.0 continues to be a partnership between National Geographic and Family Tree DNAFamily Tree DNA is running all of their samples in the expanded Houston lab.  Also added to the team is Dr. Eran Elhaik at Johns Hopkins University who has developed a new tool, AIMSFINDER, that locates never before identified Ancestral Informative Markers to identify population specific markers.  This is extremely important because it allows us to read our DNA and determine if we carry the markers reflective of any specific population.  Well, we don’t do the reading, they do with their sophisticated software.  But we are the recipients with the new deep ancestral ethnicity results which are more focused on anthropology than genealogy.  Spencer says that if you have 2% or more Native American, they can see it.  They have used results from both public and private repositories in developing these tools.

This type of processing power combined with a new protocol that tests all SNPS in a sequence, not just selected ones, promises to expand the tree exponentially and soon. It has already been expanded 7 fold from 863 branches of the Y tree to 6153 and more have already been discovered that are not on the GenoChip, but will be in the next version.

The National Geographic project will also be reaching out to administrators and groups who may have access to populations of interest.  For example, an ex-pat group in an American city.  Keep this in mind as you think of projects.

Another piece of this pie is a new educational initiative in schools called Threads.

This isn’t all, by any means, on this topic, I really do encourage you to go and use Twitter hashtag #ftdna2012.  Several of us were tweeting and the info was coming so fast and furious that no one could possibly get it all.

The future with Nat Geo looks exceedingly bright.  We have gone from the Barney Rubble age to the modern era and now there is promise for a rosy and as yet undiscovered future.

Judy Russell was next.  I have to tell you, when I saw where they positioned her, I was NOT envious.  I mean, who wants to follow Spencer Wells, even if he’s not there in person.  Well, if anyone was up to this, it certainly was Judy.  For those who don’t know, she blogs as The Legal Genealogist.

Judy is one of us.  That means she actually understands our industry, what drives genealogists and why.  In addition to being a lawyer, she is a certified genealogist and a genetic genealogy crazy too.  Maybe I shouldn’t call a lawyer crazy….well…it was meant as a compliment:)

Judy has the perspective to help us, not just criticize us remotely.  She reviewed several areas where we might make mistakes.  After all, we’re all volunteers coming from quite varied backgrounds.  She suggests that we all put some form of disclosure on our projects explaining what participants can expect in terms of use.  She used the Core Melungeon project as a good example, along with the Fox project.

“The goal of this project is to use DNA to better understand the origins of the Melungeon people, and this will be done by comparing the DNA with other project members, those outside of projects, and will incorporate relevant genealogical and historical research. All participants will be included in the ongoing studies and by joining the project, you are giving consent for your information to be anonymously included in ongoing genetic genealogy research. Your personal identity will not be revealed, but your results will be used to better understand the Melungeons as a people and their ancestors.”

From the Fox project:

“The exact function of these STR markers is not yet known and they have no known medical function but recent research shows they have some sort of regulatory function on the genes. While there is no medical information in these numbers, the absence of a certain few markers near a fertility gene could indicate sterility – something that would certainly already be known.

The results do provide a partial means of personal identification and, for this reason, our haplotype tables list only the FTDNA kit number and the most distant known male line ancestor. Within the project, however, the administrators feel free to disclose identities, particularly when a close match occurs.”

Judy’s stressed that we not tell people that there is no medical information revealed.  Partially, because we’ve discovered in rare cases that’s not true, and partially because we can’t see into the future.

Judy talked about regulation and that while we fear what it might intentionally or inadvertently do to genetic genealogy, it’s important to have regulations to get rid of the snake oil salesman, and yes, there are a couple in genetic genealogy.  They give us all a black eye and a bad name when people discover they’ve been hoodwinked. However, without regulation of some sort, we have no legal tools to deal with them.

Regulation certainly seems to be a double-edged sword.

I hope that Judy writes in her blog about what she covered in her session, because I think her message is important to all administrators and participants alike.  And just to be clear, the sky is not falling and Judy is not Chicken Little.  In fact, Judy is the most interesting attorney I have ever heard speak, and amazingly reasonable too.  She actually makes you WANT to listen, so if you ever get the chance to see one of her webcasts or attend one of her sessions, take the opportunity.

Following the break, breakout sessions began.  CeCe Moore ran one about “Family Finder,” Elise Friedman about “Group Administration” and Thomas Krahn provided the “Walk the Y Update.”  Bennett called this the propeller head session.  Harumph Bennett.  Guess you know which one I attended.  All sessions were offered a second time on Sunday.

Thomas said that they have once again upgraded their equipment, doubling their capacity again.  This gives 4 times the coverage of the original Walk the Y, covering more than 5 million bases.  To date, they have run 494 pre-qualified participants and of those, 198 did not find a new SNP.

There are changes coming in how the palindromic region is scored which will change the matches shown.  Palindromic mismatches will now be scored as one mutation event, not multiples.  Microalleles will able be reported in the next rollout version, expected probably in January.  The problem with microalleles is not the display, but the matching routine.

Of importance, there has not been an individual WTY tested from haplogroups B, M, D or S, and we need one.  So if you know of anyone, please contact Thomas.

Thomas has put his Powerpoint presentation online at  http://www.dna-fingerprint.com/static/FTDNA-Conference-2012-WalkThroughY.pdf

The next session by Dr. Tyrone Bowes was “Pinpointing a Geographical Location Using Reoccurring Surnames Matches.”  For those of us without a genetic homeland, this is powerful medicine.  Dr. Bowes has done us the huge favor of creating a website to tell us exactly how to do this.  http://www.irishorigenes.com/

He uses surnames, clan maps, matches, history and census records to reveal surname clusters.  One tidbit he mentioned is that if you don’t know the family ethnicity, look at the 1911 census records and their religion will often tell you.  Hmm, never thought of that, especially since our American ancestors left the homeland long ago.  But those remaining in the homeland are very unlikely to change, at least not in masse.  I’m glad he gave this presentation, or I would never have found his webpage and I can’t wait to apply these tools to some of my sticky-wickets.

This ended Saturday’s sessions, but at the end of every day, written questions are submitted for that day’s presenters or for Family Tree DNA.

Bennett indicated that another 3000 or 4000 SNPs will be added to the Family Finder calculations and a new version based on reference samples from multiple sources will be released in January.

Bennett also said that if and when Ancestry does provide the raw downloadable data to their clients, they will provide a tool to upload so that you can compare 23andMe and Ancestry both with your Family Finder matches.

Saturday evening is the ISOGG reception, also called the ISOGG party.  Everyone contributes for the room and food, and a jolly good time is had by all.  There is just nothing to compare with face to face communications.

For me, and for a newly found cousin, this was an amazing event.  A person named Z. B. Stroud left me a message that she was looking for me.  When I found her, along with her friend and cousin Revis, she tells me that she matches me autosomally, at 23andMe, and that she had sent me a sharing request that I had ignored.  I am very bad about that, because unless someone says they are related, I presume they aren’t and I don’t like to clutter up my list with non-related people.  It makes comparisons difficult.  My bad.  In fact, I’m going right now to approve that sharing request!!!

I will blog about this in the future, but without spilling too many beans….we had a wonderful impromptu family reunion.  We think our common ancestor is from the Halifax and Pittsylvania County region of Virginia, but of course, it will take some work to figure this out.

I’m also cousins with Revis Leonard (second from left).  We’ve known that for a long time, but Z.B. whose first name is Brisjon (second from right) is new to genealogy, DNA and cousin matching. I’m on the right above.  The Stroud project administrator, Susan Milligan, also related to Brisjon is on the left end.  In the center are Brisjon’s two cousins who came to pick her up for dinner and whom she was meeting for the first time.

But that’s not all all, cousin Brisjon also matches Catherine Borges.  Let me tell you, I know who got the tall genes in this family, and I’m not normally considered short.  Brisjon’s genealogical journey is incredibly amazing and she will be sharing it with us in an upcoming book.  Suffice it to say, things are not always what you think they are and Brisjon is living proof.  She also met her biological father for the first time this weekend!  I’m sure Houston and her 2012 visit where she met so many family members is a watershed event in her lifetime!  She is very much a lovely lady and I am so happy to have met her.  Cousins Rule!

ISOGG traditionally has its meeting on Sunday morning before the first session.  Lots of sleepy people because everyone has so much fun at the ISOGG party and stays up way too late.

Alice Fairhurst, who has done a remarkable job with the ISOGG Y SNP tree (Thank you Alice!) knows an avalanche is about to descend on her with the new Geno 2.0 chip.  They are also going to discontinue the haplogroup names, because they pretty much have to, but will maintain an indented tree so you can at least see where you are.  The names are becoming obsolete because everytime there is an insertion upstream, everything downstream gets renamed and it makes us crazy.  It was bad enough before, but going from 860+ branches to  6150+ in one fell swoop and knowing it’s probably just the beginning confirms the logic in abandoning the names.  However, we have to develop or implement some sort of map so you can find your relative location (no pun intended) and understand what it means.

Alice also mentioned that they need people to be responsible for specific haplogroups or subhaplogroups and they have lost people that have not been replaced, so if anyone is willing or knows of anyone….please contact Alice.

Alice also makes wonderful beaded double helix necklaces.

Brian Swann (sorry, no picture) is visiting from England this year and he spoke just a bit about British records.  He said it’s imperative to learn how they work and to use some of the British sites where they have been indexed.  He also reminded us to check GOONS (Guild of One Name Studies) for our surnames and that can help us localize family groups for recruiting.  He said that you may have to do family reconstructions because to get a Brit to test you have to offer them something.  That’s not terribly different from over here.  He also mentioned that today about half of the British people having children don’t marry, so in the next generation, family reconstruction will be much more difficult.  That too isn’t so terribly different than here, although I’m not sure about the percentages.  It’s certainly a trend, as are varying surname practices even within marriage.

Dr. Doron Behar began the official Sunday agenda with a presentation about the mtCommunity and a discussion of his recently published paper “A ‘Copernican’ Reassesement of the Human Mitochondrial DNA Tree from its Root.”  This paper has absolutely revolutionized the mitochondrial DNA community.  I blogged about this when the paper was first released and our home pages were updated.    One point he made is that it is important to remember is that your mutations don’t change.  The only thing that changes between the CRS (Cambridge Reference Sequence) and the RSRS (Reconstructed Sapiens Reference Sequence)  model is what your mutations are being compared to.  Instead of being compared to someone from Europe who live in 1981 (the CRS) we are now comparing to the root of the tree, Mitochondrial Eve (RSRS) as best we can reconstruct what her mitochondrial DNA looked like.

He also said that when people join the mtCommunity, their results are not automatically being added to GenBank at NCBI.  That is a separate authorization check box.

A survey was distributed to question participants as to whether they want results, when they select the GenBank option, to be submitted with their kit number.  Now, they are not, and they are under Bennett’s name, so any researcher with a question asks Bennett who has no “track back” to the person involved.  About 6000 of the 16,000 submissions today at GenBank are from Family Tree DNA customers.  Dr. Behar said that by this time next year, he would expect it to be over half.  Once again, genetic genealogy pioneers are leading the way!

At these conferences, there is always one session that would be considered the keynote.  Normally, it’s Spencer Wells when he is on the agenda, and indeed, his session was wonderful.  But at the 2012 conference, this next session absolutely stole the show.  Less public by far, and much less flashy, but at the core root of all humanity.

You can’t really tell from the title of this session what is coming.  Michael Hammer with Thomas Krahn and Bonnie Schrack, one of our own citizen scientists, presented something called “A Highly Divergent Y Chromosome Lineage.”  Yawn.  But the content was anything but yawn-material.  We literally watched scientific discovery unfold in front of our eyes.

Bonnie Schrack is the haplogroup A project administrator.  Haplogroup A is African and is at the root of the entire haplotree.  One of Bonnie’s participants, an African American man from South Carolina agreed to participate in WTY testing.  In a nutshell, when Thomas and Astrid began scoring his results, they continued and continued and continued, and wound up literally taking all night.  At dawn’s first light, Thomas told Astrid that he thought they had found an entirely new haplogroup that preceded any known today.  But he was too sleep deprived to be sure. Astrid, equally as sleep deprived, replied with “Huh?” in disbelief.  It’s certainly not a statement you expect to hear, even once in your lifetime.  This is a once in the history of mankind event.

Dr. Michael Hammer confirmed that indeed, they had discovered the new root of the human Y tree.  And not by a little either, but by a lot.  For those who want to take a look for yourself, Ysearch ID 6M5JA.  Hammer’s lab did the age projection on this sample, and it pushed the age of hominid men back by about 100,000 years, from 140,000 years ago to 237,000 years ago.  They then reevaluated the aging on all of the tree and have moved the prior date to about 200,000 years ago and the new one to about 338,000 years ago with a 98% confidence level.  This is before the oldest fossils that have been found, and also before the earliest mitochondrial DNA estimate, which previously had been twice as old as the Yline ancestor.

The previous root, A1b has been renamed A0 and the new root, just discovered is now A00.  Any other new roots discovered will simply get another zero appended.

How is it that we’ve never seen this before?  Well, it turns out that this line nearly went extinct.  Cruciani published a paper in 2012 that included some STR values that matched this sample, but fortunately, Michael Hammer’s lab held the actual samples.  A search of academic data bases reveals only a very few close matches, all in western Cameroon near the Gulf of Guinea.  Interestingly, next door, in Nigeria, fossils have been found younger than this with archaic features.  This is going to cause us to have to reevaluate the source of this lineage and with it the lineage of all mankind.  We must now ask the question about whether perhaps we really have stumbled upon a Neanderthal or other archaic lineage that of course “became” human.  Like many scientific discoveries, this answer only begs more questions.  My husband says this is like Russian tea dolls where ever smaller ones are nested in larger ones.

This discovery changes the textbooks, upsets the proverbial apple cart in a good way, and will keep scientists’ thinking caps on for years.  And to think, this was a result of one of our projects, an astute project administrator (Bonnie) and a single project member.  I wonder what the man who tested thinks of all of this. He is making science and all he thought he was doing was testing for genealogy.  You just never know where the next scientific breakthrough will come from.  Congrats to all involved, Bonnie, Thomas, Michael and to Bennett and Max for having this evolution revolution happen right in their lab!

If I felt sorry for Judy following Spencer, I really felt sorry for the breakout sessions following Thomas, Michael and Bonnie’s session.  Thankfully at least we had a break in-between, but most people were wandering around with some degree of stunned disbelief on their faces.  We all found it hard to fathom that we had been among the first to know of this momentous breakthrough.

I had a hard time deciding which session to attend, CeCe’s “Family Finder” session or Elise’s.  I decided to attend Elise’s “Advanced Admin Techniques” because I work with autosomal DNA with my clients and I tend to keep more current there.  Elise’s session was great for newer admins and held tips and hints for us old-timers too.  I realized I really need to just sit down and play with all of the options.

There are some great new features built in that I’ve never noticed.  For example, did you know that you can group people directly from the Y results chart without going to the subgrouping page?  It’s much easier too because it’s one step.  However, the bad news is that you still can’t invite someone who has already tested to join your project.  Hopefully that feature will be added soon.

The next session was “A Tale of Two Families” given by Rory Van Tuyl detailing how he used various techniques to discern whether individuals who did not show up as matches, meaning they were beyond the match threshold, were actually from the same ancient family or not.  Rory is a retired engineer and it shows in his attention to detail and affinity for math.

We always tell people that mutations can and do happen at any time, but Rory proved this.  He ran a monte-carlo simulation and showed that in one case, it was 50 generations between mutations, but in others, there was one mutation for three generations in a row.  Mutations by no means happen at a constant rate.  Of course, this means that our TIP calculator which has no choice but to use means and averages is by definition “not calibrated” for any particular family.

He also mentioned that his simulation shows that by about 150 generations, there are a couple of back mutations taking place.

The final session before the ending Q&A was Elliott speaking about IT, which really translates into new features and functions.  Let’s face it, today everything involves IT.

Again, I was having trouble typing fast enough, so you might want to check the Twitter feed.

They added the SNP maps (admins, please turn them on) and the interactive tour this year.  The tour isn’t used as much as it should be, so everyone, encourage your newbies to do this.

They have also added advanced matching, which I use a lot for clients, but many people didn’t realize it.  So maybe a quick tour through the website options might be in order for most of us.

They are handling 50 times more data now that a year ago.  Just think what next year will bring.  Wow.

They are going to update the landing page again with more color and more visible options for people to do things.  I hope they prompt people through things, like oldest ancestor mapping, for example.  Otherwise, if it isn’t easy, most don’t.

They are upgrading Population Finder and the Gedcom viewer.  They are adding a search feature.  Thank you!!  Older Gedcome will still be there but not searchable.

But the best news is that they are adding phasing (parent child) and an advanced capability to “reconstruct” an ancestor using more distant relatives, then the ability to search using that ancestral profile against Family Finder.  Glory be!  We are finally getting there.  Maybe my dreaming big wasn’t as far away as I thought.

They will also remove the 5 person autosomal download restriction and the “in common with” requirement to see additional information.  All good news.  They are also upgrading the Chromosome browser to add more filtering options.

They are also going to offer a developer “sandbox” area for applications.

The final Q&A session began with Bennett saying that their other priorities preclude upgrading Y search to 111 markers.

They are not planning to drop the entry level tests, 12 or 25 markers or the HVR1. If they do, lots of people will never take that plunge.  I was very glad to hear this.

And by way of trivia, Family Tree DNA has run more than 5 million individual tests.  Wow, not bad for a company that didn’t exist, in an industry that didn’t exist, 12 years ago!

It’s an incredible time to be alive and to be a genetic genealogist!  Thank you Family Tree DNA for making all of this possible.

______________________________________________________________

Disclosure

I receive a small contribution when you click on some of the links to vendors in my articles. This does NOT increase the price you pay but helps me to keep the lights on and this informational blog free for everyone. Please click on the links in the articles or to the vendors below if you are purchasing products or DNA testing.

Thank you so much.

DNA Purchases and Free Transfers

Genealogy Services

Genealogy Research

What to Order? – Geno 2.0 vs Family Tree DNA Products

Update: Please note that the Genographic kits are no longer available, but the Family Tree DNA products are. You can click here to order.

There have been a lot of questions lately about what to order from whom and why relative to the Geno 2.0 kit and the Family Tree DNA products.  I’ve but together the following table as a “cheat sheet” that includes the basic reasons that people order one versus the other, or both.

In a nutshell, if it’s genealogy you’re interested in, then you want to order the Family Tree DNA products because they provide you with specific mutation locations, the mutation values and a list of matches to other people based on those mutations.  The Geno 2.0 tests are more anthropological (deep ancestry) in nature.  In some cases, specifically the Y-line testing, these tests go hand in hand.

Product Desired Family Tree DNA Geno 2.0
Y-Line
Markers for genealogy, matches with other people in a genealogical timeframe 12, 25, 37, 67 and 111 markers and values, includes matches and other tools No
Haplogroup assignment Included with purchase of above markers at a general level.  Can then order additional SNP tests or Geno 2.0 to obtain deeper results. Extensive – deepest available within industry and inclusive of SNPs discovered through November 2011
Ethnicity of that specific line based on haplogroup assignment Yes Yes
Maps, haplogroup origins Yes Yes
Mitochondrial DNA
Mutations for genealogy, matches with other people in a genealogical timeframe mtDNA (HVR1), mtDNAPlus (HVR1+HVR2) and full sequence mutations, includes matches and other tools. No
Haplogroup assignment Included with purchase at general level.  Full assignment at deepest level with the full sequence. Yes, deepest level.
Ethnicity of that specific line based on haplogroup assignment Yes Yes
Maps, haplogroup origins Yes Yes
Autosomal Family Finder
Ethnicity percentages for all ancestral lines combined* Yes Yes
Cousin matches Yes, list of matches provided with common surnames if information provided by tester No
Download of data Yes Yes
Transfer to Family Tree DNA N/A Yes – must be manually initiated
Social Networking Tools No Yes – not at initial release

*Note that the ethnicity percentages will be calculated using different base populations and the results will likely be somewhat different.  The National Geographic product is using new SNP data gathered through their field work within the Genographic Project.  So while this information is provided in both tests, I would not presume it will be the same nor that it is duplicative.

This table isn’t meant to be a description or comparison of every feature in the various tests, but the decision criteria to purchase one type of test versus the other.

______________________________________________________________

Disclosure

I receive a small contribution when you click on some of the links to vendors in my articles. This does NOT increase the price you pay but helps me to keep the lights on and this informational blog free for everyone. Please click on the links in the articles or to the vendors below if you are purchasing products or DNA testing.

Thank you so much.

DNA Purchases and Free Transfers

Genealogy Services

Genealogy Research

To SNP or not to SNP??

I received an e-mail the other day from someone who had been asked to take a SNP test by their project administrator.  What they asked me was, “Why would I want to do this and what’s in it for me?”  Seems like a simple enough question, but not exactly.

The quick answers are twofold:

  1. It further defines your haplogroup and…
  2. You can participate in science research.

Unfortunately, this just leads to the next question, “Why do I care?”

So here’s the longer but more accurate answer….and by the way…when you’re done reading this, you’ll understand why it matters, personally, to you.  And you’ll probably want to order a SNP test or two.

I’m going to use the haplogroup E project for an example.  I’m a co-administrator of the project, along with two other individuals, one of which is a population geneticist.  I am very, very grateful for Aaron’s interest in the project.

As project administrators, we feel that it’s our responsibility to group people within the project in a way that is both helpful to them and to scientific research.  Fortunately, these goals do not conflict and are one and the same.

The haplogroup E1b1a, which is the core haplogroup of this project, as opposed to brother haplogroup E1b1b, is defined by a series of SNPs.  Each letter and number after the initial E is defined by a SNP.  So each additional letter or number makes the resulting haplogroup more specific.  More specific means more granular in both geography and time when the haplogroup, and subgroups, were born.

  • Haplogroup E, itself, is defined by L339 and 10 more “equivalent” SNPS
  • E1 is defined by P147
  • E1b is defined by P177
  • E1b1 is defined by P179 and 4 more equivalent SNPs
  • E1b1a is defined by M2 and 9 more equivalent SNPs

In the haplotree, there was a big split between E1b1a, which is Sub-Saharan African and E1b1b, which is North African/Mediterranean, known colloquially as the Berber haplogroup.  Therefore, two separate projects make sense.

The project is officially known as the E1b1a-M2 project.  M2 is what is known at the “terminal SNP,” meaning the one furthest down the tree that defines E1b1a.

On the haplotree above, you can see the lighter green M2+ SNP that was tested to confirm that this person was indeed in haplogroup E1b1a.  The plus means that they have the SNP.  If they didn’t have this SNP, then they would not be in this subgroup of haplogroup E1b1.

The orange SNPs listed below the E1b1a branch, on the haplotree above, are all of the SNPs available to be tested to see if you are in those haplogroup subgroups.  Want to know which branch is yours?  If so, then now you know why you’d want to test.

Let’s look at the project map to see why you might want to determine a subhaplogroup.

The map below shows the entire E1b1a project with all of the participants.

Do you see all of those people in the Americas?  Well, those are participants who are people of African heritage who very much would like to see their balloon in the African continent, not on the shores of the Americas.  The only way to determine where these people originated in Africa is to do the research that will connect the dots genetically, because we can’t do it via paper records, to where their ancestors lived in Africa.

In order to do this, people need to take SNP tests for specific markers so that their results can be correlated with African groups.  Tests for individual SNPs are only $29 each, so really quite inexpensive for the benefit you, and science, receive.

Aaron, the haplogroup E1b1a geneticist, has divided the participants into groups, and using his expertise, has determined which individual SNPs are the most beneficial.  A Deep Clade test is $139, but generally, Aaron can tell which subgroup people are likely to fall into, so he requests just a SNP or two.  You can test a lot of individual SNPS for $139.  Additionally, sometimes Family Tree DNA makes SNPs available for research testing that are not on the price list yet, and the only way to get these tested is via what is called “boutique testing,” where you order one at a time, through the haplogroup administrator.

When Aaron sees someone who would benefit from this kind of test, he e-mails the person and asks them if they will take the specific SNP test.

Let’s look at an example.

We have a very, very interesting situation where we have a man whose ancestral line is confirmed to be from Austria.  This is highly unusual, as E1b1a is very clearly African and is seldom to never found in Europe ancestrally.  However, this genealogy is well documented.

You can see on the above map that Aaron has grouped a number of people together whose DNA has similar characteristics, meaning groups and values of markers.  He wants all of these people to take specific SNP tests, which you can see on the drop down box as the title of the group.  This is standard practice for haplogroup project administrators.

On the map, you can see where these participants’ oldest ancestors are found. One in Austria, one in Africa and the rest in the Americas who are brick walled.

This map shows project participants.  In order to look at where the research papers place these people ancestrally using genetic information, we need to use a different tool.

We don’t know the African location origins of this particular group of people, which is why these SNP tests are so critically important.  We need to match them in research data bases with other people who have these same SNPs.

Let’s look at the haplogroup origins of someone within a different subgroup of E1b1a who is also brickwalled in the US. Shown below is the Haplgroup Origins chart from their personal page, showing their matches.

You can see that several haplogroup matches, progressively more detailed (E1b1a to E1b1a7 to E1b1a7a3), have origins in Africa.  The more detailed your SNP test, the more detailed your haplogroup, the more detailed and specific your location can and will be, if not today, then eventually.

You can see above that this person, who has only tested to the E1b1a level, matches an E1b1a7a3 individual who is from the Bakola Pygmy tribe in Cameroon.   If this person were to take the SNP tests, they would know if they too are haplogroup E1b1a7a3.  If so, there is a very good possibility they too are a descendant of the Bakola Pygmy tribe in Cameroon. This is extremely powerful information for someone searching for their roots – the Holy Grail of genetic genealogy.  But they will never know if they don’t SNP test, either by individual SNPs ($29 or $39 each) or the Geno 2.0 test ($199).

If you’re lucky, the research on your particular SNP location in Africa has already been done.  But you’re never too late to this party, because as new SNPs are discovered, there are always new opportunities to test.  That’s the ying and the yang of pushing the frontiers of science.

We are REALLY fortunate, because we live in a time where we can be participants in scientific discovery that not only helps us find your our own ancestors, but helps many others who are brick walled with no other hope of finding their ancestral homeland.  This doesn’t just apply to the African haplogroups, but to all haplogroups.  This is exactly how the revolutionary discoveries of the past few months and years that led to the new Geno 2.0 test came about.  One person and one SNP test at a time.

Want to find your ancestors AND make science happen???  SNP test!

This is a companion article to Where is my Haplogroup From?

______________________________________________________________

Disclosure

I receive a small contribution when you click on some of the links to vendors in my articles. This does NOT increase the price you pay but helps me to keep the lights on and this informational blog free for everyone. Please click on the links in the articles or to the vendors below if you are purchasing products or DNA testing.

Thank you so much.

DNA Purchases and Free Transfers

Genealogy Services

Genealogy Research