Ethnicity Results – True or Not?

I can’t even begin to tell you how many questions I receive that go something like this:

“I received my ethnicity results from XYZ.  I’m confused.  The results don’t seem to align with my research and I don’t know what to make of them?”

In the above question, the vendors who are currently offering these types of results among their autosomal tests are Family Tree DNA, 23andMe and Ancestry along with National Geographic who is a nonprofit.  Of those four, by far, Ancestry is the worst at results matching reality and who I receive the most complaints and comments about.  I wrote an article about Ancestry’s results and Judy Russell recently wrote an article about their new updated results as did Debbie Kennett.  My Ancestry results have not been updated yet, so I can’t comment personally.

Let’s take a look at the results from the four players and my own analysis.

Some years back, I did a pedigree analysis of my genealogy in an attempt to make sense of autosomal results from other companies.

This paper, Revealing American Indian and Minority Heritage Using Y-line, Mitochondrial, Autosomal and X Chromosomal Testing Data Combined with Pedigree Analysis was published in the Fall 2010 issue of JoGG, Vol. 6 issue 1.

The pedigree analysis portion of this document begins about page 8.  My ancestral breakdown is as follows:

Geography Percent
Germany 23.8041
British Isles 22.6104
Holland 14.5511
European by DNA 6.8362
France 6.6113
Switzerland .7813
Native American .2933
Turkish .0031

This leaves about 25% unknown.  However, this looks nothing like the 80% British Isles and the 12% Scandinavian at Ancestry.

Here are my current ethnicity results from the three major testing companies plus Genographic.

Ancestry

80% British Isles

12% Scandinavian

8% Uncertain

Family Tree DNA

75% Western Europe

25% Europe – Romanian, Russian, Tuscan, Finnish

23andMe (Standard Estimate)

99.2% European

0.5% East Asian and Native American

0.3% Unassigned

Genographic 2.0

Northern European – 43%

Mediterranean – 36%

Southwest Asian – 18%

Why Don’t The Results Match?

Why don’t the results match either my work or each other?

1. The first answer I always think of when asked this question is that perhaps some of the genealogy is incorrect.  That is certainly a possibility via either poor genealogy research or undocumented adoptions.  However, as time has marched forward, I’ve proven that I’m descended from most of these lines through either Y-line, mitochondrial DNA or autosomal matches.  This confirms my genealogy research.  For example, Acadians were originally French and I definitely descend from Acadian lines.

2. The second answer is time.  The vendors may well be using different measures of time, meaning more recent versus deep ancestry.  Geno 2.0 looks back the furthest.  Their information says that “your percentages reflect both recent influences and ancient genetic patterns in your DNA due to migrations as groups from different regions mixed over thousands of years.  Your ancestors also mixed with ancient, now extinct hominid cousins like Neanderthals in Europe and the Middle East of the Denisovans in Asia.”

It’s difficult to determine which of the matching populations are more recent and which are less recent.  By way of example, many Germans and others in eastern Europe are descendants of Genghis Khan’s Mongols who invaded portions of Europe in the 13th century.  So, do we recognize and count their DNA when found as “German,” “Polish,” “Russian,” or “Asian?”  The map below shows the invasions of Genghis Khan.  Based on this, Germans who descend from Genghis’s Mongols could match Koreans on those segments of DNA. Both of those people would probably find that confusing.

genghis khan map

3. The third answer is the reference populations.  Here is what National Geographic has to say: “Modern day indigenous populations around the world carry particular blends of these regions. We compared your DNA results to the reference populations we currently have in our database and estimated which of these were most similar to you in terms of the genetic markers you carry. This doesn’t necessarily mean that you belong to these groups or are directly from these regions, but that these groups were a similar genetic match and can be used as a guide to help determine why you have a certain result. Remember, this is a mixture of both recent (past six generations) and ancient patterns established over thousands of years, so you may see surprising regional percentages.”

Each of the vendors has compiled their own list of reference populations from published material, and in the case of National Geographic, as yet unpublished material as well.

If you read the fine print, some of these results that at first glance appear to not match actually do, or could.  For example, Southwest Asia (Geno 2.0) could be Russia (Family Tree DNA) or at least pointing to the same genetic base.

This video map of Europe through the ages from 1000AD to present will show the ever changing country boundaries and will quickly explain why coming up with labels for ethnicity is so difficult.  I mean, what exactly does “France” or “Germany” mean, and when?

4. The fourth answer is focus.  Each of these organizations comes to us as a consumer with a particular focus.  Of them, one and only one must make their way on their own merits alone.  That one is Family Tree DNA.  Unlike the Genographic Project, Family Tree DNA doesn’t have a large nonprofit behind them.  Unlike 23andMe, they are not subsidized by the medical community and venture capital.  And unlike Ancestry.com, Family Tree DNA is not interested in selling you a subscription.  In fact, the DNA market could dry up and go away for any of those three, meaning 23andMe, National Geographic and Ancestry, and their business would simply continue with their other products.  To them, DNA testing is only a blip on a spreadsheet.  Not true for Family Tree DNA.  Their business IS genetic genealogy and DNA testing.  So of all these vendors, they can least afford to have upset clients and are therefore the most likely to be the most vigilant about the accuracy of their testing, the quality of the tools and results provided to customers.

My Opinion

So what is my personal opinion on all of this?

I think these ethnicity results are very interesting.  I think in some way all of them are probably correct, excluding Ancestry.  I have absolutely no confidence in Ancestry’s results based on their track record and historylack of tools, lack of transparency and frustratingly poor quality.

I think that as more academic papers are published and we learn more about these reference populations and where their genes are found in various populations, all of these organizations will have an opportunity to “tighten up” their results.  If you’ll notice, both Ancestry and Family Tree DNA still include the words “beta.”  The vendors know that these results are not the end all and be all in the ethnicity world.

Am I upset with these vendors?  Aside from Ancestry who has to know they have a significant problem and has yet to admit to or fix it, no, I’m not.  Frustrated, as a consumer, yes, because like all genealogists, I want it NOW please and thank you!!!

Without these kinds of baby steps, we will never as a community crawl, walk, or run.  I dream of the day when we will be able to be tested, obtain our results, and along with that, maybe a list of ancestors we descend from and where their ancestors originated as well.  So, in essence, current genealogy (today Y-line and mtdna), older genealogy (autosomal lines) and population genetics (ethnicity of each line).

So what should we as consumers do today?  Personally, I think we should file this information away in the “that’s interesting” folder and use it when and where it benefits us.  I think we should look at it as a display of possibilities.  We should not over-interpret these results.

There is perhaps one area of exception, and that is when dealing with majority ethnic groups.  By this, I mean African, Asian, Native American and European.  For those groups, this type of ethnicity breakdown, the presence or absence of a particular group is more correct than incorrect, generally.  Very small amounts of any admixture are difficult to discern for any vendor.  For an example of that, look at my Native percentages and some of those are proven lines.  For the individual who wants more information, and more detail into the possibilities, I wrote about how to use the raw autosomal data outside of the vendors tools, at GedMatch, to sort out minority admixture in The Autosomal Me series.

Perhaps the Genographic Project page sums it up best with their statement that, “If you have a very mixed background, the pattern can get complicated quickly!”  Not only is that true, it can be complicated by any and probably all of the factors above.  When you think about it, it’s rather amazing that we can tell as much as we can.

______________________________________________________________

Disclosure

I receive a small contribution when you click on some of the links to vendors in my articles. This does NOT increase the price you pay but helps me to keep the lights on and this informational blog free for everyone. Please click on the links in the articles or to the vendors below if you are purchasing products or DNA testing.

Thank you so much.

DNA Purchases and Free Transfers

Genealogy Services

Genealogy Research

The Autosomal Me – Testing Company Results

This is Part 4 of a multi-part series, The Autosomal Me.

Part 1 was “The Autosomal Me – Unraveling Minority Admixture” and Part 2 was “The Autosomal Me – The Ancestors Speak.”  Part 1 discussed the technique we are going to use to unravel minority ancestry, and why it works.  Part 2 gave an example of the power of fragmented chromosomal mapping and the raw beauty of the results.  Part 3, “The Autosomal Me – Who Am I?,” discussed how to use our pedigree charts to gauge expected results and how autosomal results are grouped into population buckets.  We also named this technique, Minority Admixture Mapping, or MAP for short.

In this segment, Part 4, let’s take a look at what the testing company autosomal results look like.  The results are presented in timeline order, with the oldest results first and the latest, and presumably most accurate results, last.

23andMe Version 1

23andMe was the first company to offer this type of testing affordably.  They initially only offered 3 population groups, and one inferred that Asian was actually Native American.  Of course, that wasn’t a valid assumption for everyone, but it was the best that could be done under the circumstances.  This was my ethnicity results display at 23andMe until December 2012 went their updated version was released.

Autosomal test 1

DeCode Genetics

DeCode Genetics initially offered autosomal tests for ancestry.  Unfortunately, under the pressure of financial issues, they stepped away from the genetic genealogy marketspace and have since been sold.

Their test showed the following ethnic breakdown, picking up both my Native and African heritage:

autosomal test 2

I particularly like these results because the X chromosome is included, and seeing Native on the X chromosome, which has a unique inheritance path is a very important piece of data.

Family Tree DNA Version 1

Family Tree DNA’s first version of their Family Finder product produced results stating that I am 100% European, split between western and northern, shown below (minus the map.)

autosomal test 3

Dr. Doug McDonald

Doug McDonald, a retired physical chemistry professor, compiles contributed raw data and compares the raw data locations with both reference populations and the contributor results.  This is not a commercial endeavor but a private research project which has been ongoing for years.  His analysis of my raw data results from 23andMe and Family Tree DNA showed that they are primarily European.  His first analysis was without Middle Eastern populations and the results showed European except for a total of about 3% East Asian, Oceana and American.   However, in a second run including the Pakistan and Middle Eastern populations, the results now showed 88% European, about 1% Oceanic and American and the balance Middle Eastern and Pakistani.

A small amount of Middle Eastern heritage is not unexpected since I do have confirmed Turkish ancestors.

Dr. McDonald indicated that this was slightly more, 1-2%, than most Europeans, and that I was generally planted firmly in the middle of the “English” area in his data.  His results showed no African.

Standard deviation (statistical noise) is about 1%.  He can achieve these low deviation numbers by using such a large number of markers (536,904 to be exact)[1] for his comparison.  I am grateful to Dr. McDonald for his contribution, not only to me, but to this field.

The graph below shows that my primary ancestry falls in the English/French region.

autosomal test 4

The second graph maps these results on my chromosomes. The American, bright green, is found on chromosomes 1 and 2, and the X chromosome shows South Asian.

autosomal test 5

Doug indicates that the Native American is found at about the .5% level.  Interestingly, on my mother’s graphs and charts (below), the Native segments are nearly identical, but my first grey South Asian segment on my X is Mideast on her chart.

autosomal test 6

It’s also interesting to note that my Native American on chromosome 2 is larger than my mother’s which may well reflect Native heritage on my father’s side.  Ironically, the oral history of Native ancestry was on my father’s side, not my mothers.

Doug’s analysis has been updated several times over the years and these results are the most current.  The vendors have made upgrades too.  In 2012, both 23andMe and Family Tree DNA underwent upgrades to their ethnicity software and the Genographic Project version 2.0 test was released.

23andMe 2012 Updated Version

The new 23andMe software offers different confidence levels.

The standard estimate, or confidence level, shows that I have about .5% Native American.  This is consistent with Dr. McDonald’s findings.

autosomal test 7

A second view is available which paints the chromosomes.  A split view is also available if one of your parents has been tested at 23andMe as well.  That is not an option for me.

autosomal test 8

The conservative estimate, below, shows less Native at .2%.

autosomal test 9

The speculative level below shows the Native back to .5% but adjusts the European regions significantly.

autosomal test 10

Although 23andMe does not provide participants with the start and stop locations, through alternative means, meaning a very smart friend, Rebekah Canada, who is a Java programmer, start and stop locations can be discerned.

CeCe Moore documented Rebekah’s technique for those who will be following along with their own results through this process.

In a future segment of this series, we’ll look at alternative ways to discern Native segments.  Thanks to Rebekah’s technique, I can tell you that 23andMe shows my Native segments as follows:

Chromosome 1 – 165,658,091 to 175,711,116

Chromosome 2 – 86,316,174 to103,145,426

23andMe also provides a Neanderthal percentage.  What fun!!!

autosomal test 11

Family Tree DNA Updated 2012 Version

My mother was deceased before chip based autosomal testing was available, but I ordered the Family Finder test for her as soon as it was available.  Thankfully her DNA was stored at Family Tree DNA and was still viable.

autosomal test 12

Mother’s original results are shown above and her most recent results are shown below.  Her results shifted within Europe and her margin of error doubled.

autosomal test 13

My current results from Family Tree DNA’s updated software are shown below.

 autosomal test 14

National Geographic Genographic 2.0

I was very surprised to see my National Geographic results.  They were very unexpected, in particular the high percentages of Mediterranean and Southwest Asian, totaling 54%.

autosomal test 15

It made more sense when I read the information.  It’s true, reading is fundamental.

autosomal test 16

These results are, in essence, more anthropological in nature.

autosomal test 17

autosomal test 18

Of course, one of the fun parts of the Genographic results are the Neanderthal and Denisovan percentages.

autosomal test 19

These are somewhat different than the 23andMe results, although if you add the Neanderthal and Denisovan values together, the resultant 2.2% is very close to 23andMe’s 2.5%.

Ancestry.com

In 2012, Ancestry introduced an autosomal DNA test as well.  What it provides is very limited, with limited tools, but it does provide percentages of ethnicity in addition to matches.  Recently, Ancestry announced that the percentages may change over time.  They have been severely beaten within the genetic genealogy community for quality issues with this product, including percentages of ethnicity that are highly erroneous.  Their stated time reference is 500 years ago.

Recently this new page was added before you can see your detailed results.

autosomal test 20

Ancestry shows my heritage as only British and Scandinavian.

autosomal test 21

Ironically, Ancestry has mapped the birth locations of my ancestors in Europe on the map above, based on my family tree submitted.  Interesting that Germany doesn’t show in Ancestry’s ethnicity list but many of my family lines originated in Germany and Holland, and none in Scandinavia.

Testing Provider Summary

Where do we stand now?

A summary of the various test results is shown below compared to my pedigree analysis.

Test Results Chart

autosomal test 22

I have included Dr. McDonald’s analysis here, not because he’s a testing provider in the sense of the testing companies, but because his offering was available in this timeframe, and because he worked with Family Tree DNA to develop their Population Finder code.

You can see that the results are relatively consistent between testing companies.  There is certainly no question about majority ancestry, but the minority admixture which hovers someplace near 1%, give or take 5% in either direction, is much less consistent and not always reported.  If I were to have tested with only one company and taken the results as gospel, I could certainly have been left believing that I had no Native or African admixture.  For many people, it’s this small amount of minority admixture that they are seeking.  So in answer to the question of which testing company is “best,” the answer is, if you’re looking for trace amounts of anything, the compendium of all the testing companies (minus Ancestry) would provide the best set of results.  We will be using the match information as well in the next sections, so certainly nothing has been “wasted” testing with multiple companies, again, except Ancestry.  I am hopeful that Ancestry will in the future release our raw data (which they have promised to do) in a useable format, fix their misleading ethnicity results and add chromosome painting tools so that we can fully utilize our data.

In Part 5 of the series, we’ll take a look at third party tools and how they can continue to refine and add to our knowledge of our admixture.


1.  Genealogy-DNA Rootsweb posting by Doug McDonald on 7-26-09 and personal correspondence.

2.  71.5% western European, 28.4% Northeastern European

3.  Inferred that Asian is actually Native in an American with no history of Asian ancestry.

4.  No category, inferred.

5.  78.6% Northern European, 1.8% Southern European, 18.7% Nonspecific European

6.  54.6% Northern European, .3% Southern European, 43% Nonspecific European

7.  91.7% Northern European, 3% Southern European, 3.3% Nonspecific European

8.  75.18% West Europe (French and Orcadian), 24.82 Europe (Romanian, Russian, Tuscan and Finnish).  Note that my mother’s results are almost identical except the Finnish is missing from hers.

9.  43% North Europe and 36% Mediterranean

10.  80% British, 12% Scandinavian

______________________________________________________________

Disclosure

I receive a small contribution when you click on some of the links to vendors in my articles. This does NOT increase the price you pay but helps me to keep the lights on and this informational blog free for everyone. Please click on the links in the articles or to the vendors below if you are purchasing products or DNA testing.

Thank you so much.

DNA Purchases and Free Transfers

Genealogy Services

Genealogy Research

Decoding and Rethinking Neanderthals

decod neanderthal 1

On January 9, 2013, PBS ran a wonderful documentary, Decoding Neanderthals, about Neanderthals, what we have recently discovered about them, and what it means to us as humans. There has been a lot of discussion about this topic spurred by both the 23andMe and the Geno2.0 tests that provide a percentage of Neanderthal to participants. Geno2.0 also provides a percentage of Denisovan.

Program Description:
Over 60,000 years ago, the first modern humans—people physically identical to us today—left their African homeland and entered Europe, then a bleak and inhospitable continent in the grip of the Ice Age. But when they arrived, they were not alone: the stocky, powerfully built Neanderthals had already been living there for hundreds of thousands of years. So what happened when the first modern humans encountered the Neanderthals? Did we make love or war? That question has tantalized generations of scholars and seized the popular imagination. Then, in 2010, a team led by geneticist Svante Paabo announced stunning news. Not only had they reconstructed much of the Neanderthal genome—an extraordinary technical feat that would have seemed impossible only a decade ago—but their analysis showed that “we” modern humans had interbred with Neanderthals, leaving a small but consistent signature of Neanderthal genes behind in everyone outside Africa today. In “Decoding Neanderthals,” NOVA explores the implications of this exciting discovery. In the traditional view, Neanderthals differed from “us” in behavior and capabilities as well as anatomy. But were they really mentally inferior, as inexpressive and clumsy as the cartoon caveman they inspired? NOVA explores a range of intriguing new evidence for Neanderthal self-expression and language, all pointing to the fact that we may have seriously underestimated our mysterious, long-vanished human cousins.

I’m going to share some of the highlights of the program, but this is in no way a spoiler, as the program contains lots of visual information that just can’t be conveyed by a review.

Chris Stringer from the Natural History Museum in London introduced us to the Neanderthals. It turns out that our perception of what a Neanderthal looks like is a result in large part of skeleton that was reconstructed improperly due to advanced arthritis, causing the individual to appear to walk hunched over, much like, well, our stereotypical view of a caveman. Just goes to show what bad PR can cause.

neanderthal skull

Neanderthal skeletons can be positively identified. Their facial structure is different than that of modern man, with an identifiable brow ridge and bones that push forward in the nose and mouth region, as compared to our flatter faces today.

Neanderthals lived a short life, most were dead by age 30. They were large and strong. They participated in up-close and personal hunting, using spears, which meant they had to come in close contact with their prey.

Neanderthals began living in Europe about 300,000 years ago, having exited from Africa. They evolved to fit the European, colder, climate. It had been thought up until recently that they lacked the brainpower of humans, had no spoken language, or the ability for such, no personal ornamentation, art or evidence of ritual or religion. These are the functions that make us uniquely human and separate us from the non-human world, and we fully believed that Neanderthals lacked these defining characteristics.

We have learned differently, much as a result of genetic discoveries that tell a different story of Neanderthals.

Homo sapiens left African about 40,000 years ago, and within 10,000 years, Neanderthals, who had spread throughout most of Europe and much of Asia were gone. The map below shows the locations where fossilized Neanderthal remains have been found.

decod neanderthal 3

The assumption has been made that Homo Sapiens were responsible for the Neanderthals demise, either by killing them off or providing too much competition for scarce resources, outnumbering them 10 to 1.

decod neanderthal 4

Svante Paabo, a Swedish geneticist now at the Max Planck Institute for Evolutionary Anthropology forever changed the genetic world, how we perceive Neanderthals, and paradoxically, how we think of ourselves.

Pääbo is known as one of the founders of paleogenetics, a discipline that uses the methods of genetics to study early humans and other ancient populations.

In August 2002, Paabo published findings about the “language gene”, FOXP2, which is lacking or damaged in some individuals with language disabilities. This research would prove critical, later, in the humanization of the Neanderthal.

In 2006, he announced a plan to reconstruct the entire genome of Neanderthals. In 2007, Pääbo was named one of TIME Magazine’s 100 most influential people of the year.

In February 2009, at the Annual Meeting of the American Association for the Advancement of Science (AAAS), it was announced that the Max Planck Institute for Evolutionary Anthropology had completed the first draft version of the Neanderthal genome. Over 3 billion base pairs were sequenced in collaboration with the 454 Life Sciences Corporation. This project, led by Pääbo, shed and will continue to shed new light on the recent evolutionary history of modern humans.

In March 2010, Pääbo and his coworkers published a report about the DNA analysis of a finger bone found in the Denisova Cave in Siberia; the results suggest that the bone belonged to an extinct member of the genus Homo that had not yet been recognized, the Denisova hominin.

In May 2010, Pääbo and his colleagues published a draft sequence of the Neanderthal genome in the journal Science. Below, a scientist at Max Plank extracting Neanderthal DNA.

decod neanderthal 5

Paabo shared in the program that many times during the Neanderthal sequencing project, he himself “despaired many times of being able to do it”, doubting that it could be done. It took a total of 4 years. The team found good candidates, 3 well-preserved female bone fragments from the Vindija Cave in Croatia.

decod neanderthal 6

Because of the age of the fragments, and because they had been in the ground for so long, much of the DNA recovered wasn’t Neanderthal, but that of bacterial organisms and fungus. The team developed a method to eliminate the bacteria, leaving only Neanderthal DNA. However, those genetic fragments still had to be reassembled, piece by piece, like a huge jigsaw puzzle with no picture on the box, into the Neanderthal genome.

Four long years later, the puzzle was finished. I hope the team had a very big celebratory party!

Ed Green, a scientist on Paabo’s team said that the first thing the scientists looked for was to determine whether or not Neanderthals had the FOXP2 gene for language, and if so, is it identical to the human version, or is it different. The answer was that it was identical to the language gene carried by Homo Sapiens, modern humans. This tells us not only that Neanderthals had the capabilities for language, but that this gene evolved in Africa, before Neanderthals left, 300,000 years ago.

The next question, of course, was whether or not modern humans carried any DNA that could be labeled as Neanderthal. In other words, the question of inter-species breeding arose. It was believed that this was impossible, because two different species cannot have fertile offspring. This was proven to be an inaccurate assumption relative to Neanderthal and Homo Sapiens.

Paabo’s team sequenced the DNA of 5 individuals from different parts of the world. They isolated parts of the Neanderthal DNA that were measurably different from that of modern humans. In other words, those sequences could be positively identified as Neanderthal. Compared against the DNA of the 5 contemporary individuals, only the person from Africa had none of the Neanderthal DNA.

Paabo didn’t believe the results, thought they might be an artifact of statistical error or the result of not enough data, so he had his team repeat the exercise with different people, again, and again, and again, and every time, the results came back the same. Neanderthals and humans inbred, and to the degree that there is Neanderthal DNA in every population on every continent outside of Africa today.

John Hawks, an anthropologist at the University of Wisconsin used jelly beans to illustrate Neanderthal DNA in worldwide populations today. It turns out that the Chinese have the least amount, with about 1% and the people of Tuscany have the most, with about 4%. So the mountainous areas of Europe and Italy were a hotbed of Neanderthal activity and human interbreeding.

This caused other experts to think again about the Neanderthals in what could be called a radical shift in perspective. All of a sudden, when we realized that they were part of us, they became more human to us. They could and probably did have speech, so they could and probably did other “human” things too.

Joao Zilhao, a paleolithic archaeologist at the University of Bristol, also a flintknapper, spent years reconstructing the process of making Neanderthal tools, what were once believed to be scraps of flint with sharp edges. He proved, among other things, that obtaining these “scraps” involved a complex process of very specific flintknapping strokes. This skill was far from the previously perceived unintelligent caveman, and furthermore, it likely required language instruction.

neanderthal tools

Another early technology, in use 250,000 years ago, involved a complex process to create a type of pitch to secure spearheads to spear shafts.

The Neanderthals began evolving before our very eyes.

Michael Walker, a professor of Zoology and Physical Anthropology at the University of Murcia, discovered indeed that Neanderthals likely did have ceremony and ritual, the hallmarks of religion, which involved the ability for complex thought and reasoning. Shells and bones, drilled or punched to be worn as ornaments have been identified, along with pigments believed to have been used as body paints.

We still do this today; look at the fans at any football game.

In addition, it appears that a burial may have been found in Spain, along with two panther paws. Michael mentioned them as a trophy, I thought more in terms of spiritual significance.

John Hawks discussed what the Neanderthal parts of our genome have done for humans. Many of the Neanderthal genes have no known purpose, but there is one significant exception. It’s somehow ironic that we may indeed have survived as a species in a foreign environment, colder Europe, thanks to inbreeding with the Neanderthals. Humans carry a very specific Neanderthal piece of DNA that is essential to the immune system’s ability to attack viruses and bacteria, the HLA or Human Leukocyte Antigen. Because individuals who carried HLA might well have survived when others didn’t, the HLA became naturally selected for, and therefore present in the descendant population, us, “saving lives to this day.’

As John said, we are just beginning to understand our debt to the Neanderthals. Not only that, we also are rethinking what extinction really meant. We have presumed that Neanderthals went extinct, or died out, because we could no longer find their remains in fossil evidence. Perhaps, as Mark Twain said “reports of my demise have been greatly exaggerated.”

Is the reason we could no longer find separate Neanderthals because they interbred and assimilated into the Homo Sapiens population who were probably the dominant species, outnumbering them ten to one? Was their extinction not a dying out at all, but an absorption? Perhaps that was simply the natural progression of things, or maybe they realized that their recipe for success, for long-term survival, was not to remain separate, but to become part of the larger population. In fact they do survive today in just that way, as a part of all of us outside of Africa.

Decoding Neanderthals is available to watch online at http://www.pbs.org/wgbh/nova/evolution/decoding-neanderthals.html

______________________________________________________________

Disclosure

I receive a small contribution when you click on some of the links to vendors in my articles. This does NOT increase the price you pay but helps me to keep the lights on and this informational blog free for everyone. Please click on the links in the articles or to the vendors below if you are purchasing products or DNA testing.

Thank you so much.

DNA Purchases and Free Transfers

Genealogy Services

Genealogy Research

2012 Top 10 Genetic Genealogy Happenings

2012 has been a very busy year for genetic genealogists.  There have been lots of discoveries and announcements that affect everyone, now and in the future.  The watchwords for 2012 would be “churn” and “explosive growth.”  Let’s take a look at the 10 most important events, why they are important and what they mean for the future of genetic genealogy.

These items are in what I think are relatively good order, ranked by their importance, although I had a very difficult time deciding between number 1 and 2.

1. The New Root – Haplogroup A00

At the Family Tree DNA conference in November, Michael Hammer, Bonnie Schrack and Thomas Krahn announced that they had made a monumental discovery in the age of modern man known as Y-line Adam.  The discovery of Haplogroup A00 pushes the “birth” of mankind back from about 140,000 years ago to an amazing 338,000 years ago.  Utterly amazing.  The DNA came from an American family from South Carolina.  This discovery highlights the importance of citizen science.  Bonnie is a haplogroup administrator who recognized the potential importance of one of her participants’ DNA.  Thomas Krahn of course is with Family Tree DNA and ran the WTY test, and Michael Hammer is at the University of Arizona.  So you have the perfect blend here of participant, citizen scientist, commercial lab and academia.  What was never thought possible a decade or so ago is not only working, it’s working well and changing the face of both science and humanity.

http://dna-explained.com/2012/11/16/the-new-root-haplogroup-a00/

http://www.haplogroup-a.com./

2. Geno 2.0

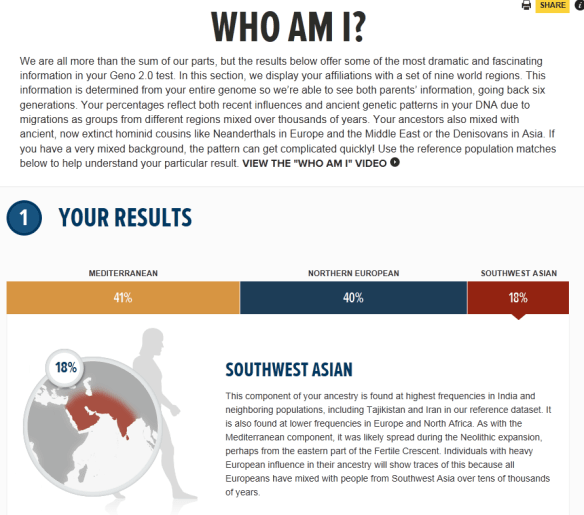
Geno 2.0 is the Nickname for the National Geographic Society’s Genographic Project version 2.0.  That mouthful is why it has a nickname.

This amazing project has leveraged the results of the past 7 years of research from the original Genographic project into a new groundbreaking product.  Geno 2.0, utilizing the GenoChip, a sequencing chip created specifically for Nat Geo, offers the most complete Y tree in the world today, expanding the SNP tree from just over 800 SNPs to over 12,000.  They are in essence redrawing the Y chromosome tree as I write this.  In addition, the person who purchases Geno 2.0 will receive a mitochondrial DNA haplogroup assignment.  Over 3300 new mitochondrial mutations were discovered. A brand new anthropological “percentages of ethnicity” report is featured based on over 75,000 Ancestry Informative Markers, many only recently discovered by the Genographic project.  Additionally, participants will receive their percentage of both Neanderthal and Denisovan ancestry based on 30,000 SNPs identified that signal interbreeding between the hominids.  A new website will also facilitate social networking and uploading information to Family Tree DNA.

The wonderful news is that there is a massive amount of new information here that will change the landscape of genetic genealogy.  The difficulty is that we are struggling a bit under the load of that massive amount of information that is just beginning to descend upon us.  It’s a great problem to have!

http://dna-explained.com/2012/07/25/national-geographic-geno-2-0-announcement-the-human-story/

http://dna-explained.com/2012/07/26/geno-2-0-qa-with-bennett-greenspan/

http://dna-explained.com/2012/07/30/geno-2-0-answers-from-spencer-wells/

http://dna-explained.com/2012/07/31/geno-2-0-wty-mtdna-full-sequence-participants-and-more/

http://dna-explained.com/2012/10/14/what-to-order-geno-2-0-vs-family-tree-dna-products/

http://dna-explained.com/2012/10/16/geno-2-0-the-kit-arrives/

http://dna-explained.com/2012/12/11/geno-2-0-results-first-peek/

http://dna-explained.com/2012/12/12/geno-2-0-results-kicking-the-tires/

3. Reconstructed Sapiens Reference Sequence (RSRS)

In July, Family Tree DNA implemented the RSRS that in effect reconstructs the genetic profile of Mitochondrial Eve and bases the comparison of our DNA today against the RSRS sequence as opposed to the Cambridge Reference Sequence (rCRS) created in 1981 that is or was the current standard.  The RSRS is a result of the watershed paper published in April 2012 by Dr. Doron Behar and 8 other authors titled “A “Copernican” Reassessment of the Human Mitochondrial DNA Tree from its Root.”  A complementary research website, www.mtdnacommunity.org, accompanies the paper.

http://dna-explained.com/2012/07/14/what-happened-to-my-mitochondrial-dna/

http://dna-explained.com/2012/07/15/the-crs-and-the-rsrs/

http://dna-explained.com/2012/07/16/the-mtdna-community/

http://dna-explained.com/2012/12/02/little-a-big-a-mitochondrial-dna/

4. Full Genome and Exome Sequence Offered Commercially by Gene by Gene

It was announced at the November DNA conference that Gene by Gene, the parent company of Family Tree DNA, through their division titled DNA DTC is offering full genomic sequencing for the amazing price of $5495 for the full genome and $695 for the exome.  This is a first in the consumer marketspace.  Today, this doesn’t have a lot of application for genetic genealogy, but as the price continues to drop, and utilities are built to process the full genomic data, certainly a market and applications will emerge.  This is an important step forward in the industry with a product that still cost 3 million dollars in 2007.

http://dna-explained.com/2012/11/30/gene-by-gene-announces-landmark-dna-dtc-full-genome-sequence/

5. Neanderthal and Denisovan DNA

It’s official – they did it.  Yep, they interbred and well, they are not them anymore, they are us.  Given that everyone in Asia and Europe carries a part of them, but not people from Africa, it would appear that two populations admixed rather thoroughly in Eurasia and/or the populations were small.  The amount of Neanderthal and Denisovan DNA will continue at approximately the proportions seen today in Europe (2% Neanderthal) and Asia unless a significant amount of admixture from a population (Africa) that does not carry this admixture is introduced.  So if you’re European, you carry both Neanderthal and Denisovan DNA.  They are your ancestors.  The good news is that you can find how much of each through  the Geno 2.0 test.  23andMe results give you the percentage of Neanderthal, but not Denisovan.

http://dna-explained.com/2012/08/31/denisovan-dna-tells-a-story/

http://dna-explained.com/2012/12/12/geno-2-0-results-kicking-the-tires/

6. Ancestral Genome Reconstruction Begins,  Led by Falling Autosomal Prices and the Ability to Fish in Multiple Ponds

2012 has been the year of autosomal testing price reductions and a great deal of churn in this marketspace.  Companies are playing leap-frog with one another.  However, sometimes things are not all that they seem.

Initially, 23andMe opted for an initial payment plus monthly subscription model, which they abandoned for a one time payment price of $299 in early 2012.  Family Tree DNA was slightly less, at $289.

Ancestry led the price war by giving away kits, then selling them for $99, then $129 plus a subscription as an entrance into this market.  However, looking at the Ancestry consent form hints at possible reasons why they were selling below the cost of the tests.  You are in essence giving them permission to sell your DNA and associated information.  In addition, to gain full access to your results and matches, you must maintain some level of subscription to Ancestry.com, increasing the total effective price.

Next came Family Tree DNA’s sale where they dropped their autosomal price to $199, but they were shortly upstaged by 23andMe whose price has now dropped to $99 permanently, apparently, a result of a 50 million dollar investment in order to reach 1 million customers.  They currently have about 180,000.  23andMe has always been in the medical/health business, so their clients have always understood what they were consenting to and for.

Not to be outdone, Family Tree DNA introduced the ability earlier in 2012 to upload your data files from 23andMe to FamilyTree DNA for $89, far less than a second test, which allows you to fish in a second pond where genealogists live for matches.  The challenge at 23andMe is that most of their clients test for the health traits and either don’t answer inquiries or match requests, or know little about their genealogy if they do.  At Family Tree DNA, matches don’t have to answer and allow a match, testers are automatically matched with all participants who take the Family Finder test (or upload their 23andMe results) and testers are provided with their matches’ e-mail address.

Of course, Geno 2.0 was also introduced in the midst of this, in July, for $199 with the additional lollipop of new SNPS, lots of them, that others simply don’t have access to yet.

The good news is that consumers have benefitted from this leapfrogging, I think.  Let’s hope that the subsidized tests at Ancestry and 23andMe don’t serve long term to water down the demand to the point where unsubsidized companies (who don’t selling participants genetic results to others) have problems remaining viable.

Personally, I’ve tested at all of these companies.  I’ll be evaluating the results shortly in detail on my blog at www.dna-explained.com.

The tools provided by most testing companies, plus GedMatch, and multiple ponds to fish in are allowing the serious genetic genealogist to “reconstruct” their genome, attributing segments to specific ancestors.  Conversely, we will also be able to “reconstruct” specific ancestral family lines as well by identifying autosomal segments in multiple descendants.  This new vision of autosomal genetic genealogy will allow much more accurate ancestral line matching, and ancestor identification in the not-so-distant future.

http://www.yourgeneticgenealogist.com/2012/01/family-tree-dna-now-accepting-23andme.html

http://www.yourgeneticgenealogist.com/2012/05/23andme-eliminates-subscription-model.html

http://www.yourgeneticgenealogist.com/2012/10/clarification-of-what-is-available-to.html

http://www.yourgeneticgenealogist.com/2012/12/23andme-receives-50-million-and-drops.html

http://www.thegeneticgenealogist.com/2012/12/26/23andme-and-labcorp-sued-for-patent-infringement/

7. Ethnicity Tests Mature – Minus 1

The good news is that the various ethnicity tests (known as BGA or biogeographical ancestry tests) that provide participants with their percentages of various world populations are improving.  The bad news is that there is currently one bad apple in the card with very misleading percentages – and that is Ancestry.com.

23andMe introduced a new version of their ethnicity product in December, expanding from only 3 geographic categories to several.  The Geno 2.0 test results are just beginning to be returned which include ethnicity predictions and references to several base populations.

Family Tree DNA finally has some competition in this arena where for years they have been the only serious player, although opinions differ widely about which of these three organizations results are the most accurate.  All four are Illumina chip based, using hundreds of thousands of locations, as compared with the previous CODIS type tests which used between 15 and 300 markers and are now outdated.  All companies use different reference populations which, of course, provide somewhat different results to participants.  All companies, except Ancestry, have documented and shared their reference population information.

Outside of these companies, Doug McDonald offers a private analysis and Gedmatch offers a series of BGA comparisons written by third parties.

While this industry continues to grow and mature, I’m thinking about just averaging the autosomal ethnic results and calling it good:)

http://dna-explained.com/2012/07/21/ethnicity-finders/

http://dna-explained.com/2012/10/24/ancestrys-mythical-admixture-percentages/

http://dna-explained.com/2012/12/07/new-worldview-at-23andme/

http://dna-explained.com/2012/09/09/doug-mcdonald-on-biogeograpical-analysis/

http://dna-explained.com/2012/12/11/geno-2-0-results-first-peek/

http://www.yourgeneticgenealogist.com/2012_12_01_archive.html

8. Finding Your Roots PBS Series with Henry Louis Gates

PBS sponsored a wonderful series in the spring of 2012 hosted by Henry Louis “Skip” Gates, the chair of African American Studies at Harvard.  This series followed a lesser known 2010 series.  The 2012 inspirational series reached tens of thousands of people and increased awareness of genetic genealogy as well as sparked an interest in genealogy itself, especially for mixed race and African American people.  I was disappointed that the series did not pursue the Native American results unexpectedly obtained for one participant.  It seemed like a missed opportunity.  Series like this bring DNA testing for genealogy into the mainstream, making it less “strange” and frightening and more desirable for the average person.  These stories were both inspirational and heartwarming.  I hope we can look forward to similar programs in the future.

http://en.wikipedia.org/wiki/Finding_Your_Roots

CeCe Moore covered this series in March and April on her blog.

http://www.yourgeneticgenealogist.com/2012/03/finding-your-roots-with-henry-louis.html

http://www.yourgeneticgenealogist.com/2012/04/finding-your-roots-with-henry-louis.html

http://www.yourgeneticgenealogist.com/2012/04/finding-your-roots-with-henry-louis_09.html

http://www.yourgeneticgenealogist.com/2012/04/finding-your-roots-with-henry-louis_16.html

http://www.yourgeneticgenealogist.com/2012/04/finding-your-roots-with-henry-louis_23.html

http://www.yourgeneticgenealogist.com/2012/04/finding-your-roots-with-henry-louis_30.html

9. Ancestry, GeneTree and Sorenson

GeneTree, a for profit company and Sorenson, a non-profit company were both purchased by Ancestry.com.  This was about the same time as Ancestry introduced their autosomal AncestryDNA product.  Speculation was that the autosomal results at Sorenson might be the foundation for the new autosomal test comparisons, although there has been no subsequent evidence of this.

Ancestry initially gave away several thousand kits in order to build their data base, then sold thousands more for $99 before raising the price to what appears to be a normalized price of $129 plus an annual ancestry subscription.

While GeneTree was never a major player in the DNA testing marketspace, Sorenson Molecular Genealogical Foundation played an important role for many years as a nonprofit research institute.  There was significant distress in the genetic genealogy community related to the DNA contributed to Sorenson for research being absorbed by Ancestry as a “for profit” company.  Ancestry is maintaining the www.smgf.org website, but no additional results will be added.  Sorenson has been entirely shuttered.  Many of the Sorenson/GeneTree employees appear to have moved over to Ancestry.

The initial AncestryDNA autosomal product offering is poor, lacks tools and the ethnicity portion has significant issues. It’s strength is that many people who test are already Ancestry subscribers and have attached their trees.  So you can’t see how you connect genetically to your matches (lack of tools), but you can see the trees, if they are attached and not marked as private, of those with whom you match.  Ancestry provides “hints” relative to matching individuals or surnames.

Eventually, if Ancestry improves its products, provides tools and releases the raw data to consumers, this may be a good thing.  It’s an important event in 2012 because of the massive size of Ancestry, but the product is mediocre at best.  Ancestry seems unwilling to acknowledge issues unless their feet are held to the fire publicly as illustrated with a “lab error” erroneous match for an adoptee caught by the consuming public and ignored by Ancestry until CeCe Moore exposed them in her blog.  Whether Ancestry ultimately helps or hurts the genetic genealogy industry is a story yet to be told.  There is very little positive press in the genetic genealogy community surrounding the Ancestry product, but with their captive audience, they are clearly going to be a player.

http://www.yourgeneticgenealogist.com/2012/05/ancestrycom-buys-genetree-and-launches.html

http://dna-explained.com/2012/07/12/did-you-test-at-genetree/

http://dna-explained.com/2012/08/30/is-history-repeating-itself-at-ancestry/

http://dna-explained.com/2012/07/18/the-trouble-with-ancestry-com-matches/

http://dna-explained.com/2012/08/14/y-dna-family-tree-dna-vs-ancestry/

http://dna-explained.com/2012/08/16/ancestrys-consent-form-for-ancestrydna-autosomal-test/

http://dna-explained.com/2012/09/10/ancestry-autosomal-results-are-back/

http://dna-explained.com/2012/10/15/ancestrys-dna-survey/

http://dna-explained.com/2012/10/23/ancestry-to-release-array-data-in-2013/

http://dna-explained.com/2012/10/24/ancestrys-mythical-admixture-percentages/

http://www.thegeneticgenealogist.com/2012/06/19/problems-with-ancestrydnas-genetic-ethnicity-prediction/

http://www.yourgeneticgenealogist.com/2012/08/ancestrydna-confusing-relationship.html

http://www.yourgeneticgenealogist.com/2012/08/follow-up-on-ancestrydna-and-adoptees.html

http://www.yourgeneticgenealogist.com/2012/09/23andme-says-no-match-for-adoptees.html

10. GedMatch

GedMatch, www.gedmatch.com, created by John Olson and Curtis Rogers, isn’t new in 2012, but it’s maturing into a tool that is becoming the defacto workhorse of the serious autosomal community.  People who test at either 23andMe or Family Tree DNA download their raw results and other match information and then use a variety of tools at GedMatch to look at results in different ways and using different thresholds. GedMatch is currently working to accept the newly arriving Geno 2.0 data files.  Ancestry does not at this time allow their customers access to their raw data files, so there is nothing to upload. The bad news is that not everyone downloads/uploads their information.  Only the most savvy users, and the download/upload is not always a smooth process, often necessitating several attempts, a magic wand and some fairy dust for luck.

GedMatch is a volunteer effort funded by donations on the GedMatch site.  The magnitude of this project came to light when they needed new servers this year because the amount of traffic disabled their internet service provider.  It may be a volunteer effort, but it has mainstream requirements.  Therefore, while occasionally frustrating, it’s easy to understand why it’s light on documentation and one has to poke around a bit to figure things out.  I would actually prefer that they make it a subscription site, clean up the bugs, add the documentation and take it to the next level.  It would also be very nice if they could arrange something with the major players in terms of a seamless data transfer for clients.  All told, it’s an amazing contribution as a volunteer site.  Hats off to Curtis and John for their ongoing contribution to genetic genealogists!!!

www.gedmatch.com

http://www.legalgenealogist.com/blog/2012/08/12/gedmatch-a-dna-geeks-dream-site/

______________________________________________________________

Disclosure

I receive a small contribution when you click on some of the links to vendors in my articles. This does NOT increase the price you pay but helps me to keep the lights on and this informational blog free for everyone. Please click on the links in the articles or to the vendors below if you are purchasing products or DNA testing.

Thank you so much.

DNA Purchases and Free Transfers

Genealogy Services

Genealogy Research

Geno 2.0 Results – Kicking the Tires

Update: Please note that the Genographic Project discontinued public sales of kits in 2019. I am leaving this article for historical context.

Yesterday, my husband’s Geno 2.0 results arrived.  I bought his kit for him for Christmas initially, but couldn’t wait that long so had him swab the very day it arrived.  So much for Santa’s surprise.  But wait, maybe his results will hold a surprise – and isn’t this the first day of Christmas?  Oh, it’s not?  Well, I’ve decided to establish a new tradition this year, that it is the first day of Christmas and this year we will simply have 15 days of Christmas.  The extra three days will be dedicated to Y-line SNPs, a mitochondrial haplogroup and ethnicity results.  Who wants a bird in a pear tree anyway?

Geno Kick JimMeet Jim.  Since you’re going to be looking as his “innards,” so to speak, I think you should formally meet him.  Pretty soon you’re going to be wondering what a Neanderthal, Denisovan, German, Greek, Mediterranean Hun looks like.  I wanted to use the photo of him kissing the dolphin in the Carribbean, but he wouldn’t let me.  Harumph.  I guess Huns have no sense of humor.

There’s a lot of information included on the new Genographic results webpage with some very cool features.  We’re not going to look at everything in-depth today, but we’ll do a flyover so you can see everything.  Right now, because everyone is checking the status of their results, the Genographic webpage is experiencing difficulties.  So if you click and wait, well, go get a cup of coffee.  It will eventually respond and multiple clicks only cause buffer problems when it does respond.  I know this from experience.  How many times have I said that patience is not a virtue attributed to me!

Oh yes, and I had much better luck with the webpage using Chrome as opposed to Internet Explorer 7.

The first screen you see is “Your Story.”  It’s large so I’ll break it into three parts for review.  Notice the 5 tabs at the top of the page.  You’ll be using those.  Actually, if you follow the story line, the story walks you through them all.

Geno kick story

The middle portion of this page shows your mitochondrial DNA, autosomal in the center, followed by your Y-line, if you’re a male.  Your haplogroup is displayed as well for mitochondrial, and your terminal SNP for males, which is the SNP that ultimately defines the deepest level of your haplogroup.  Well, at least until a new terminal SNP is discovered.

geno kick story 2

There are a couple of items of note here.

The tab titled “Your Map” simply won’t load, using either browser.  I’ve sent a note to National Geographic.  I know this is loading for other folks though.  I wonder if it has anything to do with Jim’s haplogroup.

Second, for Jim’s paternal line, CTS11962 is a new SNP not previously tested at Family Tree DNA.  CTS stands for Chris Tyler-Smith, a researcher in the UK at the Sanger Institute who discovered this particular SNP, and named it.

We knew in advance that the new standard for both the Geno 2.0 and also Family Tree DNA will be to only provide the terminal SNP and no longer rename the haplogroups in the way they used to be, such as R1a or R1b1a2.  However, the problem with this approach is that someone looking at this terminal SNP has no reference whatsoever at this point.  There isn’t even a “main” haplogroup branch given, nor a link to any explanation, or at least not that I can find.

After transferring Jim’s results to Family Tree DNA, I noticed that he is now labelled R1a1a1g on his Family Tree DNA haplogroup page.  It looked like his mitochondrial results didn’t transfer initially, but this morning after the Family Tree DNA webpage update, he does have results on his mtDNA Haplogroup Origins page, which is about all you can do with haplogroup only information.  Nat Geo, of course, does not test beyond haplogroup designation for mitochondrial.  However, it looks like his autosomal results didn’t transfer anyplace.  Hmmm….maybe a bug.  I’ll have to contact the helpdesk who is probably swamped this morning.

geno kick ftdna snp

Looking at his Family Tree DNA Haplogroup and SNPs page, all of the SNPs Jim was tested for at Nat Geo appear to be listed, but CTS11962, his terminal SNP, seems to be missing, so others may be as well.  Family Tree DNA updated the data base and web page today, but this didn’t seem to be resolved with the update this morning.  It also looks like it might be a page real estate issue in that this section of his page is quite full.

The bottom portion of the introductory Geno 2.0 page provides an interesting tidbit.

geno kick story 3

Yesterday, when one of my blog followers sent me his initial results, the “you are 1 of” number was 524,384, and that number had been used for some time, so it’s not dynamic.  This new number appeared a few hours later, so I’m thinking that the answer to the number of Geno 2.0 kits sold might be someplace in the ballpark of 35,131.  Just speculation on my part.

Let’s go back now and look at each section.

The mitochondrial DNA area provides a basic description of the haplogroup’s journey, then you can click to see the map.

Since his map won’t load, taking a look at another account I have access to, we see the following map information.

geno kick mito map

See the “share” button on the top right hand side of the next page?  This allows you to send e-mails or a number of other types of messages to friends with a nice summary page of your results.  Be sure to type a message in the message box with your full name because otherwise the recipient will have no idea whose info they are viewing.

Moving to the autosomal section, we see that they have divided the world into 9 regions, plus Neanderthal and Denisovan.

Geno kick auto 1

Jim is Mediterranean, Northern European and Southwest Asian.  His genealogy is entirely German and Hungarian.   He’s a second generation immigrant, so none of his genealogy is lost here in the US.  Of course, the term Hungarian should translate into “churning people” because the devastation of multiple wars spanning centuries has disrupted this population significantly.  The same holds true for Germany.  I would suggest that Germanic and Slavic would perhaps be a better description of his heritage.

In any case, the Mediterranean and Southwest Asian were somewhat of a surprise, but when you look at migration patterns, maybe not so much.  After all, we all came through the Middle East on our way out of African and if your ancestors migrated to Germany, they probably went through the Mediterranean unless they went over the Caucus Mountains instead. And that would give you Southwest Asian heritage most likely.

The only problem is, now Jim wants to go on another Mediterranean cruise to commune with his ancestral homeland.  DNA cruises anyone???

The next section explains what the results mean.  This is actually quite interesting because it compares you to the actual reference population.  In his case, in Germany.

geno kick auto 2

His second reference population was somewhat of a surprise.  It’s Greek.  Perhaps it’s the best reference population they have for “Mediterranean” as the Greeks are truly a mixture of just about everyone in the Mediterranean basin.

geno kick auto 3

They do provide links here to more information.  By clicking on the overview of all reference populations, they provide information about how these populations as a whole are made up today.

geno kick ref

I counted and there are 43 populations.  Another option is to click to review the 9 world regions.

geno kick world 1geno kick world 2

The Neanderthal and Denisovan ancestry is particularly interesting since it has been only recently, in the past couple of years, that humans were believed to have interbred with either group.  Neanderthals have been found throughout most of Europe and western Asia, and Denisovans lived in the Altai Mountains of Siberia.  If you click on the little links imbedded in many place on your page, you’ll see that there is more information about almost every topic.  For example, they tell us that everyone outside of Africa carries some Neanderthal and Denisovan.

geno kick hominid

On Jim’s Genographic page, the terminal SNP shown is M458, shown below the map.  Referring now to the ISOGG Y tree, we see that this equates to haplogroup R1a1a1b1a1.  I didn’t expect CTS11962 to be on the ISOGG tree just yet, and it isn’t, but neither is it anyplace else, so we basically have our hands tied relative to where this falls on the R tree until someone places it someplace.  I know that there is what is affectionately referred to as the “Big Paper” in the works that reworks the haplotree, and I surely hope it’s published sooner than later.  Yes, I know, that patience thing again…..sigh.

geno kick y map

You can also view this haplogroup information as a heatmap.

geno kick heat map

Under the “future” button, they ask you to complete your profile and contribute your story.  You may have noticed that these options are stepping you across the tabs at the top of the introductory page.

geno kick next

Under the “Our Story” tab, which is where the “Contribute Your Story” link takes you, they explain about the community and social networking aspects of Geno 2.0.

geno kick our story

Most interesting is the relationship circle, which looks like either a 45RPM record, a CD/DVD or the front of an i-pod, depending on your age.  The stars and planets are the people who are “related” to you and the larger planets are those with stories attached.  You just click on a planet to see their “story.”  The closer they are to the center, the more closely related they are to you, but I’m unsure how “related” is gauged.  For example if you click on the CTS11962 link, does this mean that everyone carries that mutation, or that it’s the terminal SNP for everyone listed?  If it’s the terminal SNP for everyone listed, wouldn’t they all be equally as closely related?  Jim’s V link doesn’t work, but the same questions apply.

geno kick circle

And at the bottom of this page, you can add your own story.

geno kick your story

I understand in the future that one will be able to contact these “related” people.  If so, and if they haven’t tested their STR markers or their mitochondrial DNA at Family Tree DNA, we can encourage them, or invite them, to do so.

And speaking of which, the one thing I really DON’T like is what they’ve done with the download to Family Tree DNA option.  In Geno 1.0, the transfer option said something like “to learn more,” but was tiny and obscure, at the bottom of a page where you had to scroll multiple times.  I’m sure the reason that only 20% of the people ever transferred to Family Tree DNA was because only 20% of the people stumbled across the link and followed it.  Actually, the fact that 20% actually found it is pretty amazing and speaks highly of how interested people actually are in the Genographic project and their results.  This function and where it’s located is even worse in this version.

To initiate a transfer to Family Tree DNA, first, you have to know that you want to do this. There is no enticing “advertising” or education like there is for other information.  This would be a wonderful opportunity for a nice video or at least a writeup and a link that at least says “to learn more” encourages people to investigate.  Now, you need to go to your Profile link, and under the profile link, click on the Advanced Options.

Nope, I don’t think even 20% of the people will find this.  I’ve very disappointed and hope they will reconsider and rework this option.

I am very hopeful that with some constructive and pleasant feedback that perhaps Nat Geo will reconsider and bring this transfer option into line with the otherwise wonderfully designed and world-class project pages.  Their e-mail address is genographic@ngs.org.

Genographic has so much to offer and Family Tree DNA’s customers and project administrators have played a huge role in recruiting for both Geno 1.0 and 2.0.  I’d really like to be sure that all Geno 2.0 participants receive everything they can out of the total genetic genealogy and anthropology experience.  After all, this is the story of all of us, the human population, and we’re all connected.  The only question is how closely we’re related, and when we get close enough in that tree, can we put names and faces on our ancestors, preferably with a few dates and locations as well?  Hence, it’s a continuum from anthropology to genealogy.  It needs to be a continuum from Nat Geo to FTDNA too.

One thing is for sure, we’re getting closer and closer as we learn more and more.  The tools keep improving and one by one, those brick walls are falling.

Well, we’ve kicked the tires a bit and I think this one is a keeper.  I think National Geographic has done a wonderful job of making a topic that has become increasingly complex over the past few years understandable to the average citizen who will take this test and look at their results with a sense of adventure and curiosity.  The website is beautifully designed.  Don’t shortchange yourself by hurrying through and not taking time to look at all of the photos, stories and videos, and be sure to click on the little “i” icon which means more information.  There’s a lot here to savor, slowly, like a connoisseur of fine food or a wonderfully spellbinding book.

I think what I’ve decided though, relative to autosomal DNA testing and ethnicity is that there is no one answer, there is really only a matter of degrees.  Today, with the different testing companies using different population data references, we receive differing results. I don’t worry too much unless they are significantly different, then I have to scratch my head a bit.

When my own results come back I’ll be doing some comparisons on how minority admixture stacks up using the different autosomal tests and analysis tools available.  We kicked the tires today, but soon, we’ll be taking a test drive to see what we can actually do with all of this. So, stay tuned and in the mean time, savor those results!  After all, on the first day of Christmas, my true love gave to me, a new SNP on my own family tree.

______________________________________________________________

Disclosure

I receive a small contribution when you click on some of the links to vendors in my articles. This does NOT increase the price you pay but helps me to keep the lights on and this informational blog free for everyone. Please click on the links in the articles or to the vendors below if you are purchasing products or DNA testing.

Thank you so much.

DNA Purchases and Free Transfers

Genealogy Services

Genealogy Research

Denisovan DNA Tells a Story

The Denisovan are an extinct human species that once lived in the Altai Mountains in Siberia.  Remains were found in the Denisova Cave (shown above with tourists approaching the entrance) and scientists have managed to extract DNA from a bone fragment that is at least 30,000 years old.  What did that DNA tell us?  The bone belonged to a little girl who had brown eyes, brown hair and dark skin.  Gosh, sounds a lot like me.

Her remains were discovered along with microblades (small stone blades used as tools), body ornaments of polished stone, and a molar shaped very differently from that of Neanderthals and modern humans.  The finger bone from the girl and the tooth were from different people.

Body ornaments – I guess jewelry has been forever popular. Maybe not so different from us as we might think.

The Denisovans lived at the same time as the Neanderthals and both Denisovans and Neanderthals interbred with each other and with homo sapiens, the species we now know as modern humans.  Yes indeed, if you are European, then approximately 5% of your genetic material is Neanderthal and part of it may well be Denisovan too.

You can read more about this exciting discovery here and here.

______________________________________________________________

Disclosure

I receive a small contribution when you click on some of the links to vendors in my articles. This does NOT increase the price you pay but helps me to keep the lights on and this informational blog free for everyone. Please click on the links in the articles or to the vendors below if you are purchasing products or DNA testing.

Thank you so much.

DNA Purchases and Free Transfers

Genealogy Services

Genealogy Research