Digging Up Dad, Exhumation and Forensic Testing Alternatives

Dad in suit

I didn’t do it.  I really didn’t.  Ok, I wanted to, but I didn’t.

Yes, I seriously considered exhuming my father.  Ok, now that you’ve stopped gasping, let me tell you about the story, and what I did instead, and how successful it was, and wasn’t.

My father, William Sterling Estes, died in a car accident in 1963.  That means he’s been dead now for 50 years, half a century.  Depending on the source, he had between 2 and several children.  His obituary names me as his daughter, then inadvertently mixed up my mother, his x-wife’s name with that of his sister.  So my mother is listed as my father’s sister in his obit and his sister isn’t listed at all.  Neither is his other daughter, my half-sister.  For any of you who follow my family story, you already know it’s bizarre, so this unfortunate error should come as no surprise and would only provide Jeff Foxworthy with fodder for his “you might be….if” series.

But, as you’ll see, that obituary is part of the problem and so is the fact that he has been dead 50 years now.  That’s 50 years for his DNA to degrade.

My father was, well, ahem, somewhat of a playboy.  I keep finding children, and rumors of children, scattered about as I kept researching.  I keep waiting for a solid half-sibling match to some poor unsuspecting person on one of these autosomal tests too.  It hasn’t happened yet, but I’m just sure that one day it will.

And I haven’t published my blog article on Ilo yet, but suffice it to say that if you know of an Ilo (or maybe Flo?) who had a male child about 1920 in or near Battle Creek, Michigan and was briefly “married” to William Sterling Estes who was serving at Camp Custer at the time….I need to talk to you.

Now you’d think with all of these alleged children, there would be a male child to test, but the only male child I knew of back when DNA testing began was the male child of Ilo who I have never been able to identify, let alone locate.  I hadn’t found my “brother” Dave yet at that time, but as it turned out, Dave’s DNA did not match the Estes line anyway, so that would have been a red herring.

My Estes line out of Claiborne County Tennessee, for all of the males in earlier generations, dwindled to only a few, then to none in my generation.  The best I could do was a descendant of a male 3 or 4 generations upstream in my tree, and where there are paternity questions in more recent generations, a descendant from up the tree isn’t helpful, or wasn’t before autosomal testing.

Ah yes, that paternity question.  You see, it wasn’t definite.  A descendant tested the Y chromosome, and he was off just enough markers to be considered a problematic match.  But, it was enough to introduce doubt.  And doubt is a horrible nag for a companion – especially for the family genealogist who has spent the past three and a half decades working on this “doubtful” family.  In other words, OMG!!!  This was the genealogical equivalent of a panic attack.  And what could I do?  There was no one else to test.

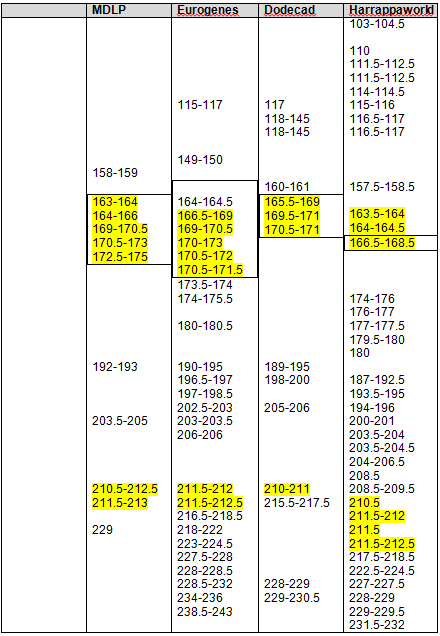
On the chart below, the green line is the Estes ancestral line, as we know it today, proven by both genetics and genealogy.  The purple is the anonymous participant that tested and had the questionable match to the green ancestral Estes line.  The yellow group was then “suspect” because of the questionable match.  When I found David, supposedly my father’s son, and he tested, matching neither the purple participant nor the Estes ancestral line, it nearly put me over the edge.  My cousin, Buster agreed to test, which confirmed the ancestral Estes line back to Lazarus, which left the yellow still in the questionable realm.  There were no living males to test in the yellow line.

Digging up dad 1

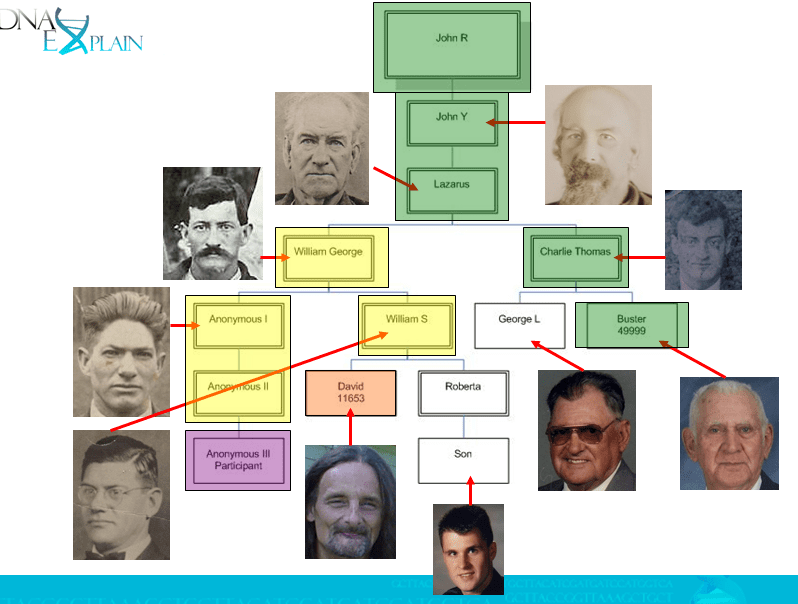
So, I considered exhuming Dad.  That possible paternity issue had shaken me, pretty much to the bone, and I desperately wanted to know.  Was I barking up the wrong tree?  Was my Dad not my Dad, but David’s Dad?  David and I clearly were not genetic half-siblings, suggested at that time by CODIS testing, but proven eventually by 23andMe testing.  Was my Dad not the child of his father, William George?  Was his father maybe not the child of his father, Lazarus?  Why did my grandfather not look like the other Estes men?  We knew that John R. Estes matched the ancestral Estes line, but we had no one else to test below John R. on the tree.

Below, my great-great-grandfather, John Y. Estes, at left, my great-grandfather, Lazarus, center and my grandfather, William George, at right.

Digging up dad 2

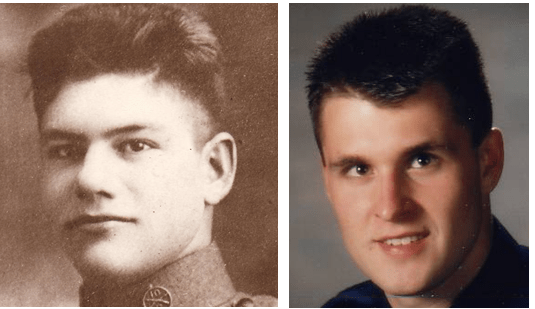
Why did my son look so much like my father?  Was I just seeing things that weren’t there?  Below, my father as a teen in his military uniform and my son about the same age.

digging up dad 3

Without a male to test the Estes Y-line DNA, how would I ever know?

One day, a package arrived in the mail.  My step-mother had died some years ago, and her daughter had found a group of letters in her mother’s belongings that she felt I should have.  Among those letters were letters from my grandfather to my father.

Letters?  Envelopes?  Stamps?  Saliva?  DNA?  JACKPOT!!!  WOOHOOOO!!!!!!!

At the time my grandfather mailed those letters to my father, in the 1960s, my grandfather was living alone, so he should have licked the envelope and the stamp himself.

I called Bennett Greenspan at Family Tree DNA.  He referred me to a private lab that “does things like this,” called Trace Genetics.  Before you start googling, the company was subsequently sold and has now been defunct for years.  However, at that time they were doing custom processing of private forensic samples.

Yes, anything like that is considered forensic.  Anything you have to extract DNA from before you can have it processed in a regular lab is forensic work.

So, I got an estimate, took out a loan, and told them to go ahead.  You think I’m kidding, but I’m not.  The cost was in the $2000 range FOR EACH ATTEMPT.  So, we tried the envelope first.  No DNA.  Then we tried the stamp.  We got DNA, but it was female, so we knew it was contaminant DNA.  Think of how many people handle an envelope in the processing and delivery of mail, not to mention all the people who had handled it since.  Then we tried a second envelope.  No dice.

I was beyond frustrated and so were the two wonderfully patient scientists I was working with at Trace Genetics.  We all desperately wanted DNA.  In all fairness, they told me very clearly up front that there was a less than 50% chance of obtaining  ANY DNA, let alone usable DNA, let alone Y-line DNA.  Yes, the odds were very much stacked against me, and I knew it.

Y-line DNA is the least obtainable.  Most forensic work is done using mitochondrial DNA.  That’s because in each cell there is a total of 1 Y chromosome and there are thousands of mitochondria.  So the chances of recovering mitochondria are much greater than a Y chromosome.

Still, I had to try.  If you’re thinking of the word obsessed, I certainly wouldn’t argue with you.

Then I remembered, I had my father’s VFW hat.  I had it stored away in an old train case with other memorabilia from my childhood.  That was the one and only thing of my father’s I ever had – that hat.  I still remember him wearing it and I remember going to the VFW hall with him.  They had a slot machine and sometimes he used to let me pull the arm on the machine.  That was great fun.

I asked my friendly scientist at Trace Genetics what to do with the hat.  He suggested that I look for hairs in the interior of the hat, under the hatband, and then he told me how to extract the hair without touching it myself using sterile gloves.  I did so, put the hair in a Kleenex, put the Kleenex in an envelope and overnighted it to Trace Genetics.  This hair had the all-important follicle attached, the only part of the hair that will provide DNA.

I was positive, just positive, that this time was the jackpot.  But it wasn’t, and neither was the next hair.

Are you adding up the numbers in your mind?  Well, I assure you, I was adding them up.  And it wasn’t the money that bothered me, but the lack of results.  I was devastated.

Dad tombstone

So, I considered exhumation.  I looked into it, and I discovered a couple of things that were very important and were likely show-stoppers.

  1. In order to exhume someone, you have to petition the court and give a reason.  Then, you have to obtain the written, notarized, permission from every single descendant.  Yes, I said EVERY SINGLE DESCENDANT.  If even one disagrees, or refuses, it’s done, a deal-killer, dead.
  2. The cost of said exhumation is about $20,000 including all expenses, like attorney fees, backhoe, medical examiner, etc..

Choke, sputter, cough….clutching chest….

I happened to know someone who actually did exhume their ancestor, not for DNA testing, but because the cemetery was going to wind up at the bottom of a lake.  And yes, the entire process did cost in the neighborhood of 20K, a price-tag they did not anticipate in advance nor expect.

I had my doubts that any court would approve an exhumation for obtaining DNA for genealogy, but they might approve it to move the grave to Tennessee where my father’s family was buried.  Dad was (and is) buried alone in Indiana.

OLYMPUS DIGITAL CAMERA

But to move him, the cost of the exhumation would increase exponentially.  Moving a body which is considered medical waste is not inexpensive.  By way of comparison, to bring my sister home from Arizona to Michigan for burial was in the neighborhood of 10K.  And that would have been in addition to the 20K for exhumation.

For a minute, I thought about my brother, Dave, the long haul truck driver and I wondered if he had any room in that truck between pallets of yogurt.  But I got a grip on myself before asking him. I had visions of Dave putting Dad back in the sleeper cab…but I digress.

Ok, now we were talking the price of a car or a small house…a vacation home maybe or a trip around the world.  And it wasn’t 2K at a time, but an all or nothing proposition.

Not only did I not have the 20K or 30K, I couldn’t justify borrowing it, so I decided to leave sleeping Dad’s lie, so to speak.

I also decided that really, while I desperately did want to know about the paternity issue and its resolution, that I’m an Estes no matter what.  It’s my maiden name, it’s my name now that I’m married (I married a Kvochick, need I say more) and it will be my name on my tombstone.  So, I’m an Estes no matter whether I descended from them genetically or not.

I intentionally have not addressed any moral or ethical issues about exhumation.  Some feel the dead should be left alone, undisturbed.  However, there is precedent… the Catholic church regularly exhumes their saints to see if the body is well preserved.  I didn’t know what to think, truthfully, along those lines, and before I could have and would have actually made that decision, I would have had to think long and hard about it.  Would I have been there for the exhumation?  Could I have stayed away?  Would I have wanted to see my father like that?  All questions I would have had to answer, but did not have to, because the other issues precluded exhumation.

The first issue I would have encountered was who, exactly, were his descendants, and how, exactly, legally, was that determined?  I mean, does the court go by the obituary?  If so, my mother was his sister.  But I had a real half-sister.  Was she included?  No place did it say that she was his descendant.  He didn’t have a will.  And what about the children we knew about but couldn’t find?  Would that preclude the exhumation?  Or should we just stay quiet about them?  No, too many ethical issues and thorny problems, and that is BEFORE you get to the money issue.

I’m glad I didn’t slog through that mess, because before long, autosomal testing came about – not CODIS testing – which was inconclusive at best – but wide spectrum testing using hundreds of thousands of DNA positions, today’s 23andMe and Family Tree DNA’s Family Finder tests.

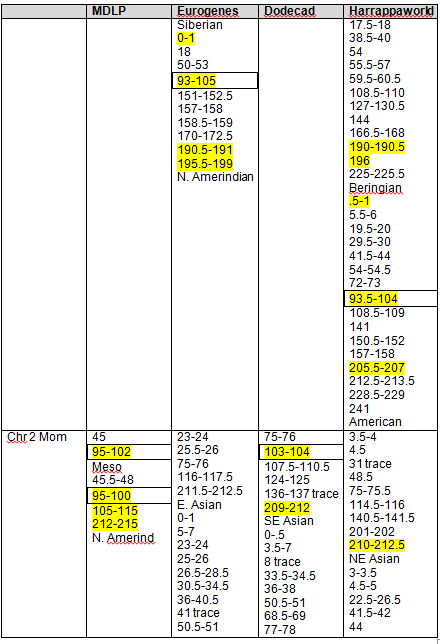
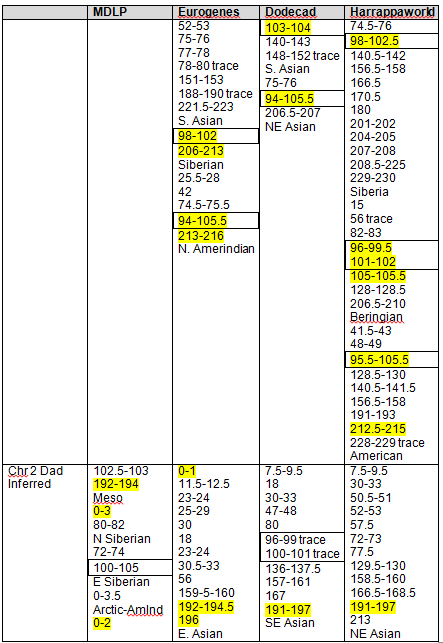
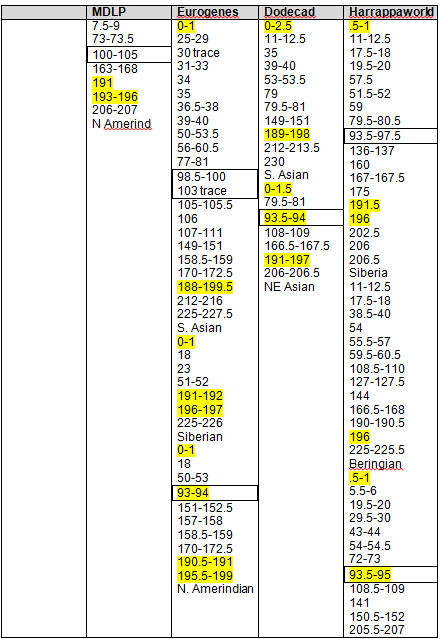
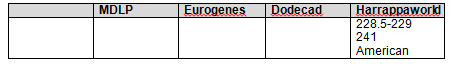
I have several Estes cousins who aren’t direct male lines but who who are fairly close genetically and I’m not related to any of them through any other genealogical lines.  If I matched them, it would be proof positive that I indeed was a blood descendant of the Estes line.  I wasn’t happy testing just one or two, so I tested 5 or 6 of my cousins from different children of my great and great-great-grandfather – and yes, I did indeed match all of them.

What a relief!  I didn’t have to dig up Dad or spend the equivalent of a couple years of college education.

But for those who are indeed as desperate as I was, let me tell you the following.

  1. There are very few labs that will do this kind of processing.  It is very unpopular as you basically have to shut the entire lab, sanitize it, and run no other tests until you are done.  You can see a forensic lab clean room in Ripan Malhi’s lab at the University of Illinois.
  2. Best case, with a relatively recent sample, meaning one from someone who died recently, you have about a 50% chance of useable DNA retrieval.  That’s BEST CASE.
  3. Skin is good.  The best is an electric razor contents.  Do NOT touch them.  Put the entire razor with contents into a plastic bag and DO NOT seal it.  Keep it in a temperature stable environment.  No attic or basement.   Sometimes hairbrushes have skin flakes in with the hair.
  4. Hearing aids are good.  Again, do not touch, etc.  Blood is good.  Spit is good.  A Kleenex is wonderful, providing you are sure it is their Kleenex.  If your mother was like my mother, check her bathrobe pockets.
  5. Older things like hair, sweat, envelopes etc. are not so good.  The older the sample, the less likely you’ll be able to retrieve DNA.  It degrades with time and these aren’t particularly good to begin with.
  6. Digging up a grave without doing all of the paperwork is illegal, and the legalities vary by locality – so consult an attorney and get the check book ready.  I just thought I should mention that little illegal detail, just in case.  I know genealogists are innovative and sometimes desperate people.

Having said all of that, don’t go throwing anything away.  There is new technology on the horizon that will only need one cell of DNA – so I’m told.  Seeing how far we’ve come in the past decade, I don’t doubt that someday this will be true, and someday may be closer than you think.  And no, I do not know how far away that horizon is.

So, store your DNA item safely.  Label it.  Do not seal it in plastic.  Do not store it in the attic (heat) or basement (cold, humidity) but someplace fairly temperature regulated.

One time when working with an archaeological specimen, we were told to freeze the sample.  Well, we did, in a plastic cool-whip container with water.  However, the electricity went out while the person whose freezer the specimen was stored in was out of town.  Their friend went to their house and did them the very big favor of disposing of everything in the fridge and freezer before they came home.   Needless to say, we were just sick.  So, don’t freeze it either.  Besides that, freezing in a frost-free refrigerator (that by definition defrosts itself regularly) is not the same as freezing a specimen in a laboratory temperature controlled stable environment.

So, what’s the upshot of this?

  • Forensic genetics is expensive
  • Exhumations are extremely expensive and fraught with all kinds of legal and technical landmines
  • There are very few labs, if any, that will process private forensic samples
  • When DNA is retrieved from a forensic specimen, it may be contaminant, not the DNA of the person you think it belongs to
  • When DNA is retrieved from a forensic specimen, you still have to pay for the DNA testing, in addition – and it may not work
  • When DNA is retrieved from a forensic specimen, if it does amplify, it will most likely be mitochondrial DNA
  • Using today’s combined genetic genealogy tests, there is almost always a way around the lack of a particular DNA donor, making exhumation and or forensic testing unnecessary

And if you’re considering grabbing a shovel, an urge which I well understand, I’ll leave you with the advice of an ethicist that Family Tree DNA invited to speak at their annual conference a few years ago, “Don’t do anything in the dark of night that you wouldn’t do in the middle of the day.”  Put another way, don’t do anything you wouldn’t be comfortable seeing in the headlines, because if you get caught, that’s where you’ll be:)

But then again, those headlines would certainly be something interesting for future generations of genealogists to dig up about you!

______________________________________________________________

Disclosure

I receive a small contribution when you click on some of the links to vendors in my articles. This does NOT increase the price you pay but helps me to keep the lights on and this informational blog free for everyone. Please click on the links in the articles or to the vendors below if you are purchasing products or DNA testing.

Thank you so much.

DNA Purchases and Free Transfers

Genealogy Services

Genealogy Research

The Autosomal Me – Extracting Data Segments and Clustering

This is Part 8 of a multi-part series, “The Autosomal Me.”

Part 1 was “The Autosomal Me – Unraveling Minority Admixture” and Part 2 was “The Autosomal Me – The Ancestors Speak.”  Part 1 discussed the technique we are going to use to unravel minority ancestry, and why it works.  Part two gave an example of the power of fragmented chromosomal mapping and the beauty of the results.

Part 3, “The Autosomal Me – Who Am I?,” reviewed using our pedigree charts to gauge expected results and how autosomal results are put into population buckets.  Part 4, “The Autosomal Me – Testing Company Results,” shows what to expect from all of the major testing companies, past and present, along with Dr. Doug McDonald’s analysis.  In Part 5, “The Autosomal Me – Rooting Around in the Weeds Using Third Party Tools,” we looked at 5 different third party tools and what they can tell us about our minority admixture that is not reported by the major testing companies because the segments are too small and fragmented.

In Part 6, “The Autosomal Me – DNA Analysis – Splitting Up” we began the analysis part of the data we’ve been gathering.   We looked at how to determine whether minority admixture on specific chromosomes came from which parent.

Part 7, “The Autosomal Me – Start, Stop, Go – Identifying Native Chromosomal Segments”, took a deeper dive and focused on the two chromosomes with proven Native heritage and began by comparing those chromosome segments using the 4 GedMatch admixture tools.

In this segment, Part 8, we’ll be extracting all of the Native and Blended Asian segments on all 22 chromosomes, but I’ll only be using chromosomes 1 and 2 for illustration purposes.  We will then be clustering the resulting data to look for trends.  If you’re following along and using this methodology, you’ll be extracting the Native segment start and stop locations from all 22 chromosomes.

I apologize in advance for the length of this article, but there was just no good place to break it into pieces.

So, let’s get started.  As a reminder, we are using the admixture tools at www.gedmatch.com.

I experimented with several types of extractions to see which ones best reflected the results found by both 23andMe and Dr. McDonald and confirmed by the start and stop segments in the highly Native segments of chromosomes 1 and 2 in Part 7 of this series.  We verified that all 4 tools accurately reflected and corroborated the segments listed as Native, so now we’re going to apply that same methodology to the rest of our chromosomal data.

Initially, I tried to use the information from chromosomes 1 and 2 to extract the Native chromosomes using only the “best” tool, but when I looked at all 4 tools, I quickly realized that there was no single “best” choice.  A couple of crucial points came to light.

  • Some of the geographic colors are almost impossible to tell apart.
  • None of the tools are universally best.
  • When looking at all 4 tools, generally a “best 3 out of 4” approach allowed for one of the tools to be wrong, to perhaps reference a slightly different data base that called the segment differently or for the colors to be indistinguishable.  In other words, if three called a segment Native and one did not, it’s Native and conversely, if less than 3 call it Native, in this comparison, it’s not.

Unfortunately, this created an awful lot of work.  This is probably the best example of where automation tools could and would make a huge difference in this process.

I did two separate extracts.  The first one is what I refer to as the “Strong Native” extract and the second is the “Blended Asian.”  In part, I did these separately as a check and balance to be sure that my first extraction was accurate.

In the first extract, I selected only one category, the one best fitted to “Native American” for each tool.  I used the following categories for each admixture tool:

  • MDLP – Amerind
  • Eurogenes – North Amerindian
  • Dodecad – NE Asian
  • Harrappaworld – American

I completed this process for every chromosome, but I’m only showing the first two chromosomes in this article.

By way of example, using the first tool, MDLP, North Amerind looks black, but is actually very dark grey.  It is, fortunately, distinctive.

On the chromosome painting below, my results for the first part of chromosome 1 are shown in the first band, and mother’s for the same segment are shown as the second band.  The bottom band represents common segments and the black is non-matching segments, meaning those I obtained from my father.  Sometimes this third band can help you determine what you are really seeing in terms of colors and blending, but it’s not always useful.  In this case, trying to spot a small amount of dark gray against black is almost impossible, so not terribly helpful.  But if you were looking for red, that would be another story.  As you move through this process, remember, it’s not exact and utilizing best 3 of 4 will help you recover from any major errors.

You can see that my grey segments show up from about 12-13 and then again at about 14.5.  Sometimes it’s difficult to know how to count something.  For example, my Native at 14.5 – it’s actually more like 14.25 -14.5, but I chose not to divide further than half mb segments.  As long as you are consistent in whatever methodology you select, it will work out.

step 8 - 1

Please note that when reading these charts, that the small hash mark is the indicator for the measure.  In other words, the small hash mark above 10M means that is the 10M location.  It’s obvious here, but on some charts, the hash mark and the location legend look to be 1-off.  Again, as long as you’re consistent, it really doesn’t matter.

Mother’s Native segments are more pronounced and obvious.  They range from about 8-14.  Using the actual tools, you would record this and then continue scrolling to the right until you reach the end of the chromosome.  On chromosomes 1 and 2, I found the strong Native segments for the four admixture tools, as shown below.

The boxed numbers show the areas that were found “in common” between 23andMe, Dr. McDonald and the admixture tools, as determined in Part 7 of this series.  Highlighted segments show segments where at least 3 of 4 admixture tools reported Native heritage.  As you can see, there were clearly additional Native segments not reported by 23andme and Dr. McDonald.

Strong Native Chromosomal Detail Table

step 8 - 2

step 8 - 3

Because we have both my and mother’s results, we can infer my father’s contribution.  Clearly, some of his will wind up being some amount of “noise” and some IBS segments, but not all, by any means, and this is the only way to get a “read” on Dad.  This is one form of phasing data.  Phasing refers to various methodologies of figuring out which DNA comes from what source, meaning which parental line.

While the strongest Native segments are the ones individually most likely to indicate Native American ancestry, that really isn’t the whole story.  I discovered that many of these Native segments are actually embedded in other segments that are indicative of Native heritage too.  In other words, it’s not a line in the sand, yes or no, but more of a sliding scale.

On the chromosome painting below, this one using Eurogenes, with my results shown above and mother’s below, you can see two excellent examples.  Regions relevant to Native ancestry include:

  • Red – South Asian
  • Brown – Southwest Asian
  • Yellow – North Amerindian and      Arctic
  • Putty – Siberian
  • Emerald – East Asian

You can see that while mine is almost universally yellow, or Native, with a little Siberian (putty) mixed in for good measure between 169-170, a hint of East Asian (emerald) plus a little Asian (red), mother’s isn’t.  In fact, hers is a mixture of Native American and South Asian (red), with more red than yellow,  Siberian (putty) and a large segment of East Asian (emerald green).

step 8 - 4A

While her yellow Native segments alone would be staggered across this entire segment in 7 different pieces, when taken together as a whole, the “blended Asian” segment reaches entirely across the screen with the exception of 1 mb between 161.5-162.5, roughly.

The following Blended Asian Chromosomal Detail Table shows all of the blended Asian segments using all four of the admixture tools for chromosomes 1 and 2.

It’s clear that these regions are not solely “Native American” but reach back in time genetically into Asia, particularly Northeast Asia.

Again, the boxed numbers show the “in common” segments between all tools and the yellow highlighted segments are common between at least three of the four admixture tools.

Please note that there were some issues distinguishing colors, as follows:

  • For the MDLP comparison, Mesoamerican and Paleo Siberian are both putty colored and indistinguishable on the chart.  Also, the apple green for Arctic Amerind is very similar to the Austronesian.
  • When using Dodecad, Southeast Asian (light green) and South Asian (apple green) are nearly impossible to distinguish from each other on the graphs.
  • When using HarappaWorld, the apple green for Siberian was very similar to the light forest green for Papua New Guinea and was very difficult to distinguish.  The South Asian putty appears often with the other Native markers, and I considered including this group, but it too was difficult to distinguish from other regions so in the end, I opted not to include this category.
  • If you are colorblind – get help as this is impossible otherwise.

Blended Asian Chromosomal Detail Table

On the blended Asian Chromosome Detail Table, I added yellow highlighting where the same segments show in other Asian geographies that showed in the Strong Native table.  In each column, the Strong Native category is the last one at the bottom of the list.

The blue highlighting shows other common segments found that were not included in the Strong Native segments.  For a Strong Native yellow segment to be highlighted, it had to be present in 3 of 4 tools, or 75%.  In the Blended Asian group, there are a total of 15 categories between the 4 admixture tools, so for a segment to be shaded blue, it must be found in at least 8 of the categories, so just over half.  There are many segments that are found in several categories across the tools.  For example, segment 192-193 on chromosome 1 is found five times.  This isn’t to say you should discount this segment, only that it isn’t one of the strongest, most universal.  Surprisingly, there really weren’t too many that were close to the cutoff.  Several, but not a majority, were in the 4 or 5 range, only one was at 7.

step 8 - 4

 step 8 - 5

step 8 - 6

 step 8 - 7

  step 8 - 8step 8 - 9

 step 8 - 10

 Step 8 - 11

step 8 - 12

Clustering

The third step in data extraction is to look at all of the data together.  In this step, we are removing the geographic boundaries of Siberian, N. Amerindian, etc. and combining all of our data.  I have only combined the data within columns, not between columns, so we can get a feel for which tool or tools performed best or maybe not so well.  Each chromosome in each column has its data ordered numerically, and yes, this is a manual cut and paste process.  Sorry.  I warned you, this is an very manually intensive process.

After I put each column in numerical order, I arranged them so that the numbers were approximately in a line, or a row, with each other.  For example, in the first group below, you can clearly see that the first cluster of results is found using all 4 tools.  When looked at individually, only the blue results were noted as common (at least 8 of 15 for blue), but when viewed as a cluster, you can see between the tools that the cluster itself runs from about 7.5, with a small break from 8-9, and then to about 14.5.  As you would expect the beginning and end points of the cluster trail off and are not uniform between tools, but the main part of the cluster is found in all the tools.  This introduces the question of how to measure a cluster.  In this case, there is a clean break using all tools between 8 and 9, but that is only 1 mb, rather difficult to measure accurately.  You could record this as two distinct clusters but since it’s very closely adjacent the rest of the cluster, I’m inclined to include this as one large cluster and use the starting and ending segments for the cluster as a whole, in other words, the cluster runs from 7.5 through 14.5.  The alternate, or more conservative methodology would be to use the “in common” numbers, but in this case, that would be only 10-11.5 and I think you would miss a great deal of useful data.  So, for clusters, I’m recording the full extent of the cluster.  In some cases, you may need to exercise a judgment call.

Let’s look at the second group of numbers, beginning with 18.5 in Harrappaworld.  This grouping runs though about 28.  Eurogenes found some blended Asian between 27-28.5 as well in two of the geographies, but over all, of the 15 tools, we don’t see much.  This could be a result of a number of things.  I could have had problems with the colors, there may be only a very small amount and it may be categorized as something else with the other tools.  I would not consider this a cluster, and using our best 3 or 4 methodology eliminates this cluster from consideration.  This also holds true for 43-43.5.

However, the next cluster, from 55.5 to 58 is found in the Strong Native comparison, indicated by the yellow highlighting and is found using all 4 tools.  This is definitely a cluster.

step 8 - 13

step 8 - 14

step 8 - 15

step 8 - 16

step 8 - 17

step 8 - 18

step 8 - 19

Step 8 - 20

step 8 - 21

step 8 - 22

step 8 - 23

step 8 - 24

I’ve synthesized the cluster information into a list.  From the clusters above, I’ve created a list that I will be using in the next segment for data input into my spreadsheet of matches.  The blended segments below that include Strong Native segments are shown with yellow.

step 8 - 25

Using the GedMatch admixture applications, we’ve isolated the strongest Native and the Blended Asian segments and clusters in preparation for identifying specific Native family lines within our group of matches.

This process shows that, for the most part, the Strong Native segments picked up the strongest signals, about half of the segments that will be useful in determining Native admixture, although it does miss some.

When we use the clustering technique to view our results across all the admixture tools, we see a somewhat different picture emerge, adding several Blended Asian clusters.

In Part 9 of this series, we will use the highlighted Strong Native segments and the Blended Asian clusters, both of which suggest Native chromosomal “hotspots” to begin our comparison to our genetic matches for genealogical relevance.  In other words, using this information, we will determine which genealogical lines carry Native ancestry.

Part 9 may be somewhat delayed.  The good news is that Family Tree DNA is finishing work on their Build 36 to Build 37 conversion.  The bad news is that it fell right in the middle of writing this series.  When they finish Build 37, I’ll finish Part 9 of this series.  In the mean time, you can be extracting your minority segments using the tools and techniques that we have covered in Parts 1-8.

______________________________________________________________

Disclosure

I receive a small contribution when you click on some of the links to vendors in my articles. This does NOT increase the price you pay but helps me to keep the lights on and this informational blog free for everyone. Please click on the links in the articles or to the vendors below if you are purchasing products or DNA testing.

Thank you so much.

DNA Purchases and Free Transfers

Genealogy Services

Genealogy Research

Ancestry Needs Another Push – Chromosome Browser

ancestry push

It seems that the genetic genealogy community is constantly doing battle with Ancestry in regards to Ancestry’s mediocre and at times, outright faulty autosomal DNA product, AncestryDNA.  AncestryDNA, similar to Family Finder at Family Tree DNA and the 23andMe test, matches you against others who have taken the test for “relatedness” across all of your ancestral lines.  I wrote a primer about autosomal testing in an earlier article, another comparing the various company offerings and a third comparing the actual results.

While we were excited this week that Ancestry has finally lived up to their promise to provide our raw data files for download, albeit many months later,  they have made a decision apparently to NOT provide a chromosome browser, their logic being, according to genetic genealogists who spoke to Kenny Freestone, Ancestry’s product development manager this week at Rootstech, that their primary focus is to keep things simple for the newer users.  Just so you know, if you’re an Ancestry user, not only have they just called you “stupid” but they also insinuated that you are unable to learn and to be anything other than stupid.  Are you insulted?  I surely am.

Ok, let’s forget, for the moment, about the fact that Ancestry just insulted us and let’s look at why having a chromosome browser is important.

This is very simple.

Just because you have a paper genealogy match with someone, especially a distant DNA match, does NOT mean that is how you’re related to them. 

Ancestry does a good job of linking up people who match by connecting people in their trees.  But that doesn’t mean that connection is how they are genetically related.  Plus, we all know about the, ahem, “quality” of Ancestry trees.

ancestry push 1

Here’s an example.  This is a match to someone through my ancestor, James Claxton and his wife Sarah Cook.  However, what if I’m also related to this person through the Estes family too?  Or an unknown line?  Just because the paper connection is to James Claxton doesn’t mean the genetic connection is to him as well.  This person has over 11,000 people in his tree.  If we are from the same geography, it’s likely that we match on multiple lines.  What if we match on paper on two or three lines?  How do we know how we are genetically related – through which line or lines?

At Ancestry, you don’t – you can’t – because they want to “keep things simple.”   Let me translate – they would rather leave you with a vague “feel good” notion about who you are related to, even if it’s not true, than give you the tools to discover the truth.

We need a chromosome browser to let us see how and if the DNA we share with these people is really from the Clarkson/Claxton family or the Cook family, or if maybe it’s from another line that isn’t shown on the pedigree chart being displayed by Ancestry.

Let’s move to Family Tree DNA to see what a chromosome browser does for you.  At Family Tree DNA, three of my Vannoy cousins have tested.  By using the chromosome browser to look at their DNA compared to mine, we can identify some segments as “Vannoy” segments – meaning they unquestionably come from that line.  We do that by using triangulation. It’s easy.  Using 3 or more relatives from a particular line, if three or more match on a particular segment, you know that segment is from that family line.

ancestry push 2

I’ve selected three cousins to compare to my results, above, and their results will be displayed using these colors.  Below, you can see that on chromosome 15, all 4 of us match on a significant sized matching segment.  That means that this segment is definitely “Vannoy.”  How does this benefit us?

ancestry push 3

Well, it benefits us in two ways.  Let’s say an adoptee, or someone who has hit a brick wall also matches us on this segment.  It tells us that they are also “Vannoy” or perhaps ancestors of Vannoys.  Ancestors of Vannoys?

ancestry push 4

Yes, Vannoy is of course made up of their ancestral names and lineages too, so in time, let’s say that a Hickerson matches this segment too.  Then we’ll know that this segment comes from Daniel Vannoy’s wife, Sarah Hickerson’s line.  Do you have any wives surnames in your lines that need to be identified?  This is one way to do it, but you can’t without a chromosome browser.  And you could be the one who is brickwalled with the answer just waiting…..if there was a chromosome browser.  Do you see why this is so important, especially given the number of people who have tested at Ancestry?

Pretty simple stuff, right?  Well, Ancestry doesn’t think so.  They think you’re not capable of understanding this.  Funny, both Family Tree DNA and 23andMe provide this capability and people use it and depend upon it daily.  If you don’t want to use it, you certainly don’t have to, but to deprive all of us of an absolutely critical component of genetic genealogy is unconscionable. It’s simply not acceptable.

What can we do about this?  CeCe Moore, Tim Janzen and Dave Dowell were at Rootstech this week where they spoke with Kenny Freestone, among others.  He’s says he does personally read the information submitted through the “Feedback” button.  That is apparently how Ancestry gauges what needs to be done and prioritizes items.  Of course, if most of their novice clients don’t know what they are missing, they won’t be able to ask for what they don’t know about.  They are living under the illusion that they ARE genetically connected to everyone whose tree shows, and through the common paper line, and that’s it.  They don’t know that Ancestry is intentionally leaving them in their “feel good” cocoon and intentionally withholding “the rest of the story” and with it, their ability to discover even more.

But we know better and we were all “new users” at one time.  Use the feedback button.

ancestry push 5

It’s at the top right of your DNA pages at Ancestry.  Send Kenny the message…..”Kenny, we need a chromosome browser.”

Pssst….pass it on.  Everyone needs to provide this feedback.  This is how we got the raw data released and it’s the only way we’ll ever convince Ancestry to implement a chromosome browser.  Facebook this posting, Tweet it, post it on groups and forums.  Get the word out.  Send Feedback!!!

ancestry push

Judy Russell, the Legal Genealogist blogged about this today as well.

______________________________________________________________

Disclosure

I receive a small contribution when you click on some of the links to vendors in my articles. This does NOT increase the price you pay but helps me to keep the lights on and this informational blog free for everyone. Please click on the links in the articles or to the vendors below if you are purchasing products or DNA testing.

Thank you so much.

DNA Purchases and Free Transfers

Genealogy Services

Genealogy Research

Downloading Ancestry’s Autosomal DNA Raw Data File

Well, the big day has finally arrived.  Ancestry has at last allowed us to download our raw data files.  To download yours, sign on to your Ancestry account and fly over the DNA tab.  You’ll see the selection, “Your DNA Home Page,”  Click on that.

ancestry download

Then click on “Manage Test Settings” to the right of the orange “View Results” box.  You’ll see the following screen.

ancestry download 1Click on “Get Started” in the right hand box under “Download your raw DNA data.”  You will then be prompted to enter your password to receive an e-mail to allow the download.

ancestry download 2

The e-mail will arrive, and you will need to click the link in the e-mail, shown below, to activate the download.

ancestry download 3

Clicking on the e-mail link “Confirm Data Download” takes you to the next step on Ancestry’s website, below.

ancestry download 4

Clicking on the green “Download DNA Raw Data” link shows the following:

ancestry download 5

Shortly, your browser will do whatever it does to ask you if you want to save or display the file.

ancestry download 6

I use Internet Explorer and download files are automatically saved in the “download” folder.  I renamed it and moved it to someplace where I can find it, hopefully.  The good news is that if I “lose” it on my computer, it’s easy to repeat this process.

Now, what can you do with this file today?  Not a lot.  You can compare raw data segments with others who might download their files too, but life will be a lot easier when tools like GedMatch can accept these files and do something with them.  There were also rumors last fall that Family Tree DNA would support uploads as well when Ancestry released these files, the same as they do with 23andMe raw data files.  Let’s hope so.

However, today will be the first day these organizations see the raw data too, so expect a bit of lag time before anyone can process or incorporate this information.  Of course, it goes without saying that we have to address issues pertaining to file layout and compatibility.

I’m hopeful that since Ancestry has the raw data files for everyone who has tested there, that they will do what the other two major players have done and create a chromosome browser where you can see who matches you on which segments and download that comparative information as well.  It’s not just the raw data we need, it’s the integrated tools to use it.  Hopefully we’re at the crawl before you walk stage and we’ll be walking soon!

______________________________________________________________

Disclosure

I receive a small contribution when you click on some of the links to vendors in my articles. This does NOT increase the price you pay but helps me to keep the lights on and this informational blog free for everyone. Please click on the links in the articles or to the vendors below if you are purchasing products or DNA testing.

Thank you so much.

DNA Purchases and Free Transfers

Genealogy Services

Genealogy Research

The Autosomal Me – Start, Stop, Go – Identifying Native Chromosome Segments

This is Part 7 of a multi-part series.

Part 1 was “The Autosomal Me – Unraveling Minority Admixture” and Part 2 was “The Autosomal Me – The Ancestors Speak.”  Part 1 discussed the technique we are going to use to unravel minority ancestry, and why it works.  Part two gave an example of the power of fragmented chromosomal mapping and the beauty of the results.

Part 3, “The Autosomal Me – Who Am I?,” reviewed using our pedigree charts to gauge expected results and how autosomal results are put into population buckets.  Part 4, “The Autosomal Me – Testing Company Results,” shows what to expect from all of the major testing companies, past and present, along with Dr. Doug McDonald’s analysis.  In Part 5, “The Autosomal Me – Rooting Around in the Weeds Using Third Party Tools,” we looked at 5 different third party tools and what they can tell us about our minority admixture that is not reported by the major testing companies because the segments are too small and fragmented.

In Part 6, “The Autosomal Me – DNA Analysis – Splitting Up” we began the analysis part of the data we’ve been gathering.   We looked at how to determine whether minority admixture on specific chromosomes came from which parent.

Part 7 – “The Autosomal Me – Start, Stop, Go – Identifying Native Chromosomal Segments”, takes a deeper dive and focusing on the two chromosomes with proven Native heritage, begins by comparing those chromosome segments using the 4 GedMatch admixture tools.  In addition, we’ll be extracting Native segment chromosomal start and stop addresses that we’ll be using in a future segment.

Using Doug McDonald’s tool and the 23andMe results, we can begin with the following two Native segments, one each on chromosome 1 and 2.  These will be our reference points, because according to both sources, these are the largest and most pronounced Native segments, the strongest indicators, so they will be our best yardsticks.

  Chromosome 1 Chromosome 2
23andMe

165,658,091 to 175,711,116

86,316,174 to 103,145,426

McDonald

165,000,000 to 180,000,000

90,000,000 to 105,000,000

On all of these admixture graphs, my results are shown first, then mother’s, then the comparison between the two where the colored regions show common ancestry and the black shows nonmatching segments – in other words those contributed by my father.

Please note that Native contribution in this analysis is being evaluated by a combination of geographies.  In some cases, one individual will show as “Native” meaning in the case of MDLP “North Amerindian” and the parent (or child) will show as something similar, like “Actic,” “South American” or “MesoAmerican.”  In order to normalize this, I have combined all of the geographies that are Native indicators.

MDLP

On the MDLP graph below, the legend indicates that these 4 regions are relevant to Native ancestry.

  • Army green – Mesoamerican
  • Lime Green – Arctic
  • Emerald – South American Indian
  • Grey – North Amerindian

Chromosome 1 – Native Segment

On the graph below, you can see that mother has more grey than I do from about 162-165, but then I have some grey that she does not at about 170.

step 7

A detailed analysis of the segment of chromosome 1 between 158-173 shows the following admixture:

On my results, the putty green, MesoAmerican, is scattered between about 158 and 173, in three segments.  The putty green in my mother’s segments are from 159-160.5 and then 167-170.5.  Therefore, my father, by inference has a segment from about 162-165 and from about 170.5 to 173.

My teal, North Siberian, ranges from 162-163 and from 168-171.  My mother carries no teal in these segments, so this is inferred to be contributed from my father.

My dark grey, North Amerind, ranged from 162-165.5 and then from 168-169.5.  My mother’s range is from 161-165.5.  Therefore my grey segment at 168-169.5 is either recognized as MesoAmerican or Arctic Amerind in my mother.

Chromosome 2 – Native Segment

step 7 - 1

Chromosome 2 is quite interesting.  You can see that on my chromosome, the North Siberian begins at about 80.  Mom has none at that location.  My North Amerind begins at about 95 and extends to 105, where Mom’s begins in the same location but then transitions to a large segment of MesoAmerican which I do not carry.  I do have MesoAmerican, but mine begins about where hers ends and extends to about 105.  Mom’s North Amerind ends about 101, while mine continues to about 105.  She looks to have trace amounts beginning about 105 and extending through 115.

Eurogenes

The next graph shows the same chromosomes using Eurogenes.  Regions relevant to Native ancestry include:

  • Red – South Asian
  • Brown – Southwest Asian
  • Yellow – North Amerindian and Arctic
  • Putty – Siberian
  • Emerald – East Asian

Chromosome 1 – Native Segment

step 7 - 2

The difference between my chromosome 1 and my mother’s in this region is quite pronounced.  My mother’s is drenched in beautiful red South Asian, while I have absolutely none.  Some of the area where I have North Amerindian shows as South Asian on hers, but in other areas, there is no correlation.  It is expected of course, that there are areas where she has some ancestry and I have none, due to the fact that I only inherit half of her DNA, but she has a significant segment of East Asian between 163 and 164, and I look to have received only a very small portion.  The same is true of her Siberian segments at 163-164, but then I have Siberian that she does not at 169-170 and she has some that I don’t at 160-161.5.  Some of this difference can likely be explained, especially between the yellow North Amerindian and the red South Asian by slight differences in the DNA read and how it is categorized, but in other cases, the difference is real.  Looking at mother’s red segments from about 166.5 to about 168 and then looking at my corresponding region, you can see that I have nothing that hints at Native.  In that region, I clearly inherited from my father as well as my mother’s North European.

Chromosome 2 – Native Segment

step 7 - 3

As different as our chromosomes 1 were, one wouldn’t expect chromosome 2 to be so similar.  In the graph, I included my large South Asian segment surrounding 80, where Mom has a trace, although that is beyond the area indicated as Native by 23andMe and Doug McDonald.  In the range of interest, beginning at about 80, we find nothing until about 94 where mother and I both have North Amerindian segments that stretch through about 105.  Mom’s goes slightly further than mine, to about 105.5.  It’s interesting to note that in part of this region, on either side of 101, her Siberian and my North Amerindian are the same shape at the same location, so obviously the same DNA is being read and categorized as two different regions, probably due to my father’s admixture.

Dodecad

On the Dodecad graph of the Native segment, you can see the Native colors are in shades of green.

  • Putty – West Asian
  • Yellow-green – South Asian
  • Emerald – Northeast Asian
  • Light Green – Southeast Asian

To use Dodecad in an equivalent manner as the rest of the tools, it looks like Northeast Asian is the closest we would get to Native American since that is where Native Americans lived just prior to crossing Beringia, so the greens should probably be evaluated as a group.  As can be seen on chromosome 1, they do clump together.  Even though West Asian is also found with this group, it seems to be outside the range, so I am not including it in the evaluation.

Chromosome 1 – Native Segment

You can see another example here of one segment being called South Asian in Mom’s and Northeast Asian in mine at about 170mb.

step 7-4

The Native, or in this case, Northeast Asian/Southeast Asian begins at about 162.5 where Mom’s and mine are very similar.  However, we diverge at about 164.5 where Mom begins with large segments of South Asian.  I have a little bit, but not much.  Beginning about 168, I have a large Northeast Asian segment, but she shows with South Asian there, although the segments are not exact.

Chromosome 2 – Native Segment

step 7 - 5

Chromsome 2 is quite simple using Dodecad.  Only two of the three groups appear.  Southeast Asian is absent, South Asian is present only in trace amounts except for one small area between 79.5 and 80 on my chromosome.  As expected, Northeast Asia is more prominent.  Mother has a few areas that I don’t, which is to be expected.

HarrappaWorld

Last, we have HarrappaWorld.  American and Beringian are the Native American categories here.  Regions relevant to Native American heritage would be:

  • Teal – American
  • Periwinkle – Beringian
  • Lime Green – Siberia
  • Emerald – Northeast Asia

Chromosome 1 – Native Segment

You can see both Beringian and American embedded again at about location 169.  In mine, this entire block reads as American.

step 7 - 6

There is one large chunk of Northeast Asian showing for both results, but part of that region of my chromosome, between 163-164 shows as American instead of Northeast Asian.  The Beringian is scattered through the American, which I would expect.  The American runs either strongly or weakly through this entire segment from 163 to 175 in mine or to 179 in mother’s.  Surprisingly there is no Siberian at all.  I would have expected to see Siberian before Northeast Asian.

Chromosome 2 – Native Segment

step 7 - 7

Where on chromosome 1, we saw no Siberian, on chromosome 2, we find Siberian instead of Northeast Asian.  I have no Beringian, but mother has 4 segments.  Three of her 4 segments are embedded with American segments.  Two may simply be categorized differently in my results, but two, I did not inherit.

Analysis Discussion

What have we learned?

When we are dealing with small amounts of minority admixture, they may or may not be able to be picked up directly by the testing companies.  Of course, part of this has to do with their thresholds for what is “real” and reportable, and what isn’t.  Aside from that, lack of identification of minority admixture probably has to do with which segments were inherited and their size, if they have been isolated and identified as Native by population geneticists, and the robustness of the data base sources the data is being compared against.

We can also see how difficult it is to sort through threshold matches, meaning what is Native, Asian, central Asian, etc.  Many of these differences are probably not actually differences between groups, but similarities with slight categorization differences.  Of course, it’s those differences we seek to identify our ancestral heritage.  Combining similar geographies may help reveal relationships masked my reporting and categorization differences.

Given that multiple sources have indicated Native ancestry, and on the same two chromosomes, I have no doubt that it exists.  Had any doubt remained, the exercises creating the MDLP Chromosome Map Table and reviewing the segments on chromosome 1 between 160 and 180mb would have removed any residual concerns.

The following table shows the results for the Native segments of chromosomes 1 and 2 beginning with the 23andMe and McDonald results, and adding the start and stop segments from each of the 4 admixture tools we used.

  Chromosome 1 Chromosome 2
23andMe

165,658,091 to 175,711,116

86,316,174 to 103,145,426

McDonald

165,000,000 to 180,000,000

90,000,000 to 105,000,000

MDLP

162,000,000 to 173,000,000

80,000,000 to 105,000,000

Eurogenes

162,500,000 to 171,500,000

79,000,000 to 105,000,000

Dodecad?

162,500,000 to 171,000,000

79,500,000 to 105,000,000

Harrappaworld

163,000,000 to 180,000,000

79,000,000 to 104,000,000

In Common

165,658,091 to 171,000,000

90,000,000 to 103,145,426

Although the start and end (or stop) segments vary a bit, all resources above confirm that the region on chromosome 1 between 165,658,091 and 171,000,000 is Native and on chromosome 2, between 90,000,000 and 103,145,426.  Those are the areas “in common” between all resources, which is shown in the last table entry.

The concept of “in common” is important, because while any one resource may report something differently, or not at all, when all or most of the resources report something the same way, it is less likely to be a fluke or reporting issue, and is much more likely to be real.  We’ll be using this methodology throughout the rest of the articles in “The Autosomal Me” series.

In the next segment, Part 8, we’ll be extracting the actual start and stop addresses of the Native only segments, referred to as the “Strong Native” method, and the combined Native indicator segments, referred to as the “Blended Asian” method and looking at how we can use those results.

______________________________________________________________

Disclosure

I receive a small contribution when you click on some of the links to vendors in my articles. This does NOT increase the price you pay but helps me to keep the lights on and this informational blog free for everyone. Please click on the links in the articles or to the vendors below if you are purchasing products or DNA testing.

Thank you so much.

DNA Purchases and Free Transfers

Genealogy Services

Genealogy Research

The Autosomal Me – DNA Analysis – Splitting Up

DNA Analysis purchased 1-24-2013

This is Part 6 of a multi-part series.

Part 1 was “The Autosomal Me – Unraveling Minority Admixture” and Part 2 was “The Autosomal Me – The Ancestors Speak.”  Part 1 discussed the technique we are going to use to unravel minority ancestry, and why it works.  Part two gave an example of the power of fragmented chromosomal mapping and the beauty of the results.

Part 3, “The Autosomal Me – Who Am I?,” reviewed using our pedigree charts to gauge expected results and how autosomal results are put into population buckets.  Part 4, “The Autosomal Me – Testing Company Results,” shows what to expect from all of the major testing companies, past and present, along with Dr. Doug McDonald’s analysis.  In Part 5, “The Autosomal Me – Rooting Around in the Weeds Using Third Party Tools,” we looked at 5 different third party tools and what they can tell us about our minority admixture that is not reported by the major testing companies because the segments are too small and fragmented.

In this segment, Part 6, “DNA Analysis – Splitting Up” we’re going to focus on specific aspects of those tools and begin our analysis of our minority ancestry.

Analysis.  Sounds like I’m climbing on the shrink’s couch.  But I’m not, I’m saving all my dollars for DNA kits!  Besides, I don’t want to stop!  This analysis, we’ll do by putting several pieces of data together and sorting the wheat from the chaff.  And yes, we’ll be splitting up…well…splitting our DNA up into pieces contributed by our father and mother.

Let’s start with looking at the DNA segments that mother and I share that are Native.

According to Doug McDonald, we have significant Native matches on chromosomes 1 and 2, with third party tools confirm that finding.  Unfortunately, the only company where Mom’s DNA resides is Family Tree DNA whose test did not reveal the Native ancestry.  23andMe did confirm Native segments in my DNA in those locations.

I’ve used several third party tools at GedMatch to see where Mom and I both have Native heritage, where she has it and I don’t, and equally as important, where I have it and she doesn’t?  What is that so important?  Simple, it means my father had Native heritage too, and tells me on which chromosomes his Native DNA is located  This could, when matching people in the future, on particular segments, help to isolate who our common Native ancestor was, or at least which line.  That is the ultimate goal we are working towards with this entire process.

In this case, to identify my father’s Native lines, if Mom and I neither or both have Native markers at a particular chromosome location, the values are irrelevant, because the Native lineage came from mother.  I did notice in a few cases that I had more than mother, and of course, in that situation, it means that my father contributed some too, or my mother had a misread in that region or a categorization issue exists.  For that reason, I am looking for patterns, not single instances.  We’ll discuss using patterns in a future segment.

Using the MDLP chromosome mapping tool, as MDLP appears to be the most comprehensive, I created a spreadsheet using my results as a base.  I then added mother’s values in the spaces where I had no values, and then I highlighted my results in the locations where mother had no value.  The essence of this is that the red, bold, underscore values mean Mom had a Native result here, but I didn’t receive it.  A yellow highlighted cell means I got the entire amount from my father, because my mother has no percentage showing.  In other cases, of course, it’s possible that both mother and father contributed Native ancestry on some adjacent chromosome segments.  The MDLP mapping tool with my additions is shown below for chromosomes one through eight.  Chromosomes 9-22 are similar, but the chart is too big to display as a whole.  This provides an example of how to do this analysis with your own results.

MDLP Chromosome Map Table

The results were very interesting.

My two primary regions, North-East-Europe and Atlantic-Mediterranean-Neolithic, were represented on every chromosome for both my mother and myself.  No surprises there.  The other regions would be considered minority admixture.

In 2 categories, North-European-Mesolithic and East Siberian, only my father contributed genetic material on some chromosomes and there were no chromosomes where my mother alone contributed.

In 1 category, Melanesia, only my mother contributed genetic material on some chromosomes and there were no chromosomes where my father alone contributed.

In all other categories, both parents contributed on some chromosomes where the other didn’t.  This is important, because it will allow me to associate a match with a particular segment of a chromosome on a particular parent’s side with Native ancestry.

In the minority categories for Native American, Mesoamerican, Arctic-Amerind, South America Amerind and North Amerind, grouped together, both parents contributed on some chromosomes where the other didn’t, and in two categories, on 3 chromosomes, I carry more than my mother, indicating an additional contribution from my father.

This is a repeated occurrence, with Native ancestry for my parents and I combined showing on a total of 42 chromosome locations across 4 geographic/ethnic categories, and in at least three cases, both parents contributed.

In the African categories, South African, Sub-Saharan and Pygmy, I had contributions from both parents on a combined total of 18 chromosome segments.  The African admixture, in total, was less than the Native, and they are assuredly below 5% combined.  If they were present at higher levels, I wouldn’t need to go through these genetic gyrations to prove or disprove the heritage and which parent contributed, because it would be evident in the testing results of all companies.

In our next segment, Step 7, we will be further scrutinizing Chromosomes 1 and 2 for additional information about Native heritage and assigning specific Native segments that I carry on various chromosomes  to either my mother or father’s lineage.

______________________________________________________________

Disclosure

I receive a small contribution when you click on some of the links to vendors in my articles. This does NOT increase the price you pay but helps me to keep the lights on and this informational blog free for everyone. Please click on the links in the articles or to the vendors below if you are purchasing products or DNA testing.

Thank you so much.

DNA Purchases and Free Transfers

Genealogy Services

Genealogy Research

Personal Genetics – Coming out of the Closet – Ostriches, Eagles and Fear

Ostrich

While most of the people subscribing to this blog are here because of genetic genealogy, genetic genealogy is only one piece of the picture of the future of personal genetics.  Ironically, it’s genetic genealogy that gave low cost genetics a push into the mainstream, some 7 or 8 years before 23andMe, the first personal health genetics company, launched in 2006.

This week, the magazine, ieee Spectrum, of all places, has an absolutely wonderful article, The Gene Machine and Me, about the future of personal genetics.  Many of these types of articles are sensationalized and full of what I call “fear-mongering,” but this one is not only excellently written, it’s accurate and interesting – a triple hitter home run as far as I’m concerned.

I’d like to talk for just a minute or two about the high points in this article, about this emerging technology, what it means to us and about fear.  I’ll be sharing my personal journey down this path.

For those who would like to know how next-generation technology works – by the way – that’s the chip technology employed by Family Tree DNA for the Family Finder product, 23andMe for all of their testing and the National Geographic Geno 2.0 project – this article has a very educational description that is understandable by regular air-breathing humans.  The next-next generation sequencing, discussed here and offered shortly by Ion Torrent, will certainly revolutionize personal genetics much as the Illlumina genotyping chip technology has today.

The benefit of full genomic and exome sequencing, the new technology on the horizon for consumers, is in the information it will tell us about ourselves.  And I’m not referring to genealogy here, although that assuredly will be a big beneficiary of this new world of personal genetics.  For genealogists, there is mention of soon-to-be capabilities of sequencing from one single molecule of DNA.  For those of us with hair brushes and toothbrushes that we’ve been jealously guarding for years now, waiting for the technology to improve to the point where we can obtain the DNA of our dearly departed loved ones, this is going to be our ticket.  As excited as I am about that, that’s not the potential I’m talking about.  I’m talking about information about our own bodies and the potential future foretold in those genes.  Notice the word potential.

The information in our genes is seldom a death sentence.  In rare cases, it is, such as Huntington’s Disease.  If this disease runs in your family, you already know it and testing should be done in conjunction with genetic and/or medical counseling.  For these people, DNA testing will either confirm that they carry that gene, or relieve their mind that they do not.

For the vast majority of us, the information held in our genes it much less dire.  In fact, it’s a good news message, as it will provide us ample warning, an opportunity, to do something differently with our lives to prevent what might otherwise occur.  So it’s not a death sentence, more of a life sentence.  For me, it was an epiphany.  Yes, I took positive action and made dramatic life changes as a result of my DNA test results.  In essence, this is my “coming out” story.

I was one of the first people to order the new 23andMe test when it was first offered, mostly for the genealogy aspect, but as you know, it includes health traits and information.  When I received the results of that test a few years ago, in black and white, where I could not possibly ignore them, the reports indicated that I was at elevated risk for certain conditions.  Those conditions were certainly beginning to manifest themselves in my life.  I was on medication for two of them.  My weight, at the time, was certainly a contributing factor to the development of those conditions.  My sister had died near the age I am now as a result of those conditions.  She looked like me, was built like me, was heavy like me, and very probably carried those exact same genetic risk factors.  Our grandfather died of the same thing about the same age.  Our father had it too, but he died in a car accident – caused by a coronary episode, at age 61.  Seeing this, in black and white, and knowing my family history, I decided to do something to prevent that future, or at least to delay or mitigate it as much as possible.

I lost over 100 pounds and yes, for almost 5 years now, I’ve maintained that weight loss, well except for a pesky 10 or 15 pounds that I fight with regularly.  But still, the 100 pound loss is far more important than the 10-15 pounds I battle with.  I am off of all medication related to those and related conditions.  I’ve changed what and how I eat, and a benefit I really didn’t anticipate is how much better I feel.  You have no idea how much I hate these old pictures of me when I was heavy.  This was taken at National Geographic Headquarters in Washington DC, in 2005, at our DNA Conference.

Me Nat Geo 2005

This next photo is me at one of our Lost Colony archaeology digs about five years later wearing one of my favorite t-shirts that says “Well Behaved Women Seldom Make History.”  All of the genealogists should be laughing about now.  No one wants well-behaved women because you can’t find them in the records.  If my clothes look a bit large, that’s because they are, but that t-shirt was too small before the weight loss.  I could never have done the physical work on those digs, or survived the heat, before losing the weight and going from a size 22 to a 12 in the photo below.  These kinds of activities were all unforeseen benefits of the weight loss.  My sister’s untimely death was not wasted on me, but served as a warning bell, well, more of an unrelenting siren actually, when I saw those DNA results.

???????????????????????????????

I also took my 23andMe results, at least some of them, the ones related to the conditions I was dealing with, to my physician.  I really had to think long and hard about this.  So now, let’s talk about the fear part of the equation.

Fear of genetic results falls pretty much into two categories.  We’ll call these the Ostriches and the Eagles.

My brother was an Ostrich.  Yep, he was, head right in the sand.  He had cancer, his wife had cancer, twice, his daughter, in her 30s, had cancer, yet their decision when offered free DNA testing was to decline – because they didn’t want to know.  Fear of the information itself, fear of knowing, perhaps spurred because of a sense of fate – nothing we can do about it so why know about it.  He also refused to discuss it, so I really can’t tell you why, and he died, of cancer, last year, so that opportunity is past.  Personally, I think knowing about a genetic proclivity would equate to more vigilant monitoring.  And knowing the proclivity didn’t exist would set one’s mind at ease.  I would think you would be a winner either way, but my thinking and his were obviously quite different.

The other group are the Eagles.  They are vigilant and acutely aware of the fact that health based discrimination does exist.  It has been worse in the past than it is now.  This is the reason I had to think long and hard about taking any of my results to my physician.  Once in your medical record, it’s permanent.

Today, GINA, the Genetics Information Nondiscrimination Act, goes a long way to protecting people, especially in an employment situation, but it does not cover everything.

Anyone who has ever tried to obtain health care insurance individually or through a small business knows all too painfully about pre-existing condition exclusions.  Well, the good news is that ObamaCare, love it or hate it, levels that playing field for the “rest of us,” those who either were denied or had to make life and employment decisions based on whether or not they had insurance coverage through a group where discrimination related to pre-existing conditions didn’t exist.

The other good news is that you don’t have to take any of your DNA test results to your doctor.  It’s entirely up to you.  You can test anonymously, using an alias, if you’re really paranoid.  Your results through personal genetic testing are yours and for no one else to see unless you disclose them.

Lastly, let’s talk realistically about the types of insurance that still discriminate – which would be life insurance, extended care insurance, etc.  They are in the business of odds-making.  They are betting you will live and you are betting you will die sooner than later.  As you age, the odds shift, cause let’s face it, eventually, you will die – and they will have to pay out.  Now the only way they can make money is if you pay more premiums during your life than they have to pay out in the end, or they make the premiums so expensive you stop paying, letting the policy lapse, before you die, so they never have to pay.  Of course, if they think the odds are stacked too far in your favor, they simply won’t insure you.  So, if you or your family members have Huntington’s Disease, you’re not likely to be able to get life insurance outside of a group policy, with or without a genetic test.  In fact, there is a questionnaire about your family history when you apply for individual life insurance.

I bought individual life insurance about 10 years ago.  They sent a nurse to the house to draw my blood.  They wanted chain of custody, to know the blood sample was mine, which is not the case with personal DNA testing.  I had to provide ID.  If the insurance company wanted to run a DNA test, prohibitively expensive then, but not in the next few years, they certainly could do so.  Let’s just say it plain and simple – everyone has pre-existing genetic proclivities to something – no one is immune.  These results are not generally black or white either, but expressed as a range.  For example, 4.2 European women out of 100 will develop Restless Leg Syndrome in thier lifetime.  My risk is 5.2, so slightly elevated above the average.  I’m only “above average” in 5 areas, and below average in most.  And the insurance companies are still going to be in the odds-making business – they can’t deny everyone or they won’t have any business – and they will use this new tool as soon as it becomes economically viable.  There is no escaping it.

So yes, the Eagles are right to watch vigilantly – but for now – how much you share and with whom is entirely in your control, so you don’t need to be an Ostrich either.  There is a great deal of good that can come from personal genetic testing, in addition to genetic genealogy.  Knowledge is power.

So now, if you haven’t already, read this great article, The Gene Machine and Me!!!

______________________________________________________________

Disclosure

I receive a small contribution when you click on some of the links to vendors in my articles. This does NOT increase the price you pay but helps me to keep the lights on and this informational blog free for everyone. Please click on the links in the articles or to the vendors below if you are purchasing products or DNA testing.

Thank you so much.

DNA Purchases and Free Transfers

Genealogy Services

Genealogy Research

The Autosomal Me – Rooting Around in the Weeds Using Third Party Tools

This is Part 5 of a series.

Part 1 was “The Autosomal Me – Unraveling Minority Admixture” and Part 2 was “The Autosomal Me – The Ancestors Speak.”  Part 1 discussed the technique we are going to use to unravel minority ancestry, and why it works.  Part two gave an example of the power of fragmented chromosomal mapping and the beauty of the results.  Part 3, “The Autosomal Me – Who Am I?,” reviewed using our pedigree charts to gauge expected results and how autosomal results are put into population buckets.  Part 4, “The Autosomal Me – Testing Company Results,” shows what to expect from all of the major testing companies, past and present, along with Dr. Doug McDonald’s analysis.

In this segment, Part 5, we’re going to look at various third party tools and what they can do for our search for minority admixture.  We will use the download files from either 23andMe and Family Tree DNA and utilize third party tools to analyze the raw data.  We’ll see how third party developers put those puzzle pieces together, if the results are consistent and what they tell us.

The Weeds

When dealing with testing companies, particularly any individual source (as opposed to multiple testing company results, as I have done), minority admixture, especially less than 1% may not be successfully recognized.  One percent equates to between 6 and 7 generations or about to the 1800 threshold in time.  However the history of both African and Native admixture in colonial America goes back another 200 years to the Jamestown era.

The social history in the US means that there are many people looking for this admixed heritage as long ago as 1609 when Jamestown was established and the first European/Native marriages took place (although there were “blonde Indians” reported by Jamestown settlers).  In round numbers, that’s about 400 years or between 13 and 16 generations.  Of course, a minority ancestor drops below the 1% threshold between 7 and 8 generations (with the first generation being the person tested) and by the time you get to the 12th generation, you’re at .048%.  At this level, Bennett Greenspan says we’re “rooting around in the weeds,” and he’s right.

However, rooting around in the weeds for those dreaded IBS (Identical by State) segments in genealogy is exactly what we need when looking for small amounts of minority admixture.  What’s an IBS segment you ask?  It’s a segment that is typically too small to be counted as an IBD, or identical by descent, segment.  IBS means that you’re from a common population if you match someone with a very small segment, not necessarily that you share a common ancestor within the past several generations.  But how to you tell if a small segment is IBS or IBD?

There is no absolute line in the sand, but often segments smaller than 7cM (centimorgans) or 700 SNPS (some say 5cM and 500 SNPs) fall into the IBS category.  This has caused some researchers to discard all segments of this size because they can’t tell the difference.  That’s unfortunate, because clearly some of these segments are IBD and the IBS segments can be useful too.

When looking for minority admixture in two people, both of them having these small segments in the same location can provide meaningful information, and can confirm minority heritage.  Said another way, if two people have less than 1% Native heritage, both share a common ancestor, and both carry part of their “less than 1%” on the same segment….one might say it’s not likely to be coincidence.  Identifying the common segments of your common ancestor can lead to identifying the specific family line those segments came from, especially if you match others as well.  This is in essence what Minority Admixture Mapping, or MAP, does.  It uses these techniques to look for patterns in these small fragmented pieces that, when taken together, indicate minority heritage.  Having said that, some IBS segments will indeed, be simply that, because you share the same base population, but some will be IBD, or more current in time.  With the MAP technique, we’re sorting through ways to utilize these small segments, whether they are IBS or IBD.

Using the tools, MDLP, Eurogenes, Dodecad and HarrappaWorld at GedMatch allows us to “root around in the weeds,” to quote Bennett, and find those all-important small IBS/IBD segments that connect us to a particular ethnicity and ultimately, to other relatives who carry these same segments in the same locations.

In general, using these this type of DNA is called BGA, or Biogeographical Ancestry where we use SNPs of autosomal DNA called AIMs, Ancestry Informative Markers.  A SNP is a Single Nucleotide Polymorphism, or a mutation that happened in one specific location on a gene.  AIMs are generally SNPs, not clusters of markers, found at different frequencies in different populations.  We combine all we know about them scientifically with information about population frequencies and then draw inferences about where our ancestors came from based on that information.  So a SNP that is useful in determining ancestry is called an AIM.

These SNPs, or AIMs, are the foundation for these BGA tools that we will be using to sort through small segments of minority admixture.  So this is a building block process.  Scientists identify SNPs found in different populations at different frequencies and identify them as such, then scientists and genetic genealogists create BGA tools that use and combine SNPs/AIMs to suggest populations and ethnicities for those who carry them.  Using these tools, majority ancestry is easy to discern.  We’re going to use those tools to look at groups of SNPs/AIMs clustered in small, fragmented IBS or IBD segments to do Minority Admixture Mapping (MAP) to confirm our minority admixture and to identify our minority admixed lines, families and perhaps even (in time) our original minority ancestor.

I bet you thought I couldn’t fit all of those acronyms in one paragraph, but I did:)  It is a bit like alphabet soup, but when you understand that this is a building process, it’s much easier to grasp as a whole.

Having at least one parents DNA makes this process much easier, because you can immediately tell if your other parent, by inferrence or process of elimination, has contributed any of the minority ancestry, or if it’s all on one side of the tree.  Of course, that’s assuming your parents aren’t related to each other.  There’s a test for that too at GedMatch.  If you don’t have one parent available, you can “make do” with aunts, uncles and cousins, but it’s a much more tedious process.

Third Party Tools

To use any of these BGA tools, you’ll need to download your results from either 23andMe, Family Tree DNA or National Geographic.  Currently at GedMatch, the only supported formats are 23andMe or Family Tree DNA, because the National Geographic test is so new.  I used my Family Finder (Illumina Build 36) raw data file.

To download your results from 23andMe, sign on to your account, then click on this link and it will take you to the area to download your results.

https://www.23andme.com/you/explorer/

Save the file and do not open it as the act of opening it sometimes causes corruption and you will have a hard time uploading the file.  If the upload fails, download a new copy and start over.  If you have an older copy on your computer, it’s always a good idea to use a fresh copy to incorporate any changes made by the vendor since your last file download.

To download your results from Family Tree DNA, sign on to your personal page, click on the Family Finder tab and then on “Download Raw Data.”  As I write this, Family Tree DNA is in the midst of a conversion from Build 36 to Build 37 for their autosomal files (in order to facilitate the integration of 23andMe results), so you may need to be a bit patient while this process completes.  Files may not be available for download at some points.  You certainly don’t want to mix comparisons, meaning using one build 36 and one build 37 file for comparison.

If you’re following this process yourself with your own data, please read all the way through this posting before starting your own processing.

Now, let’s look at the third party tools.

Stanford University

This tool is available at Stanford University.  Scientists have collaborated to provide this service and I think it’s quite interesting.  This tool is not compatible with any browser except Chrome and it requires a download of your autosomal data in a .txt file.  If it can’t load your file, the loading task simply never completes.  For me, that meant it wasn’t a .txt file I was trying to load.

http://esquilax.stanford.edu/

Load your file and choose Ancestry, then Paintings, then Hap Map 3 (experimental), then Paint my Chromosomes.

weeds 1

Their legend, above, translates to the regions, below.

ASW – African ancestry in Southwest USA

CHD – Chinese in Metropolitan Denver, Colorado

GIH – Gujarati Indians in Houston, Texas

LWK – Luhya in Webuye, Kenya

MEX – Mexican Ancestry in Los Angeles

TSI – Toscani in Italia

weeds2

Unfortunately, this isn’t terribly useful.  Hap Map 3 utilizes additional regions, including Utah, but this tool doesn’t seem to be mapping them, so my closest match region is Italy, which is midleading since none of my family was from Italy.  Hap Map 2 is also an option which does include the Utah population, but it’s not as up to date otherwise as Hap Map 3.

David Pike has figured out how to tweak these settings some.  You can read about it at this link:  https://www.23andme.com/you/community/thread/8062/.  David’s posting on June 20th shows what he did.  However, compared to the other tools available, I find this a poor choice and did not spend a lot of time trying to work with it.

However, a second feature that they provide is fun.

Stanford provides a Neanderthal tool that’s a little different than the Nat Geo or 23andMe ones.  Click on Explore, Neanderthal, Look Up Exercise.  Then enter your primary ethnicity and click on Look Up Exercise again.

Of a possible 84 Neanderthal alleles, I have 9, partially displayed below.

weeds3

GedMatch

www.Gedmatch.com is a complimentary (voluntary contribution) site created by two genetic genealogists that includes several autosomal analysis tools.  One of the areas of this site is “Admix Tools.”  On that page one finds several private or proprietary tools, some written by genetic genealogists, some by researchers, and all free.  Let’s take a look at each one and their results.  If you want to see any of the results more closely than the photos here allow, you can run each of the comparisons using kit F6656 (mine) as the first kit and kit F9141 (my mother) as the second kit.

Each of these tools offers the same functionality, as follows.

weeds 4

We will be utilizing 4 of these functions for each tool.

  • Admixture Proportions
  • Admixture Proportions by Chromosome
  • Chromosome Painting
  • Paint Differences between 2 kits, 1 chromosome

We select from the tools as follows:

weeds 5

Let’s take a look at what the tools provide.

MDLP World 22

The MDLP software is sponsored by two genetic genealogists.  You can read more about the project at http://magnusducatus.blogspot.com/ and http://magnusducatus.blogspot.com/2012/09/behind-curtains-mdlp-world-22-showcase.html.

weeds 6

MDLP shows several populations.  I was interested to see if my mother also shared the African percentage.  Interestingly, mother does have a South African segment, but it’s .12, so less than mine.  Therefore, I would have obtained part of my African heritage from my father.  She also has three different categories of Native American heritage, compared to my one.  She carried a total of 1.92% and I carry .58%.  Otherwise, our results are very similar.

weeds 7

The next feature is ethnicity mapping by chromosome.  While the display is too large to see well it’s interesting to note that indeed, both Native American and African were detected on several chromosomes, not just on chromosomes 1 and 2 as reported by 23andMe and Dr. McDonald.  Note that DeCode Genetics showed “East Asian” admixture on several chromosomes.

weeds 8

Here’s a portion of the above chart that you can actually see.  The highlighted blue regions are your major ethnic regions.

weeds 9

Another feature is chromosome painting, shown below.  This shows the first part of my chromosomes 1 and 2 painted by ethnic/regional breakdown.  The legend for each tool is different and above their graph.

weeds 10

weeds 11

These tools also provide the ability to compare one chromosome between two people.  On the graph below, my chromosome 1 is on the top, and my mother’s is second, with the third band being our common painting.  The black represents non-shared regions, meaning those contributed to me by my father.  Unfortunately, North American Native American is dark grey, sometimes difficult to distinguish from black.

weeds 12

The graph below shows that while I do share a large piece of Chromosome 1’s Native region (about 160-180mb) with my mother, there are also segments, 169-170 for example, where I have Native genes that she does not, indicating Native heritage in this location from my father’s side.

weeds 13

Eurogenes K9

Eurogenes was created by another genetic genealogist.  You can read more about it at http://bga101.blogspot.com.au/2012/04/eurogenes-admixture-utilities-at.html.

weeds 14

Eurogenes calls me primarily North European with .67 Native American and no African in the percentages above, but below, on the individual chromosomes, some African does show, although not on as many chromosomes as MDLP.

weeds 15

In the charts above and below, you can see that Eurogenes detected small amounts of African along with Native American.

weeds 16

weeds 17

Notice that at about 10mb on chromosome 1, on the graph below in the top band, that the North American Indian (yellow) and the South Asian (red) are imbedded with each other.  These appear again together at the beginning of chromosome 2, shown as the second band.  This hints at how and why it’s sometimes so difficult to determine and filter Native American from Asian.  There is no line in the sand, there is a continuum between populations, the only differentiator being 10,000 to 15,000 years spent apart in which time, they, hopefully, developed enough differentiating mutations that we can tell them apart.

weeds 18

On the chart below, the top band shows the chromosome painting of my chromosome, and the second band shows the chromosome 1 Native American segment (about 160-180 mb) of my mother with the third band showing both matching and non-matching regions, painted black.  Looking at the segment of chromosome 1, in the graph below, characerized as Native, we can see in mine, top row, that this is categorized as Native American (yellow), but some of the same regions below, in Moms are categorized as South Asian (red), causing a technical non-match, when in reality, It’s likely a categorization issue, not a genetic mismatch.  In future analysis, we’ll be using two methods of comparison, one called “Strong Native” that only matches Native to Native and another, the “Blended Asian” method that allows for grouping of similar ancestral types that together likely indicate a Native heritage.

weeds 19

Dodecad V3

Dodecad was created by an anthropologist.  You can read more about it at http://dodecad.blogspot.com/ and http://dodecad.blogspot.com/2011/06/design-of-dodecad-v3.html.

weeds 20

Dodecad, unfortunately, does not subdivide into Native American, so the Native will show here as some form of Asian.  Northwest Africa shows in the percentages above, but more detailed African heritage shows in the chromosome detail below in regions not shown above.

weeds 21

weeds 22

weeds 23

weeds 24

Above, my chromosome painting for the first part of chromosomes 1 and 2.

Below, the comparison showing the Native segments from about 160-180mb.   My Native segment (top) compared to mother’s (middle) with the comparison of the two on the bottom for chromosome 1.

weeds 25

HarappaWorld

HarappaWorld divides results into fewer population groups and is focused on Asia.  You can read more about it at http://www.harappadna.org/2012/05/diy-harappaworld/.

weeds 26

In HarrappaWorld, Beringian and American appear to be equivalent to Native American.  Like Dodecad and Eurogenes, African does not show in the total percentages, but does on the individual chromosome analysis, although in smaller percentages with this application.

weeds 27

weeds 28

weeds 29

Chromosome painting of my chromosomes 1 and 2 are shown below.

weeds 30

The graphs below show the Native region comparison of chromosome 1 between me, top row, mother, middle row, and the third graph showing the common areas, with black representing areas where there is no match.

weeds 31

For each of these tools and their results, we’ll do further analysis in a future segment of this series.

Tools Summary

Now that we’ve looked at these individual tools,  and building on the Test Results Chart created in Parts 3 and 4, let’s compare and see what information these tools add.

Test Results Chart Including Third Party Tools

Test/Company European Asian Native African Unknown
Pedigree Analysis

75%

0

~1%

0

24%

Testing Companies
Family Tree   DNA – Original

100%[1]

0

0

0

deCodeme

92%

5%

Inferred[2]

3%

deCodeme –   X

91%

6%

Inferred

3%

Dr.   McDonald

97-99%

1-3%

0.5%

0

23andMe –   Original

99%

1%

Inferred[3]

0

0

23andMe –   2012 – Standard

99.2%[4]

0

.5%

0

.3%

23andMe –   2012 – Conservative

98.7%[5]

0

.3%

0

1%

23andMe –   2012 – Speculative

99.3%[6]

0

.5%

0

.2%

Family Tree   DNA – 2012

100%[7]

Geno 2.0

79%[8]

18%

0

0

0

Ancestry

92%[9]

0

0

0

8%

Third Party Tools
MDLP

86.68%

12.55%

.58%

.17%

0

Eurogenes

94.83%

4.5%

.67%

0

0

Dodecad

85.47%

13.43%

Inferred

1.09%

0

HarrappaWorld

86.56%

12.80%

.65%

0

0

Of the various chromosomes, the breakdown is as follows. Dodecad does not break the categories in a comparable fashion to these other 3 tools, so their results are omitted in the following chart.  Please note that how geographies are categorized can make a significant difference.

Minority by Chromosome Chart

Tool/Chr MDLP Native Eurogenes Native Harrappa Native MDLP African Eurogenes African Harrappa African
1 Y Y Y N N N
2 Y Y Y Y Y N
3 N N N Y Y N
4 Y N Y N N N
5 N N N N N N
6 Y Y Y Y N N
7 N N Y N N N
8 Y Y Y Y N Y
9 Y N N Y N N
10 Y N N Y N N
11 Y N Y Y N N
12 Y N Y N N N
13 Y N Y N N N
14 Y Y Y Y N N
15 Y N N N N Y
16 Y Y Y Y N N
17 Y Y Y N N N
18 N N N N N N
19 Y Y Y Y N N
20 Y Y Y Y N N
21 Y N Y N N N
22 N N N Y Y N

From these various tools, it’s obvious that I do have some Native admixture, probably about 1%, and it’s from both parents.  I also have some African, but it looks to be an even smaller proportion that Native American.

Join me for Part 6 of this series, where we look at how to analyze and use this information.


[1] 71.5% western European, 28.4% Northeastern European

[2] Inferred that Asian is actually Native in an American with no history of Asian ancestry.

[3] No category, inferred.

[4] 78.6% Northern European, 1.8% Southern European, 18.7% Nonspecific European

[5] 54.6% Northern European, .3% Southern European, 43% Nonspecific European

[6] 91.7% Northern European, 3% Southern European, 3.3% Nonspecific European

[7] 75.18% West Europe (French and Orcadian), 24.82 Europe (Romanian, Russian, Tuscan and Finnish).  Note that my mother’s results are almost identical except the Finnish is missing from hers.

[8] 43% North Europe and 36% Mediterranean

[9] 80% British, 12% Scandinavian

______________________________________________________________

Disclosure

I receive a small contribution when you click on some of the links to vendors in my articles. This does NOT increase the price you pay but helps me to keep the lights on and this informational blog free for everyone. Please click on the links in the articles or to the vendors below if you are purchasing products or DNA testing.

Thank you so much.

DNA Purchases and Free Transfers

Genealogy Services

Genealogy Research

The Autosomal Me – Testing Company Results

This is Part 4 of a multi-part series, The Autosomal Me.

Part 1 was “The Autosomal Me – Unraveling Minority Admixture” and Part 2 was “The Autosomal Me – The Ancestors Speak.”  Part 1 discussed the technique we are going to use to unravel minority ancestry, and why it works.  Part 2 gave an example of the power of fragmented chromosomal mapping and the raw beauty of the results.  Part 3, “The Autosomal Me – Who Am I?,” discussed how to use our pedigree charts to gauge expected results and how autosomal results are grouped into population buckets.  We also named this technique, Minority Admixture Mapping, or MAP for short.

In this segment, Part 4, let’s take a look at what the testing company autosomal results look like.  The results are presented in timeline order, with the oldest results first and the latest, and presumably most accurate results, last.

23andMe Version 1

23andMe was the first company to offer this type of testing affordably.  They initially only offered 3 population groups, and one inferred that Asian was actually Native American.  Of course, that wasn’t a valid assumption for everyone, but it was the best that could be done under the circumstances.  This was my ethnicity results display at 23andMe until December 2012 went their updated version was released.

Autosomal test 1

DeCode Genetics

DeCode Genetics initially offered autosomal tests for ancestry.  Unfortunately, under the pressure of financial issues, they stepped away from the genetic genealogy marketspace and have since been sold.

Their test showed the following ethnic breakdown, picking up both my Native and African heritage:

autosomal test 2

I particularly like these results because the X chromosome is included, and seeing Native on the X chromosome, which has a unique inheritance path is a very important piece of data.

Family Tree DNA Version 1

Family Tree DNA’s first version of their Family Finder product produced results stating that I am 100% European, split between western and northern, shown below (minus the map.)

autosomal test 3

Dr. Doug McDonald

Doug McDonald, a retired physical chemistry professor, compiles contributed raw data and compares the raw data locations with both reference populations and the contributor results.  This is not a commercial endeavor but a private research project which has been ongoing for years.  His analysis of my raw data results from 23andMe and Family Tree DNA showed that they are primarily European.  His first analysis was without Middle Eastern populations and the results showed European except for a total of about 3% East Asian, Oceana and American.   However, in a second run including the Pakistan and Middle Eastern populations, the results now showed 88% European, about 1% Oceanic and American and the balance Middle Eastern and Pakistani.

A small amount of Middle Eastern heritage is not unexpected since I do have confirmed Turkish ancestors.

Dr. McDonald indicated that this was slightly more, 1-2%, than most Europeans, and that I was generally planted firmly in the middle of the “English” area in his data.  His results showed no African.

Standard deviation (statistical noise) is about 1%.  He can achieve these low deviation numbers by using such a large number of markers (536,904 to be exact)[1] for his comparison.  I am grateful to Dr. McDonald for his contribution, not only to me, but to this field.

The graph below shows that my primary ancestry falls in the English/French region.

autosomal test 4

The second graph maps these results on my chromosomes. The American, bright green, is found on chromosomes 1 and 2, and the X chromosome shows South Asian.

autosomal test 5

Doug indicates that the Native American is found at about the .5% level.  Interestingly, on my mother’s graphs and charts (below), the Native segments are nearly identical, but my first grey South Asian segment on my X is Mideast on her chart.

autosomal test 6

It’s also interesting to note that my Native American on chromosome 2 is larger than my mother’s which may well reflect Native heritage on my father’s side.  Ironically, the oral history of Native ancestry was on my father’s side, not my mothers.

Doug’s analysis has been updated several times over the years and these results are the most current.  The vendors have made upgrades too.  In 2012, both 23andMe and Family Tree DNA underwent upgrades to their ethnicity software and the Genographic Project version 2.0 test was released.

23andMe 2012 Updated Version

The new 23andMe software offers different confidence levels.

The standard estimate, or confidence level, shows that I have about .5% Native American.  This is consistent with Dr. McDonald’s findings.

autosomal test 7

A second view is available which paints the chromosomes.  A split view is also available if one of your parents has been tested at 23andMe as well.  That is not an option for me.

autosomal test 8

The conservative estimate, below, shows less Native at .2%.

autosomal test 9

The speculative level below shows the Native back to .5% but adjusts the European regions significantly.

autosomal test 10

Although 23andMe does not provide participants with the start and stop locations, through alternative means, meaning a very smart friend, Rebekah Canada, who is a Java programmer, start and stop locations can be discerned.

CeCe Moore documented Rebekah’s technique for those who will be following along with their own results through this process.

In a future segment of this series, we’ll look at alternative ways to discern Native segments.  Thanks to Rebekah’s technique, I can tell you that 23andMe shows my Native segments as follows:

Chromosome 1 – 165,658,091 to 175,711,116

Chromosome 2 – 86,316,174 to103,145,426

23andMe also provides a Neanderthal percentage.  What fun!!!

autosomal test 11

Family Tree DNA Updated 2012 Version

My mother was deceased before chip based autosomal testing was available, but I ordered the Family Finder test for her as soon as it was available.  Thankfully her DNA was stored at Family Tree DNA and was still viable.

autosomal test 12

Mother’s original results are shown above and her most recent results are shown below.  Her results shifted within Europe and her margin of error doubled.

autosomal test 13

My current results from Family Tree DNA’s updated software are shown below.

 autosomal test 14

National Geographic Genographic 2.0

I was very surprised to see my National Geographic results.  They were very unexpected, in particular the high percentages of Mediterranean and Southwest Asian, totaling 54%.

autosomal test 15

It made more sense when I read the information.  It’s true, reading is fundamental.

autosomal test 16

These results are, in essence, more anthropological in nature.

autosomal test 17

autosomal test 18

Of course, one of the fun parts of the Genographic results are the Neanderthal and Denisovan percentages.

autosomal test 19

These are somewhat different than the 23andMe results, although if you add the Neanderthal and Denisovan values together, the resultant 2.2% is very close to 23andMe’s 2.5%.

Ancestry.com

In 2012, Ancestry introduced an autosomal DNA test as well.  What it provides is very limited, with limited tools, but it does provide percentages of ethnicity in addition to matches.  Recently, Ancestry announced that the percentages may change over time.  They have been severely beaten within the genetic genealogy community for quality issues with this product, including percentages of ethnicity that are highly erroneous.  Their stated time reference is 500 years ago.

Recently this new page was added before you can see your detailed results.

autosomal test 20

Ancestry shows my heritage as only British and Scandinavian.

autosomal test 21

Ironically, Ancestry has mapped the birth locations of my ancestors in Europe on the map above, based on my family tree submitted.  Interesting that Germany doesn’t show in Ancestry’s ethnicity list but many of my family lines originated in Germany and Holland, and none in Scandinavia.

Testing Provider Summary

Where do we stand now?

A summary of the various test results is shown below compared to my pedigree analysis.

Test Results Chart

autosomal test 22

I have included Dr. McDonald’s analysis here, not because he’s a testing provider in the sense of the testing companies, but because his offering was available in this timeframe, and because he worked with Family Tree DNA to develop their Population Finder code.

You can see that the results are relatively consistent between testing companies.  There is certainly no question about majority ancestry, but the minority admixture which hovers someplace near 1%, give or take 5% in either direction, is much less consistent and not always reported.  If I were to have tested with only one company and taken the results as gospel, I could certainly have been left believing that I had no Native or African admixture.  For many people, it’s this small amount of minority admixture that they are seeking.  So in answer to the question of which testing company is “best,” the answer is, if you’re looking for trace amounts of anything, the compendium of all the testing companies (minus Ancestry) would provide the best set of results.  We will be using the match information as well in the next sections, so certainly nothing has been “wasted” testing with multiple companies, again, except Ancestry.  I am hopeful that Ancestry will in the future release our raw data (which they have promised to do) in a useable format, fix their misleading ethnicity results and add chromosome painting tools so that we can fully utilize our data.

In Part 5 of the series, we’ll take a look at third party tools and how they can continue to refine and add to our knowledge of our admixture.


1.  Genealogy-DNA Rootsweb posting by Doug McDonald on 7-26-09 and personal correspondence.

2.  71.5% western European, 28.4% Northeastern European

3.  Inferred that Asian is actually Native in an American with no history of Asian ancestry.

4.  No category, inferred.

5.  78.6% Northern European, 1.8% Southern European, 18.7% Nonspecific European

6.  54.6% Northern European, .3% Southern European, 43% Nonspecific European

7.  91.7% Northern European, 3% Southern European, 3.3% Nonspecific European

8.  75.18% West Europe (French and Orcadian), 24.82 Europe (Romanian, Russian, Tuscan and Finnish).  Note that my mother’s results are almost identical except the Finnish is missing from hers.

9.  43% North Europe and 36% Mediterranean

10.  80% British, 12% Scandinavian

______________________________________________________________

Disclosure

I receive a small contribution when you click on some of the links to vendors in my articles. This does NOT increase the price you pay but helps me to keep the lights on and this informational blog free for everyone. Please click on the links in the articles or to the vendors below if you are purchasing products or DNA testing.

Thank you so much.

DNA Purchases and Free Transfers

Genealogy Services

Genealogy Research

Thick Hair, Small Boobs, Shovel Shaped Teeth and More

Yep, there’s a gene for these traits, and more.  The same gene, named EDAR (short for Ectodysplasin receptor EDARV370A), it turns out, also confers more sweat glands and distinctive teeth and is found in the majority of East Asian people.

This is one of the results of the National Geographic’s Genographic project.  This mutation found at location rs3827760 on chromosome 2 occurred about 35,000 years ago.  It apparently has conferred some advantage to its carriers, because it is found in the majority of Asian people today.  We don’t exactly know why that happened, but maybe ancient male Asians preferred thick haired, small boobed and sweaty women.  Or maybe those women survived when women with more body fat (yes, boobs are fat, sorry guys) and who could sweat less perished.

This New York Times article discusses the experiments performed to verify that this gene in fact does confer those traits.  The scientific article itself is available in the journal, Cell although it’s behind a paywall.

Want to know if you carry this trait?  If you’ve tested with either Family Tree DNA or 23andMe, you’re in luck.

Download your raw results file and open the file using any tool.  Generally, a spreadsheet or Notepad will be your preferred methods.  Then using the search function of the tool you’ve selected (ctl+f for Notepad or Excel’s find function) search for rs3827760.  You will see two letters comprised of either T, A, C or G.  If you have a G shown for either letter at this location, then you carry this particular mutation.

If you carry this mutation, you’ve probably already headed for the mirror.  You’ll know already if you have small breasts, if you’re a female, believe me.  You may never have thought about thick hair shafts, which isn’t to be confused with lots of hair.  And your level of sweatiness is just what it is.  I’ve never even considered that there were different sweatiness levels.  But what about Asian teeth?  Well, that trait is called sinodonty and here’s a nice wiki article and another nice article, with examples, here.  If your teeth are shovel shaped, meaning the backs of your upper 4 teeth are shaped like a spoon as opposed to straight, then you have this trait.

Asian teeth

So are you wondering what this might have to do with genetic genealogy?  Well, if you carry this gene, then you obtained it from some Asian ancestor.  If you’re in America and not of Asian ancestry, then there are pretty much only two routes.  One would be Native American ancestry and the second would be the population or invasion of Europe by Asian groups, such as the Mongol Hordes and the Huns.  Your genealogy will have to be your guide as to which source contributed this gene to your ancestors, and ultimately to you.

Oh yes, and one last thing, this mutation isn’t the only one involved in at least some of these traits, specifically the teeth.  I don’t carry the G and I do have some of the Asian teeth characteristics.  I don’t have thick hair shafts which makes sense since EDAR is primarily associated with this trait.  And, well, I’m just not discussing the boobs and sweaty traits (and my husband is utterly forbidden to comment)…..TMI:)

______________________________________________________________

Disclosure

I receive a small contribution when you click on some of the links to vendors in my articles. This does NOT increase the price you pay but helps me to keep the lights on and this informational blog free for everyone. Please click on the links in the articles or to the vendors below if you are purchasing products or DNA testing.

Thank you so much.

DNA Purchases and Free Transfers

Genealogy Services

Genealogy Research