Ollie Bolton was born on May 5, 1874 in a neighborhood called Hoop Creek in Hancock County, Tennessee near the Claiborne/Hancock County line in 1874 to Joseph B. “Dode” Bolton and Margaret N. Claxton/Clarkson. We don’t know the middle names of either of her parents.
Ollie was my grandmother, my father’s mother, but I never knew her. She died in April, 1955, before my birth.
She is the least known of my grandparents. My Estes family told me stories of her first husband, my grandfather, William George Estes, who she married in Claiborne County, Tennessee on September 26, 1892, but there was no one to tell me stories about Ollie.
We don’t even know Ollie’s middle name for sure. In some places it’s recorded as Florence, but on my father’s Social Security application, he gives it as Ollie Elsie Bolton.
Ollie applied for a social security number on July 31, 1939. She is living at 117 S. Hamilton in Chicago. She is not employed and is age 65 at her last birthday. She gives her birthdate as May 5, 1874 and her parents as Joseph Bolton and Margreat Clarkson. No, that is not a typo.
Life Was Hard
Ollie’s life was hard. She lost her first baby at six weeks of age, the year after she was married, a month and 6 days before her first wedding anniversary. Her second child followed in 1894. Not long thereafter, Ollie and William George Estes moved to Springdale in Washington County, Arkansas where Ollie ran a boarding house and tended to her children, with little help from William George.
They moved back to Claiborne County and were living there in 1900, but William George was out of work more than he wasn’t, and he drank.
The 1907 photo of Ollie doesn’t portray her as a happy woman. Of course, photos can be poor or deceiving, but as of the time this photo was taken, 3 of the 7 children she had born were dead, and one had died tragically.
This photo was labeled “1907 Cumberland Gap.”
According to the 1910 census, three of Ollie’s children had died. We know who two of them are, Samuel who died at 6 weeks of age, and Robert who died when their cabin burned, but there appears to be a third child who died as well – probably born in the spot between 1894 and 1898 – and probably buried in Arkansas. It’s sad, that child is lost to us and we only knew of their existence from the census records.
Margaret says the family Bible was destroyed in the fire. It would have told us more.
The death of the child in the cabin fire must have been torturous for Ollie. The family in Estes Holler says that Ollie had left the children to go to a party. They don’t say where William George was. Odd that her absence is mentioned, somewhat scornfully, but his was simply accepted without mention.
It looks like Robert died before 1907. He was born in 1898 and the photo of the children in 1907 is without Robert. We know he died after they returned to Claiborne County, which was before the 1900 census. Cousin George showed me where the cabin that burned had stood, and the willow he planted in honor of the child who died.
I have often wondered if I was named after this child. It was my father that selected my name of Roberta.
Moving to Indiana
Shortly after the 1910 census, the family moved to Fowler, Indiana and were tenant farmers.
There appear to be some happy times there. Well, Ollie looks happy even if William George doesn’t. Ollie and William George are on the left and Howard Friar, with wife Mary “Ropp” Bolton. These two couples stood up for each other when they married. Aunt Ropp was Ollie’s half first cousin, a granddaughter of Joseph Preston Bolton and Mary Tankersley.
This family photo is labeled “1913, Fowler, Indiana,” although Aunt Margaret said the photo was taken in Boswell, Indiana on Easter Sunday.
The adults, other than Ollie and George to the right in the back row, are Ollie’s cousins, Clara and Mont Bolton, far left, and possibly family friend Ted Barnes third from left in the read. Beside Ollie is Elizabeth Bolton, sister of Mont and wife of George Smith. One of their sons, Joseph was missing in this photo, reportedly at scouts. My father, William Sterling Estes is the youngest male in the front row on the left beside his brother, their oldest son, Estle. Beside Estle at the right of the front row are cousins Lee and George Smith.
The Crazy Aunts, adversaries for life, Margaret, brunette on the left and Minnie, blonde on the right, are standing in the second row.
This is the only existing photo of the entire family. Margaret said that it was taken by setting a timer on William George’s camera. This photo was also taken about 1913 or 1914.
Shortly thereafter, the family scuttlebutt is that Ollie’s young cousin came to visit. By young, the young lady was born about the time that Ollie and William George were married. Ollie came home and discovered her cousin and William George in “the act.” Ollie grabbed either a bullwhip or a horsewhip, stories vary, but it really doesn’t matter, and proceeded to use it on him/them. The only thing that saved them was that there were others nearby. The Crazy Aunts tell us that it took “5 grown men” to restrain her. Never underestimate the wrath of a woman scorned.
Sadly, the parents didn’t just separate, but the family was divided in half. Margaret said, ” we had no home,” and that “neither Mama nor Daddy would take the boys.”
All the Children
Ollie Bolton and William George Estes had the following children, for sure, in Claiborne County, Tennessee, unless noted otherwise.
Samuel T. Estes born July 8, 1893, died August 20, 1893
Charles Estel Sebastian Estes born November 1, 1894, died August 26, 1972
Unknown child per the 1910 census, probably born and died in Arkansas
Robert Estes born June 1898, Arkansas, died before 1907, Claiborne County, TN
William Sterling Estes born October 1, 1901, 1902 or 1903, died August 27, 1963, Jay County, Indiana
Joseph “Dode” Harry Estes born September 13, 1904 died December 9, 1994, Wayne Co., IL
Margaret LeJean Estes born November 16, 1906, died August 6, 2005, California
Minnie May Estes born October 1, 1908, died February 3, 2008, Steinhatchee, Florida
Moving on to Chicago
There are other family stories surrounding this time as well. One story says that Ollie was pregnant with twins, that she lost after the scandalous “cheating husband” event. Another story says that another child, Elsie, was born and eventually died, and that Elsie was “retarded.” From what was said, Elsie likely had Downs Syndrome. One Crazy Aunt said Elsie died in Chicago, but there is no death record to support this, or any photos, nor any other indication that this child existed. Another rumor said there was also a second set of twins that died. By 1914, Ollie was 40 years old. She could well have had a Downs Syndrome baby. However, neither Benton County, Indiana, nor Cook County, Illinois records show the birth or death of any Elsia Estes or infant twins.
The photos above and below were labeled by Aunt Margaret as “Ollie Bolton Estes and Margaret 1918 Franklin Park, Illinois.” I have always questioned whether this was Ollie or Ollie’s mother. Another cousin has this same photo labeled differently which might imply that the women is Ollie’s mother, Margaret Claxton/Clarkson. The identifier “grandmother” is a matter of perspective. However, Crazy Aunt or not, Margaret was there in the photo and she should have known if it was her mother or grandmother.
I have a note in my file that Ollie moved to Chicago in 1919, and Margaret sent a photo of Minnie in Chicago in 1922, if she is correct about where it was taken. I cannot find Ollie in the census in 1920.
In the 1930 census, Ollie had remarried and she and John Robbins lived on Flournoy St. in Chicago. They had been married for 6 years which tells us that they married in 1924. She was 55 and he was 47. He was a clerk with the railroad. Minnie said she married John Robbins in Chicago, but Chicago marriage records don’t include their marriage.
Ollie was noted in her sister’s obituary in 1935 as Ollie Robbins. However, in 1953, she is called Ollie Estes in her sister, Ida’s obituary.
In 1939, Ollie applied for a Social Security card in Chicago.
We know she could write, based on this document, and we have her signature.
In the 1940 census, John and Ollie Robbins are living at 117 Hamilton. He is 56 and she is 66. They indicate they lived in the same location in 1935. Ollie says that she completed the 8th grade. The 1940 census included several employment questions. It looks like neither of them were working and neither are seeking work. Ollie indicates she is unable to work. They rent for $12 a month, which is about half of what other rents seem to be. There were a few at $10 but mostly they ranged from about $16-$25 with $25 being very common.
By the time my mother met Ollie, about 1950, Ollie was already ill. Mother didn’t know if John Robbins had died or they were divorced, but he was not in the picture. Ollie lived with my mother and father during her last illness during my mother’s pregnancy.
Ollie’s death certificate lists her death date as April 9, 1955 and her address as 639 N. Kedzie in Chicago. Ollie Bolton Robbins, widowed, born May 5, 1872, age 82, was a housewife at home, born in Tennessee and lists her parents as Joseph Bolton and Margaret Claxton. She was never in the armed forces and the informant was William S. Estes, listed at the same address, and he signed as her son. Note that her birth year is off by two years on her death certificate. I’ve seen this situation many, many times.
Ollie is buried in the Elmwood Cemetery in Chicago. John Robbins is not buried there. I visited several years ago and let me say that this grave was not easy to find and the Chicago traffic was abysmal. I’d rather climb over fences and brave brambles any day.
Cemetery records show that my father bought the lot and the stone, although one of the Crazy Aunts claims that she did, along with two extra plots, asserting that “someone” had then sold the extra plots and pocketed the money. That’s not what the cemetery records showed, however. It’s beyond me why anyone would purchase extra plots there. There was no one else to bury. But then again, that’s why we call them the Crazy Aunts! They did make life very interesting with their various wild goose chases! Every now and then, one produced a goose, or at least a few feathers.
Ollie’s X Chromosome
My father carried all of Ollie’s X chromosome. Men only inherit an X from their mother, because they inherit the Y chromosome, which makes them male, from their father. Therefore, I too carry Ollie’s X chromosome, intact, because my father only had one X chromosome to give me. Therefore, one of my 2 X chromosome is actually Ollie Bolton’s X and theoretically half of what I gave to my children is Ollie’s. In reality, my children could have inherited anyplace between all and nothing of Ollie’s X, but I definitely carry it intact.
My father’s autosomal DNA has never been tested, as he died in 1963, but by phasing my mother’s DNA against mine, I can, in this case, determine my father’s X chromosome and therefore, Ollie’s too.
Phasing is a process where, by process of elimination, when you don’t have both parents DNA, you can determine which DNA belongs to which parent. For every DNA location, every person carries two nucleotides, either T, A, C or G. So let’s say that I carry a T and a C for one particular address. If my Mom carries two Cs, or a C and an A, then we can say for sure that the T came from Dad. This method isn’t foolproof, because if Mom carried both a T and a C, we have no way of knowing which she gave me and which came from Dad, but it’s better than nothing.
Therefore, when dealing with X matches, if an X match doesn’t also match my mother, then I know it came from my father, and therefore, also from Ollie. It’s interesting, the innovative ways we are discovering to identify, “obtain” and utilize the DNA of those long gone.
I receive a small contribution when you click on some of the links to vendors in my articles. This does NOT increase the price you pay but helps me to keep the lights on and this informational blog free for everyone. Please click on the links in the articles or to the vendors below if you are purchasing products or DNA testing.
The trip from the US to the British Isles was to follow the path, backwards of course, that my ancestor Thomas Speake took when he immigrated from England to the US about 1660. He was born sometime around 1633 or 1634 someplace in the Gisburn area of Lancashire, and died in St. Mary’s County, Maryland on August 6th, 1681. He married Elizabeth Bowling, who was also a first generation immigrant to the colonies. Both Thomas and Elizabeth were Catholics, settling in the Catholic-friendly colony of Maryland.
Family researchers had long suspected Lancashire as one of the probable locations for Thomas’s origins based on the fact that this area was known for Catholic recussants and because there were Speaks found in this area. But nothing had been found in Maryland or English records to firmly tie these two families together…that is…until DNA testing.
Another Speak(e) family would leave Lancashire 200 years after Thomas Speake left for America. This Speake family would instead sail in the other direction, to New Zealand. It would be the descendant of this man, in New Zealand, whose DNA would match the descendants of Thomas Speake who went to America, confirming that indeed, this Lancashire family is the Speak family from which the American branch descends. If this seems like the long way around, literally, it was, but it got the job done!
That information then allowed us to dig further into the records. Some of the first detailed records we found were for a church in Gisburne, very near the location where our New Zealand cousins family is found, including records where all of his ancestor’s children were baptized. We were hooked. We had found our family line, our family church, our family area….and our family. We wanted to go back, to walk where they had walked, to sit in the church pews that they sat in, to visit the graves of our ancestors and other family members, and to immerse ourselves in the culture and history of where we came from.
Our family journey began in London and took us through Cambridge, Coventry and finally entering the Ribble Valley on our way to our destination, the Stirk House, once owned by a Speak family.
The first morning I woke up at the Stirk House, it seemed surreal as I realized where I was. It looked surreal too, and reminded me a bit of Middle Earth, land of the Hobbits in Lord of the Rings. I expected to see Gandalf any minute.
I sat up and looked out the wide picture window, which overlooks Pendle Hill in the distance and the fields that probably look exactly like they did when my 7 times great-grandfather, Thomas Speak was being raised within sight of Pendle Hill between 1634 or so when he was born and about 1660 when he immigrated.
These sheep in the field, meaning the white dots, are probably related to his family’s sheep too. Everyone here has sheep. Cattle are quite rare. That’s probably because the locals use a lot of wool because it’s cold and damp here, almost all of the time. It’s like a rainforest here and rains nearly daily, or at least some part of every day. It’s so moist that the stone walls grow both moss and ferns. His stone walls probably looked just the same and he likely would have been sent to repair them as a young man.
The farms are stunningly beautiful and for the most part, extremely well maintained, including the rock walls that line the fields as well as the roads.
Maintenance of these walls is taught to every farm child.
These ancient walls were probably here when our ancestors were living here. They may have touched these very stones. Their ancientness reaches from the past to touch your soul, a silver misty umbilical tether to those who came before…
This is a typical road, lined on both sides with rock walls and stone buildings, including barns, although their barns are not large like ours, for the most part, and never wood or pole barns. This wall above is part of the wall to the left below.
Notice also the hairpin turns. There was more than once our bus was unable to visit a location because it couldn’t navigate these roads, bridges and very tight turns to get there.
Here’s a beautiful old barn, larger than most, with Pendle Hill in the background.
Sometimes there are gates in the walls, seemingly in the middle of noplace.
Surprisingly, some portions of this region are very heavily forested.
Given that we are traveling in the Ribble Valley, it shouldn’t surprise you to discover that indeed, there is a Ribble River that runs the length of Ribble Valley.
The book, “The Common Steam” by Rowland Parker describes in exquisite detail the part that the literal common streams plays in the development, sustenance and nourishment of an area. I would heartily recommend this book to any history buff or anyone attempting to understand their English history and ancestors.
The Ribble River, indeed, is the common stream in this valley. All creeks flow into it, and it in turn, sustains the entire valley. Water is essential for humans and the animals on which they depend, and settlements sprung up along water sources. Our ancestors were here.
Lunch, on our first day in the Ribble Valley would be at a lovely local pub, the Inn at Whitewell, owned by the Queen, that sits on the Ribble River.
One of the best parts of this Inn is that we got to overlook the Ribble River. It ran, here, when our ancestors lived here. They looked at it as we do today. They probably drank out of it, washed in it and waded across it. Pubs here have a very long history as well, and our ancestors may have visited this very pub and looked at this very scene.
This is both the Pendle Hill and the Ribble River from where I was sitting at lunch. Pinch me. I still can’t believe I’m here, seeing what my ancestors saw.
Jim and I fully believe in “adventure eating.” When traveling, this means trying all of the local dishes, especially anything the local area is known for. In Lancashire, that would be fish pie and shepherd’s pie.
Now I’m not a big fish fan, but The Inn at Whitewell is famous for its fish pie, so I figured if I liked it anyplace, it would be here. Let’s just say that if you really like a fishy taste, this is for you. It included shrimp too, but their shrimp are miniscule. What we call shrimp in the US are called prawns in England. The baked cheese and potatoes were wonderful on the top of the fish pie.
I liked the shepherd’s pie better, but how can you go wrong with beef stew and pie crust. This isn’t only English, it’s all American too. I’m glad I tried both.
I have tried not to make these articles too personal, but I have to share a couple of photos that are really quite special.
My cousin, Dolores and I are chatting outside the Inn at Whitewell. I “met” Dolores many years ago, back in the 1980s, by letter. I still have her original letters and copies of documents she so kindly copied and mailed to me. I was just beginning my genealogy journey and she seemed so very wise and knowledgeable, not to mention kind. Little did I ever know just how far we, together, would travel, literally. Dolores brought her grandson along as well, a college student, standing to our right. He is a lovely young man, very helpful and Jim and I thoroughly enjoyed spending time chatting with him about computers and geeky techy stuff. I can’t imagine a young man his age who would actively choose to spend his time with his grandmother, but this young man is truly exceptional. I wish I had a daughter the right age:) This is the next generation of genealogists we’re raising!
Another family group on our trip included Susan Sills, the President of the Speak(e)(s) Family Association who coordinated most of the trip. She brought her son and his 2 daughters along. In fact, we had just celebrated the oldest granddaughter’s birthday during our lunch at the Inn before we took this family photo. How does a birthday get better than that???
It was wonderful to see the love of history being passed from generation to generation. Susan’s granddaughters are also lovely young women. I hope they realize what a gift their grandmother has bestowed upon them, if not today, then someday…even though I do think she bribed them to come along with that trip to Paris afterwards:)
You can hardly take a picture without Pendle Hill being in the background.
After lunch, we tried to visit the ruined castle at Clitheroe and through a series of quite humorous events, including the bus being too tall for a bridge, twice, we gave up and went on to St. Mary’s Church in Gisburn, which was our ultimate goal anyway for the day. Below, you can see one of those hairpin turn types of places we couldn’t navigate. Our bus driver was incredible and I was utterly amazed at his patience. I was sitting in the “jump seat” beside him where the tour guide normally sits, due to motion sickness, and I know I heard him swear under his breath. The poor man had about 10 women trying to “help him,” all at the same time. But he was a married man so he knew exactly how to handle that. He ignored everyone…and muttered.
I must say that the Clitheroe folly bore us a gift and that was the gift of going over the mountain, meaning Pendle Hill, because the bus had to find a different way into town. We got to drive around the countryside and it was picturesque. Look at this beautiful arched bridge. I have to wonder if it was originally a Roman Bridge from the Roman occupation beginning in the year 43. This area did play host to a Roman fort.
Many places look like they were straight out of Thomas Kincaid pictures. There are rock and hedge walls along the roads. It’s raining here, with Pendle Hill in the background.
The villages are comprised of “cottages” as they are called, and in some places, on Pendle Hill, for example, the sheep free range and graze on the moor lands.
And the flowers. Oh, the flowers. Lovely quaint flower gardens are found tucked into the most unlikely places. With all the rain, the gardens were lush and lovely. Oh yes, and did I mention that the houses are built perilously close to the road, because the road used to be a cart path hundreds of years ago. And yes, these houses ARE that old. What we consider old is rather new to them.
England is an ancient land and ruins pop up from time to time in the most unlikely places.
We didn’t have time to stop, but these ruins are of Sawley Abbey. Sawley Abbey was an abbey of Cistercian monks in the current day village of Sawley, Lancashire, but historically in the West Riding of Yorkshire. Created as a daughter-house of Newminster Abbey, it existed from 1147 until its dissolution in 1536, during the reign of King Henry VIII of all England, Ireland, and France. If you’ll recall, it was King Henry’s reign that created the religious persecution of Catholics, following his break with the Catholic faith and his installation of himself as the head of the Anglican Church. He disbanded, dissolved and destroyed the monasteries and abbeys between 1535 and 1541. Our ancestors would have witnessed this, and probably felt strongly about what was happening. This abbey suffered that fate, although some pieces of stone and wooden items such as the rood-screen were installed in other regional churches as an attempt to salvage the sacred.
This rood-screen, above, being the wooden divider between the chancel and nave, from St. Mary of Gisburn, is not one thought to be from Sawley Abbey, but is from the 16th century.
So, if you think about it, all of these church buildings that you see that existed during or prior to that time were at one time Catholic Churches that became Protestant, likely under duress. To defy the king was a bad idea, a very bad idea, a lose-your-head bad idea, so many became Protestant and the Catholic recussants went underground, practicing Catholicism in hiding and under threat of death. Many martyrs were created during this period.
I learned that you can tell which churches were originally Catholic by looking for one particular telltale sign. In the Catholic faith, sacramental wine must be poured into the earth, directly, so that unsavory people don’t somehow come into possession of it and use it for witchcraft or other “unholy” purposes. Built into Catholic churches, at least Medieval ones that existed prior to Henry VIII’s “conversion” to Protestantism, is an orifice similar to a bowl built into the wall for exactly this purpose called a piscina. If you look closely, you can see the drain hole, which leads down the wall directly into the earth. This is typically located someplace towards the front of the church where the Priest would dispose of the leftover Sacramental wine.
This piscina is from St. Mary’s of Gisburn.
Another hint that a church was once Catholic is the Holy Water Stoup, which may look something like a piscina except without the drain. The stoup is used by the congregation to cross themselves with water as they enter the church, so is therefore generally found in the front near the door, or what was the door at that time.
As we arrived in the crossroads village of Gisburn, the excitement was mounting. Gisburn was one of the villages where our Speak family was known to have lived, on the surrounding farms.
Gisburn was mentioned in the Domesday book, created in 1086 as England’s first census, in essence, for taxation purposes. The manor of “Ghisebum” was part of the Percy fee. It was passed to the Abbot of Salley (Sawley) in 1224 and disposed of by the King during the monasterial dissolution. In 1613, Gisburn passed to the Lister family. In 1797, upon threat of invasion by Napoleon, Thomas Lister raised a troop of cavalry and for his patriotism, he was named Baron Ribblesdale of Gisburne Park.
St. Mary the Virgin church, called St. Mary’s of Gisburn, did not exist yet when the Domesday book was created, but was dedicated in 1135. It has been expanded and revamped over the years. Most of these small medieval churches still don’t have either running water or restroom facilities today.
St. Mary’s serviced all of the nearby farms. The village itself isn’t nearly as old as the church, dating from the 17th century. Located on the main road connecting Lancashire and Yorkshire, trade, and a stage coach stop, was what fueled the village of Gisburn.
Our first glimpse of St. Mary’s Church, where many Speaks were baptized, married and buried, beginning in the earliest records in the 1600s, was from the rear, across the gravestones of her departed members.
At St. Mary’s Church in Gisburn, sadly, no one was available to meet us, but they did leave the church unlocked. We spent time in the church and the churchyard, but found only 3 stones from the Speaks family.
Their burial records begin in the early 1600s, and it’s obvious from translating those records that they served a number of other locations, villages and farms, in the area. We find the earliest Speak burials beginning with Anna, daughter of William, in 1602. Not all burials give the location of the deceased, but those who do are all Gisburne through 1653 when a series of other locations is given. Of course, these locations may not be new, they may simply have been among those without a location given earlier.
Locations include: Gisburne, Howgill, Rimington, Paythorn, Twiston, Miley, Horton, Varleyfield, Pasture House, Waitley, Todber, Watthouse, Yarside Bracewell, Martintop and Newby. This list takes us through 1828, when the Speak burials cease until in the mid 1900s. The records may not be complete.
On the map below, you can see that all of these locations that have corresponding locations today are within 2 or 3 miles of Gisburn(e). Those locations that do not exist on the map today may well have been farm or manor names that disappeared instead of becoming hamlets. The location just below Gisburn with no name is Todber. A caravan park is located there today, but otherwise, it has disappeared.
The cemetery is very old, as old as the church, and there are many unmarked graves as you can see on the map, below.
Notice the fence or boundary wall in this diagram. We’ll talk about it in a minute. It’s not what you think.
Fifty-one Speak burials exist in the records, and most of them are quite early. Many family units are evident, although there is a pronounced repetition of names. In particular we find the following:
Alice – 4
Ann/Anna – 5
Chrus – 1
Elizabeth – 2
Ellen – 1
George – 1
Harry – 2
Jacobus – 1
James – 5
Johes – 1
John – 2
Judith – 1
Margaret – 2
Maria/Mary – 3
Richard/Ricus/Richus – 4
Robtus – 1
Stepheus – 2
Thomas – 4
Wilmus – 2
Women designated as “wife of” with no first name given – 4
A bit of English history may be somewhat enlightening. This group of Speaks does not appear to be landowning. In other words, they were not royalty, were not wealthy, did not have coats of arms, etc. In medieval England, if you were not a land owner, then you were a tenant farmer, either free or bond. Bond did not mean slavery, but it did mean you had little freedom to leave. However, the freedmen had little opportunity to leave either, required the manor owner’s permission, and there was no place within the British Isles to go anyway that wasn’t already populated.
We were excited to enter this hallowed church of our ancestors. I love the door. The porch is a 15th century addition with a beautiful cross that protects a 13th century door build on a 10th century foundation.
Notice the defensive arrow slits build into the tower so that our ancestor could barricade themselves into the church and defend their position if need be.
All of the children of the ancestor of our New Zealand cousin were baptized here, not in this exact baptismal font from 1875, but probably one similar and in this location in the church, so we know the family didn’t live far.
Cemeteries and burials are handled very differently in Europe than they are in the US. At first, this was rather appalling to me, but I came to understand that it is simply a cultural difference, although there is a part of me still very uncomfortable with the situation. They reuse graves. They may move stones as well. Some churches simply remove old stones, and in doing so, they make maintenance easier, or reuse the burial plot, but they also lose all track of who was buried in that location. In the photo above, the old stones have been relocated to the wall along the road to make mowing easier. If you look carefully, you can also see that reflected on the cemetery map.
The relative wealth of a church and its parishioners can be judged by the number and quality of stained glass windows in the church. Each window has a story, both in terms of what the window is displaying and in terms of the history of the window itself. Keep in mind that until recent generations, most people could not read so the stories told in the church windows served to remind the parishioners of Bible stories and morals.
It’s believed that some of the stone in this church, particularly the supportive gables, archway and columns were rescued from Sawley Abbey, just 4 miles away, when it was destroyed. The church was expanded about this time.
This beautiful carved arch is believed to have been rescued from Sawley Abbey.
The original roof structure still remains. It looks similar in many Norman era churches.
After the others left, I remained in the churchyard and discovered why it is that none of the oldest stones are in evidence that might correspond to the earliest burials. There are two stacks of stones behind the church that appear to be unreadable. These grave locations have probably been reused for a new burials. Burial space is very scant after hundreds of years, not just here, but all over Europe. The “normal” time for a grave to exist before it is reused in Europe is about 20 years now, except in some of these small villages and towns where many of the older graves do still exist. We know from the church history that the lawn, behind where I’m standing, below, and the church, is where the stones that now line the wall were originally located.
St. Mary’s of Gisburn is a truly beautiful old church and so full of our family history. We know that our relatives, and probably our ancestors, rest in this dirt and worshiped in this church, first as Catholics and then, at least some, as Protestants.
We have no record that our Thomas was baptized here. But he had to have known of this church, passed it, and was probably in this church from time to time. He was assuredly baptized in one of these local churches unless he wasn’t baptized in the Anglican church at all, which is certainly possible, considering the family’s Catholic beliefs.
Our Thomas is had a rather unique profession, that of a tailor, as he stated in his first few years in Maryland. John David Speak checked the 776 Speak family records he has collected from the parishes surrounding this area and he found only three records that indicated Speaks men were tailors, and all three were from Gisburn where in 1613, Ann the daughter of William, a tailor was baptized, in 1647, Sicilia the daughter of Richard, tailor, was baptized, and in 1662, Thomas, a tailor, was buried.
The only other Thomas record found is at Downham, just 4 miles distant, where, indeed, a Thomas Speak was baptized in 1634. Fortunately, Thomas is a very unusual name in the Speak family. Unfortunately, there is also a marriage record for a Thomas in 1656, and his wife is buried in 1667, several years after our Thomas is known to have been in Maryland and having children.
Other church records from this area were lost in the English Civil War and record keeping was officially suspended altogether for an 11 year period between 1649-1660 when Cromwell was on the throne, although some records do still exist. They are however, not consistent.
One record from this area that does exist and functioned as a type of census was the Hearth Tax Return, taxing people on the number of fireplaces they had in their home. It’s also significant because tenants rather than landlords paid the tax on their property, so in essence, we obtain the name of every householder.
The Gisburn tax list is dated 1672 and the Blackburn Hundred for Downham and Whalley is noted as 1666-1671. Both of these dates are after our Thomas was in Maryland, but still, it will tell us where Speak families were located in this region. Thomas of Downham, who married in 1656 and whose wife and daughter were buried in 1667 should be accounted for, but he is not listed. Nor is his household under his wife’s name. So where was Thomas Speake and his family?
There were three Speak households in Twiston, which is where Thomas who was baptized in Downham lived, according to the Downham church records, two households in Gisburn (Rimmington), one in Stansfield near Halifax and two in the Newchurch area near Pendle. Of the 6 entries in Gisburn, Twiston and Stansfield, 5 are named John, as was the son of our Thomas Speak. It’s probably safe to say that either Thomas’s father or grandfather was named John.
Some of the group went back to the Stirk House to rest a bit, but Jim and I stayed in the village and walked around. We found a corner deli and small convenience store and sampled local fare.
Everything is not paved, meaning pretty much everything except the actual road was still cobblestones, probably the same cobblestones that were there when our ancestors trod these same paths.
The little deli had black current sorbet and local cheeses and such. Of course, we had to purchase some, and a currant scone as well. What fun we had.
Tea, in England, is served in real china teacups. Period. Here are their teacups to choose from, stacked like souvenir coffee mugs in my cabinet at home. If you tell them you want your tea “take away,” they look at you like you have lost your mind. Tea, is to be savored and enjoyed while relaxing, not taken away! What’s wrong with you Americans anyway???
Real estate is at a premium in the British Isles. We saw several instances of this type of architecture. If don’t have enough space to go around your house, just go through it.
It appear from historical records that Gisburn may not always have been as tranquil as it is today. Thomas Lister, buried in the churchyard is the son of Martin Lister, supposedly killed by one of the Pendle Witches.
In the 1400s, pigs roamed free through town and created so much manure that manure heaps had to be removed prior to the annual market.
In 1401, a Vicar of Skipton, traveling the 4 miles between Sawley and Gisburn was murdered.
In 1425, the church rector was sent orders to “reconcile the churchyard after the shedding of blood.”
In 1648, Oliver Cromwell stayed in the village with his troops who stabled their horses in the church. The villagers complained that they broke the stained glass. Probably the soldiers, not the horses.
We walked back to the restaurant where the group was meeting and sat and talked with our cousins. Jim and one cousin decided to start a beer drinking/photography club and think they should write a book called, Eat, Pray, Beer. They are convinced it will be a bestseller. They may be right. I started them off by taking their first pictures.
Jim and I had tried to have a drink in the local pub, the White Bull, but it was closed until 5PM.
So instead we all had dinner in an Italian restaurant in the English village of Gisburn with the slowest service possible.
One of the great things about visiting locally is that we met other Speak family members, including three male Speak men, Gary, Stan and David, who are certain that they are not related to each other. David, based on his genealogy, we know is a cousin of our New Zealand cousin, Doug, who matches the American line. In fact, it’s HIS fault that we are all here – because our New Zealand cousin knew who his oldest ancestor was – John Speak – the man whose children were baptized in St. Mary’s of Gisburn.
Gary indicated that he was told that his line is not related to ours. By this time, in the 1900s, the different Speaks families were on the other side of Pendle Hill, not terribly close to each other and in different communities. The known ancestral villages of the three different Speaks lines are shown on the map below. Pendle Hill is the high area in the middle. The two most distant points, Gisburn and Bolton are about 25 miles as the crow flies, or about 30 miles driving, and Bolton is a more recent location.
So indeed, we are all quite interested in the outcome of the Y DNA testing. All three men swabbed, so before long, we will all know.
So what do you think? Will three Speak men who believe they are unrelated, but with the same unusual surname, whose ancestors have lived in a remote country region of Lancashire “from time out of mind” share a common paternal ancestor based on Y DNA testing?
I hope you’ve enjoyed your visit to the village of Gisburn. We surely did!
Tomorrow, we go to Downham where we think our Thomas Speake may have been baptized. Every day in England gets better!!!
I receive a small contribution when you click on some of the links to vendors in my articles. This does NOT increase the price you pay but helps me to keep the lights on and this informational blog free for everyone. Please click on the links in the articles or to the vendors below if you are purchasing products or DNA testing.
Family Tree DNA held a webinar meeting today to explain the new Big Y product features for a number of us who blog or otherwise educate within the genetic genealogy community.
First, the results will begin rolling today, not tomorrow. 100 will initially be released today and the balance of the initial orders will be released as they finish QA over the next month, at which point, Family Tree DNA anticipates their backlog will be resolved. There were thousands of tests ordered. They aren’t saying how many thousands.
First, a little background. There are 36,562 known Y SNPs in the Family Tree DNA data base that everyone is being compared to. In the example we saw of the delivered product, 25,749 has been found and callable at a high confidence rate in the individual being tested and were reported. Low confidence calls are not reported on this personal delivery page, but are included in the data download files.
On the customer’s personal page, there are two tabs. The first Tab is for reporting against known SNPs.
The second is for Novel Variations, in other words, SNPs not on the list of 36,562 known and previously named SNPs.
In essence, Family Tree DNA has implemented a 4 step process.
An individual’s sequenced data is compared to the SNP data base and divided into two categories, known and previously unknown. The customer’s data is delivered based on these two categories.
All customer data is being loaded into a mammoth size data base at which point it will be determined which SNPs (please see the definition of a SNP here) are actually undiscovered SNPs that will be named, and which are truly novel, family or clan variants.
New SNPs that are found in enough of the population will be named and will be added to the haplotree.
Novel variants will remain that, and will continue to be reported on client pages.
Family Tree DNA is still working on items 2-4. In addition, they are working on a white paper which will be out in the next 6 weeks or so that will discuss things like the average number of novel SNPs per person being discovered, mutation rates, performance metrics and cross validation of platforms between the next gen sequencing Illumina equipment, Sanger sequencing and chip based sequencing, like the Geno 2.0 chip.
What’s Being Reported?
According to Dr. David Mittelman, the Y chromosome has about 60 million letters. About half of those are inverted repeats and are therefore not sequenceable.
Of the balance, there are several with poor readability, for example, some that simulate the X, etc. These are also not useful or reliable to read.
That leaves about 10 million, these being the gold standard of Y sequencing. Family Tree DNA tries to read about 13.5 million of these base pairs. They promised 10 million positions when they announced this product. They are delivering between 11.5 and 12.5 million positions per person. They also promised about 25,000 common variants, meaning known SNPs and they are delivering between 25,000 and 30,000 per person. This is only counting medium to high confidence calls. The low confidence calls are included in the download files, but not counted in this total or shown on your personal page.
Exactly how many locations are reported for any individual are shown on the bottom left hand side of the page. This example is generic. Yours might say something like, “Showing 1 of 10 of 25,000 of 36,564.” In this case, 25,000 would be the number of SNPs read and called on your test.
All 25,000 or so results are being shown, both positive and negative. That way, there is no question about whether a specific location was tested, or the outcome. Of course, the third and fourth outcome options are a no-call or poor confidence call at that location.
All novel mutations are being reported by reference number so that they can be compared to like data from any source, as opposed to an “in-house” assigned number.
Insertions and deletions are also in the download files, but not reported on the customer’s delivery page.
Personal data is also searchable by SNP.
Individual SNP Testing
After steps 2 and 3 have occurred, it has to be determined which SNPs are found in a high enough percentage of a population to warrant primer development to test individual SNP positions.
Family Tree DNA also clarified something from the November conference. The 2000 SNP limit is only how many SNPs can be loaded at one time, not the total number they will ever develop primers for or test for. They will do what makes sense in terms of the SNP being present in enough of the market to warrant primer development. With the very large number of Novel SNPs being discovered, it wouldn’t make much sense to purchase 50 individual SNP tests at $39 each. The break even point today, at $39, would be 17 individual SNPs, as compared to the $695 Big Y test. I expect that eventually the demand for individual SNP testing will decrease substantially.
Downloadable Files
Available on everyone’s page is the ability to download 2 files, a VCF (variant call file) which lists the variants identified as compared to the human reference sequence and the BED file which is a text file which shows a range of positions that passed the QC.
They will also be making available the BAM raw data files within the next week or so, but are finalizing the delivery methodology due to the very large file sizes involved.
The Much Anticipated HaploTree
If I had a dollar for every time someone has asked when the new tree would be available, I’d be a rich woman. As we all know, there have been a couple of problems with the tree. The new tree is 7 to 8 times the size of the 2010 tree. The tree, of course, has been cast in warm jello, an ever-moving target. And with the SNP tsumani that has been arriving with the full sequencing of the Y chromosome, that tree will very shortly be much larger still.
Bennett Greenspan said today that an updated tree is, “Needed, desired and will be delivered.” He went on to say that they have had two teams working together with Nat Geo for the past couple of months to both finalize the tree itself and to work on the customer interface. Since the tree is much larger, it’s not as easy as the older trees which could be seen at a glance and easily navigated. Furthermore, there is also the matter of integration with National Geographic.
Bennett says an updated tree will be delivered “within the next several weeks.”
New SNPs that are discerned to be SNPs and not novel/clan or family variations will then be named and added to the tree.
Integration
The initial release of Big Y data will be just that, a release of the results of the data, displayable on your personal page and downloadable. The newly found SNPs will not initially update the current haplotree on your personal page. This is the same issue we have today with the transfer and integration of Nat Geo data, because the tree is not current, so this is nothing new. The implementation of the new tree however, will remedy both problems.
The Future
Never happy with what we have, genetic genealogists will want a way to match to other people on SNPs, just like we do today with STR markers. In fact, we’ll want a way to integrate that matching and discern what it means to our own private family or clan situations.
Family Tree DNA is aware of that, planning for it, and welcomes feedback for how they can make this information even more useful in the future than it is today.
New Orders
I expect this delivery of new information via Big Y results will indeed spur a new interest in ordering this test from people who were waiting to see exactly what was being delivered. For those people ordering now, they can expect an 8-10 week turnaround, so long as additional vials aren’t required for testing.
For More Information
Elise Friedman is holding the free Big Y Webinar tomorrow, Friday, February 28th. You can read about it, sign up and learn how to access this and other webinars after their initial showing at this link.
Family Tree DNA FAQ pages you’ll want to visit are here and here.
I receive a small contribution when you click on some of the links to vendors in my articles. This does NOT increase the price you pay but helps me to keep the lights on and this informational blog free for everyone. Please click on the links in the articles or to the vendors below if you are purchasing products or DNA testing.
On Friday, February 28th, Family Tree DNA is sponsoring a free webinar to compliment their new Big Y product release. The webinar announcement and registration as provided by Family Tree DNA.
Elise Friedman has kindly agreed to do an introduction webinar on BIG Y results this Friday. Here are the details.
FTDNA Product Launch Webinar: Getting to Know BIG Y Results
On Friday, February 28, 2014, Family Tree DNA will release the first set of Big Y results! This webinar will provide an overview of the Big Y product, as well as demonstrate and explain the Big Y results page in myFTDNA. The webinar will be recorded, so if you cannot attend live, you’ll be able to view the recording instead. Recordings are typically available within 24 hours of the live presentation.
I receive a small contribution when you click on some of the links to vendors in my articles. This does NOT increase the price you pay but helps me to keep the lights on and this informational blog free for everyone. Please click on the links in the articles or to the vendors below if you are purchasing products or DNA testing.
I receive a small contribution when you click on some of the links to vendors in my articles. This does NOT increase the price you pay but helps me to keep the lights on and this informational blog free for everyone. Please click on the links in the articles or to the vendors below if you are purchasing products or DNA testing.
JayMan in Jayman’s Blog which focuses on Human BioDiversity (HBD) has recently been writing a series about clans, clannishness and where the people in these groups came from. His focus has really been on differences between groups of people, but it occurs to me that this information can also be used in reverse. For example, if your ancestors are found in a particular location, you can use these tools to perhaps gain some insight into their origins, or at least where you might want to first look, and why.
Let me also say that exceptions are always possibilities. For example, my line of Estes family came from Deal in Kent and settled in Virginia. But one of my Abraham Estes’s cousins did settle in New England. So take a look and enjoy.
I receive a small contribution when you click on some of the links to vendors in my articles. This does NOT increase the price you pay but helps me to keep the lights on and this informational blog free for everyone. Please click on the links in the articles or to the vendors below if you are purchasing products or DNA testing.
Elizabeth “Bettie” Ann Speaks was born in 1832 in Indiana or Virginia, per the census, although her parents were from Lee County, Virginia. She died in 1907 in Hancock County, Tennessee. I never spoke with anyone who actually knew her, but I spoke with people who knew of her.
My grandparents would have known her for between 20 and 30 years, but I didn’t know them.
She married Samuel Claxton, also spelled variantly Clarkson and Clarkston, according to Samuel’s Civil War records, on August 22, 1850, at the home of Tandy Welch. Her grandfather, the Reverend Nicholas Speak performed the ceremony. In the 1850 census, which was taken on December 13th, they are living beside the rest of the Claxton clan in Hancock County, Tennessee, where she would live the rest of her life. There is no baby yet, but my great-grandmother Margaret Claxton was on the way, being born on July 25, 1851.
We don’t really know much about Elizabeth, who, according to family, was called Bettie. Family records show her middle name as Ann, but the Civil War pension application consistently shows her middle initial as L. She apparently did know how to sign her name, as she signed the application for a Civil War pension in 1878.
The first record, other than the census, is a note in the Rob Camp Church records where Elizabeth Clarkson is “received by experience” on Monday, August 25th, 1858, meaning that she did not transfer from another church, but was “saved” and probably baptized.
In 1860, she was listed with the occupation of “scowering” and had 5 children. Her birth state is listed in 1860 as Indiana, but is listed as Virginia in other census records.
Her husband, Samuel would cross into Kentucky to join the Union troops in May of 1863 and served during the Civil War in the Tennessee Cavalry Company F, contracting tuberculosis which would kill him nearly a decade later. He was discharged in May 1865, ill, from the hospital.
This photo of Elizabeth was taken sometime during or after the Civil War and before her husband passed away in 1876, so between 1863 or so and 1875. That’s Samuel in the photo with her, wearing his uniform.
I must admit, the first thing I noticed about her was her “distinctive nose” as one of my cousins phrased it, and I am every so grateful that I did not inherit that from her. Genetics was my friend.
On the second Saturday of April 1869 Rob Camp Baptist Church released the following members from their fellowship:
E..H. Clarkson
Mary Clarkson
William Mannon
Elizabeth Mannon
Mary Muncy
Clarissa Hill
Sarah Shefley Farwix Clarkson Agnes Clarkson Nancy Furry Elizabeth Clarkson Margaret Clarkson William Bolton
James Bolton
John Grimes
Catherine Grimes Joseph Bolton
These members were released for the purpose of constituting Mount Zion Baptist Church. On the third Saturday of May 1869 these brothers and sisters met, along with representatives from Cave Springs, Big Spring Union and Chadwell Station to officially constitute a church. That church, albeit three buildings later, still stands in the same location on land donated by William Mannon, noted above.
Elizabeth Speaks Clarkson is among the members listed, as are her in-laws, Fairwick and Agnes Muncy Clarkson. Her daughter, Margaret Clarkson, also listed would marry Joseph Bolton, Jr., in 1873. We don’t know if Joseph Bolton listed above is Jr. or Sr., but I suspect Sr. since Jr. would have only been 16 at that time. Margaret was 2 years older than Joseph Bolton Jr.
Interestingly, Elizabeth’s husband, Samuel’s name is absent. However, that is explained by a note in the church records dated Sept. 2, Saturday, 1868 wherein the following is found:
“Excluded Samuel Clarkson for getting drunk and not being willing to make any acknowledgements whatever.” The same day, “Elected brother Joseph Bolton to the office of Deacon.”
The churches of that time were rather strict, serving as a combination of religious institution, the only social outlet in the area and moral prosecutor. The church rules as set forth in their covenants included the following gems:
Every male member wishing to speak shall rise from his seat and address the moderator and then speak strictly adhering to the subject matter under consideration.
No member may speak more than 3 times on one subject without liberty obtained from the church.
No member shall have liberty of laughing or whispering in times of public worship.
No member of this church is permitted to address another member in any other appellation other than brother.
No member is permitted to abruptly absent himself in time of business without leave of the moderator
Members shall not neglect attending meetings and shall not remove out of the bounds of the church without applying for a letter of dismissal.
Judging from the disciplinary actions taken against members in the church notes, you also could not play marbles, swear, get drunk, talk badly about or have a dispute with another church member, attend another church, and certainly not one of a different faith, dance, tell a falsehood or commit adultery. One man had charges brought for “betting and shooting,” although I don’t know if that was one thing or two. Some of the disciplinary actions read like a soap opera and ran for months in the notes. The church committed impartial people to help resolve issues between church members, but often, the resolution was that both people either left the church or were dismissed. Church business was high drama and the soap opera of the day. Notes often read like court proceedings where offenders were “found guilty” and disciplined. Fortunately for members, the worse they could do was throw you out of the church. If you acknowledged your sins, confessed publicly, and promised to try to do better and live a better life, you could be “reinstated to full fellowship.”
In the 1870 census, Elizabeth Speaks and Samuel Claxton have 8 children and are living beside his parents, Fairwick and Agnes Muncy Claxton.
In 1876, Samuel dies officially of pneumonia, but probably of tuberculosis contracted during his Civil War service.
On Oct. 18, 1878, Elizabeth applied for a widow’s pension for her husband’s Civil War service. In1880, she is noted as a widow with 1 child.
In the 1880 census, Elizabeth is a widow and has 100 acres of land worth $250.
On March 13, 1881, Calvin Wolfe and Rebecca, his wife, deeded to Elizabeth Clarkson land on the North side of the Powell River adjacent Henry Yeary’s gate and Roda Shiplet’s line, Nancy Snavely’ line and the main road. The acreage isn’t given. Rebecca Claxton Wolfe was the sister of Elizabeth’s deceased husband, Samuel Claxton.
A few months later, Elizabeth then sells what appears to be the same tract of land of 27.25 acres “laying on the north side of the road leading from Tazewell to Jonesville” to several members of the Overton family, who do not appear to be related. Elizabeth signs the deed, so she can write her name.
On Sept. 4, 1894, Elizabeth Clarkson petitions the Mount Zion Church for a letter of dismissal. This typically means the person is moving or wants to join another church and the letter states they have been a member in good standing.
The only other photo we have of Elizabeth is one taken about 1896 with her family. She is in the dark dress, center, front middle.
In the 1900 census, she tells us that she gave birth to 12 children and 9 were living.
Margaret N. 1851-1920 married Joseph Bolton
Cyrena “Rena” M. 1852-1887
Surrilda Jane 1858-1920 married William (Luke?) Monday
Clementine 1853-after 1877
Sarah Ann 1857-1860/1870
Cynthia “Catherine” 1860-1901 married William Muncy
John 1861-1899/1900
Matilda 1867-1944 never married
Henry Clint 1869-1937 married Amanda Jane Estep
Mary W. 1872 – after1900 married Martin Parks
Jerushia Claxton 1874-1925 married Thomas Monroe Robinson
Elizabeth 1876-1877/1878
The family lived along the Powell River in Hancock County, Tennessee where the Clarkson Cemetery, now known as the Cavin Cemetery, is located at the intersection of River Road and Owen Ridge Road. Elizabeth’s stone is shown below.
You can see this cemetery from River Road.
This is the guard bull, assuring that overly curious genealogists do not escape from the cemetery, at least not until he says so.
Elizabeth’s parents, Charles Speak (1804-1840/50) and Ann McKee (1801/1805-1840/1850) had married in 1823 in Washington County, Virginia, and made their home in Lee County, where Charles’ father, Nicholas Speak was the founding minister of Speaks Methodist Church in about 1820. Charles mother was Sarah Faires (1786-1862).
The Speakes line in Lee County wasn’t difficult to trace but tracking back from there was more challenging. We would discover that records became more fragmentary as we moved back in time, and that the ancestors tended to move geographically. Figuring out where they moved from and to was often nigh on impossible. It’s not like they left a forwarding address and you have to know where to look to find the records to connect the dots, if those records exist at all.
Over the period of almost 25 years, we managed to track the Speaks line backwards in time – Nicholas Speak (1782-1852) to his father, Charles Beckwith Speake (1741-1793/4) who married Anne (1744-1789), surname unknown. Charles was the son of Thomas Speake (1698-1755) and Jane (b 1714) and his father was Bowling Speake (1674-1755) who married Mary Benson. Bowling’s father was Thomas Speake, the immigrant, born about 1633/34 and who died August 6, 1681. He married Elizabeth Bowling who was born about 1648 and died sometime after her husband and before 1692.
Without the Speak(e)(s) Family Association (SFA) and years of contributed research by others, I would never have been able to find these connections. My situation wasn’t dissimilar to that of many others. There were holes in the various genealogy proofs. We needed to be sure that our Speaks lines really were all one and the same.
The Holy Grail. “That after which one seeks.” Of course, everyone approaches DNA testing with their own personal set of goals, their own Holy Grail, but the most universal is to find out where they are from. Especially people in the Americas, New Zealand and Australia – we are countries of immigrants – mostly from Europe, some from Africa.
Many times during and after the crossing to the new land, the connection to the old country was lost – certainly the challenges of a the new world, a new life, in essence starting new or again – took up every minute of every day. The old world, while certainly a memory, was not something they talked about daily. By the time a generation or two had passed, information dimmed, and if we are lucky, we might have an oral history of the country they came from. Another generation or two and there is nothing left.
If your ancestor immigrated in 1650, there have been approximately 14 generations since the person who immigrated. That’s a lot of people to pass on an oral tradition – and most of the time it didn’t happen. Some people are fortunate. For example, if your surname is something like Campbell, well, you pretty much know you’re Scotch-Irish or Scottish and there isn’t much doubt about where you came from. But other people aren’t so lucky. Furthermore, even if you do know which country your ancestor came from, that’s not quite the same as knowing the village where they lived, or the castle if you are landed gentry or royalty.
I approached the SFA about what was then a new technology, DNA testing, and the Speakes DNA project was begun in 2004. We have since identified several different genetic Speakes lines. Originally it was a Y DNA project, but today we work with autosomal DNA as well and encourage everyone who descends from a Speak(e)(s)(es) and has taken the Family Finder Autosomal test at Family Tree DNA to join the project.
Initially, we wanted to learn more about our Thomas Speakes of Maryland. We knew he was Catholic, was in Maryland by 1660 or so, and married Elizabeth Bowling shortly thereafter, before November 1663 when she was subpoenaed by the Speake surname. But we didn’t know where he was from, where he married Elizabeth, when he was born, or much else.
Earlier research had shown that Lancashire, in England, was “a nursery of recusants.” In other words, a hotbed of Catholics who refused to give up their Catholic faith, accept and become members of the Anglican Church. The biggest difference between the two is that the Pope is the head of the Catholic church and the King is the head of the Anglican church. To many Catholics, that was a rather important detail. Most people simply complied, but in Lancashire, many didn’t, including the landed gentry. They protected their Catholic peasants who worked their lands.
There was also a baptismal record for a Thomas Speake in 1634, about the right time, but then there was also a later death record for Thomas’s wife and daughter. Of course, we have no way of knowing if this was the same Thomas. There are many missing records during this time, as you might imagine. Not only did the English Civil War take place, but also Catholics had their children baptized in secret by priests. They were only baptized in the Anglican Church when there was no other choice. Same situation for marriages and deaths as well. When Cromwell was on the throne, there was an 11-year period where many of the records are missing entirely in Lancashire. Suffice it to say, the records were not only incomplete, the ones that did exist were frustratingly inconclusive. We, as a family association, had come to believe we might never know any more about our Thomas Speake that we already did. The association allocated some funds for testing and several Speak(e)(s) men at the convention that year swabbed. I just happened to have several test kits available. Imagine that coincidence:)
Between 2004 and 2010, several Speak(e)(s) males tested and we confirmed the DNA of Thomas of Maryland as well as that of both of his sons, John and Bowling.
You might notice on the chart above, that not all of the “sons” are yellow, the color of John, Bowling and Thomas. In fact, Capt. Francis and William are blue and red, and John E. is both green and yellow striped. This means that the descendants who tested in these lines do not match. Whether that is actually because Francis, for example, really was not the son of Richard, or whether an undocumented adoption has occurred some place in the line or the genealogy is incorrect has yet to be determined. In order to further define those lines, we need additional men from those lines to test.
John, on the other hand was schizophrenically colored with yellow and green stripes because his two sons lines DNA did not match. However, we know that the Thomas line is yellow because people from various sons lines all matches the yellow DNA results.
The Charles Beckwith to Nicholas Speaks line is the yellow line to the far right, above.
At this point, we had established the baseline DNA results for Thomas the Immigrant’s line, but we still had no idea where the family originated in England.
But then came Doug Speak from New Zealand. Ironically, Doug was recruited by one John David Speake, a gentleman who lives in Cambridge, England and whose DNA is shown not to match the DNA of the Thomas Speak of Maryland line. This was profoundly disappointing to us because we had felt a kinship with John for many years during our joint Speake research. John David had much better access to English records than we did or do, and we owe him a huge debt of gratitude.
New Zealand is newer country than the US. Doug’s ancestors had only immigrated to new Zealand in the 1800s, and he knew where they were from in England. While this was interesting initially, it became vitally important when we learned that his DNA matches the Thomas Speake family line.
This, in genetic genealogy terms, is the Holy Grail. Now if you discover your match is from London or a large city, that’s not the Holy Grail. Before the industrial revolution, places like London were merchant cities, not to mention the center of government. People migrated to cities.
However, if you discover that your surname match came from a small village in an out-of-the-way place – that indeed, is the equivalent of the genetic genealogy Holy Grail.
If you look at a map, you can see that Gisburn is about 2 blocks long, has a church, one pub, a deli and one restaurant. Well, of course, it has a few houses too, but it’s truly a small crossroads village.
In this church, St. Mary’s, Doug’s ancestors’ were baptized.
The Y DNA tells us that we share an ancestor with Doug, but it just doesn’t tell us who, or when. But no one immigrated TO Gisburn, unless it was from the village up the road, so we know this too is our ancestral land.
The Thomas Speak that immigrated in 1660 may have been baptized in Downham, another village church about 4 miles distant from Gisburn, so this makes sense. Churches were established where people could easily attend – and attendance meant walking.
In 2011, I announced at the Speakes Family Association convention that we had unlocked the secret of the area where our Speake family was from, I showed a slide of St. Mary’s Church, with their many Speake family records of baptisms, marriages and burials – and said as a throw away comment that I wanted to stand there. Little could I ever have imagined that indeed, two years later, I would be standing in that very churchyard.
It’s a long way from Hancock County, Tennessee, on the Powell River to Gisburn, Lancashire, England – 6 generations and more than 4000 miles. Wouldn’t Elizabeth Speaks Claxton be amazed!
So what are we waiting for? Let’s go see what we found!!!
Join me soon for the article, “Following the Ribble River to Gisburn.”
I receive a small contribution when you click on some of the links to vendors in my articles. This does NOT increase the price you pay but helps me to keep the lights on and this informational blog free for everyone. Please click on the links in the articles or to the vendors below if you are purchasing products or DNA testing.
Autosomal DNA testing has opened up the brave new world for genealogists. Along with that opportunity comes some amount of frustration and sometimes desperation to wring every possible tidbit of information out of autosomal results, sometimes resulting in pushing the envelope of what the technology and DNA can tell us.
I often have clients who want me to take a look at DNA results from people several generations removed from each other and try to determine if the ancestors are likely to be brothers, for example. While that’s fairly feasible in the first few generations, the further back in time one goes, the less reliably we can say much of anything about how DNA is transmitted. Hence, the less we can say, reliably, about relationships between people.
The best we can ever do is to talk in averages. It’s like a coin flip. Take a coin out right now and flip it 10 times. I just did, and did not get 5 heads and 5 tails, which the average would predict. But averages are comprised of a large number of outcomes divided by the actual number of events. That isn’t the same thing as saying if one repeats the event 10 times that you will have 5 heads and 5 tails, or the average. Each of those 10 flips are entirely independent, so you could have any of 11 different outcomes:
0 heads 10 tails
1 head 9 tails
2 heads 8 tails
3 heads 7 tails
4 heads 6 tails
5 heads 5 tails
6 heads 4 tails
7 heads 3 tails
8 heads 2 tails
9 heads 1 tail
10 heads 0 tails
What the average does say is that in the end, you are most likely to have an average of 5 heads and 5 tails – and the larger the series of events, the more likely you are to reach that average.
My 10 single event flips were 4 heads and 6 tails, clearly not the average. But if I did 10 series of coin flips, I bet my average would be 5 and 5 – and at 100 flips, it’s almost assured to be 50-50 – because the population, or number of events, has increased to the point where the average is almost assured.
You can see above, that while the average does indeed map to 5-5, or the 50-50 rule, the results of the individual flips are no respecter of that rule and are not connected to the final average outcome. For example, if one set of flips is entirely tails and one set of flips is entirely heads, the average is still 50/50 which is not at all reflective of the actual events.
And so it goes with inheritance too.
However, we have come to expect that the 50% rule applies most of the time. We know that it does, absolutely, with parents. We do receive 50% of our DNA from each parent, but which 50%?. From there, it can vary, meaning that we don’t necessarily get 25% of each grandparent’s DNA. So while we receive 50% in total from each parent, we don’t necessarily receive every other segment or location, so it’s not like a rifle card shuffle where every other card is interspersed.
If one parents DNA sequence is:
TACGTACGTACG
A child cannot be presumed to receive every other allele, shown in red below.
TACGTACGTACG
The child could receive any portion of this particular segment, all of it, or none of it.
So, if you don’t receive every other allele from a parent, then how do you receive your DNA and how does that 50% division happen? The bottom line is that we don’t know, but we are learning. This article is the result of a learning experience.
Over time, genetic genealogists have come to expect that we are most likely to receive 25% of our DNA from each grandparent – which is statistically true when there are enough inheritance events. This reflects our expectation of the standard deviation, where about 2/3rds of the results will be within the closest 25% in either direction of the center. You can see expected standard deviation here.
This means that I would expect an inheritance frequency chart to look like this.
In this graph above, about half of the time, we inherit 50% of the DNA of any particular segment, and the rest of the time we inherit some different amount, with the most frequently inherited amounts being closer to the 50% mark and the outliers being increasingly rare as you approach 0% and 100% of a particular segment.
But does this predictability hold when we’re not talking about hundreds of events….when we’re not talking about population genetics….but our own family genetics, meaning one transmission event, from parent to child? Because if that expected 50% factor doesn’t hold true, then that affects DRAMATICALLY what we can say about how related we are to someone 5 or 6 generations ago and how can we analyze individual chromosome data.
I have been uncomfortable with this situation for some time now, and the increasing incidence of anecdotal evidence has caused me to become increasingly more uncomfortable.
There are repeated anecdotal instances of significant segments that “hold” intact for many generations. Statistically, this should not happen. When this does happen, we, as genetic genealogists, consider ourselves lucky to be one of the 1% at the end of spectrum, that genetic karma has smiled upon us. But is that true? Are we at the lucky 1% end of the spectrum?
This phenomenon is shown clearly in the Vannoy project where 5 cousins who descend from Elijah Vannoy born in 1786 share a very significant portion of chromosome 15. These people are all 5 generations or more distantly related from the common ancestor, (approximate 4th cousins) and should share less than 1% of their DNA in total, and certainly no large, unbroken segments. As you can see, below, that’s not the case. We don’t know why or how some DNA clumps together like this and is transmitted in complete (or nearly complete) segments, but they obviously are. We often call these “sticky segments” for lack of a better term.
I downloaded this chromosome 15 information into a spreadsheet where I can sort it by chromosome. Below you can see the segments on chromosome 15 where these cousins match me.
Chromosome 15 is a total of 141 cM in length and has 17,269 SNPs. Therefore, at 5 generations removed, we would expect to see these people share a total of 4.4cM and 540 SNPs, or less for those more distantly related. This would be under the matching threshold at either Family Tree DNA or 23andMe, so they would not be shown as matches at all. Clearly, this isn’t the case for these 5 cousins. This DNA held together and was passed intact for a total of 25 different individual inheritance events (5 cousins times 5 events, or generations, each.) I wrote about this in the article titles “Why Are My Predicted Cousin Relationships Wrong?”
Finally, I had a client who just would not accept no for an answer, wanted desperately to know the genetically projected relationship between two men who lived in the 1700s, and I felt an obligation to look into generational inheritance further.
About this same time, I had been working with my own matches at 23andMe. Two of my children have tested there as well, a son and a daughter, so all of my matches at 23andMe obviously match me, and may or may not match my children. This presented the perfect opportunity to study the amount of DNA transmitted in each inheritance event between me and both children.
Utilizing the reports at www.dnagedcom.com, I was able to download all of my matches into a spreadsheet, but then to also download all of the people on my match list that all of my matches match too.
I know, that was a tongue twister. Maybe an example will help.
I match John Doe. My match list looks like this and goes on for 353 lines.
I only match John Doe on one chromosome at one location. But finding who else on my match list of 353 people that John Doe matches is important because it gives me clues as to who is related to whom and descends from the same ancestor. This is especially true if you recognize some of the people that your match matches, like your first cousin, for example. This suggests, below that John Doe is related to me through the same ancestor as my first cousin, especially if John matches me with even more people who share that ancestor. If my cousin and I both match John Doe on the same segment, that is strongly suggestive that this segment comes from a common ancestor, like in the previous Vannoy example.
Therefore, I methodically went through and downloaded every single one of my matches matches (from my match list) to see who was also on their list, and built myself a large spreadsheet. That spreadsheet exercise is a topic for another article. The important thing about this process is that how much DNA each of my children match with John Doe tells me exactly how much of my DNA each of my children inherited from me, versus their father, in that segment of DNA.
In the above example, I match John Doe on Chromosome 11 from 37,000,000-63,000,000. Looking at the expected 50% inheritance, or normal distribution, both of my children should match John Doe at half of that. But look at what happened. Both of my children inherited almost exactly all of the same DNA that I had to give. Both of them inherited just slightly less in terms of genetic distance (cM) and also in terms of the number of SNPs.
It’s this type of information that has made me increasingly skeptical about the 50% bell curve standard deviation rule as applied to individual, not population, genetics. The bell curve, of course, implies that the 50% percentile is the most likely even to occur, with the 49th being next most likely, etc.
This does not seem to be holding true. In fact, in this one example alone, we have two examples of nearly 100% of the data being passed, not 50% in each inheritance event. This is the type of one-off anecdotal evidence that has been making me increasingly uncomfortable.
I wanted something more than anecdotal evidence. I copied all of the match information for myself and my children with my matches to one spreadsheet. There are two genetic measures that can be utilized, centimorgans (cM) or total SNPs. I am using cM for these examples unless I state otherwise.
In total, there were 594 inheritance events shown as matches between me and others, and those same others and my children.
Upon further analysis of those inheritance events, 6 of them were actually not inheritance events from me. In other words, those people matched me and my children on different chromosomes. This means that the matches to my children were not through me, but from their father’s side or were IBS, Inherited by State.
This first chart is extremely interesting. Including all inheritance events, 55% of the time, my children received none of the DNA I had to give them. Whoa Nellie. That is not what I expected to see. They “should have” received half of my DNA, but instead, half of the time, they received none.
The balance of the time, they received some of my DNA 23% of the time and all of my DNA 21% of the time. That also is not what I expected to see.
Furthermore, there is only one inheritance event in which one of my children actually inherited exactly half of what I had to offer, so significantly less than 1% at .1%. In other words, what we expected to see actually happened the least often and was vanishingly rare when not looking at averages but at actual inheritance events.
Let’s talk about that “none” figure for a minute. In this case, none isn’t really accurate, but I can’t be more accurate. None means that 23andMe showed no match. Their threshold for matching is 7cM (genetic distance) and 700 SNPS for the first matching segment, and then 5cM and 700 SNPS for secondary matching segments. However, if you have over 1000 matches, which I do, matches begin to “fall off,” the smallest ones first, so you can’t tell what the functional match threshold is for you or for the people you match. We can only guess, based on their published thresholds.
So let’s look at this another way.
Of the 329 times that my children received none of my DNA, 105 of those transmissions would be expected to be under the 700cM threshold, based on a 50% calculation of how many cMs I matched with the individual. However, not all of those expected events were actually under the threshold, and many transmissions that were not expected to be under that threshold, were. Therefore, 224, or 68% of those “none” events were not expected if you look at how much of my DNA the child would be expected to inherit at 50%.
Another very interesting anomaly that pops right up is the number of cases where my children inherited more than I had to give them. In the example below, you can see that I match Jane Doe with 15.2cM and 2859 SNPs, but my daughter matches Jane with 16.3cM and 2960 on the same chromosome.
There are a few possibilities to explain this:
My daughter also matches this person on her father’s side at this transition point.
My daughter matches this person IBS at this point.
The 23andMe matching software is trying to compensate for misreads.
There are misreads or no calls in my file.
There of course may be a combination of several of these factors, but the most likely is the fact that she is IBS at this location and the matching software is trying to be generous to compensate for possible no-calls and misreads. I suggest this because they are almost uniformly very small amounts.
Therefore when my children match me at 100% or greater, I simply counted it as an exact match. I was surprised at how many of these instances there were. Most were just slightly over the value of 2 in the “times expected” column. To explain how this column functions, a value of 1 is the expected amount – or 50% of my DNA. A value of 2 means that the child inherited all of the DNA I had to offer in that location. Any value over 2 means that one or more of the bulleted possibilities above occurred.
Between both of my children, there were a total of 75, or 60% with values greater than 2 on cMs and 96, or 80%, on SNPs, meaning that my children matched those people on more DNA at that location than I had to offer. The range was from 2 to 2.4 with the exception of one match that was at 3.7. That one could well be a valid transition (other parent) match.
There has been a lot of discussion recently about X chromosome inheritance. In this case, the X would be like any other chromosome, since I have two Xs to recombine and give to my children, so I did not remove X matches from these calculations. The X is shown as chromosome 99 here and 23 on the graphs to enable correct column sorting/graphing.
In the chart below, inheritance events are charted by chromosome. The “Total” columns are the combined events of both my son and daughter. The blue and pink columns are the inheritance events for both of them, which equal the total, of course.
The “none” column reflects transmissions on that chromosome where my children received none of my DNA. The “some” column reflects transmission events where my children received some portion of my DNA between 0 (none) and 100% (all). The “all” column reflects events where my children received all of the DNA that I had to offer.
I graphed these events.
The graph shows the total inheritance events between both of my children by chromosome. Number 23 in these charts is the X chromosome.
These inheritance numbers cause me to wonder what is going on with chromosome 5 in the case of both my daughter and son, and also chromosome 6 with my son. I wonder if this would be uniform across families relative to chromosome 5, or if it is simply an anomaly within my family inheritance events. It seems odd that the same anomaly would occur with both children.
What this shows is that we are not dealing with a distribution curve where the majority of the events are at the 50% level and those that are not are progressively nearer to the 50% level than either end. In other words, the Expected Inheritance Frequency is not what was found.
The actual curve, based on the inheritance events observed here, is shown below, where every event that was over the value of 2, or 100%, was normalized to 2. This graph is dramatically different than the expected frequency, above.
Looking at this, it becomes immediately evident that we inherit either all of nothing of our parents DNA segments 85% of the time, and only about 15% of the time we inherit only a portion of our parents DNA segments. Very, very rarely is the portion we inherit actually 50%, one tenth of one percent of the time.
Now that we understand that individual generational inheritance is not a 50-50 bell curve event, what does this mean to us as genetic genealogists?
I asked fellow genetic genealogist, Dr. David Pike, a mathematician to look this over and he offered the following commentary:
“As relationships get more distant, the number of blocks of DNA that are likely to be shared diminishes greatly. Once down to one block, then really there are three outcomes for subsequent inheritance: either the block is passed intact, no part of it is passed on, or recombination happens and a portion of it is passed on. If we ignore this recombination effect (which should rarely affect a small block) then the block is either passed on in an “all or nothing” manner. There’s essentially no middle ground with small blocks and even with lots of examples it doesn’t really make sense to expect an average of 50%. As an analogy, consider the human population: with about half of us being female and about half of us being male, the “average” person should therefore be androgynous, and yet very few people are indeed androgynous.”
In other words, even if you do have a segment that is 10 cMs in length, it’s not 10 coin flips, it’s one coin flip and it’s going to either be all, nothing or a portion thereof, and it’s more than 6 times more likely to be all or nothing than to be a partial inheritance.
So how do we resolve the fact that when we are looking at the 700,000 or so locations tested at Family Tree DNA and the 600,000 locations tested at 23andMe, that we can in fact use the averages to predict relationships, at least in closely related individuals, but we can’t utilize that same methodology in these types of individual situations? There are many inheritance events being taken into consideration, 600,000 – 700,000, an amount that is mathematically high enough to over overcome the individual inheritance issues. In other words, at this level, we can utilize averages. However, when we move past the larger population model, the individual model simply doesn’t fit anymore for individual event inheritance – in other words, looking at individual segments.
Dr. Pike was kind enough to explain this in mathematical terms, but ones that the rest of us can understand:
“I think that part of what is at stake is the distinction between continuous versus discrete events. These are mathematical terms, so to illustrate with an example, the number line from 0 to 10 is continuous and includes *all* numbers between them, such 2.55, pi, etc. A discrete model, however, would involve only a finite number of elements, such as just the eleven integers from 0 to 10 inclusive. In the discrete model there is nothing “in between” consecutive elements (such as 3 and 4), whereas in the continuous model there are infinitely elements between them.
It’s not unlike comparing a whole spectrum against a finite handful of a few options. In some cases the distinction is easily blurred, such as if you conduct a survey and ask people to rate a politician on a discrete scale of 0 to 10… in this case it makes intuitive sense to say that the politician’s average rating was 7.32 (for example) even though 7.32 was not one of the options within the discrete scale.
In the realm of DNA, suppose that cousins Alice and Bob share 9 blocks of DNA with each other and we ask how many blocks Alice is likely to share with Bob’s unborn son. The answer is discrete, and with each block having a roughly 50/50 chance we expect that there will likely be 4 or 5 blocks shared by Alice and Bob Jr., although the randomness of it could result in anywhere from 0 to 9 of the blocks being shared. Although it doesn’t make practical sense to say that “four and a half” blocks will likely be shared [well, unless we allow recombination to split a block and thereby produce a shared “half block”], there is still some intuitive comfort in saying that 4.5 is the average of what we would expect, but in reality, either 4 or 5 blocks are shared.
But when we get to the extreme situation of there being only 1 block, for which the discrete options are only 0 or 1 block shared, yes or no, our comfortable familiarity with the continuous model fails us. There are lots of analogies here, such as what is the average of a coin toss, what is the average answer to a True/False question, what the average gender of the population, etc.
Discrete models with lots of options can serve as good approximations of continuous situations, and vice-versa, which is probably part of what’s to blame for confusion here.
Really DNA inheritance is discrete, but with very many possible segments [such as if we divided the genome up into 10 cM segments and asked how many of Alice’s paternal segments will be inherited by one of her children, we can get away with a continuous model and essentially say that the answer is roughly 50%. Really though, if there are 3000 of these blocks, the actual answer is one of the integers: 0, 1, 2, …, 2999, 3000. The reality is discrete even though we like the continuous model for predicting it.
However, discrete situations with very few options simply cannot be modelled continuously.”
Back to our situation where we are attempting to determine a relationship of 2 men born in the 1700s whose descendants share fragments of DNA today. When we see a particularly large fragment of DNA, we can’t make any assumptions about age or how long it has been in existence by “reverse engineering” it’s path to a common ancestor by doubling the amount of DNA in every generation. In other words, based on the evidence we see above, it has most likely been passed entirely intact, not divided. In the case of the Vannoy DNA, it looks like the ends have been shaved a few times, but the majority of the segment was passed entirely intact. In fact, you can’t double the DNA inherited by each individual 5 times, because in at least one case, Buster, doubling his total matching cM, 100, even once would yield a number of cM greater the size of chromosome 15 at 141 cM.
Conversely, when we see no DNA matches, for example, in people who “should be” distant cousins, we can’t draw any conclusions about that either. If the DNA didn’t get passed in the first generation – and according to the numbers we just saw – 58% doesn’t get passed at all, and 26% gets passed in its entirety, leaving only about 15% to receive some portion of one parent’s DNA, which is uniformly NOT 50% except for one instance in almost 1000 events (.1%) – then all bets for subsequent generations are off – they can’t inherit their half if their half is already gone or wasn’t half to begin with.
If I’m reading this right, a 10 cM block has a 10% chance of being split into parts during the recombination process of a single conception. Although 10% is not completely negligible, it’s small enough that we can essentially consider “all” or “nothing” as the two dominant outcomes.
This is the fundamental underlying reason why testing companies are hesitant to predict specific relationships – they typically predict ranges of relationships – 1st to 3rd cousin, for example, based on a combination of averages – of the percentages of DNA shared, the number of segments, the size of segments, the number of SNPs etc. The testing company, of course, can have no knowledge of how our individual DNA is or was actually passed, meaning how much ancestral DNA we do or don’t receive, so they must rely on those averages, which are very reliable as a continuous population model, and apparently, much less so as discrete individual events.
I would suggest that while we certainly have a large enough sample of inheritance events between me and my two children to be statistically relevant, it’s not large enough study to draw any broad sweeping conclusions. It is, after all, only 3 people and we don’t know how this data might hold up compared to a much larger sample of family inheritance events. I’d like to see 100 or 1000 of these types of studies.
I would be very interested to see how this information holds up for anyone else who would be willing to do the same type of information download of their data for parent/multiple sibling inheritance. I will gladly make my spreadsheet with the calculations available as a template to anyone who wants to do the same type of study.
I wonder if we would see certain chromosomes that always have higher or lower generational inheritance factors, like the “none” spike we see on chromosome 5. I wonder if we would see a consistent pattern of male or female children inheriting more or less (all or none) from their parents. I wonder what other kinds of information would reveal itself in a larger study, and if it would enable us to “weight” match information by chromosome or chromosome/gender, further refining our ability to understand our genetic relationships and to more accurately predict relationships.
I want to thank Dr. David Pike for reviewing and assisting with this article and in particular, for being infinitely patient and making the application of the math to genetics understandable for non-mathematicians. If you would like to see an example of Dr. Pike’s professional work, here is one of his papers. You can find his personal web page here and his wonderful DNA analysis tools here.
I receive a small contribution when you click on some of the links to vendors in my articles. This does NOT increase the price you pay but helps me to keep the lights on and this informational blog free for everyone. Please click on the links in the articles or to the vendors below if you are purchasing products or DNA testing.
Are you ready for the next leg of our British DNA journey? Come along. We’re leaving Cambridge, visiting historic Coventry and arriving in the Ribble Valley, home of our Speak family ancestors, and the Pendle witches, today!
Did I mention that we had some excitement in the hotel in Cambridge the night before we left? Aside from a very loud and roudy wedding party, the fire alarm went off about 1:30 in the morning. Jim leaped out of bed, shouting “what is that?”, grabbed his iPad, tore open the cover and frantically started pushing buttons to make the noise stop, thinking it was his alarm, of course. I started yelling at Jim that it was the fire alarm and to get dressed quickly. You can’t make someone with a hearing impairment hear over a fire alarm. So looking something like the keystone cops, we frantically threw clothes on and just as we were about finished and ready to evacuate, the alarm silenced, thankfully. Indeed, not before we were wide awake though. I wondered if the alarm had something to do with the wild wedding party. But justice was served. Because as we very sleepily boarded the bus the next morning at 8 AM, the alarm went off again, waking up all of those revelers:) I swear, I was ON the bus and had nothing to do with that. I have witnesses! Although I must admit, I did smile a very big smile. Ahhh, karmic justice!
This trip was arranged in part by a travel agent, and in part by Susan Sills, the president of the Speaks Family Association, with probably too much help and input from members. The parts that Susan arranged were wonderful. The parts that the travel agent arranged were, at best, OK. I think they decided that we had 2 hours and were going past a landmark and we surely needed to stop at that location. I’m including some of these stops because they really did turn out to be historically interesting, but have omitted others.
Were any of your ancestors skilled tradesmen? Tilers, bricklayers, stainers, painters, carpenters or merchants perhaps? If so, they were members of a guild, and guilds had guild halls. The men spent a lot of time in those halls. Have you ever wondered about that? What were they doing? What did the halls look like? Well, come with us today, we’re going to visit a pretty amazing one. Keep your ancestor in mind as we do, because their hall was probably similar to this one!
After leaving Cambridge, we arrived in Coventry, a city very heavily bombed during WW2. It was Churchill’s home town and had lots of manufacturing, so was a very attractive target to the Germans.
After arriving in Coventry, we met up with our walking guide and our first stop was the medieval St. Mary’s Guild Hall in quaint Bayley Lane. The Guild Hall is the tall building on the right with the archway entrances. Built in the 1300s or so, it’s one of the city’s oldest buildings. It was the wealthy merchants guild, and also the town council chambers for a very long time. No undue influence there.
This 1810 painting is looking from the street through the archway into the courtyard of the Guild Hall. It doesn’t look much different today. One difference is that the staircase on the left is enclosed today. See the railing end in the photos below.
It’s a beautiful buildings, nothing even or straight in the entire place. It was obviously not the carpenters guild.
I love the old doors and archways.
Upon entering the doors from the courtyard today you turn right and climb the stairs, which were open in the original Guild Hall. Here’s the original carved railing.
The relative worth of doors, and those who lived behind then, and their ability to stand up to battering from invading “evil forces” was determined by the number of metal studs embedded in the door. Who knew?
Never let it be said that I have not visited the Prince’s Chamber:) This is how family legends get started, by the way. “I saw a picture of grandma in the Princes Chamber in England.” In 3 or 4 or 7 or 8 generations, this will be a MUCH better story!!!
Behind the glass, under that beautiful stained glass window, hangs a stunning woven tapestry.
The ‘Coventry Tapestry’ is the highlight of the historic collections at St. Mary’s Guild Hall.
Manufactured about 1495 to 1500, its significance lies not just in its age and remarkable state of preservation, but also in the fact that, incredibly, it remains hanging on the very wall for which it was created more than five hundred years ago.
At more than nine metres wide and three metres high, this magnificent artwork dominates the north wall of the Great Hall, and is testament to both the skill of its Flemish weavers, and the wealth of the city of Coventry at the end of the fifteenth century.
The scene portrayed includes 75 individual characters, principally members of a Royal court, angels, saints and apostles, with an image of the Virgin Mary at its center, and incorporates numerous examples of symbolism and hidden meaning, some of which remain unexplained. It has even been observed that light from the west windows specifically illuminates the head of the Virgin Mary at certain times of the year, either a strange co-incidence or an inspired feature of the original design.
In this photo, you can actually get an idea of the size of the hall itself. It certainly doesn’t look this large from the street. This is the area directly to the rear as you were entering the piazza.
And the Guild Hall ceiling. I just can’t help myself, I love the medieval architecture.
And the beautiful mosaic file floors.
One really interesting piece of history is that there is a small room upstairs, very crooked and sloping, and only accessible via a very small, very steep circular stairway. I’m amazed they let people go up there in terms of safety and liability. Mary Queen of Scots was hidden here at one time.
Looking outside into the courtyard and on into the street under the archway though the windows in Mary Queen of Scot’s hidden room.
They do have some beautiful furnishings, like the original council chamber, shown here, and a rich history. They also have some medieval armor that you can “try on.”
Now you know me by now well enough to know I could not bypass this opportunity. This Viking style helmet was Jim’s favorite.
Oh yea, I like this French Troubador one best!!! I think he should use it as his Facebook profile photo, don’t you???
I think Jim was saying, “No, you are NOT going to put this on the blog, are you?”
What do you mean, where are the pictures of me in the hats??? There are no pictures of me in the hats:) None. Nada. Not anymore.
These slot windows were defensive – they were created to shoot arrows through when under siege.
Coventry, like all towns that were once Medieval, has a market space and an open area, usually right in the center of town.
Lady Godiva rode here. I wasn’t terribly interested in Lady Godiva, or the statue, but I was extremely interested in the Starbucks on the other side of the square. So you’ll excuse the fact that I had to go to Wiki to find a Lady Godiva statue photo:) You know where I was!
While I was in Starbucks, I also purchased a salad, because we were running late and I knew that on a Sunday morning trying to find a lunch to eat in half an hour would be impossible. So Jim and I were about to have another impromptu picnic. Starbucks coffee and salad in the sunshine under beautiful blue skies on a Sunday morning in a church, or what is left of one. Truly, what could be better? How can you improve on that?
Our next stop was the earliest church in Coventry, now in ruins, because the Germans bombed the city so relentlessly. The bombs burned the church, but the walls still stand. It’s a beautiful skeleton.
Our guided tour ended here, and our other family members dispersed to try to find a quick lunch. Jim and I were left to ourselves, or nearly so, in the beautiful sentry standing mute testimony. Once again, we began our picnic. But the church just up the street was letting out and the church bells began to peel. They were beautiful, and the church bells still function, giving voice to this church we thought was silent.
We left Coventry and visited Shugborough Historic Estate. We did a quick tour, because we were running late, again.
One of the most interesting things I found was all of the secret doors found in all of the old manor houses. Here’s one example where they took library book ends and made the door look like part of the bookshelves.
I found this house to look more “old” than historic. Probably because they had restored it to between the 1920s and the 1970s when it was last lived in. However, from the rear, the formal Victorian gardens were remarkable. The bush shapes remind me of jelly candies:) I’m sure that’s not what they had in mind.
From there, we still had about 2 and a half hours to Stirk House, where we are staying in the Ribble Valley. The Ribble Valley is the land of rolling hills and what I would call moors and low mountains; the land of legends as well. It’s believed that the Hobbit books, in particular, Middle Earth, was written after the Ribble Valley. The author spent a great amount of time writing here while his son was in school in the area. It’s a very distinctive area. Outside of London it’s very much like Michigan or the US – but when you enter the Ribble Valley, it’s immediately different, remote, otherworldly. It’s also the land of Robin Hood. In fact, in the Robin Hood stories, there is a “Guy of Gisburne.” Gisburn is where our Speak ancestors are from.
If you remember, this entire trip to the British Isles all began with DNA testing. Our Speak(e)(s) family finally connected with the source location of our American family in the British Isles, thanks to our cousin, Doug, from New Zealand. New Zealand was settled much later than the US and Doug’s family knew where they were from in the UK, exactly, and still had contact with family members there. The Speak(e)(s) family in the US arrived about 1660 and descendants didn’t know where they were from, in England. We had been searching for that information for years. We had suspicions and theories, but no proof.
The Speak(e)(s) Family Association meets yearly, and in 2011, I presented the results of the Y DNA testing to our group, ending my surprise presentation with pictures of Gisburn and the throw-away comment of, “I don’t know about you, but I want to go there. I want to stand in that churchyard.” Apparently, I wasn’t the only one, because planning began for the 2013 homecoming in Lancashire, England.
The excitement on the bus grew as we traveled. It was palpable. You could feel it. After all, we had all traveled thousands of miles from around the globe to step back in time, not only figuratively, but literally as well in the Ribble Valley. On the way, we were graced with a beautiful rainbow, Getting a picture of the rainbow was a challenge through the bus windows. We interpreted this incredible rainbow as a welcome from our ancestors.
Turning off the main roads, we began to see signs for places we had researched. The names began to look familiar, Whalley, Gisburn, Clitheroe. We knew we were close.
This photo is of Pendle Hill, a local landmark that you can see from anyplace in the Ribble Valley. To the right is the east end of Longridge Fell. Mist lies in the Ribble valley between them.
This panoramic view of Pendle Hill is not from the Ribble Valley, but from Newchurch on the other side of the hill.
Here is our first view of the Ribble Valley. These hills are high enough that they are moors on the hill. Pendle Hill towers over the entire Ribble Valley, along with a ridge and cliffs. Below was our first view of Pendle Hill.
The Pendle Hills are full of legends, and sheep. One of the legends is of the Pendle Witches. England did not escape the witchcraft craze and several women were executed here in the Pendle area for witchcraft in 1612. One test of being a witch was to be held underwater for 30 minutes. If you were dead, you were innocent. If you were alive, you were then tortured and killed for being a witch. Talk about being dead right.
One of the issues we had with the travel agent was where to stay in the Ribble Valley. There aren’t any Holiday Inns. In fact, the agent wanted the bus driver to take us back each evening to Manchester, 40 miles distant to a sterile Best Western. We wanted to stay in the Ribble Valley, to be where our ancestors had been. Susan found a conference/meeting facility, literally, in the middle of the valley, that was a restored manor house. We wanted to stay there, but the travel agent didn’t have a “working relationship” with the Stirk House. The day came when we simply told them to figure it out or we would, without them, because we were staying at the Stirk House.
Our cousin, Steve Speak, could not join us in the Ribble Valley, but he did meet us in Cambridge for dinner. Steve is from the Gisburn area and told us that the Stirk House was purchased in the 1930s or 40s by a Peter Speak and he took the next 20 years to restore the manor house which had deteriorated into a terrible state. On the way, in the bus, Susan took a look at the Gisburn Church records, and sure enough, a Speak woman died in the 1940s, is buried in Gisburn at the church and her residence was listed as “Stirkhouse, Gisburne.” Now how uncanny is that. So regardless of exactly where in this beautiful valley our original Speak ancestor lived, we are indeed staying on historic Speak land at the Stirk House.
The Tudor manor house known as the Stirk House was built in 1635, using stones from
the former Sawley Abbey which had been dismantled a century earlier under the
orders of Henry VIII.
The Stirk House was everything we could have imagined and more. Beautiful facility, wonderful gardens and nature area, good food and a spa if you’re interested.
Welcome home!
I love the moss and ferns growing on the rock walls.
We had planned this event with the intention of meeting any Speak family members who might remain in the area, whether they carried the Speak surname or not. We ran ads in regional genealogy/historical publications as well as in the local newspaper. We also had an English contact which we thought might have made local people more comfortable.
Several Speak family members joined us for dinner. The Stirk House had a private dining room for us, beside a meeting room.
We had dinner together in the dining room here, an English country dinner, and then moved on to the evening’s agenda.
Some of our Speaks relatives joined us for the evening. It was nice to meet some of our cousins, no matter how distant. Three different male Speaks brought their families, David, Stan and Gary. David brought photos of his family and shared information about his family history and the area. And yes, all three did a DNA test. They felt certain that they were not related to each other.
We are probably at least 15 generations removed, but still, we are indeed cousins. It’s interesting that even after all of these generations two of our English cousins do share segments of DNA with some of us. Not all of the results are back.
Now that I think of it, we’re probably related to all of the Pendle witches too. That makes sense, because they were convicted of talking to cats and dogs and one was convicted because her children testified that she was a witch. Heavens, that could have been me:) I need a Pendle Witches t-shirt!
We moved to the meeting room and two local people gave historic presentations about the area, which were really quite interesting. We ended the evening, finally, at 11:45 PM following a DNA presentation and update as to how our DNA brought us to the Ribble Valley.
I must say, this all seemed very surreal to me, especially after a long day following a short night interrupted both by that loud wedding party and the fire alarm. If I have one piece of advice, it’s don’t pack too much into a day, and don’t do a DNA presentation late in the evening. Ok, that was 2 pieces of advice. Pick on me about it and I’ll put a spell on you:)
I receive a small contribution when you click on some of the links to vendors in my articles. This does NOT increase the price you pay but helps me to keep the lights on and this informational blog free for everyone. Please click on the links in the articles or to the vendors below if you are purchasing products or DNA testing.
Our cousin, Cheryl, who grew up across the street from my grandparents’ house where my brother, John, spent a great deal of time mentioned one day in passing that John was known to be a “stinker” as a child. I’m sure she was not exaggerating. From all the stories I’ve heard, my brother, John was indeed a handful, and not much ever changed.
When going through Mother’s things after she departed this Earth, I found something, in John’s own hand, from when he was maybe 7 that proved, beyond a shadow of a doubt, that he indeed fully earned his reputation.
John made Mom a Valentine. As all mothers are, I’m sure she was thrilled to receive something from her child. And then she opened it. The front is your typical children’s exchange Valentine – and I’m just as sure as I’m sitting here that my grandmother told him to write something to his mother on the back and tell her what he’d been up to…..so he did.
I got muddy five times.
I got in a fight Wednesday.
I got called down Tuesday.
I got in the coal bin Sunday and was I dirty.
I got a great big clok.
Yours truly,
John Curtus Bucher (Yes, he misspelled his own name.)
Indeed, I’m thinking that every day in John’s life was a new adventure just waiting to happen. This was probably an ordinary week in John’s life.
Not a lot changed in the following 60 years or so, except the magnitude of the trouble John got into. In 2011, the story of his weekly adventures started out something like this…..Sunday, I cut my leg with a chain saw…Monday, I got the tractor stuck in the mud…Tuesday, I went back to the woods and a tree fell on me……
My brother, John, passed away in October of 2012, ornery as ever, staunchly refusing to DNA test as he had for the past decade….asserting that he would rather “not know,” even in death. Actually, what he meant was that wanted to keep me from knowing, just on general principles…just because he could. Personally, I think he did that…or in this case…didn’t…just to irritate me…and he fully succeeded.
However, whether I agree or not with his motives or choices, I staunchly defend his right to them. So, for the record, it was NOT me who stole his toothbrush from his hospital room.
Nope, wasn’t me.
I know what you’re thinking.
Was not.
You see, I knew that toothbrush wouldn’t help at all.
I don’t know who used it, took it, or whose it was, but it wasn’t his.
I receive a small contribution when you click on some of the links to vendors in my articles. This does NOT increase the price you pay but helps me to keep the lights on and this informational blog free for everyone. Please click on the links in the articles or to the vendors below if you are purchasing products or DNA testing.


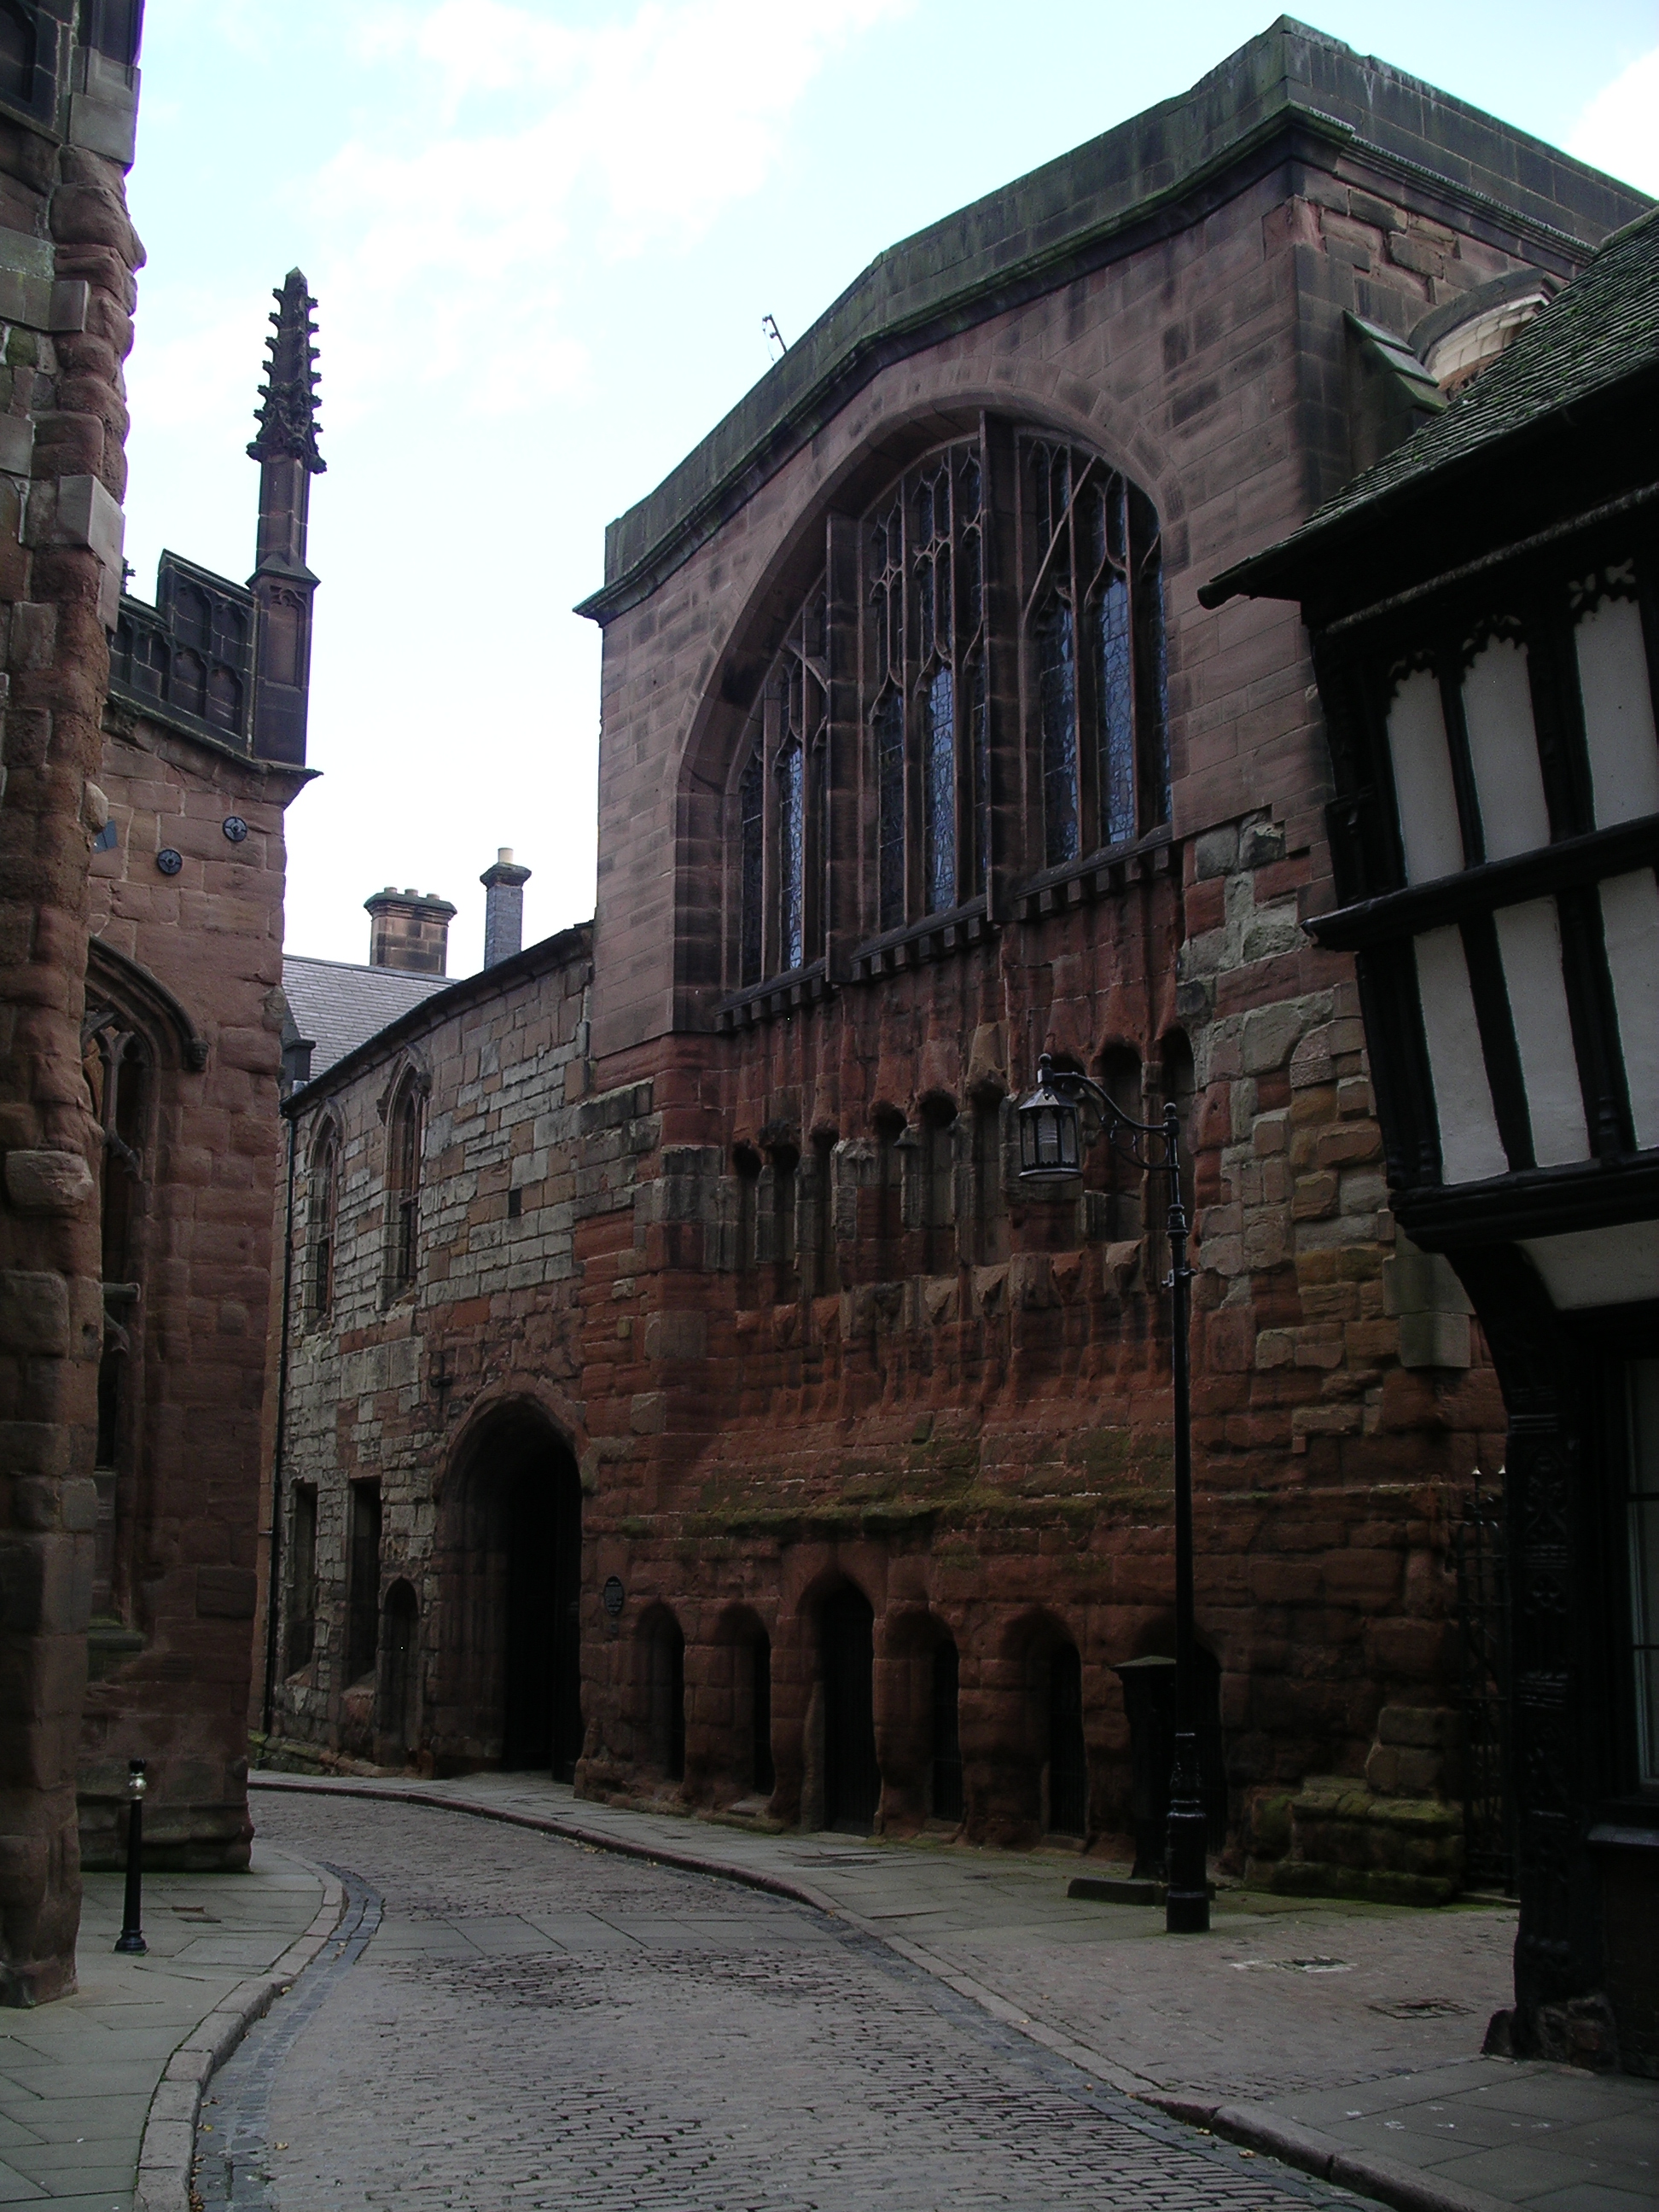