Concepts – Managing Autosomal DNA Matches – Step 1 – Assigning Parental Sides

Lots of people have struggled with exactly how to identify and work with autosomal DNA matches, create DNA match groups and triangulation groups, which isn’t at all the same thing. Add to that multiple testing vendors who provide you with different types information in different formats, and it’s a challenge.

Now I have a confession to make. I’ve gotten very behind on keeping up with matches and such.  Family Tree DNA recently made improvements to their matching algorithm which changes the matching amounts with several of my matches, so I’m going to “start over” with my matching spreadsheet and use the steps as an example for you of how you can do this.  Yes, I will preserve what info I have previously collected, of course, but if I’m adding something from previous information, I’ll tell you.

Goal: I want to see how much I can figure out from what I have available to me at the three vendors.

There has been a lot of discussion recently about the lack of communication when people attempt to communicate with their matches – so let’s see what we can do with just DNA.

I don’t know how many steps this series will be. We’ll see.  I’m trying to do this in manageable “bites.”  And yes, there will be some homework, but don’t think of it that way.  Think of it as panning for gold – your ancestors!!!

Before we go on, let’s talk about who these techniques in today’s article work best for:

  • People with one or both parents
  • People with known cousins

Adoptees or people with no known cousins can still learn about sorting and matching, but will not be able to assign genealogical sides to matches without working with their matches to discover their shared ancestor.

Adoptees should be utilizing a different set of techniques taught by www.dnaadoption.com.

People who are not adoptees but who have no known cousins who have tested will, hopefully, be able to identify ancestral groups based on the genealogy of the other people in match groups.  Perhaps they will discover new cousins.

So, stay with me and just skip steps that you don’t think apply to you AFTER reading them.

What We’re Doing in this Article

In this article we’re going to do the following:

  • Combine you and your parent(s) match results into a single spreadsheet
  • Do some preparatory maintenance
  • Sort the spreadsheet so you can see common matches
  • Identify matches to a maternal or paternal side of your family
  • Further identify parental “sides” based on known cousin matches

Matches and Stats

So let’s start with some basic information.

At Family Tree DNA, I have 1470 matches and my mother has 803.

Why does my mother have only about half of the number of matches that I do? Three of her 4 grandparents came from the old country.  All of the data bases are highly skewed towards “New World” testers.  My father’s line is very colonial and has been in the US, having children, lots of children, for hundreds of years now.

My father was deceased in 1963, so clearly I don’t have his DNA in any database, except the Y by virtue of other Estes males and at GedMatch by virtue of a phased parent kit.  We’ll work with GedMatch in a future article.

I provided instructions for how to download your chromosome browser matches at Family Tree DNA here. If you haven’t done that, do it now for the following people:

  • You
  • Both of your parents
  • One of your parents if you don’t have both
  • If you don’t have both parents, download the files for FULL siblings only

If you haven’t already done so, save the files as Excel files and not CSV files, as the CSV format does not support some of the coloration and other functions we’ll be doing. (File, save as, Excel Workbook)

Why Full Siblings?

If you have the DNA results for both parents, you don’t need your sibling data, and it will just add unnecessary bulk to your file. However, if you don’t have either parent or only one parent, your full siblings’ information will be helpful.

You receive 50% of your DNA from your parents. Your siblings do too, but not the exact same 50% (unless you are identical twins.)  Therefore, the matches your full siblings receive, especially in the absence of one or both parents, are as relevant to your genealogy as your own matches.  Therefore, you can obtain some of the matches your parents would have had, if you had their DNA results, by virtue of including your full siblings matches.

Selecting Files and Colors

You are going to be combining spreadsheet files for you, your parents and your full siblings if you don’t have both parents.

The file you want to combine is the file that shows your chromosome matches to other participants. When you download results from Family Tree DNA, there are two files titled:

  • Family Finder Matches
  • Chromosome Browser Results

The chromosome browser results file is the one you want and includes the following information.

sides header

Select the Chromosome Browser file to work with that holds your results and save it with a title something like “DNA Master Spreadsheet.”  That’s the file you’ll be adding to for the duration…meaning forever.

Before proceeding, I want you to think for a minute about coloration.  You’re going to color different family members’ results different colors so you can recognize them at a glance and so that sorting and discerning matches is easier.

In my case, I left my rows as white. I colored my Mom’s file pink and while I don’t have a father at Family Tree DNA, he would be colored blue if I did.  This makes it easy for me to see who is who and it’s intuitive for me.

If I was utilizing full siblings, I would likely color them in some way that makes sense but is easily distinguishable from the parents. Maybe sisters would be shades of pink and brothers would be shades of blue.  Whatever you select, make sure it makes sense to you.

Next, you’re going to create the master spreadsheet, and you WILL write down the legend.  Now you may think you’ll remember, but one time I copied additional matches into my spreadsheet and I inverted Mom’s and my colors, pink and white, and it was never right again.  That’s actually part of why I’m “starting over.”

Creating a Master Spreadsheet

Open your spreadsheet (now titled DNA Master Spreadsheet) and color the relevant rows in your color, unless your row color is white, then do nothing.

Open your parent’s spreadsheet(s) and color their rows appropriately.

sides mother

Here’s an example of Mom’s.

You are now going to copy and paste the entire set of information from your mother’s spreadsheet into your spreadsheet to make one combined spreadsheet. Do NOT do this until AFTER the rows are colored.

If you have both parents, repeat this same process for your father’s results after they are colored.

If you have both parents, you don’t need your siblings files because your siblings only inherited part of your parents DNA, and you already have both parents.

If you don’t have BOTH parents, then you’ll add your FULL siblings. Half siblings will be used later for another step, but NOT here because you can’t differentiate easily between what part of their DNA is from your common parent (especially if you share the “missing” parent) and perhaps from their other parent’s side.

If you are utilizing full siblings, then copy their information into the master spreadsheet as well – but not until AFTER it’s colored.

On another spreadsheet tab titled “Legend”, I recorded the following information:

sides legend

Do not neglect this step or you will one day be very sorry!  Voice of experience here.

A Bit of Housekeeping

Because my descendants (children, grandchildren) only received their DNA from me (and their father, ) I removed their results from this spreadsheet. Their DNA is not helpful for identifying MY ancestors.  I also removed the segments where mother and I match each other because they are irrelevant.  It won’t hurt anything if you skip this step.  It just reduces the size of your spreadsheet a bit. 

A Parentally Phased Spreadsheet

You have just created a parentally phased spreadsheet.

Isn’t this exciting?

Now, how does this work?

If you are not familiar with the terms, identical by descent (IBD), identical by population (IBP) and identical by chance (IBC), or need a refresher, this would be a good time to read the “Identical By…” article.

Time to Make A Decision – To Delete or Not

We’re going to be using the terms centiMorgans abbreviated cM and SNPs.  If you’re not familiar with these terms, or would like to review information about using small segments, it would be a good time to read the concepts article about CentiMorgans and SNPs.

Some people remove segments from their spreadsheet below a specific cM size.

I don’t, but my goals may be different than yours. I want to know every single thing possible.  I also participate in the research aspect of genetic genealogy, so if I delete segments of any size, I’m deleting information that may be useful in one way or another, so I don’t delete.

You may not be interested in research, so let me share with you some rules of thumb.

I did a small study on parentally phased matches. You can read about the results in “The Threshold Study” section at the end of this article.

Suffice it to say that when I studied four families of three generations each of non-endogamous families, there seemed to be a cutoff at about 3cM/500 SNPs where segments below that level did not reliably phase for three generations in the same family, and segments above that tended to phase. By phasing, I mean the segment was passed from a grandparent, to a parent, to a grandchild intact.  If you need a refresher about parental phasing, you can read about that here.

On the chart below, from that article, green means the segment phased in all upstream generations and red means that it did not.  The black bar is about where the “reliable phasing line” occurred.

4 family phasing

In one case, in a fifth study, below, I had four generations to work with, and the same threshold seemed to work. 2, 3 and 4 match means that’s how many generations were upstream.  If the segment didn’t match on any upstream individual, it’s counted as a nonmatch.

4 gen phasing

What is the take home message here? If segments don’t even phase reliably within families, they aren’t going to be reliable elsewhere either.

So, unless you’re interested in research, like I am, then you could safely delete any segment below 3cM.

Other genetic genealogists who have been working with triangulated segments a long time use 5cM as a cutoff in non-endogamous populations. I wouldn’t delete segments larger than 5cM, but some do.  Look at it this way, larger segments put the relationship closer in time.  Smaller segments are further away.  If you’re an adoptee and you really only care, for now, about close relationships, then fine, delete as much as you want. But if you’re looking for colonial American ancestors, you might want to consider keeping those smaller segments, at least the ones over 3cM at 500 SNPs, which is the lowest number of SNPs reported by Family Tree DNA.

If you are going to delete, now is the time. Simply sort your spreadsheet by cM size and delete all the rows you don’t want.

Be SURE you know how to sort the entire spreadsheet and not just one column, because if you sort just one column, the rest of the data stays in place which means the rows are all messed up – as in forever.  (Highlight only the column header and sort.  Do not highlight the entire column.)

I’ll close my eyes while you delete!

Different Kinds of Matches Mean Different Things

You will see different types of matches as you work through your spreadsheet.  Don’t do anything to your spreadsheet yet – read this next section first.

Matches if You Have Only One Parent

  • Matches to you only and not your parent – this means they match to your other parent or are IBC.
  • Matches to your parent only and not to you – this probably means you didn’t receive that DNA from your parent (or it’s IBC) but this match is still genealogically very valuable to you.
  • Matches to both you and your parent – this is a phased match meaning you received the matching DNA from that parent because the person matches both you and your parent ON THE SAME SEGMENT.  Why is “on the same segment” capitalized?  Because you can match the same person on different segments through different parents.  Yea, I know, cruel joke!
  • Matches both you and your parent, but not on any common segments – this means your match is either to the other parent, IBC or we’re dealing with an anomaly.  In some cases, a single matching segment has become split into two due to a read error.

Matches if You Have Both Parents

  • Matches to one or both of your parents – You received the matching segment of DNA from the parent whom the other person matches as well. If you are from a highly endogamous population, expect that several of your matches will match you and BOTH parents, potentially on the same segment.  That means your parents shared a common ancestor at some point in time.
  • Matches to your parent(s) and not to you – this means that you did not inherit that DNA from your parents. These are still very valid genealogically relevant matches for you because they match your parents.
  • Matches to only you and neither of your parents – this means the match is either IBC or you have barely missed the matching threshold due to an anomaly. I would label these as suspicious (IBC?) until I could look at them individually and they would be the last matches I worked with.

Sibling Matches with One Parent

If you have full siblings and one parent, you can have the following matches:

  • Your matches match you, at least one sibling and one parent on the same segment. This means that the match is from that parent’s side of your tree, at least on that segment.
  • Your matches match you, at least one sibling and does not match your one parent. This means that the match is from the missing parent’s side of the tree or you and your sibling are identically IBC.

Sibling Matches, No Parent

  • Your matches match you and at least one sibling on the same segment.  This means that you inherited this DNA from a common parent or the segment is identically IBC.
  • Your matches match you and none of your siblings. If you have only one full sibling, this might happen about 25% of the time, but the more siblings you have, the lower the possibility that a match won’t match any of your siblings. This could indicate an IBC segment.  If you know who your match is, for example, a first cousin on your father’s side, and they match you and your sibling(s), that segment of DNA is very likely from your father’s side.

Let’s Start Matching

You are going to sort (not filter) your spreadsheet by column four separate times, in the following column order:

  • End Location
  • Start Location
  • Chromosome
  • MatchName

What this gives you is a spreadsheet sorted by match, but within match the spreadsheet is sorted by chromosome, start and end position, in that order.

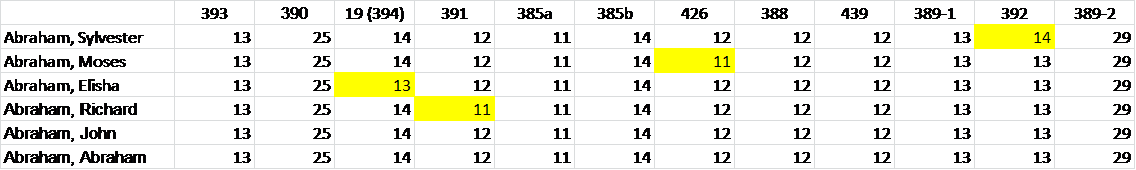
Here are my first two matches.  You can see that they are in chromosome order, smallest to largest, for each matching individual.

Sides matches

Since there are no pink interspersed rows, neither of these two people match my mother, so they are either from my father’s side or are IBC. To have an IBC match of 23.73 cM would be highly unusual.  I have seen non-parentally phased segments as high as 8cM which indicates an IBC match, but that’s unusual and I’ve only seen it once.

Add Columns

Add four columns to the right of Matching SNPs column labeled:

  • Side
  • Triangulated
  • Tree
  • Relationship
  • MRCA (Most Recent Common Ancestor)
  • Comments

sides add columns

Some people retain a lot more information in the spreadsheet, such as e-mail address and a communications history other than in comments. I don’t, but you may want to.

Now you’re ready for the fun stuff!!!

Assigning Sides

You’re going to work your way through the entire spreadsheet (after you’ve sorted as per the instructions above) and you’re going to identify the “side” that your matches fall on, as best you can.

Do NOT, and I really mean do NOT assume. So if you see a surname you just KNOW matches one side of your family, do NOT assign it a side unless:

  • you know that person and how they match
  • they match your parent or close relative

When I did this step, I had 10 sure foolers that would have been WRONG if I had made that assumption.  Don’t fall into that trap.

Let me give you two quick examples.

One of my mother’s surname lines is Lore which is spelled a variety of ways, including Lohr.  There was a Lohr male, but he did not match my mother, so he is clearly not from her side.

There is an other individual with the surname Dotson, which is one of my father’s lines, but she matches both me and my mother.

No assuming allowed!  Thank goodness for tools.

A Phased Parent Match

sides phased parent

Here’s what a phased parent match looks like. You can see that Alfred matches me and Mom both on at least some of the same segments.  This firmly puts this individual on “Mom’s side.”  In the column labeled “Side,” type Mom.

Let’s take a minute and look at this match, row by row.

sides phased parent segments

The rows where Alfred matches my mother but not me are shown in yellow in the chromosome column. This means that either I didn’t inherit those segments, or they were IBC matches.

The rows colored green are the segments where Alfred matches both mother and me.  That’s a respectable size segment, so very unlikely to be IBC and probably inherited from a common ancestor.

The rows colored red are where Alfred matches me, but not mother, meaning these segments are NOT parentally phased. If you look at the segment size, all of these with one exception are below 3cM, so would have been deleted if you are deleting small segments.

There is also a possibility that Alfred matches me and not Mother on some segments because he could ALSO match me on my father’s side. In my case, it’s very unlikely because my parents have very different geographic ancestry, but it’s not entirely impossible and we always need to keep that possibility in mind.

So, while I’m labeling this person, Alfred, as a match on Mom’s side, each segment always needs to be evaluated on their own merit when you’re actually evaluating the strength of matches. We’ll cover that in a later article.  For today, we’re just assigning “sides” based on parental and identified relative matches.

In case you’re wondering, I selected the colors for these segment matches utilizing stop light colors.  Green is go, a good match, red means stop, no phased match and yellow is “OK,” not green and not an alert.  Both yellow and green are genealogically relevant to you.  Red is not, at least not relative to this parent.

If a person doesn’t match BOTH you and your parent, do NOT label the side at all.

In other words, just because that person doesn’t match you and your Mom doesn’t mean they are from your Dad’s side. Yes, I know this is counter intuitive, but they could also be IBC (identical by chance) and someplace between 10 and 20% of your matches will indeed be IBC.  So we are ONLY assigning sides when we are positive.

If you have full siblings in the spreadsheet as well, (because you have only one or no parents) you will have additional colored rows. If your sibling matches you, your mother and Alfred, for example, just type Mom for your siblings “side” as well if they fall into this grouping.

I don’t have a full sibling, but here’s an example of what a match between Alfred, me, mother and my full sibling would look like.

sides sibling

If a match matches you and one of your parents, but not on any overlapping segments, I put a Mom? in the “side” column to indicate that the person does match both me and Mother, but the match needs additional inspection. This happens very rarely, but I do see it occasionally, example below.

sides parent no common segments

How Well Does This Work?

Using this technique, I was able to label a total of 7139 spreadsheet rows as Mom’s side. Remember, you’re labeling BOTH your Mom’s and your common matches (the pink and white, above,) so you can’t just sort the “side” column for “Mom” and count to see how many of your rows you labeled.

Some people only label their (white) rows with the “Mom” label. It does make sorting easier, but I label both Mom’s and mine because I want to easily see on Mom’s grouping which ones also match me.  Therefore, I label both Mom’s and my rows “Mom” when we share a common match.

Filtering vs Sorting

Sorting columns sorts the column from either highest to lowest or lowest to highest and shows you all of the data in all of your rows.  Filtering allows you to view just selected data, not displaying the rest.  Filters can be layered so that you can filter one column, then filter another column for a smaller subset.

To find just my rows that were labeled Mom, I filtered the “side” column by the cell value of Mom – which shows me all the rows with the value of Mom in the “side” column – and just those rows.  There are both pink and white rows showing.

To utilize filtering, when you only want to see a specific subset of data, click on “filter” under “Sort and Filter.”

sides filter

Now we’re going to add a second filter by clicking on the down arrows by the column header we wish to filter.

sides filter selection

I filtered the name column for Roberta Estes, which shows you only the rows with “Mom” that also have Roberta Jean Estes in the Name column.  This then gives you the total number of rows that have BOTH Mom in the “side” column and Roberta Estes in the “name” column. (Hint, when using filters, don’t forget to clear the filter after you complete your function.  Otherwise, you’re only working with the filtered set of data and you may think you’re working with the entire spreadsheet.)

That total, visible at the very bottom of the page after filtering, is 3532.

sides total assigned 2

So, of my total rows of matches, 3532 of my 16,861 rows of matches are phased to my mother’s side, or 21%. That means the balance are either my father’s side or IBC.  Given that my mother had only about one third of the matches I did, 21% isn’t bad.

Next we are going to work with our known cousins whom we match in the spreadsheet. This works whether you have parents and/or siblings in your spreadsheet or not.

A Phased Cousin Match

Even if you don’t have parents to match, you’ll hopefully have matches to known cousins, aunts, uncles, etc.. This is why we encourage genetic genealogists to test everyone they can find who will test.  (The exception is that if your aunt tests, you don’t need her children to test – but you do need her siblings.)

This is exciting, because based on where your relative falls in your tree, you can assign them to the proper side of your family.

sides phased cousin

In this case, while my father is not available for testing, I know this individual and we are second cousins, so there is no question which “side” this match is from, especially since they don’t also match my mother. If I have full siblings, they probably match AP as well and you would see their colored rows interspersed in this match too.

Go back through your spreadsheet and assign positively identified cousins and family members from your non-phased parents side.  In this case, people who I know positively are related to my father I’ll label Dad, because this person matches me on my father’s side of the tree.

Finish your entire combined master spreadsheet in this manner.

I was able to add 501 rows to my spreadsheet positively identified as my father’s side utilizing this methodology. This gives me a total of about 3% of my total spreadsheet rows.  Not nearly as high as my mother’s side, but we’re no place near finished.

You might wonder how many people I had to work with on my father’s side. I had a total of 30 positively identified individuals.  The closest to me was a 1st cousin once removed, and several that were quite distant.  I have sponsored tests for about half of these individuals. The rest, I got lucky.  I didn’t know most of them before I took up the hobby of genealogy.  Several, I met through DNA testing.

With my mother and known cousins, I was able to identify about 25% of my matches to one side or the other, even without my father’s DNA. That’s pretty remarkable, especially given that my mother has so many fewer DNA matches than me.

Lesson Summary

Here’s a summary of what we’ve accomplished.

  • Created a spreadsheet with all of your chromosome matches, with your rows colored white.
  • If you have a parent, add their chromosome matches to the same spreadsheet, after coloring all of their rows appropriately. I suggest pink for Mom and blue for Dad.
  • If you don’t have both parents, but do have full siblings, add their chromosome matches into the spreadsheet, after coloring their rows with a specific color.
  • Delete small segments if you wish.
  • Sort your spreadsheet into match order.
  • Review all of your matches and label the matches that match you and either parent with the appropriate side.
  • Review matches with known family members and assign the appropriate “parental side” to that cousin match.

Have fun!

Next Article

In the next article, we’ll create match groups and figure out who is related to whom.

______________________________________________________________

Disclosure

I receive a small contribution when you click on some of the links to vendors in my articles. This does NOT increase the price you pay but helps me to keep the lights on and this informational blog free for everyone. Please click on the links in the articles or to the vendors below if you are purchasing products or DNA testing.

Thank you so much.

DNA Purchases and Free Transfers

Genealogy Services

Genealogy Research

Concepts – Downloading Autosomal Data from Family Tree DNA

In the new Concepts series titled Managing Autosomal DNA Matches, we’re going to be working with your DNA information from several sources. In order to create matching spreadsheets, you’ll need to download your autosomal information from Family Tree DNA.

Sign on to your account and click on “Matches” under the Family Finder section. You can reach this section by either clicking on the “myFTDNA” link in the upper left corner, or by clicking on the Matches option shown on your main page.

download 1

We’ll be downloading two files.

File 1 – Family Finder Matches

The first file is a list of your matches. That file download link is found at the bottom of your match page in the lower right hand corner.

download 2

Click on either orange button.

A file will download.  I create a file folder by date and save by download date.

On a Windows PC, you’ll be given the option of downloading and saving to the location of your choice.

download 7

The file contains a list of your matches along with other relevant information.

download 3

You can click on the graphic above to enlarge. Match information includes name, e-mail, match date, relationship range, suggested relationship, total shared cM, longest block, haplogroups and ancestral surnames.

File 2 – Chromosome Browser Results

The second file you’re going to download is your file that contains the matching segments with all of your matches.

To find this link, you’ll need to select someone, anyone, to compare in the chromosome browser.  We just need to get to that page, so who you select doesn’t matter.

This is my mother’s account, so I’m selecting me to compare.

On the dropdown box below the picture, select “compare in chromosome browser.”

download 4

Family Tree DNA will then add me to the list of people to compare.  You could select 4 more, but in this case, we simply want to get to the results page, so click on the big blue compare button.

download 5

Hint:  If you aren’t actually comparing people, you can take the shortcut to the Chromosome Browser by clicking the Chromosome Browser button beside the match button in the middle of your main page.

download 1

Regardless of which way you get to the top of the Chromosome Browser page, at the top of the chromosome browser page, you will see three options.

download 8

The first option, on the left will only download the matches currently showing in the chromosome browser.  In this case, it would be only for me and mother.

The second option shows the same data in a table.

You’re not interested in either of those two options. You want to click on the third option, on the far right, “Download All Matches to Excel,” which will produce a file with the following information for all of your matches.

download 6

This file shows you the matching information on each chromosome location for every one of your matches.  We’ll be using this information to group relevant matches in the next article.

When you’re ready to download the files from Family Tree DNA to your computer, do the download for all people involved on the same day, at the same time, so that their results will be in sync.

Preparing for the Managing Autosomal DNA Series

For the first part of the Managing Autosomal DNA Matches series, you’ll want to download your results and those of your parents or parent, as described above. If you don’t have living parents, you’ll want to download the files of your siblings.  If you have one or both parents, you don’t need the files of your siblings.

By the way, if you’re lucky enough to have grandparents who have tested, by all means, we need their file too.

This series also presumes at least a rudimentary working knowledge of Excel.  Specifically you’ll need to know how to sort correctly (meaning sort the entire spreadsheet, not just a specific column) and how to colorize cells.

You may want to refer to training videos for Excel including “Twenty with Tessa, Tips and Suggestions for Spreadsheets” which is focused on using spreadsheets with one name studies and genetic genealogy, but the principles are the same.  https://www.youtube.com/watch?v=Ll_cfhOZTl0&feature=youtu.be

I have not taken this class, but some have joined www.lynda.com and taken the basic Excel class which they found very useful.

Transferring Results from Ancestry and 23andMe

For the next step, you’ll need your results and those of both or either of your parents at Family Tree DNA.

If you have tested your parents or siblings at Ancestry (before the middle of May 2016) or at 23andMe on the v3 chip (before November 2013), you’ll want to transfer their files to Family Tree DNA, assuming they have not already tested at Family Tree DNA.

The transfer is free, but it costs $39 to unlock the file.  That’s a lot less than retesting.  It takes a few days to process, so do the transfer now so that you’ll have their results. To be clear, we need your results and those of either or both of your parents at Family Tree DNA for the first article.  If you have both parents, that’s the ideal situation.  If not, one parent will do.  If you have grandparents, by all means, we need them too.

Having said that, in future articles, we will also be working with other known relatives, such as uncles, aunts, cousins, etc.  If you have tested other known relatives elsewhere, now would be a good time to transfer their results as well, although we won’t utilize their information in the first article.

______________________________________________________________

Disclosure

I receive a small contribution when you click on some of the links to vendors in my articles. This does NOT increase the price you pay but helps me to keep the lights on and this informational blog free for everyone. Please click on the links in the articles or to the vendors below if you are purchasing products or DNA testing.

Thank you so much.

DNA Purchases and Free Transfers

Genealogy Services

Genealogy Research

Concepts – Y DNA Matching and Connecting with your Paternal Ancestor

Recently, I received a question about exactly how and why we can use Y DNA to identify or connect with a patrilineal ancestor.

“I do not quite understand how the profiles can be identified specifically to an ancestor since that person is not among us to provide DNA material for “testing” and comparison.”

That’s a great question.

Let’s look at the answer in steps.

Males Inherit the Y Chromosome from Dad

First and foremost, and the most important part of using the Y chromosome for genetic genealogy is understanding that the Y chromosome is passed from father to son without any DNA being incorporated from the mother. So, in essence, the Y chromosome is passed intact.

In most western cultures, the surname is passed utilizing the same inheritance path, so the Y DNA and the surname are passed along together – hence Y DNA projects are often called surname projects. If the Y DNA is passed from father to son, without any unexpected nonpaternal events or adoptions in the mix, then the surname and the Y DNA will match since the advent of surnames in the culture where the original ancestor that adopted that surname was born.

Let’s look at England for example. Often people there adopted surnames after the Norman invasion (1066) and by the 1200s, most people had surnames.  Of course, there weren’t a lot of records for normal working-class people at that time, but by the time church and parish records started to be more reliably kept, in the 1580s, give or take, surnames were well established and everyone had one.  John who lived on the green was now John Green and John who lived by the brook was now John Brook.  Their sons took their surnames upon birth in a traditional marital relationship.

Y and mito

Therefore, the Y chromosome is passed from male to male, father to son, forever, illustrated by the blue squares in the pedigree chart above…with the Y DNA almost entirely intact.

Mutations Happen – Whenever

Did you catch that word, “almost?”

Yea, it’s a “gotcha” word, but it’s also why genetic genealogy works. If it weren’t for occasional mutations, all of the Y DNA would be exactly the same, and not at all useful for genealogy.  Thankfully, that’s not the case.

From time to time, a mutation occurs as the DNA is passed from father to son.  We see the results of this inheritance and mutation pattern in the DNA markers we test for genetic genealogy.

The markers we typically use for genetic genealogy are called STR, Short Tandem Repeat, markers. They are the 12 marker, 25, 37, 67 and 111 marker panels tested by Family Tree DNA.

These types of markers mutate more rapidly than the other type of Y DNA markers typically used to determine haplogroups, known as SNPs, Single Nucleotide Polymorphisms.

STRs and SNPs

There are two primary differences between STRs and SNPS relative to genealogy.

The first difference is that STR mutations are what I call stutter or repeat mutations. Think of a copy machine that got stuck.  Let’s say your DNA at a location, meaning at a specific marker, looks like this: “TAGA.”  However, when the copying of that DNA for the next generation was done, 20 or 30 or 40 generations ago, long ago in a faraway place, the copy mechanism got stuck and now you have 5 “TAGA”s in a row, so “TAGATAGATAGATAGATAGA.”  Now you have a value of 5 instead of a value of 1 in that marker location.

SNP mutations, on the other hand, occur at one location and are defined by one of the nucleotides, T, A, C or G that live in that location getting swapped for a different nucleotide. So, now, at that particular address, T becomes C.  That’s a single nucleotide polymorphism and those changes are how haplogroups and their branches are formed.  If you are interested, you can read more about haplogroups and how they are born here.

In addition to switches between nucleotides, you can also have insertions of DNA and deletions of all DNA where the value becomes 0, but for now, let’s leave it at STRs and SNPs. I wrote a detailed article about SNPs and STRs here.

Oh yes, and as one final bad joke, the mutations, occasionally, revert back – that’s called a back mutation. I know, it’s a really bad joke, meant, I’m sure to confound genetic genealogists.  And the only way you’re ever going to discover a back mutation is through known genealogy when you see it occur in a line.  Just remember, mutations can happen anytime they want to – on any marker – in either direction – and sometimes in increments of more than 1.  So, a marker value can go from 10 to 12 in one event, for example.

Some STR markers are more prone to mutations than others, and those are known as slow or fast moving markers.

STR fast and slow

The project pages color code each marker in the column header as to its known characteristics relative to mutation speed.

STR color legend

The legend above, from the Family Tree DNA Learning Center provides the color coding for the column header values.  Fast in any group = red.

The second difference between STRs and SNPs is that STR mutations happen more frequently than SNP mutations, making them useful in a genealogically relevant timeframe, where SNPs happen much less frequently, and are therefore utilized to determine and identify haplogroups and haplogroup branches, meaning deeper genealogy, generally before the adoption of surnames.

Having just said that, the timeframe of SNPs and STRs is beginning to overlap, but STRs are still the gold standard of genealogy testing to compare men born within the past few hundred years, especially with a common surname.

In genealogy testing, you always start with STR testing and then progress to SNP testing, if you wish.

Marker Comparisons

So, let’s take a look at how STR marker comparisons work in a hypothetical example.

Let’s say, for example, that we have 6 sons of Abraham Estes who died in 1712. Descendants of those sons have tested their Y DNA and sure enough, they have some mutation differences between them.  This would be expected in the 7-9 generations between when Abraham lived and the current generation testing.

Let’s say that all 6 of Abraham’s sons matched his STR markers exactly back then, but in the 7-9 generations between Abraham and the present day testers, one mutation has occurred in each of 4 lines on a different marker. Two of his son’s lines have not had any mutations at all.

Of course, we don’t know this before we evaluate the DNA. It’s the marker values themselves that will inform us about Abraham’s DNA.

STR mismatch example

In our example, Abraham’s six sons’ lines tested, as shown above. All of their markers match each other, except one marker in each of 4 mens’ tests, highlighted in yellow above.

How do we know those are mutations? Because the majority of the results from the other sons lines are all the same.  Therefore, we can utilize the DNA of the 6 different son’s lines to determine the DNA of Abraham at each one of those different marker locations.  So, let’s reconstruct Abraham’s values for these markers.  Isn’t this fun!!!

STR Abraham reconstruction

The green row at the bottom is reconstructed Abraham. We know the value of each marker based on the common values of his sons’ lines.  The only place the sons and their descendants could have gotten that DNA was from Abraham, the common ancestor of all of these 6 men.

So, with marker 393, all 6 sons lines have a value of 13, so Abraham had to have a value of 13 as well.

On marker 19 (394), all the different sons lines, except one, Elisha, had a value of 14, so Abraham’s value was 14 and Elisha’s line in a generation someplace between Abraham and the current tester has developed the mutated value of 13.

Line Marker Mutations

It’s possible that some of these markers are known as or can function as “line marker” mutations – identifying specific son’s lines. Let’s say, for example, that a mutation occurred between Abraham and Moses at location 426 such that Moses has a value of 11.  That means that every one of Moses’s sons would have had a value of 11 at 426, as opposed to the value of 12 present in Abraham’s other sons at that marker.  Therefore, if someone tests who doesn’t know which of Abraham’s son they descend from, and they have a value of 11 at 426, I’d start by looking at Moses.  That isn’t to say that same mutation couldn’t have happened in another line too, but Moses is still a good place to begin since we know his line has 11 at 426.

Of course the only way to learn that information about Moses, positively, is to find men who descend from each of his sons and recreate Moses in the same way we recreated Abraham.

What About False Paternity?

Let’s say that an Estes male who had an undocumented adoption occur 3 or 4 generations upstream in his Estes line tests – and he is entirely unaware that an “adoption” happened. I define an undocumented adoption in this context, also known as a nonpaternal event (NPE) or false paternity, as any event that causes the surname of record to be different than the biological surname.  The biological surname is that of the man who contributed the Y DNA.  These events, although often thought of negatively are sometimes very positive and loving – such as adoption.  Of course, some are less positive, but one can’t assume in either direction without evidence.  In my experience the most common historical reasons for a mismatch between surname and biology is that a child took his step-father’s surname or that the child was born out of wedlock and took their mother’s surname.

Reasons for a mismatch between surname and biological paternal lineage can be:

  • Adoption (contemporary or historical)
  • Sperm donor
  • Stepson taking step-father’s surname
  • Mother pregnant outside wedlock and child takes mother’s surname
  • Name change
  • Accepted multiple intimate partners (think wife-swapping or polygamy)
  • Culturally ignored multiple intimate partners (think slavery)
  • Infidelity
  • Rape

Let’s say in our example that our tester’s ancestor was born to an Estes female out of wedlock.  The illegitimate child took the mother’s Estes surname – but carries the Y chromosome of his father whose surname is not Estes. Today, several generations later, the tester carries the Estes surname handed down to him through several generations of Estes males, so his presumption, of course, is that he also carries the ancestral Estes Y DNA.  But he, ahem, doesn’t.

His test results come back and the first clue is, of course, that he doesn’t match any Estes men on his results page. He reaches out to me as the Estes project administrator, and I compare his results with Abraham to see how distant his results really are.  And the answer is….drum roll…pretty darned distant.  His results are shown in the row below green Abraham.

STR false paternity

As you can see, when compared to reconstructed Abraham, it’s quite obvious that the new Estes tester is biologically not an Estes on his Y DNA. In fact, he has a genetic distance of 7 out of 12 markers, so very clearly not a match.

How Many Mutations Is Too Many?

Family Tree DNA has set up Y DNA matching thresholds at levels that include relevant matches and exclude non-genealogically relevant matches.  For someone to be listed as your match, they need to have no more than the following total number of mutations difference from your results on any given panel.STR Match mutations

Depending on where your mutations fall, in which panels, you can have too many mutations to match at 25 markers, for example, but match at 37 or 67 because more mutations are allowed, and your mutations just happened to fall in the first panel or two.

The number of mutations allowed is the same as genetic distance.

What is Genetic Distance?

You’ll notice on the Y DNA matches page that the first column says “Genetic Distance.”

STR genetic distance

Many people mistakenly assume that this is the number of generations to a common ancestor, but that is NOT AT ALL what genetic distance means.

Genetic distance is how many mutations difference the participant (you) has with that particular match. In other words, how many mismatches in your DNA compared with that person’s DNA.  Looking at the example above, if this is your personal page, then you mismatch with Howard once, and Sam twice, etc.

Counting Genetic Distance

Genetic distance, however, can be counted in different ways, and Family Tree DNA utilizes a combination of two scientific methods to provide the most accurate results. Let’s look at an example.

In the methodology known as the Step-Wise Mutation Model, each difference is counted as 1 step, because the mutation that caused the difference happened in one mutation event.

STR genetic distance calc

So, if marker 393 has mutated from 12 to 13, the difference is 1, so there is one difference and if that is the only mutation between these two men, the total genetic distance would be 1.

However, if marker 390 mutated from 24 to 26, the difference is 2, because those mutations most likely occurred in two different steps – in other words marker 390 had a mutation two different times, perhaps once in each man’s line.  Therefore, the total genetic distance for these two men, combining both markers and with all of their other markers matching, would be 3.

Easy – right?  You know this is too easy!

Some markers don’t play nice and tend to mutate more than one step at a time, sometimes creating additional marker locations as well.  They’re kind of like a copy machine on steroids. These are known as multi-copy (or palindromic) markers and have more than one value listed for each marker.  In fact, marker 464 typically has 4 different values shown, but can have several more.

The multiple mutations shown for those types of multi-copy markers tend to occur in one step, so they are counted as one event for that marker as a whole, no matter how much math difference is found between the values. This calculation method is called the Infinite Alleles Mutation Model.

str genetic distance calc 2 v2

Because marker 464 is calculated using the infinite alleles model, even though there are two differences, the calculation only notes that there IS a difference, and counts that difference as having occurred in one step, counting only as 1 in genetic distance.

However, if one man also has one or more extra copies of the marker, shown below as 464e and 464f, that is counted as one additional genetic distance step, regardless of the number of additional copies of the marker, and regardless of the values of those copies.

STR genetic distance calc 3 v2

With markers 464e and 464f, which person 2 carries and person 1 does not, the difference is 17 and the generational difference is 1, for each marker, but since the copy event likely happened at one time, it’s considered a mutational difference or genetic distance of only 1, not 34 or 2. Therefore, in our example, the total genetic distance for these men is now 5, not 8 or 38.

In our last example, a deletion has occurred, which sometimes happens at marker location 425. When a deletion occurs, all of the DNA at that location is permanently deleted, or omitted, between father and son, and the value is 0.  Once gone, that DNA has no avenue to ever return, so forever more, the descendants of that man show a value of zero at marker 425.

STR genetic distance calc 4 v2

In this deletion example, even though the mathematical difference is 12, the event happened at once, so the genetic distance for a deletion is counted as 1. The total genetic distance for these two men now is 6.

In essence, the Total Genetic Distance is a mathematical calculation of how many times mutations happened between the lines of these two men since their common ancestor, whether that common ancestor is known or not. In fact, we use genetic distance as part of our calculations to attempt to discern when that common ancestor lived, if we don’t know who he was.

One of the reasons that mutational difference (genetic distance) is important is because the TIP calculations utilize the number of mutation events, and the estimated time between mutation events, to determine the range of dates and confidence levels for the time to the most recent common ancestor (MRCA) calculations between any two matching men.

Please note that on July 26, 2016 Family Tree DNA introduced changes in how the genetic distance is calculated for some markers to be less restrictive.  You can read about the changes here.

How Often Do Mutations Happen?

A very common question about STR mutations is “how often do mutations happen?”

A mutation can happen any time. I have seen 2 mutations between a confirmed father and son, and I have seen 8 generations elapse with no mutations.  So, in essence, mutations happen whenever they darned well feel like it.  In reality, the time between mutations varies widely, but we can calculate the average and utilize that number.

Family Tree DNA provides us with an estimation tool, called the TIP calculator. You can see the orange “TIP” icon listed with each match below.

STR TIP

You use the calculator to compare the results of any two men who match each other to estimate the probability of when they shared a common ancestor.

STR TIP input

The TIP calculator estimates number of generations at various confidence levels between any 2 matching men. However, please keep in mind that the TIP calculator has to use statistical averages, which is equivalent to “one size fits all.”  In truth, one size doesn’t fit anyone particularly well, and some people not at all,  but it’s the best we can do.

STR TIP output

In this case, these two men being compared are 3 mutations different at 111 markers, and they are proven genealogically to be 8.5 generations apart, counting the parent as generation 1, and counting Abraham Estes as generation 8 for one man and 9 for the other.

So, you can see, at the 50th percentile, where statistically you are as likely to be incorrect in one direction as the other, the estimate is about 4.5 generations.

The TIP calculator is sometimes very accurate, and sometimes not so much. It’s a tool, not a crystal ball.  Don’t we wish we had that crystal ball…oh yes…and a time machine too!!!

In Summary

Utilizing Y DNA to compare your family’s Y DNA to others is a wonderful genealogical tool. DNA testing is becoming an expected part of the Genealogical Proof Standard, an integral part of a “reasonably exhaustive search.”

You can prove, or disprove, your lineage. You can find your biologically accurate line.  You can combine the results of several descendants to recreate your ancestor, and then identify line marker mutations that will help other testers in the future identify their lineage.  You can test even further, if you want, and explore all of the possibilities of deep ancestry.

Furthermore, having reconstructed your ancestor, when you do finally hit that “Holy Grail” and a male who lives in the small village overseas where your ancestor originated tests his DNA – and matches your ancestral DNA values – you’ll know that the match is genuine – and you can claim them as “yours.”

Even though Y DNA testing can only be performed on males, because only males carry the Y chromosome, females can most certainly participate by recruiting appropriate males and sponsoring tests on their ancestral lines. Lack of a Y chromosome doesn’t stop anyone, just maybe slows you down for just a tad!

Have fun, enjoy, test your Y DNA lines, contact your matches and make your ancestor come alive once again through the legacy of what your ancestor left to you…their, now your, DNA.

______________________________________________________________

Disclosure

I receive a small contribution when you click on some of the links to vendors in my articles. This does NOT increase the price you pay but helps me to keep the lights on and this informational blog free for everyone. Please click on the links in the articles or to the vendors below if you are purchasing products or DNA testing.

Thank you so much.

DNA Purchases and Free Transfers

Genealogy Services

Genealogy Research

Concepts – Parental Phasing

I recently used a technique called parental phasing as part of the proof that one Curtis Lore found in Pennsylvania was the same person as Curtis Benjamin Lore, found later in Indiana.  Given that I’ve already used parental phasing as part of a proof argument, I’d like to break it down further and explain the concepts behind parental phasing, what it is, why it is so important, and why it works so well.

For those of you who don’t have at least one parent available to test, I’m truly sorry, and not just because of the lost DNA opportunity. But please do read this article, because you may be able to substitute other family members and derive at least some of the benefits, although clearly not all.

What is Parental Phasing?

The fundamental concept of parental phasing is that the only way you can obtain your DNA is through one or the other of your parents, so every one of your matches should match you plus one of your parents. Right?

Should, yes, but that’s not exactly how autosomal matching works in real life.

You can match someone in one of two ways:

  1. Because you received the matching segment from one of your two parents, and they received that same segment from one of their two parents, a circumstance that is called identical by descent or IBD.
  2. Because your match’s DNA is zigzagging back and forth between the DNA you inherited from both of your parents, or your DNA is zigzagging back and forth between their parents, either of which is called identical by chance or IBC.

I wrote about his in the article titled, Concepts – Identical by…Descent, State, Population and Chance.

Here’s the matching “Identical By” cheat sheet since you may find it helpful in this article as well.

Identical by Chart

How Does Parental Phasing Work?

Parental phasing works by comparing your DNA against your matches DNA, then comparing your matches DNA against your parents DNA, and telling you which, if either, or both, parents they match in addition to you. Oh yes, and there’s one more tiny tidbit – they must match you and your parent(s) on the same segment(s).

As bizarre as it sounds, sometimes your match will match you on one segment, and match your parents on an entirely different segment.  While this was not an expected finding, it does happen, and frequently enough that it was found in every parental phasing test run – so it’s not an anomaly or something so rare you won’t see it.

Therefore, parental phasing may be a two part process, where:

  • Step 1 is determining whether or not your match matches either or both of your parents.
  • Step 2 is determining if your match matches you and your parent on the same segment(s), or at least part of the same segment? If not, then it’s not a phased IBD match – even though they do match you and your parent.

Conceptually, each of your matches will fall nice and cleanly into one, or both, of your parent’s buckets. Let’s look at a couple of examples.  For each of the people who match you, they will also match your parents on the same segment as follows:

Match Matches Your Mother Matches Your Father Matches Neither Parent Comment
Susie Yes No From Mom’s side, IBD
John No Yes From Dad’s side, IBD
Bob Yes Yes Matches both parents lines, IBD and may be IBP
Roxanne No No Yes Identical by Chance, IBC

Please Note: Your match list will change if you change your matching threshold, and so will your phased matches to your parents.  In other words, while someone might not match you and a parent both on the same segment at 15cM, you might well match on a common segment at a 10, 7 or 5cM threshold.

So in essence, parental phasing puts your matches into very useful buckets for you and helps eliminate false positives – or matches that appear real but aren’t.

How Can Someone Match Me But Not My Parents?

That’s a really good question. Sometimes you match someone because you received common DNA from an ancestor, through your parents, which means you’re identical by descent (IBD), a legitimate genealogical match.  But other times, you match someone just by chance because their DNA is matching pieces of both of your parents’ DNA, and not because you actually share a common ancestor.

Let’s take a look.

This first graphic shows you with an identical by descent match to your match’s father’s DNA. Your match’s father shares a common relative with (at least) one of your mother’s lines.

Phase IBD

In the most basic terms, an identical by descend (IBD) match looks like this, where your match is matching you on one of your parent’s strands of DNA. Both matching strands are colored green in this example.

Of course, your DNA does not come labeled as to which side is mother’s and which side is father’s. You can read more about that here. If it did, we wouldn’t even need to be having this discussion at all – because that’s what parental phasing does.  It tells you which side of your family your DNA match came from.

You can see in the above example that you and your match both share an actual strand of DNA. You inherited yours from your Mom and your match inherited theirs from their Dad, which means your Mom and their Dad share a common ancestor.  However, to be able to discern that fact, that your Mom and your match’s Dad share a common ancestor, you need to be able to phase the DNA of both you and your match to know which parent that strand came from.

In reality, your DNA and their DNA is entirely mixed in each of you, shown in the chart below, and without additional information, neither of you will know which strand of DNA you match on, or who you inherited it from.  Initially, you will only know THAT you match.

Phase IBD2

So here’s what your DNA really looks like. It’s up to the DNA matching software to look at the two strands of your DNA that’s mixed together, and the two strands of your match’s DNA that’s mixed together and see if there is a common grouping of DNA at each location that extends for at least 10 locations in length, which is the “threshold” for our example that signifies a match that is likely to be “real” versus IBC, or identical by chance.  In my example, that common grouping is the green “Matching Portions” column, above.

An identical by chance match looks like the chart below. You can see that the green matching DNA is zigzagging back and forth between your parents’ DNA.

Phase IBC

It can even be worse where your match’s Mom’s and Dad’s DNA is also zigzagging back and forth, but you can certainly get the idea that there are all kinds of ways to NOT match but only three ways to legitimately match – Mom’s side, Dad’s side, or both.

So you can see that indeed, you do technically match, but not because you share a DNA segment of any size with one parent, but because your match’s DNA matches part of your Mom’s DNA and part of your Dad’s, which means that DNA segment does NOT come from one common ancestor, meaning not IBD. However, the matching software can’t tell the difference, because your strands aren’t coded to Mom and Dad.

What parental phasing does is to assign your matches to “sides” or buckets based on whether they match your Mom or Dad in addition to you.

One Parent Matches

In my case, I only have one parent whose DNA is available. Therefore, all of my matches will either match both my mother and me, or not.  The balance that do not match me and my mother, both, will either match to my father or will be IBC, identical by chance matches.  Unfortunately, just by utilizing one-parent phasing, I can’t tell if the “non-Mom” matches are really to my father or are IBC.

Let’s look at an example.

Match Mom’s Side Dad or IBC Comment
Denny Yes Probably not Mom’s side, could also match on Dad’s side but we have no way to tell. My parents lines come from different parts of the world except that they both married into Native American lines.
Sally No Yes Can’t tell whether Dad’s side or IBC
Derrell No Yes Also matches cousin on Dad’s side on same segments, so Derrell is assigned to Dad’s side pending triangulation.

By using the ICW tool at Family Tree DNA, shown below, I can see who matches me and my matches, both – in this case, me and my mother.

No Parent Matches

If I have no parents in the system, but several other close family members, like uncles or cousins, I can easily see who else I match in common with my match.

In other words, without my mother to match, Denny will either match my Mom’s side family members, and I can tentatively group him there, my Dad’s side family members, and I can tentatively group him there, or neither, in which case I can’t do anything with him except note that fact.

An Example

I’m going to use my proven cousin Denny for my examples, because that’s who I used in my Curtis Lore case study and our connection is proven both genetically and genealogically.

Here’s Denny’s match list. My mother is Denny’s closest match and I’m his second closest.

Phase match list

Therefore, I can use the ICW technique to effectively put my matches into buckets that divide my DNA in half, if I have both parents.

If I have one parent, I can fill one bucket for sure by putting everyone who matches both my mother and me into the “mother” bucket. The balance will be in the “Father +IBC” bucket.

This is easy to do at Family Tree DNA by using the crossed arrow ICW tool to find everyone who matches me in common with my mother.

Phase iCW

If I don’t have either parent, but I have an uncle or a cousin, I can still assign some matches to buckets by utilizing this same ICW tool. What I can’t do without both parents is to eliminate IBC or identical by chance matches from my match list.  I need both parents or at least well fleshed out match groups to do that.  There are examples of using match groups to identify IBC matches in the article, Identical By…Descent, Chance, Population and State.

Furthermore, I will need to download my match lists for both my mother and myself to verify that each person matches both my mother and myself on a common segment.

Testing the Theory

Let’s use my real life example and see how this works. I’m going to utilize three generations, because this gives us the ability to see the parental phasing work twice.  In this illustration, below, four people have tested, Denny, Mother, Me and My Child.

Phase pedigree

Denny and my child, who are 3rd cousins once removed, match on the following DNA segments, utilizing the Family Tree DNA chromosome browser.  We are comparing against Denny, meaning he is the “background” black chromosome.  The orange illustrates where my child matches Denny.

Phase browser denny child

There are no matching segments on chromosomes 18-22.  I have not included X chromosome matching.

Here’s the same information in chart format.

Phase chart denny child

You can see that Denny and my child have several fairly significant segment matches, along with some smaller ones too. The question is, which of those segments are legitimate, meaning IBD and which are not, meaning IBC?

Let’s phase my child against my DNA and see which of these segment matches hold up.

My child is orange, and I am blue and we are both matching against cousin Denny.

phase browser denny child me

As you can see, many of those segments are legitimate because Denny matches both me and my child on the same segments. So they are not IBC, or identical by chance, but IBD, identical, literally, by descent – because my child received them from me.

In some cases, Denny matches only me, blue, which is fine because all that means is that either our matches are IBC or I didn’t pass that DNA to my child. Both matches on chromosome 3 are to me (blue) and not to my child (orange).

However, in the cases where Denny matches my child (orange,) and not me (blue,) on the same segments, that means that either Denny and my child share an ancestor that is through my child’s father or the matches are IBC.  Those matches are not through me.  In other words, those segments did not pass phasing.  You can see examples of that on chromosomes 1, 4 and 14, and partial matches on 11 and 12.

Chromosome 16 shows a really good example of a crossover event where my child, orange, received part of my DNA, blue, but about half way through my segment, it was divided and my child inherited part of mine and the other half from their father.  So, visually, you can see that my child only matches Denny on about half of the segment where I match Denny.

Matches Spreadsheet

I downloaded the results of both Denny’s matches to me and Denny’s matches to my child into one Matches Spreadsheet and have color coded them so that you can see the relationships.  If Denny matches both me and my child, you will see a common segment on that chromosome for both me and my child in the spreadsheet.  Rows where Denny matches my child are light orange and rows where Denny matches me are light blue, similar to the chromosome browser colors.

Denny Me Child

There are only three possible conditions and I have colored the chromosome column accordingly:

  • Denny matches me only – dark teal – may be a legitimate match but we don’t have enough information to tell at this point
  • Denny matches my child only, but not me – red – NOT a legitimate match – identical by chance (IBC)
  • Denny matches me and my child both – boxed green – a legitimate identical by descent (IBD) match

You’ll note that some of these matches are exact. For example on the first matching segment of chromosome 2, below, my child received this entire segment of my DNA.  It was not divided at all.

Denny Me Child 2

However, in the next two matching groups on chromosome 2, my child received most of the DNA I share with Denny, but some was shaved off, but not half.

Denny Me Child 2 shaved

On chromosome 16, my child received almost exactly half of the DNA segment that I share with Denny.

Denny Me Child 16

On chromosomes 11 and 17, my child shares more DNA with Denny than I do, which means that all of that DNA isn’t ancestral though me. In this case, either there are some fuzzy boundaries, a read error, part of the DNA is IBD and part is IBC or part of the DNA is matching through both parents.

Denny Me Child 17 c

On chromosome 14, I match Denny, but my child received none of that DNA, which is why I’ve added the color teal.

Denny Me Child 14 c

Now, let’s phase me against my mother and see how the DNA matches hold up in a third generation.

Adding the Next Generation

The view of the chromosome browser below shows Denny matching my child, in orange, me in blue and my mother in green.

Amazingly, many of these segments follow through all three generations.

phase browser denny child me mother

Let’s see how the various matches stacked up, pardon the pun.

I’ve added Denny’s matches to mother to the Matches Spreadsheet and her rows are colored green.

On the Matches Spreadsheet from the first example, there were several segments where Denny matched only me and not my child. They were colored teal.  In the chart below, so we can track those segments, I have colored them teal in the matchname column, and you can see the resolution of how they did or didn’t survive phasing against my mother in the chromosome column.

Of those 11 segments, 2 phased with my mother, the rest did not. That makes sense, since none of those are segments I passed on to my child, so they would be more likely to be IBC.

Denny me Child Mom SS

The legend for the spreadsheet above is as follows:

  • Dark teal in chromosome column – Denny matches Mom only – may be a legitimate match but we don’t have enough information to know (chromosomes 1, 2, 4, 5, 6, 7, 9, 12 and 15)
  • Dark teal in matchname column, plus red in chromosome column – previously Denny matched only me, now I do not phase against my mother, so this is an IBC match (chromosomes 1, 3, 4, 5, 6, 7, 10, 12 and 17)
  • Dark teal in matchname column, plus green box in chromosome column – previously Denny only matched me, but now this segment is parentally phased and considered legitimate (chromosomes 2 and 10)
  • Red in chromosome column – does not phase against parent, so not a legitimate match – IBC (chromosomes 1, 3, 4, 5, 6, 7, 10, 11, 12, 14 and 17)
  • Green box indicates a phased match – considered IBD and legitimate (chromosomes 1, 2, 10, 14, 15, 16 and 17)

Anomalies

*So what the heck happened with chromosome 11?

In the first example, this segment received a green box because Denny matched both me and my child on a partial segment, which means that partial segment is phased and considered legitimate.

denny me child mom ss 11 grn

When we moved to the next generation, phasing against my mother, Denny does not match my mother on this segment, so it could NOT have arrived in me and my child via my mother, so it is not IBD, even though it appeared that way initially. Because of this, I’ve changed the box color to red for a non-IBD match.

Denny me Child Mom SS 11

How could this happen?

First, it’s a very small segment overlap match, and second, Denny matched more to my child than to me, which is a neon warning sign that this segment match is suspect, especially those two conditions in combination with each other.

Here’s an example of how, genetically, a match could phase with a parent in one generation, but not hold into the next generation.

phase n o phase

This match matches both me and my child (gold), but not my mother, who has no gold. As you can see, the match does accrue 10 gold location matches in a row, but not 10 green ones, so doesn’t match my mother.  The larger the number of locations in a row required to be considered a match, the less likely this type of random matching will be to occur.

This is both the purpose and the quandry of thresholds.  Finding that sweet spot that doesn’t eliminate real matches, but is high enough to be useful in eliminating false positive (IBC) matches.  And I can tell you, there are just about as many opinions on what that threshold number should be as there are people giving opinions – and everyone seems to have one!  You can read more about this in the article, Concepts – CentiMorgans, SNPs and Pickin’ Crab.

Segment Survival

Let’s take a look and see how many of which size segments survived parental phasing.  Are some of those smaller segments legitimate matches, or did we lose them in phasing?

The chart below shows the results in segment size order, color coded as follows:

  • Red = segments that did not phase and were IBC
  • Teal = segments that match Mom only and may or may not be valid. We don’t have any way to know without additional matches.
  • Green = segments that phased and are IBD

Phased cMs by size

As you would expect, all of the larger segments phased, but surprisingly, so did several of the smaller segments, through three generations.

Given the fact that teal matches did not phase, for the most part, in the previous example, and given that the teal segments are mostly small, my suspicion would be that most of  these teal segments would not phase (with the probable exception of the 10.27 cm segment), if we have the opportunity to find out – which we don’t.

This example is for a non-endogamous line, or better stated, with distant endogamous groups in multiple lines. Endogamous results would probably be different.

Statistics

What do our statistics look like?

There were 58 matching segments between Denny, my child, me and my mother.

  Match To Whom # Segments # Phased %
Denny My Child 12 8 75
Denny Me 22 11 50
Denny Mother 24 Probably at least 11
Total 58

Of those 58 total matches, 16 were IBC meaning they did not match up through my mother.

  Total

Segment Matches

IBC (no phase) IBD (phase) Just Mother Match Groups 2 gen Groups 3 gen Groups
58 16 29 13 12 3 9
% 28% 50% 22% 25% 75%

Thirteen match just to mother (teal), of which one, on chromosome 12 for 10.27 centiMorgans, is the most likely to be legitimate, or IBD. The rest were smaller segments and none were passed to a the child, so they are less likely to be legitimate, or IBD.

There are a total of 12 matching groups, of which 3 are for only two generations, me and mother. In other words, not all of that DNA got passed on to my child, but at least some of it did 9 of those 12 times.

Does Size Matter?

I wanted to see how the small versus large segments faired in terms of three generations of parental phasing. Are smeller segments legitimate or not?  Do they stand up?  The “Phased cMs by Size” chart above was sorted in chromosome order, with teal being a match to mother only (so we don’t know if it phased), green meaning the segment DID phase and red meaning it DID NOT phase with the parent.

Removing the teal blocks, which match to mother only, meaning we don’t know if they would parentally phase or not, leaves us with the blocks that had the opportunity to phase, and whether they passed or failed. 100% of the blocks 3.57cM and above phased.  A natural dividing line seems to occur about the 3.5 cM level, shown below.

phased cms by size less teal

It’s interesting that all matches above 3.36 cM phased, several of them twice, through three generations or two transmission (inheritance) events. Of those, 9, or 43% were under the 10cM threshold suggested by some, and 7, or 33% were under the 7cM threshold.

Most of the segments 3.36 cM and below, did not pass phasing. Of those, 6 or 26% did pass phasing, while 17, or 74%, did not.  Note that this cM level is with the SNP threshold set to 500 SNPs, which is generally the lowest number I use.

Segment Size # of Segments # Segments Phased %
Larger than 3.5 cM 21 21 100
Smaller than 3.5 cM 23 6 26

Are these results a function of this particular family, or would this hold if more parental generational phasing studies were performed?

Let’s see. 

The Threshold Study

I was surprised by the seemingly low threshold of 3.5 cM that appeared to be the rough dividing line for cMs that passed parental phasing and those that did not. I undertook a small study of four additional 3 generation non-endogamous families.

I’ve included the Lore study that we discussed above in the first column.

I have also removed all duplicates in the results below, since the duplicates were an artifact of matching groups where we had three generations to match.

I completed 4 different three-generation studies in 4 unrelated non-endogamous families and noted the rough threshold for where matches seem to pass or fail phasing – in other words, the fall line. In all 4 examples below, the threshold was between 2.46 and 3.16 cM.  You could move it slightly higher, depending on what criteria you use for the “fall line,” which is why I’ve included the raw data.  In all cases, the SNP threshold was at 500 so you would not see any matches with fewer than 500 SNPs.

The black bar in the results below marks the location where the shift from fail to pass occurs in the various studies.

4 family phasing

Additionally, I have one 4-generation study available as well. The closest related of the 4 generations that were being matched against were first cousins, then first cousins once removed, then first cousins twice removed (equal to 2nd cousins) then 1st cousins three times removed (equal to second cousins once removed).

You can see, below, that the pass/fail threshold for this 4 generation, 3 transmission study was also at 3.69 cM for valid segments that survived. The segments labeled “2 match” mean that they did not get passed to the younger generations, so they only matched in the oldest two generations, 3 match the oldest 3 generations and 4 match meaning the match survived through all 4 generations.

It’s interesting that even some of the smaller segments held through all 4 generations.

4 gen phasing

Ethnicity Matters

Clearly, parental phasing is only successful when you have matches. Of the three data bases available for autosomal DNA comparisons today, Family Tree DNA and 23andMe likely have the largest representation of non-US participants, because the Ancestry.com test was not sold outside the US for quite some time.  The Family Tree DNA Family Finder test was sold in the most locations outside the US.

Family Tree DNA probably has the best representation of Jewish DNA of all of the data bases.

Family Tree DNA projects facilitate the grouping of individuals by self-selected interest which includes ethnic categories, making those relationships visible by virtue of project membership wherein they are not readily evident in other data bases.

Therefore, by virtue of who has tested, if your ancestry is not “US” meaning a melting pot type of environment who are not recent arrivals, then you are likely to have less matches, so less phased matches too.  If you have a high degree of any particular ethnicity, even if your ancestry is “US,” you may still have fewer matches.  For example, 3 of 4 of my mother’s grandparents were either German or Dutch, and she has 710 matches, or roughly half the matches that I have.  My father’s heritage was Appalachian, meaning Colonial American.

Here’s a quick chart showing the total matches as of April, 2016 for a number of individuals who contributed their match totals in Family Finder and who carry either no US heritage or a specific ethnicity.  For purposes of comparison, three individuals with typical mixed colonial US heritage are shown at the top.

Ethnicity match chart

People with high percentages of African heritage tend to have few matches today, as do those of purely European heritage. Unfortunately, not many Africans or African-Americans test their DNA and DNA testing is not as popular in Europe as it is in the US.  Many people in Europe are leary of DNA testing or don’t feel they need to test, because “we’ve always lived here.”   I’m hopeful that the sustained popularity of programs like Who Do You Think You Are and Finding Your Roots will encourage more people of all ethnicities and locations to test from around the globe.

People from highly endogamous populations have a different issue to deal with, as you can see from the very high number of Jewish matches in the chart above. Since these people descend from a common founder population, they share a lot of ancestral DNA that is identical by population, meaning they did receive it from an ancestor, so it’s not IBC, but they received that segment because that particular segment is very prevalent within that population.  Determining which ancestor contributed that piece of DNA is exceedingly difficult, if not impossible because several ancestors carried that same segment.

Therefore, while the segment is identical by descent, it’s probably not genealogically useful in a 100% endogamous scenario.

In an unpublished study, we discovered that while working with parentally phased Jewish results, it’s not unusual for up to half of the matches to not match the participant plus either parent on the same segments. Or conversely, they may match both parents, but the segments are comparatively small.  Matching to both parents in an endogamous population, without a known familial relationship, and without at least one relatively large segment, is an indicator of IBP, identical by population, matches.  For Jewish and other endogamous people, parental phasing is very promising, and will help them sort through irrelevant “diamond in the rough” matches indicated by no parent matches or smaller both parent matches to find the genealogically relevant gems.

In all parental phasing groups studied, no one lost less than 10% of their matches utilizing parental phasing and most people lost significantly more, up to half.  I would very much like to see these same kinds of 3 or 4 generation parental phasing studies done for groups of Jewish, other endogamous and African American families.  In order to do a study of one family, you need at least 3 generations who have tested and another known family member, like a first or second cousin perhaps, to match against.

In Summary

Dual parental phasing works wonderfully.  One parent phasing works pretty well too.  Even close relative phasing works, just not as well as parental phasing.  You can only work with the people you have available to test, so test every relative you can convince!

If you have one or both parents to test, by all means, do. You’ll be able to phase your matches against both of your parents individually and eliminate the majority of IBC matches.

If you have grandparents or their siblings available to test, do, and quickly so you don’t lose the opportunity. Test the oldest person/generation in each line that you can.

If you don’t have both parents, test your half and full siblings, all of them, the more the better, because they inherited parts of your parents DNA that you didn’t.

Find your closest relatives and test them, yes, all of them.

If you are testing parents, you don’t need to test their children too, because their children will only receive half of their parent’s DNA, and you already have the parents DNA.

Even if you can’t phase your matches utilizing your parents DNA, you can use the combination of your matches with other relatively close family members to assign or suggest matches to both sides of your family along family lines – creating match groups. For example, if your match matches you and your great-uncle Charlie on the same segment, then it’s very likely that match is from the common ancestral line shared by your common ancestor with great-uncle Charlie – your great-grandparents.  Triangulation, of course, will prove that.

Some of your relatives will be quite interested in DNA testing and others will be happy to test simply because it helps you, and they like to hear about the result of the genealogy research. I’ve discovered that providing a scholarship for the testing, especially for those people you really want to test, goes a very long way in convincing people that DNA testing for genealogy is something they might be interested in doing.  If you can’t personally afford a scholarship for everyone, try the old fashioned collection jar.  And no, I’m not kidding.  It works wonders and gives everyone an opportunity to participate and invest as well, as much as they can afford.

Ethnicity testing has a lot of sizzle for some folks too – so don’t just deliver the dry facts – be sure to talk about the sizzle too. Sizzle sells!  People get excited about the possibilities and of course, you’ll explain the result to them, so they get to visit with you a second time as well.  Something to look forward to at next summer’s picnic!

Be sure to take swab kits to family events; picnics, reunions, graduation parties, weddings and holiday gatherings. Believe me, I have a DNA kit in my purse or car at all times.  And maybe, if your extended family lives close by, resurrect the old-time Sunday afternoon tradition of “going calling.”  Not only can you collect DNA, you can collect family memories too and I guarantee, you’ll make a new discovery with every visit.  Take this opportunity to interview your relatives.

It’s amazing isn’t it, the things we do for this “DNA phase” that we’re all going through!

Acknowledgements

I want to thank Family Tree DNA for their ongoing support of projects and citizen scientists which makes these types of research studies possible. I also want to thank several individuals in the genetic genealogy community who provided their information and gave permission for me to incorporate their results into this article.  Without sharing and collaboration, these types of efforts would simply not be possible.

______________________________________________________________

Disclosure

I receive a small contribution when you click on some of the links to vendors in my articles. This does NOT increase the price you pay but helps me to keep the lights on and this informational blog free for everyone. Please click on the links in the articles or to the vendors below if you are purchasing products or DNA testing.

Thank you so much.

DNA Purchases and Free Transfers

Genealogy Services

Genealogy Research

Concepts – CentiMorgans, SNPs and Pickin’ Crab

In autosomal DNA testing, you’ll see the terms centiMorgans, represented as cMs and SNPs, which stands for single nucleotide polymorphism, combined.

These are two terms that are used to discuss thresholds and measurements of matching amounts of autosomal DNA segments.

These two terms, relative to autosomal DNA, are two parts of a whole, kind of like the left and right hand.

CentiMorgans are units of recombination used to measure genetic distance. You can read a scientific definition here.

For our conceptual purposes, think of centiMorgans as lines on a football field. They represent distance.

football fabric 2

SNPs are locations that are compared to each other to see if mutations have occurred.  Think of them as addresses on a street where an expected value occurs. If values at that address are different, then they don’t match.  If they are the same, then they do match.  For autosomal DNA matching, we look for long runs of SNPs to match between two people to confirm a common ancestor.

Think of SNPs as blades of grass growing between the lines on the football field.  In some areas, especially in my yard, there will be many fewer blades of grass between those lines than there would be on either a well-maintained football field, or maybe a manicured golf course.  You can think of the lighter green bands as sparse growth and darker green bands as dense growth.

If the distance between 2 marks on the football field is 5cM and there are 550 blades of grass growing there, you’ll be a match to another person if all of your blades of grass between those 2 lines match if the match threshold was 5cM and 500 SNPs.

So, for purposes of autosomal DNA, the combination of distance, centiMorgans, and the number of SNPs within that distance measurement determines if someone is considered a match to you. In other words, if the match is over the threshold as compared to your DNA, meaning the match is deemed to be relevant by the party setting the threshold.  Think of track and field hurdles.  To get to the end (match), you have to get over all of the hurdles!

hurdles

By Ragnar Singsaas – Exxon Mobil ÅF Golden League Bislett Games 2008, CC BY 2.0, https://commons.wikimedia.org/w/index.php?curid=5288962

For example, a threshold of 7 cM and 700 SNPs means that anyone who matches you OVER BOTH of these thresholds will be displayed as a match.  So centiMorgans and SNPs work together to assure valid matches.

Thresholds

These two numbers, cMs and SNPs, are used in conjunction with each other. Why?  Because the distribution of SNPs within cM boundaries is not uniform.  Some areas of the human genome have concentrations of SNPs, and some areas are known as “SNP deserts.”  So distance alone is not the only relevant factor.  How many blades of grass growing between the lines matters.

Each of the vendors selects a default threshold that they feel will give you the best mix of not too many false positives, meaning matches that are identical by chance, and not too many false negatives, meaning people who do actually match you genealogically that are eliminated by small amounts of matching DNA. Unfortunately, there is no line in the sand, so no matter where the vendor sets that threshold, you’re probably going to miss something in either or both directions.  It’s the nature of the beast.

Company Min cMs Min SNPs Comment
Family Tree DNA 7cM for any one segment + 20cM total 500 After the initial match, you can view down to 6 cM and 500 SNPs to people you match
23andMe 7cM 700
Ancestry 8cM after Timber and associated phasing routines Unknown Timber population based phasing removes matches they determine to be “too matchy” or population based
GedMatch User selectable – default is 7 User selectable – default is 700

2022 Update: MyHeritage began offering DNA testing and matching after this original article was published. Matches must have at least one 8 cM matching segment, but they show additional segments to 6 cM. There is no specified number of SNPs. Note that their imputation calculations sometimes cause the reported number of cM to be larger than for the same two people at other vendors.

As you might guess, there many opinions about the optimum threshold combinations to use – just about as many opinions as people!

These are important values, because the combined size of those matches to an individual allows you to roughly estimate the relationship range to the person you match.

As a general rule, the vendors do a relatively good job, with some exceptions that I’ve covered elsewhere and amount to beating a dead horse (Ancestry’s Timber, no chromosome browser). Of course, one of the big draws of GedMatch is that you can set your own cM and SNP matching thresholds.

Having said that, if you come from an endogamous population, you may want to raise your threshold to 10cM or even higher, depending on what you’re trying to accomplish

Effectively Using cMs and SNPs

Your personal goals have a lot to do with the thresholds you’ll want to select.

If you are new at genetic genealogy, you will first want to pursue your best matches, meaning the highest number of matching centiMorgans/SNPs, because they will be the low-hanging fruit and the easiest matches to connect genealogically. Said another way, you’ll match your closer relatives on bigger chunks of DNA, so concentrate on those first.  Successes are encouraging and rewarding!

Your match to a second cousin, for example, will have a significant amount of shared DNA, and second cousins share common great-grandparents – 2 of 8 people in that generation on your tree – so relatively easy to identify – as these things go.

The chart below shows the expected percentage of shared DNA in a given match pair, in this case, first and second cousins with a first-cousin-once-removed thrown in for good measure. Also shown is the expected amount of shared centiMorgans for the given relationship, the average amount of shared DNA from a crowd-sourced project titled The Shared cM Project by Blaine Bettinger, and the range of shared DNA found in that same project.

A pedigree chart of my family members fitting those categories is shown below, plus the actual amount of shared cMs of DNA to the right.

shared cM table

The chart below shows my DNA matches to my first-cousin-once-removed (1C1R), Cheryl.

Since we do match at Family Tree DNA above the match threshold, I can view all of my matching segments to Cheryl down to 1cM and 500 SNPs.

Cheryl chart

Just as a matter of interest, I’ve color coded the cM segments:

  • >10 cM = green
  • 7-10 cM = yellow
  • <7 = red

This means that if these were the largest matching segments, you would or would not be able to see them at the various thresholds of 7 and 10 cM.

If the matching threshold is at the default of 7cM, the green and yellow segments would be displayed.

If the matching threshold was set at 10, only the green cM segments are going to be shown.

At Family Tree DNA, you can select various threshold display options when using the chromosome browser tool, but not for initial matching. In other words, you have to match at their default threshold before you can see your smaller segments or alter your threshold display.

Some people want to see all of their DNA that matches, and some only want to see the large and compelling pieces, those green segments.  Neither choice is wrong, simply a matter of personal preference and individual goals.

The “large and compelling” part of that statement brings me back to why you’re participating in genetic genealogy in the first place, those individual goals.  The larger segments are going to lead to common ancestors who are generally easier to find and identify, unless you have an unidentified parent or a misattributed parental event.

You would never start with smaller segments in terms of matching, but that does not mean those smaller segments are never useful.  In fact, after you’ve managed to analyze all of your low hanging fruit, and you’re ready to research or concentrate on those ugly brick walls, groupings of those smaller segments in descendants may just be your lifesaver.

Surviving Phasing

However, now I’m curious. How many of those smaller segments do stand up to the test of parental phasing, meaning they match both me and my parent?  If my match (Cheryl) matches both me and my parent, then Cheryl does not match me by chance on that segment, so the match is genealogical in nature, the matching DNA proven to have descended to me from my mother.

Let’s see.

Cheryl Mom me chart

In order to phase my results with Cheryl against my mother, I copied Mother’s results into the same spreadsheet, above, color coding our rows so you can see them easier. “Cheryl matching Mom” rows are apricot and “Cheryl matching me” rows are yellow.

You can see that in some cases, like the first two rows, the two rows are identical which means I inherited all of Mom’s DNA in that segment and Cheryl inherited the same segment from her father, matching both Mom and me.

In other cases, I inherited part of Mom’s DNA on a particular segment.  I could also have inherited none of a particular segment.

In fact, of the 27 segments where I match Mom on any part of the segment, I match her on the entire segment 18 times, or 66.6% and on part of the segment 9 times, or 33.3%.

I left the color coding in the cM column the same as it was before, in my rows, to indicate small, medium and large segments. The small segments are red, which would be the most likely NOT to phase with my mother, in other words, the most likely to be Identical by Chance, not descent.  If Cheryl and I are Identical by Chance on these segments, it means that the reason I’m matching Cheryl is NOT because I inherited that chunk of DNA from mother. If Mom and I both match Cheryl, then Cheryl and I are Identical by Descent, meaning I inherited that piece of DNA from my mother, so the match is not because Cheryl’s DNA is randomly matching that of both of my parents.

In the spreadsheet below, I removed mother’s rows to eliminate clutter, but I color-coded mine. The rows that show red in the CHR and SNP columns BOTH are rows that did NOT phase with my mother, meaning these matches were indeed identical to Cheryl by chance.  The rows that are red ONLY in the cM column (and not in the CHR column) are small segments that DID phase with my mother, so those are identical by descent (IBD).

Cheryl Me phased chart

Here’s the interesting part.

  • All of the large segments, 10cM and over passed phasing. They are legitimate IBD matches.
  • One of 2 of the medium cM matches passed phasing.
  • Of the 15 smaller segments, ranging in size from 1.38 cM to 6.14 cM, more than half, 8, passed phasing. Seven did not. The smallest segment to pass phasing was 1.38 cM. I suspect that part of the reason that the smaller cM segments are passing phasing is that the SNP threshold is held steady at 500 SNPs. In another (unpublished) study, dropping the SNP threshold below 500 results in a dramatic increase in matches (roughly fourfold) and a very small percentage of those matches phase with parents.

Small Segments Guidelines

There has been a lot of spirited debate about the usage, or not, of small segments, so I’m going to provide some guidelines.  Let me preface this by saying that none of this is worth getting your knickers in a knot, so please don’t.  If you don’t want to include or utilize small segments, then just don’t.

  • What is and is not a small segment can vary depending on who you are talking to and the context of the conversation.
  • Small segments CAN and do survive parental phasing, as shown above.
  • Small segments CAN be triangulated to a particular ancestor. Triangulated in this sense means that this segment is found in the descendants of a group of people (3 or more) proven to descend from the same ancestor AND who all match each other on the same segment.
  • Not all small segments can be triangulated to a common ancestor.  But then again, the same can be said for larger segments too.  It’s more difficult and unlikely to be successful with smaller segments unless you are starting with a group of people who descend from a common ancestor and are looking for “ancestral DNA.”
  • Small segments, even after triangulation, can be found matching a different lineage. This is an indicator that while the descendants of the first group share this DNA segment from a specific ancestor, it may also be prevalent in a population in general, which would cause the same segment to show up matching in a second lineage from the same region as well. I have an example where my Acadian line also matches a different German line on a particular segment – which really isn’t surprising given the geography and history of Germany and France.
  • Small segments without the benefit of other tools such as parental phasing, triangulation and match groups are, at this time, a waste of time genealogically. This may not always be the case.
  • Never start with small segments.
  • Never draw conclusions from small segments alone, meaning without corroborating evidence.
  • Use small segments only in context of a combination of parental phasing, triangulation and match groups.
  • Just because you match a group of people, out of context, on a segment (small or otherwise) doesn’t mean that you share a common ancestor. The smaller the segment, the more likely it is to be either IBC or IBP. Situations where the DNA is exactly the same from both parents, meaning everyone has all As in that location, for example, are called runs of homozygosity and the smaller the segment, the more likely you are to encounter ROH segments which appear as phased matches.  Yes, another cruel joke of nature.

As a proof point relative to how deceptive small segment matching out of context can be, I ran my kit against my friend who is unquestionably 100% Jewish. I have no Jewish ancestry.  At 7cM/700 SNPs we have no matches, at 3cM/300SNPs we have 7 matching segments.

Me to Jewish match

However, matching this individual to my phased parents, none of these segments match both me and either one of my phased parent. Phased parent kits, at GEDMatch are kits reflecting the half of my parents DNA I received from that parent.  If you have one or both parents who have tested, you can create phased kits with instructions from this article.

Lowering the match threshold even further to 100 SNPs and 1cM, my Jewish friend and I match on a whopping 714 tiny matching segments, over 1100 cM total, but all very small pieces of DNA. Because of the absolute known 100% Jewish heritage of my friend, and my known non-Jewish heritage, these matches must be either IBC, identical by chance or perhaps some small segments of IBP, identical by population from a very long time ago when both of our ancestors lived in the Middle East, meaning thousands of years ago.  Bottom line, they are not genealogically relevant to either of us.  I repeated this same experiment with someone that is 100% Asian, with the same type of results.  You will match everyone at this threshold, including ancient DNA matches tens of thousands of years old.

The message here is that you can work from the “top down” with small segments, meaning in a known relationship situation like with my cousin and other relatives, but you cannot work from the bottom up with small segments as you have no way to differentiate the wheat from the chaff.

In the Crumley study, there are groups of small segments (greater than 3cM/300SNPs) that persist in multiple descendants of James Crumley, born in 1712.  In this case, because you can separate the wheat from the chaff with more than 50 participants, others who triangulate with those small segments and match the group of Crumley descendants may well share a common ancestor at some point in time, especially if they can phase with their parents on those segments to prove the match is not IBC.

  • Remember, your match on any segment to one person can be IBD, meaning you have identified the common ancestor, your match to another person on that same segment IBC, and yet to a third person, IBP where your match survives generational phasing, but you may never find the common ancestor due to the age of the segment or endogamy.
  • When utilizing small segments, I generally don’t drop the SNP threshold below 500, as the number of matches increases exponentially and the valid matches decrease proportionately as well. I’ll be publishing more on this shortly.
  • I do fully believe, within this set of cautionary criteria, that small segments can be useful. I also believe that small segments can be very easily misinterpreted. The use of matching segments has a lot to do with combining different pieces of evidence to build confidence in what the “match” is telling you. I wrote about the Autosomal DNA Matching Confidence Spectrum here.
  • Small segments should only be utilized after one has a good grasp of how genetic genealogy works and by utilizing the tools available to restrict those segments to genealogically descended DNA. In other words, small segments are for the advanced user. However, maintain those small segment groupings and triangulations in your spreadsheet, because when you have the level of experience needed to work with those small segments, they’ll be available for you to work with.  You may discover that most of your DNA triangulates by using large segments and you don’t need to utilize those small segments at all.
  • If you send me a list of matches from GedMatch with the cM set to 1 and the SNPs set to 100 and ask me what I think, I would simply to refer you to this article. But if I did reply, I would tell you that unless you have corroborating evidence, I think you’re wasting your time, but it’s your time and you’re welcome to do what you want with it. Life is about learning.
  • If you tell me you’ve drawn any conclusions from those types of matches (1cM and 100 SNPs), I’m going to be inconvincible without other tools such as genealogical proof,  parental phasing and triangulation groups that prove the segments to be valid to a specific ancestor for the people about whom you’re drawing conclusions. I might even suggest you look at the raw data in those segments to see if you’re dealing with runs of homozygosity.

Netting It Out

The net-net of this is that small segments can be useful, but it takes a lot more work because of the inherent questionable nature of small segment matches. This goes along with that old adage of “extraordinary claims require extraordinary evidence.”  Just be ready to roll up your shirt sleeves, because small segments are a lot more work!

Now having said all of that, I very much encourage continuing to triangulate your small segments and pay attention to them. You may notice patterns very relevant to your own genealogy, or you may learn that those patterns were somewhat deceptive – like IBD that turned into IBP.  Still useful and interesting, but perhaps not as originally intended.

Without continuing and ongoing research, we’ll never learn how to best utilize small segments nor develop the tools and techniques to sort the wheat from the chaff. Just be appropriately paranoid about conclusions based on small segments, especially small segments alone, and the smaller the segment, the more paranoid you should be!

There is a very big difference between working with small segments along with larger matching data and genealogy, which I encourage, and drawing conclusions based on small segment data alone and out of context, which I highly discourage.

Let’s hope that all of your matches come with large segments and matching ancestors in their trees!!!

Pickin’ Crab

You know, working with different cM levels and SNPs, especially as segments get smaller and more challenging, I’m reminded of “picking crab” at a good old North Carolina crab bake. You would never start out with a crab bake for breakfast.  You kind of have to work your way up to pickin’ crab – the same as small segments.  And you never pick crab alone. It’s a group activity, shared with friends and kin.  So is genetic genealogy.

You’ll need lessons, at first, in how to “pick crab” effectively. There’s a particular technique to it.  Friends teach friends.  You’ll find cousins you didn’t know you had, like Dawn in the brown shirt below, giving lessons to Anne.

Dawn lessons

A little practice and you’ll get it.

Just because it’s not easy doesn’t mean it’s not productive, especially when everyone works together!  And the results are “very good,” if you just have patience and work through the process.  If you decide that you “can’t pick crab,” then you’re right, you can’t pick crab, and you’ll just have to go hungry and miss out on all the fun!  Don’t let that happen.  Hint – sometimes the fun is in the pickin’!

Here’s hoping you can solve all of your brick walls with large cMs and large SNP counts, and if not, here’s hoping you enjoy “picking crab” with a group of friends and cousins and who will contribute to the ongoing research.

Pickin’ crab, or working on identifying difficult ancestors is always better when collaborating with others! Find cousins and fellow collaborators and enjoy!!! Genetic genealogy is not something you can do alone – it’s dependent on sharing.

crab pickin

Sometimes it’s as much about the friends and cousins you meet on the journey and the adventures along the way as it is about the answer at the end.

______________________________________________________________

Disclosure

I receive a small contribution when you click on some of the links to vendors in my articles. This does NOT increase the price you pay but helps me to keep the lights on and this informational blog free for everyone. Please click on the links in the articles or to the vendors below if you are purchasing products or DNA testing.

Thank you so much.

DNA Purchases and Free Transfers

Genealogy Services

Genealogy Research

Concepts – Identical by…Descent, State, Population and Chance

In genetic genealogy, what does it mean when someone says they are “identical by” something…and what are those various somethings?

In autosomal DNA, where your DNA on chromosomes 1-22 (and sometimes X) is compared to other people for matches of a size that indicates a genealogical relationship, you can actually match people in different ways, for different reasons.

But first, let’s make one thing perfectly clear. There is only one way to obtain your autosomal DNA – and that’s through your parents, 50% from each parent.  However, how much of their (and your) ancestor’s DNA you receive is not necessarily half of what they received from that ancestor.

If you receive ANY DNA from that ancestor, it MUST BE through your parents. There is no other way to inherit DNA.

Period.

No. Other. Way.

If you would like to read the Concepts article about inheritance and matching, click here. If you don’t understand autosomal DNA inheritance and matching concepts, you won’t be able to understand the rest of this article.

Identical by Descent (IBD)

When you match someone because you share DNA from a common ancestor, that is called Identical by Descent, or IBD. That’s what you want.  That’s a good thing, genealogically speaking.

Let’s take a look at how an IBD segment of DNA works. In the graphic below, the strand location is in the first column.  The next two pink columns are the two strands that your mother carries, one from her Mom and one from her Dad – and the values in each location from each parent.  Columns 4 and 5 are the two blue strands of DNA carried by your Dad, one from his Mom and one from his Dad.  The final two columns are what you inherited from both your mother and your father.  In this case, we made it easy and you simply inherited one of each of their strands entirely.  Yes, that does happen in some cases for a particular chromosome segment, but not all of the time.  Conceptually, for this example, it doesn’t matter.

Identical 1

Your Inheritance

In this example, you inherited strand 1 from your Mom, all As and strand 2 from Dad, all Gs. Your match, shown in the graphic below, matches you on all As, so also matches your mother.  This phenomenon is called parental phasing, which means we know it’s a legitimate match because the person matches both you and one of your parents.

For purposes of this conceptual discussion you must match on all 10 locations for this to be considered a matching segment. So in this case, your matching threshold is “10 locations.”

Identical 2

Your Match Matches You and Your Mother’s DNA – Identical by Descent

Now, understand that while I’ve shown “You” with your strands color coded so you can see who you received which pieces of DNA from – that’s not how your DNA really looks. There is no color coding in nature.  I’ve added color coding to make understanding these concepts easier.

This is how you and your parents DNA really look:

Identical 3

Notice that in your parents, their parent’s strands are mixed back and forth, so you really can’t tell which DNA came from whom.  It’s the same for you too.

What the matching software has to do is to look for a common letter between you and your match.

So, at location 1, you inherited an A and a G from your parents. Your match has an A and a T, so you and your match share a common A.  If you look at all of your matches locations, they share a common A with you on all of those locations.  It just so happens you received that A from your mother – but without your Mom to compare to – you have no way to know which parent that particular DNA value came from.  So, the best matching software can do is to tell you that indeed, you do match – on 10 locations in a row – so this is considered a match and will be reported as such on your match list.

Why you match is another matter altogether.

And, ahem….there is another way to match someone, aside from receiving ancestral DNA from your parents. I know, this is a bad joke isn’t it.  Yes, it is, but it’s real.

So, to summarize, there is no other way to obtain your DNA except 50% from one parent and 50% from the other.

However there are two ways to match someone:

  • Identical by Descent, IBD, meaning you match someone because you share the same DNA segment that you received from an ancestor through a parent, as shown above.
  • Identical by Chance, IBC, meaning that you match someone, but randomly – not by inheritance.  How the heck can that happen?

Let’s look at how that can happen.

Identical by Chance (IBC)

Because you receive a strand of DNA from each of your parents, but that DNA is all intermixed in you, you can possibly match someone else by virtue of the fact that they aren’t actually matching your ancestral DNA segment inherited from an ancestor, but by chance they are matching DNA that bounces back and forth between your parents’ DNA.

Identical 4

Your Match Matches Neither of your Parents’ Strands of DNA – Identical by Chance

In this example, you can see the that you inherited the same strands from your parents as in example 1 above, but your match is now matching you, not on your mother’s strand 1, all As, but on a combination of A from your mother and G from your father. Therefore, they don’t match either of your parents on this segment, because they are matching you by chance and not because you share a strand of DNA that you received from a common ancestor on this segment with your match.

This is easy to discern because while they match you, they won’t match either of your parents on that segment, because the match is not on an ancestral DNA segment, passed down from an ancestor. Using parental phasing, you compare your matches to your parents to see which “side” they fall on.  If they fall on neither parents’ side, then they are IBC or identical by chance.

Identical 5

Identical By Chance Identified Through Parental Phasing

In this example, you can see that you match all of these people. By using parental phasing, you can tell that you are identical by descent (IBD) to everyone except John, who matches neither of your parents, so your match to John is identical by chance (IBC).  We will talk more in an upcoming article about Parental Phasing.

If you don’t have your parents to compare to, and you match multiple people on the same segment, there should be 2 groups of people who all match each other on that segment – one group from your Mom’s side and one from your Dad’s side – even if you can’t identify your common ancestor. If there are people who don’t fit into either of those two groups, because they don’t match those group members, then the misfits are identical by chance.

Even if your parents are unavailable, this is a situation where testing other relatives helps, and the closer the better, because those relatives will also fall into those match groups and will help identify which group is from which side of your family, and which ancestral line.

In the example below, using the same people from the phased parent example above, we no longer have our parents to compare to, but we do have an aunt, Mom’s sister, and an uncle, Dad’s brother. By comparing those who match us to our close relatives – if everyone in the match group matches each other, then we know they are IBD and the come from Mom’s side of the family or Dad’s side of the family.

Identical 6

Identical By Chance Identified Through Close Family Match Groups

In general matching, meaning not on specific segments, just on your match list, if John and I match, but John doesn’t match mother’s sister, it could mean that John matches me on a different segment that my aunt didn’t inherit from my grandparents but that my mother did. So the match could be valid, even though he doesn’t match my aunt.

However, moving to the segment matching level, shown above, we can differentiate, at least for that segment.  This is yet another example of why segment analysis tools are so critically important.

If we only had one matching group, the green above, we would not be able to say that John was IBC on this segment, because John might be matching me on Dad’s side.

But in this case, we have proof points on both sides of this same segment, with two match groups, green from Mom and blue from Dad.  Mom’s side has a match group of 4+me (including her sister) who all match each other on this same segment, indicating that they all descend through my mother’s side of my tree.  On Dad’s side, we have his brother and two other people who match each other and me on those same segments.

Since John matches no one in either match group on either side, his match to me on this segment must be IBC.  You can read more about match groups and confidence here.

Identical by chance segments tend to be smaller segments, because the chances of matching more locations in a row by chance diminish as the number of locations increases.

Ok, so now you’ve got this – the two ways to match. Identical by descent (IBD) and identical by chance (IBC,) nature’s cruel joke.

So, what the heck are identical by state (IBS) and identical by population (IBP).

Good questions.

Identical by State (IBS)

Identical by state is really an archaic term now, but you’ll likely still run into it from time to time. Understand that genetic genealogy is still a really new field of discovery.  Initially, terms weren’t defined very well and have since evolved.  IBD was used to mean a match where you could find a common ancestral line.  IBS, or identical by state, was often used when one could not find the ancestral line.  What this implied was that the match was not genealogical in nature.  But that often wasn’t true.  Just because we can’t determine who the common ancestor is, doesn’t mean that common ancestor doesn’t exist.  After we have more matches, we may well figure out the common ancestor at a later time.

What are some reasons we might not be able to figure out who our common ancestor is?

  • There’s a NPE or undocumented adoption in one line or the other.
  • The pedigree chart of one or both people doesn’t go back far enough in time.
  • The pedigree chart of one or both people is incorrect.
  • Not enough people have tested to connect the dots between the DNA. For example, we may share a common surname, Dodson, but be unable to actually pinpoint which Dodson line/ancestor we share.
  • The match is identical by population (IBP) and not in a genealogical timeframe. We see this most often in highly endogamous populations.
  • The match is identical by chance (IBC) and there is no common ancestor.

The tendency in the past has been to assume that if you can’t find the ancestor, then the problem MUST be that the match is Identical by State. But the problem is that identical by state includes two categories that are mutually exclusive; Identical by Chance and Identical by Population.

Identical by chance means there is no common ancestor, as we illustrated above.

Identical by Population means there IS a common ancestor, and you did receive your DNA from that ancestor, but you may not be able to figure out who it was because it’s too far back in time and many people from that same population base share that DNA segment.

So, today, we don’t say IBS anymore, we say either IBD and if it’s not IBD then it’s either IBC or IBP, but not IBS. If someone says IBS, you need to ask and see if you can determine whether they mean, IBC or IBP, or if they are trying to say something else like “I can’t identify the common ancestor so it must be IBS.”

Identical by Population (IBP)

Identical by population means that a large portion of a population group shares a particular segment of DNA. Some people feel IBP segments are not useful and want all of these segments to be stripped away by population (or academic) based phasing software.

In some cases, if an individual is 100% Jewish, for example, they will have many IBP segments from within the highly endogamous Jewish population. They don’t have any other ancestral DNA segments from ancestors who aren’t Jewish to contrast against in their DNA, so their IBP segments are not useful to them, and are in fact, just in the opposite.  There are too many IBP segments and they are in the way – often referred to as “noise” because they are not genealogically useful, even though they are descended from an ancestor (IBD).  So, yes, IBP is a subset of IBD.

However, for someone who has the following genealogy, these same population based endogamous segments can be extremely useful and informative.

Identical 7

In this conceptual pedigree chart, the Jewish person married a non-Jewish person with deep colonial American ancestry. Their child “Colonial Jew” married someone who was mixed “Irish Asian.”  The person at the bottom, “me,” is not themselves endogamous but has several widely variant lines in their heritage including endogamous lines.

If I’m lucky enough to have an African population segment, that tells me very clearly which genealogical line that match is probably from. But if those IBP segments are removed, they can’t inform me in this situation.

Same with Jewish, or Asian, or Native American.

Let’s see how this might work in real matching.

Let’s say your mother’s A value is only found in African populations, and it’s found in very high proportions in African populations and much less frequently anyplace else in the world, except for where Africans settled.

Identical 8

Identical By Population Example Where Mother’s A Equals African

A few match outcomes are possible:

  1. You match with someone and you can discern a common ancestor or at least an ancestral line because you have only one African genealogical line – an ancestor in your mother’s line, like in the pedigree chart above.
  2. You match with someone and you cannot discern a common ancestor because many or all of your lines are African, similar to the Jewish example.
  3. You match with someone and you identify a common ancestor, but later a second genealogical line matches on that same segment because the segment is so common in the African population. This means you could have received that actual DNA segment from either ancestral line.
  4. Some DNA testing company runs academic or population based phasing software against your DNA and removes that segment entirely because they’ve decided that it occurs too frequently in a population to be useful. In this case, you won’t match that person at all.
  5. Some DNA testing company runs academic or population based phasing software against your DNA and removes that segment entirely because they’ve decided that particular segment in your results is “too matchy” so it must therefore be “invalid” and population based. This is often referred to as a “pile-up” and means that you have proportionally more matches on that segment than you do on other segments. If your “pile-up” segments are removed in this case, again, you won’t match at all. This is exactly what happened to my Acadian matches when Ancestry implemented their Timber phasing software, which removes pile-ups.

The graph below was provided to me at Ancestry DNA Day as an example of my own “pile-up” areas in my genome.

genome pileups

Ancestry with their Timber routine uses population phasing and removes your areas they deem “too matchy”? This helps Jewish and other heavily endogamous people by removing truly population based matches that are spurious and the contributing ancestor impossible to discern.  An endogamous individual could achieve much of the same effect by utilizing a higher matching threshold for their own matches, although that’s not an option at Ancestry.

However, for those of us who are not entirely endogamous, but who may have endogamous lines or lines from different parts of the world, population based phasing removes valuable informational segments and therefore, prevents valuable matches. When Ancestry ran Timber against my results, I lost all but one of my Acadian matches.  Yes, Acadians are heavily endogamous, but in my case, that line accounts for 1 of my 16 great-great-grandparents.  Believe me, if I had a tool to put all of my autosomal matches in one of 16 buckets, I would think it was a wonderful day!!!

16 gggrandparents

Because of endogamy, I actually carried MORE Acadian DNA that I would otherwise carry from a non-endogamous population – so yes, I am very matchy to my Acadian cousins, especially on smaller segments – or I was until Ancestry stripped all of that way.  Thankfully, I still have all of my matches at Family Tree DNA.

Why is endogamous DNA more matchy? Because endogamous populations only have the founders’ DNA and they just keep passing the same founder DNA around and around.

Ironically, another word for this kind of phasing is called “excess IBD” phasing. This means that “someone” decides unilaterally how much matching one “should” have and just chops the rest off at that threshold.  Clearly, that threshold for a fully Jewish person and me would be very different – and one size absolutely does NOT fit all.

I want to show you one more example of what population based phasing does. It chops the heart out of segments that would otherwise match.

People whose parents also test should match their parents on exactly 22 segments, one for each chromosome – because each child is a 100% match to their parents. If there is a read error or two (or three), then let’s say they could have as many as 25 matches, because some chromosomes are chopped in two because of a technical issue.  It occasionally happens.

At Ancestry, we’re seeing 80 to 120 matches for each parent/child pair, which means Timber is removing 58 to roughly 100 legitimate segments that you received from your parent.  One individual reported that they match one parent on 150 different segments, meaning that Ancestry removed 128 segments they decided are “too matchy” but are very clearly ancestral, or IBD, because all of your DNA must match your parents DNA on the strand they gave you.  However because of Timber’s removal of “too matchy” segments, the person no longer matches their parent on that removed segment – or on any of those 58 to 128 removed segments.  And remember, there is only one way to receive your DNA, so all of your DNA must match that of your parents.  You have no invalid matches to your parents DNA.  You can read more here.

Here’s a visual of what IBP phased matching does to you. Recall in our example that you need 10 contiguous matching locations to be considered a match.  I’m showing 20 locations in this example.

Identical 9

Normal Matching – No Population or Academic Phasing

In this first example, the DNA you inherited from your mother is a combination of T and A, where A=African. Notice that only part of what you inherited from your mother is the A this time.

In normal matching without IBP phasing, above, the matching threshold is still 10, but you match your match on a segment that totals 20 locations or units. Now it’s up to you to see if you can identify your common ancestor.

In the IBP phased example, below, your African DNA is removed as a result of population based phasing software. Your African DNA used to be where the red spot with no values is showing in the You 1 column.  Therefore, you still match on the Ts, but you only have a contiguous run of 7 Ts, then the 7 As phasing deleted, then 6 more matching Ts.  The problem is, of course, that instead of a nice matching segment of 20 units, above, you now have no match at all because you don’t have 10 matching locations in a row.  Of course, the same IBP phasing would apply to your mother, so your match would not match your mother either, which means that a valid parentally phased match is not reported.

Identical 10

Population Based Phased Matching Example Removing African

What’s worse, you’ll never have that opportunity to see if you can find your common ancestor, because you and your match will never be reported as a match. This is a lost opportunity.  In the first “normal matching” example, you may never BE able to find that common ancestor, but you have the opportunity to try.  In the second IBP phased matching example, you certainly won’t ever find your common ancestor because you’re not shown as a match.  When population based or academic phasing is involved, you’ll never know what you are missing.

This chopping phenomenon is not a rare occurrence with population based phasing. In fact, if you divide 100 removed segments by 22 chromosomes, there are approximately 4 artificial “chops” taken out of every one of your 22 chromosomes with each parent at Ancestry, and in some cases, more.  The person who now matches their parent on 150 segments has an average of 5.8 artifical phasing induced chops in each chromosome.  When Ancestry implemented Timber, many people lost between 80% and 90% of their total matches.  Mine went from 13,100 to 3,350, a loss of about 75%.  At least some of those were valid and we had identified common ancestral lines.

So, identical by population (IBP) doesn’t necessarily mean bad, unless you’re entirely endogamous. If you’re entirely endogamous, then IBP means challenging and can generally be overcome by looking at larger matching segments, which are less likely to be either IBP or IBC.

Identical by population can be very useful in someone not entirely endogamous in that it preserves ancestral DNA in a given population. In people who carry a combination of different endogamous lines, such as Jewish and Acadian, this phenomenon can actually be very useful, because it increases your chances of matching other individuals from that ancestral line – and being able to assign them appropriately.

Identical by What?

So, in summary, you are either identical because you received DNA from a common ancestor (IBD) or identical by chance (IBC) because nature is playing a mean joke on you and you match, literally, by chance because your match’s DNA is zigzagging back and forth between your parents’ DNA.  And by the way, you can match someone IBD on one segment and the same person IBC or IBP on others.

If you match someone but that person does not also match either of your parents, then it’s an IBC, identical by chance, match. Measuring a match against both yourself and your parents to determine if the match is IBC or IBD is called parental phasing.  We will have a Concepts article shortly about Parental Phasing, so stay tuned.

If you don’t have parents to match against, your matches on any segment should cleanly cluster into two matching groups where you match them and your matches also match each other on that same segment. One group for your mother’s side and one group for your father’s side.  Those who match you but don’t fall into one group or the other are identical by chance, like John in our example.  Of course, you won’t be able to sort these out until you have several matches on that segment.  This is also why testing all available upstream family members is so useful.

If you’re not IBC, you’re IBD meaning that you and your match received that DNA segment from a common ancestor, whether or not you can identify that ancestor.

Identical by population (IBP) is a type or subset of identical by descent (IBD) where many people from that same population group carry the same DNA segment. This is seen in its most pronounced fashion in heavily endogamous populations such as Ashkenazi Jews.

If you are from a highly endogamous population, you will have many IBP matches, generally on smaller segments that have been chopped up over time, and you will want to use a higher matching threshold, perhaps up to 10cM, for genealogical matching, or higher.

If you have endogamous lines in your tree, but are not entirely endogamous, IBP segments may actually be beneficial because you may be able to attribute matches to a specific line, even if not the specific ancestor in that line.

The smaller the segment, the more likely it is to be less useful to you, whether IBD or IBP – but that isn’t to say all small segments should be disregarded because they are assumed to be either IBC or not useful. That’s not the case.  Some are IBD and all IBD segments have the potential to be very useful.  Kitty Cooper just recently reported another wonderful success story using a 6cM triangulated segment.

If you’re highly endogamous, or only looking only for the low hanging fruit, which is more likely to be immediately rewarding, then work with only larger segment matches. They are less likely to be IBC or IBP and more likely to yield results more quickly.  I always begin with the largest matching segments, because not only are they easier to assign to an ancestor, but those matching people may also have smaller matching segments that I can tentatively (pending triangulation) attribute to that specific ancestor as well.

Here’s a handy-dandy cheat sheet if you’re having trouble remembering “Identical by What.”

Identical by Chart

Understand that working with genetic genealogy and autosomal DNA is much like panning for gold. You may get lucky and find a large nugget or two smiling at you from on top the pile, but the majority of your rewards will be as a result of hard work sifting and panning and accumulating those small golden flakes that aren’t immediately obvious and useful.  Cumulatively, they may well hold your family secrets and the keys to locks long ago frozen shut.

Here’s hoping all your matches are IBD!!!!!

______________________________________________________________

Disclosure

I receive a small contribution when you click on some of the links to vendors in my articles. This does NOT increase the price you pay but helps me to keep the lights on and this informational blog free for everyone. Please click on the links in the articles or to the vendors below if you are purchasing products or DNA testing.

Thank you so much.

DNA Purchases and Free Transfers

Genealogy Services

Genealogy Research

Concepts – How Your Autosomal DNA Identifies Your Ancestors

Welcome to the concepts articles. This series presents the concepts of genetic genealogy, not the details.  I have written a lot of detailed articles, and I’ve linked to them for those of you who want more.  My suggestion would be to read this article once, entirely, all the way through to understand the concepts with continuity of thought, then go back and reread and click through to other articles if you are interested.

All of autosomal genetic genealogy is based on these concepts of inheritance and matching, so if you don’t understand these, you won’t understand your matches, how they work, why, or how to interpret what they do or don’t tell you.

The Question 

Someone sent me this question about autosomal DNA matching.

“I do not quite understand how the profiles can be identified to an ancestor since that person is not among us to provide DNA material for “testing” and “comparison.”

That’s a really good question, so let’s take a shot at answering this question conceptually.

Do you have a cat or dog?

Chica Pixie Quilt

I bet I could tell if I could see your clothes, your house, your car or your quilt. Why or how?  Because pets shed, and try as you might, it’s almost impossible to get rid of the evidence.  I went to the dentist once and he looked at my sweatshirt and said, “German Shepherd?” I laughed.

When your ancestor had children, he or she shed their DNA, half of it, and it’s still being passed down to their descendants today, at least for the next several generations. Let’s look, conceptually, at how and why this works.

In the following diagram, on the left you can see the generations and the relationships of the people both to the ancestor and to each other.

Our ancestor, John Doe, married a wife, J, and had 2 children. Gender of the children, in this example, does not matter.

Everyone receives one strand of DNA from their mother and one from their father. If you’re interested in more detail about how this works, click here.

In our example below, I’ve divided this portion of John’s DNA into 10 buckets. Think of each of these buckets as having maybe 100 units of John’s DNA.  You can think of pebbles in the bucket if you’d like.  Our DNA is passed, often, in buckets where the group of pebbles sticks together, at least for a while.  Since this is conceptual, our buckets are being passed intact from generation to generation.

John’s mother’s strand of DNA has her buckets labeled MATERNALAB and I’ve colored them pink to make them easy to identify. John’s father’s strand of DNA has his buckets labeled FATHERSIDE and is blue.  Important note – buckets don’t come colored coded pink or blue in nature – you have no idea which side your DNA comes from.  Yes, I know, that’s a cruel joke of Nature.

John married J, call her Jean. Jean also has 2 strands of DNA, one from her mother and one from her father, but in order to simplify things, rather than have two colors for the wives, I’d rather you think of this generationally, so the wives in each generation only have one color. That way you can see the wives’ DNA mixing with the husbands by just looking at the colors. Jean’s color is lavender.

DNA “Shedding” to Descendants

So, now let’s look at how John “sheds” his DNA to his two children and their descendants – and why that matters to us several generations later.

Concept ancestor inheritance

Please note that you can click on any of the graphics to make them larger.

In the examples above, the DNA that is descended in each generational line from John is bolded within the colored square. I also intentionally put it at the beginning and ends of the segments for each child so it’s easy to see.

In the first generation, John’s children each receive one strand of DNA from their mother, J, and one from John. John’s DNA that his children receive is mixed between John’s father’s DNA and John’s mother’s DNA – roughly 50-50 – but not exactly.

At every position, or bucket, during recombination, John’s child will receive either the value in John’s Mom’s bucket or the value at that location in John’s Dad’s bucket.  In other words, the two strands of John’s parent’s DNA, in John, combine to make one strand to give to one of John’s children.  Each time this happens, for each child conceived, the recombination happens differently.

Concept Ancestor inheritance John

In this case, John’s children will receive either the M or the F in bucket one.  In buckets 2 and 3, the values are the same.  This happens in DNA.  The child’s bucket 4 will receive either an E or H.  Bucket 5 an R or E.  Bucket 6 an N or R.  And so forth.  This is how recombination works, and it’s called “random recombination” meaning that we have not been able to discern why or how the values for each location are chosen.

Is recombination really random, like a coin flip?  No, it’s not.  How do we know?  Because clumps of neighboring DNA stick often together, in buckets – in fact we call them “sticky segments.”  Groups of buckets stick together too, sometimes for many generations.  So it’s not entirely random, but we don’t know why.

What we do know for absolutely positively sure is that every person get’s exactly half of their parents’ DNA on chromosomes 1-22.  We are not talking about the X chromosome (meaning chromosome 23) or mitochondrial DNA or Y DNA.  Different topics entirely relative to inheritance.

You can see which buckets received which of John’s parents’ DNA based on the pink and blue color coding and the letters in the buckets.  Jean’s contribution to Child 1 and Child 2 would be mixed between her parents’ DNA too.

Concept Ancestor inheritance child

In the first generation, Child 1 received 6 pink buckets (segments) from John’s mother and 4 blue buckets from John’s father – MATHERSLAB.  Child 2 received 6 blue buckets from John’s father and 4 pink buckets from John’s mother – FATHERALAB.  On the average, each child received half of their grandparents’ DNA, but in reality, neither child received exactly half.

Note that Child 1 and 2 did not necessarily receive the SAME buckets, or segments, from John’s parents, although Child 1 and 2 did receive some buckets with the same letters in them – ATHERLAB.

If you’re thinking, “lies, damned lies and statistics” right about now, and chuckling, or maybe crying, join the club!

Looking at the next generation, John’s Child 1 married K and John’s Child 2 married O.

Child 1

Let’s follow John’s pink and blue DNA in Child 1’s descendants.  Child 1 marries K and had one child.

Concept Ancestor inheritance grandchild child 1 c

John’s grandchild by Child 1 has one strand of DNA from Child 1’s spouse K and one strand from Child 1 which reads MATJJJJLAB. You can see this by K’s entire strand and the grandchild’s other strand, contributed by Child 1, being a mixture of John’s DNA along with his wife J’s DNA.  In this case, for these buckets, John’s mother’s pink DNA is only being passed on.  John’s father’s buckets 4-7 were “washed out” in this generation and the grandchild received grandmother J’s DNA instead.

Concept Ancestor inheritance gen 4 c

In the next generation, 3, John’s grandchild married P and had generation 4, the great-grandchild. Generation 4 of course carries a strand from wife P, but the Doe strand now carries less of John’s original DNA – just MA and LAB at the beginning and end of the grouping.

Concept Ancestor inheritance gen 5 c

In the next generation, 5, the great-great-grandchild, you can see that now John Doe’s inherited DNA is reduced to only the AB at the right end.

Concept Ancestor inheritance gen 6

In the next generation, 6, the great-great-great-grandchild carries only the A, and in the final generation, below, the great-great-great-great-grandchild, none of John Doe’s DNA is carried by that descendant in those particular buckets.

Concept Ancestor inheritance gen 7 c1

Can there be exceptions? Yes.  Buckets are sometimes split and the X chromosome functions differently in male and female inheritance.  But this example is conceptual, remember.

You always receive exactly half of your parents’ DNA, but after that, how much you receive of an ancestor’s DNA isn’t 50% in each generation. You saw that in our examples where both Child 1 and Child 2 inherited a little more or a little less than 50% of each of John’s parents’ DNA.

Sometimes groups of DNA buckets are passed together and sometimes, the entire bucket or group of buckets are replaced by DNA from “the next generation.”

To summarize for Child 1, from John Doe to generation 7, each generation inherited the following buckets from John, with the final generation, 7, having none of John’s DNA at all – at least not in these buckets.

concept child 1

Now, let’s see how the DNA of Child 2 stacks up.

Child 2

You can follow the same sequence with Child 2. In the first generation, Child 2 has one strand of John’s DNA and one of their mother’s, J.

Child 2 marries O, Olive, and their child has one strand from O, and one from Child 2.

Concept Ancestor inheritance gen 3 c 2

Child 2’s contributed strand is comprised of DNA from John Doe and mother J.  You can see that the grandchild has FA and ALAB from John, but the rest is from mother J.

Concept Ancestor inheritance gen 4 c 2

The grandchild (above) married Q and their child generation 4, inherits most of John’s DNA, but did drop the A .

Concept Ancestor inheritance gen 5 c 2

Sometimes the DNA between generations is passed on without recombining or dividing.  That’s what happened in generation 5, above, and 6 below, with John’s DNA.

Concept Ancestor inheritance gen 6 c 2

Generations, 5 (great-great-grandchild) and 6 (great-great-great-grandchild) both receive John’s F and AB, above.

Concept Ancestor inheritance gen 7 c 2

However, in the 7th generation, the great-great-great-great-grandchild only inherits John’s bucket with B.  The F and A were both lost in this generation.

concept child 2

This summary of the inheritance of John’s DNA in Child 2’s descendants shows that in the 7th generation, that individual carries only one of John’s DNA buckets, the rest having been replaced by the DNA of other ancestors during the inheritance recombination process in each generation.

Half the Equation

To answer the question of how we can identify the profile of a person long dead is not answered by this inheritance diagram, at least not directly – because we don’t KNOW how much of John’s DNA we inherited, or which parts.  In fact, that’s what we’re trying to figure out – but first, we had to understand how we inherited DNA from John (or not).

Matching with known family members is what actually identifies John’s DNA and tells us which parts of our DNA, if any, come from John.

Generational Matching

Let’s say I’m in the first cousin generation and I’m comparing my autosomal DNA against my first cousin from this line.  First cousins share common grandparents.

Assuming that they are genetically my first cousin (meaning no adoptions or misattributed parentage,) they are close enough that we can both be expected to carry some of our common ancestor’s DNA. I wrote an in-depth article about first cousin matching here, but for our purposes, we know genetically that first cousins are going to match each other virtually 100% of the time.

Here’s a nice table from the Family Tree DNA Learning Center that tells us what to expect in terms of matching at different relationship levels.

concept generational match

The reason our autosomal DNA matches with our reasonably close relatives is because we share a common ancestor and have inherited at least a bucket, if not more than one bucket, of the same DNA from that ancestor.

That’s the ONLY WAY our DNA could match at the bucket level, given what we know about inheritance. The only way to get our DNA is through our parents who got their DNA through their parents and ancestors.  Now, could we share more than one common ancestral line?  Yes – but that’s beyond conceptual, for now.  And yes, there is identical by chance (IBC), which doesn’t apply to close relatives and in general, nor to larger buckets. If you want to read more about this complex subject, which is far beyond conceptual, click here.

Now, let’s see how we identify our ancestor’s DNA!

Concept ancestor matching

Let’s look at people of the same generation of descendants and see how they match each other.  In other words, now we’re going to read left to right across rows, to compare the descendants of child 1 and 2.  Previously, we were reading up and down columns where we tracked how DNA was inherited.

Bolded letters in buckets indicate buckets inherited from John, just like before, but buckets with black borders indicate buckets shared with a cousin from John’s other child.  In other words, a black border means the DNA of those two people match at that location.  Let’s look at the grandchildren of John compared to each other.  John’s grandchildren are first cousins to each other.

Concept ancestor matching 1c

Our first cousins match on 4 different buckets of John’s DNA: A, L, A and B.  In this case, you can see that both individuals inherited some DNA from John that they don’t share with each other, such as their first letters, M for Child 1 and F for child 2.  Because they inherited different pieces from John, because he inherited those pieces from different ancestors, the first cousins don’t match each other on that particular bucket because the letters in their individual buckets are different.

Yes, the first cousins also match on wife J’s DNA, but we’re just talking about John’s DNA here.  Now, let’s look at the next generation.

Concept ancestor matching 2c

Our second cousins, above, match on four buckets of John’s DNA.  Yes, the A bucket was inherited from John’s Mom in one case, and John’s Dad in the other case, but because the letter in the bucket is the same, when matching, we can’t tell them apart.  We only “know” which side they came from, in this case, because I told you and colored the buckets pink and blue to illustrate inheritance.  All the actual software matching comparison has to go by is the letter in the bucket.  Software doesn’t have the luxury of “knowing” because in nature there is no pink and blue color coding.

concept ancestor matching 3c

Our third cousins, above, match, but share only A and B, half as much of John’s DNA as the second cousins shared with each other.

Concept ancestor matching 4c

Our 4th cousins, above, are lucky and do match, although they share only one bucket, A, of John’s DNA, which happens to have come from John’s mother.

Concept ancestor matching 5c

By the time you get down to the 5th cousins, meaning the 7th generation, the cousins’ luck has run out, because these two 5th cousins don’t match on any of John’s DNA.

Most 5th cousins don’t match and few 6th cousins match, at least not at the default thresholds used by the testing companies – but some do.  Remember, we’re dealing with matching predictions based on averages, and actual individual DNA inheritance varies quite a bit.  Lies, damned lies and statistics again!

You can adjust your own thresholds at GedMatch, in essence making the buckets smaller, so increasing the odds that the contents of the buckets will match each other, but also increasing the chances that the matches will be by chance.  Again, beyond conceptual.

concept buckets inherited

While this is how matching worked for these comparisons of descendants, it will work differently for every pair of people who are compared against each other, because they will have, or not have, inherited different (or the same) buckets of DNA from their common ancestor.  That’s a long way of saying, “your mileage will vary.”  These are concepts and guidelines, not gospel.

Now, let’s put these guidelines to work.

Matching People at Testing Companies

Ok, so now let’s say that I match Sarah Doe. I don’t know Sarah, but we are predicted to be in the 2nd or 3rd cousin range, based on the amount of our DNA that we share.

As we know, based on our inheritance example, amounts of shared DNA can vary, but we may well be able to discern a common ancestor by looking at our pedigree charts.

Sure enough, given her surname as a hint, we determined that John Doe is our common ancestor.

That’s great evidence that this DNA was passed from John to both of us, but to prove it takes a third person matching us on the same segment, also with proven descent from John Doe. Why?  Because Sarah and I might also have a second common genealogical line, maybe even one we don’t know about, that’s isn’t on our pedigree chart. And yes, that happens far more than you’d think. To prove that Sarah Doe and my shared DNA is actually from John Doe or his wife, we need a third confirmed pedigree and DNA match on that same bucket.

A Circle is Not a Bucket

If you just said to yourself, “but Ancestry doesn’t show me buckets,” you’re right – and a Circle is not a bucketA Circle means you match someone’s DNA and have a common tree ancestor.  It doesn’t mean that you or any Circle members match each other on the same buckets. A bucket, or segment information, tells you if you match on common buckets, which buckets, and exactly where.  You could match all those people in a Circle on different buckets, from completely different ancestors, and there is no way to know without bucket information.  If you want to read more about the effects of lack of tools at Ancestry, click here and here.

Proof

Matching multiple people on the same buckets who descend from the same ancestor through different children is proof – and it’s the only proof except for very close relatives, like siblings, grandparents, first cousins, etc.  Circles are hints, good hints, but far, far from proof.  For buckets, you’ll need to transfer your Ancestry results to Family Tree DNA or to GedMatch, or preferably, both.

I’m most comfortable if at least two of the individuals of a minimum of three who match on the same buckets and share an ancestor, which is called a triangulation group, descend from at least two different children of John.  In other words, the first common ancestor of the matches is John and his wife, not their children.

Cross generational matches 2

The reason I like the different children aspect is because it removes the possibility that people are really matching on the downstream wives DNA, and not John’s.  In other words, if you have two people who match on the same buckets, A and B above, who both descend from John’s Child 1 who married K, they also will share K’s DNA in addition to John’s.  So their match to each other on a given bucket might be though K’s side and not through John’s line at all.

Let’s say A and B have a match to unknown person D who is adopted and doesn’t know their pedigree chart.  We can’t make the presumption that D’s match to A and B is through John Doe and Jean, because it might be through K.

However, a match on the same buckets to a third person, C, who descends through John’s other child, Child 2, assuming that Child 2 did not also marry into K’s (or any other common) line, assures that the shared DNA of A and B (and C) in that bucket is through John or his wife – and therefore D’s match to A, B and C on that bucket is also through the same common ancestor.

If you want to read more about triangulation, click here.

In Summary

The beauty of autosomal DNA is that we carry some readily measurable portion of each of our ancestors, at least the ones in the past several generations, in us. The way we identify that DNA and assign it to that ancestor is through matching to other people on the same segments (buckets) that also descend from the same ancestor or ancestral line, preferably through different children.  In many cases, after time, you’ll have a lot more than 3 people descended from that ancestral line matching on that same bucket.  Your triangulation group will grow to many – all connected by the umbilical lifethread of your common ancestors’ DNA.

As you can see, the concepts, taken one step at a time are pretty simple, but the layers of things that you need to think about can get complex quickly.

I’ll tell you though, this is the most interesting puzzle you’ll ever work on!  It’s just that there’s no picture on the box lid.  Instead, it’s incredible real-life journey to the frontiers inside of you to discover your ancestors and their history:)  Your ancestors are waiting for you, although my ancestors have a perverse sense of humor and we play hide and seek from time to time!

______________________________________________________________

Disclosure

I receive a small contribution when you click on some of the links to vendors in my articles. This does NOT increase the price you pay but helps me to keep the lights on and this informational blog free for everyone. Please click on the links in the articles or to the vendors below if you are purchasing products or DNA testing.

Thank you so much.

DNA Purchases and Free Transfers

Genealogy Services

Genealogy Research

The Concepts Series

clock

Sometimes we get caught up in the details of how DNA testing for genetic genealogy works and what it means. Then someone asks a simple conceptual question, and I have to step back and figure out how to not tell them how to build a clock, but simply answer the question of what time it is.

pocketwatch

Someone sent me this query about autosomal DNA matching.

“I do not quite understand how the profiles can be identified specially to an ancestor since that person is not among us to provide DNA material for “testing” and comparison.”

That used to be a common question, but less so now, or so I thought. But maybe it’s just because people aren’t asking anymore, or I’m talking to a different audience.

So, I’m introducing a “Concepts” series of articles. These articles won’t explain the specifics of “how to,” but will explain the concepts of genetic genealogy – just the concepts.  For details, how to and exceptions – and you know there are always exceptions, you can dig deeper.

If you have a basic concept question about genetic genealogy or know of one you’d like to see addressed, drop me a note or attach it as a comment to this article. I’ve discovered that many times concepts questions begin with a phrase like, “Maybe I’ve missed something, but…..”

I’ll be adding the Concepts articles here as I publish them.  And yes, the first article will be “How Your Autosomal DNA Identifies Your Ancestors.”

Concepts Articles

______________________________________________________________

Disclosure

I receive a small contribution when you click on some of the links to vendors in my articles. This does NOT increase the price you pay but helps me to keep the lights on and this informational blog free for everyone. Please click on the links in the articles or to the vendors below if you are purchasing products or DNA testing.

Thank you so much.

DNA Purchases and Free Transfers

Genealogy Services

Genealogy Research