Family Tree DNA Announces “The Big Y”

Day 2 of the conference began early this morning and is just now ending and it’s after midnight.  I do have a lot to tell you, but most of it going to have to wait a bit.The Big Y

Today’s big news is that David Mittelman with Family Tree DNA late this afternoon announced the Big Y DNA test which would be known as a ‘full Y sequence” test. The test will provide results on 10,000,000 base-pairs and approximately 25,000 SNPs on the Y chromosome.

The regular price is $695, but it is being initially offered to current clients only for $495 though the end of November.  A current vial can be used if one exists, otherwise a new one will be sent.

Big y splashDelivery will be in 10-12 weeks and it will be accompanied by comparison tools.

Bennett says, “If the WTY (Walk the Y) was the moon shot, then this is the mission to Mars.”

Debbie Kennett compiled information from several folks who were tweeting and posting today and you can read more information at the link below.

http://cruwys.blogspot.com/2013/11/the-new-big-y-test-from-family-tree-dna.html

______________________________________________________________

Disclosure

I receive a small contribution when you click on some of the links to vendors in my articles. This does NOT increase the price you pay but helps me to keep the lights on and this informational blog free for everyone. Please click on the links in the articles or to the vendors below if you are purchasing products or DNA testing.

Thank you so much.

DNA Purchases and Free Transfers

Genealogy Services

Genealogy Research

9th Annual Conference Reception

katherine and meIt’s always fun to see everyone in Houston.  I’ve never been a big “joiner.”  No, I didn’t go to my high school class reunion.  But this, well, it’s different.  Many of us have been in this foxhole together for a decade now.  It’s like old home week.  And what is really amazing to me is how many of these people, over the years, I’ve discovered that I’m related to in one way or another.

I have received a couple of questions that I’d like to answer.  One person asked if this conference is available to everyone.  The answer is no.  It is held and subsidized by Family Tree DNA and its focused on their project administrators.  We, as a group, have to stay educated in order to educate and guide others appropriately.  So this is not a conference for beginners, although, clearly, everyone has to start someplace.  Many genealogy conferences now include DNA sessions and DNA tracks.  If you’re unhappy about this, it’s easy to volunteer to assist an administrator for any project of your choice, and then you’ll be eligible to attend.

Are they recording the conference?  No, they aren’t.  Many or most of the speakers work in this field and not everyone is willing to have their sessions made public.  Furthermore, my experience with recording conferences, especially where there is not an auditorium or studio environment is that the audio/video is quite poor.

Is there a “boot camp” for new people?  There isn’t, per se, but Family Tree DNA does offer free webinars periodically which are announced on their website, facebook and other media sources.  I would encourage people to take advantage of these opportunities.

Another change from previous conferences is that Family Tree DNA will be tweeting directly from the conference.

Now for the report on tonight’s reception.

It’s always great to see some new people.  It seems that every year, about 30% of the faces are new.  I see some folks that are repeats from the “new” group last year, which always makes me feel good.  Many of us really try to make sure the new folks feel included.  Katherine Borges and I were trying to figure out who has attended all 9 conferences, and we could only come up with 2 people in addition to ourselves.  However, there are a lot of people who started attending the second year and have been with us ever since.

Family Tree DNA has brought new people on board through their acquisition of Arpeggi this last year and many of those folks were here this evening.  They are excited about the new opportunities in genetic genealogy.  We’ll be hearing more from Jason Wang, Chief Technology Officer, David Mittleman, PhD, Chief Scientific Officer (a geneticist by the way), Nir Leibovich, Chief Business Officer and Rudy Marsh, Director of Product later in the conference.

I finally got to meet Marja Pirttivaara in person.  She came from Finland for the conference and will be speaking tomorrow about Bridging Social Media and DNA.  Sadly, her session is the same time as mine so I won’t be able to attend hers:(

I blogged about the serendipitous moment when Marja and I discovered that we share a common ancestor in some distant misty place in Europe.  It was so wonderful to actually get to meet her in person.  I was so excited, I forgot to get a photo, but I will before the end of the conference.

Towards the end of the evening, I caught up with Katherine Borges, founder and Director of ISOGG.  It’s always wonderful to see Katherine.  That’s her and I taking “selfies” above.  I noticed that Katherine had changed clothes from earlier in the evening.  The room was quite warm.  Looking at her, I realized that she was wearing these kind of ribbon wrapped sandals where the ribbons wrapped up her legs.  They were cool in a California sort of way.  Then, I saw them.  Yep….I had to look closer to be sure I really did see what I thought I saw.

katherine nails

One thing about Katherine, you can always count on her passion for genetic genealogy, and also her passion for fun.  Yes indeed, it’s good to be back in Houston.  It’s going to be a great conference.

______________________________________________________________

Disclosure

I receive a small contribution when you click on some of the links to vendors in my articles. This does NOT increase the price you pay but helps me to keep the lights on and this informational blog free for everyone. Please click on the links in the articles or to the vendors below if you are purchasing products or DNA testing.

Thank you so much.

DNA Purchases and Free Transfers

Genealogy Services

Genealogy Research

9th Annual International Conference on Genetic Genealogy

The 9th Annual International Conference on Genetic Genealogy sponsored by Family Tree DNA for their project administrators will take place in Houston, TX beginning Friday, November 8th and lasting through Sunday, the 10th.

I’ll be attending this one, just like I’ve been at every conference since the beginning.  There aren’t many of us who attended that first conference and are still attending, and fewer still who have attended all 9 conferences.  You can see some photos of that first conference and a few stats here.Kerchner pin

Charles Kerchner brought his freshly minted haplogroup pins to sell, R1b for Yline and H for mito.  My – how things have changed.  Today I wrote a report for a man who is R1b1a2a1a1b4h.  Although Charles is now retired from genetic genealogy, I’m sure if he still has some pins, he’d love to unload them, er, I mean, sell you one. In the genetic genealogy world, they are antiques now, but we were surely excited to proudly wear them in 2004.  They were kind of the 2004 DNA version of “what’s your sign?”  Everyone was walking around the hotel lobby around looking for other people wearing pins!  I still have mine and my haplogroup J mito pin too.  The first conference was a landmark, watershed, event.  We were giddy with excitement to attend the conference and meet each other for the first time, face to face.  Sadly, some of those friends are no longer with us.

Looking back, I recall how different things were, and how much they have changed in just under a decade.  Most notably, there was no Facebook, no Twitter, no forums and no blogs.  The first DNA books for genealogy were introduced that year, as was Mitosearch, and Sorenson released their first data base information.

Back then, the best you could hope for if you couldn’t attend the conference, which was the ONLY educational opportunity for genetic genealogy, was that someone would post on the Rootsweb DNA list about what was taking place.  There was no ISOGG list, as ISOGG hadn’t been formed yet and wouldn’t be for another year.  Today, ISOGG has 8000 international members.

Speaking of Rootsweb, which was the primary message system at that time, DNA was a taboo subject on the surname and location lists and boards.  Actually, it was prohibited everyplace on Rootsweb except for lists like the genealogy-DNA list which had been formed specifically to discuss DNA.  I never understood exactly why, but the topic of DNA was treated like a social disease.  You couldn’t discuss it, you couldn’t talk about results and you most assuredly could NOT recruit people, even discretely.  Messages that even smelled remotely like they might be DNA related were routinely deleted.  It seems to me that there was a great amount of fear that DNA might unearth truths that some people didn’t want unearthed or maybe that using DNA was somehow “cheating”.  And indeed, it has revealed many truths.  The truth is the truth and refusing to talk about it didn’t save anyone.  We knew a few years later when one of the biggest opponents said they ordered a DNA test that we had won that battle, although we were a bit shell-shocked.  The whole thing seems archaic today and almost unimaginable.  Now, of course, we post about DNA on all of the electronic forums and most genealogists can’t imagine NOT having DNA available as a tool.  Like many others, I’ve had brick walls fall that could never have met their demise any other way.

Unfortunately, the forums like Rootsweb and Genforum are much less popular today and have in many ways been usurped by Facebook.  I find that unfortunate, because the Rootsweb boards and lists were meant to be searched and permanent archives were a built in feature.  Ever try to find something someone posted on your Facebook timeline a few weeks later?  Good luck with that.

Last year at the conference, I tweeted, as did several others.  I won’t be doing that this year.  I discovered that different tools (PC, MAC, iPad and iPhone) react and interact differently with Twitter and trying to work through those issues was both frustrating and distracting.  This year, instead, I will TRY to blog each day at least briefly about what occurred.  We’ll see how that goes.  I tried to blog on my private family blog when I was overseas earlier this year too, and that did not go well for a multitude of reasons.

This year at the conference, I’m speaking as well during one of the breakout sessions.  My session is titled, “How to Find Your Indian Prince(ss) Without Having to Kiss Too Many Frogs.”  Unfortunately, Tim Janzen is speaking about Autosomal Mapping at the same time.  I think lots of people will want to attend both of these sessions, and both do deal with using autosomal DNA as a tool.  Autosomal is only a part of my presentation however.

Family Tree DNA is also providing Roundtable Discussions and I’ll be monitoring, moderating or hostessing (whatever the appropriate term) 2 separate tables, one on Saturday and one on Sunday for Y-SNPs and Mitochondrial DNA, respectively, along with other volunteers.

For those attending, I’ll see you on Friday at the reception.  For those who will be waiting for information, hopefully I’ll be blogging something on Friday evening after the reception if there is anything to report.  The sessions don’t actually begin until Saturday morning.  Check your Twitter feeds and Facebook for other information posted by other attendees throughout the day.

The conference schedule is here.

It’s always wonderful to see my genetic genealogy friends and cousins once again, so safe journey and see you in Houston!!!

______________________________________________________________

Disclosure

I receive a small contribution when you click on some of the links to vendors in my articles. This does NOT increase the price you pay but helps me to keep the lights on and this informational blog free for everyone. Please click on the links in the articles or to the vendors below if you are purchasing products or DNA testing.

Thank you so much.

DNA Purchases and Free Transfers

Genealogy Services

Genealogy Research

WikiTree and DNA

Several years ago, at a DNA conference, I found myself sitting next to Peter Roberts at lunch.  We discovered common ground – how can you NOT discover common ground at a genetic genealogy conference?  We’ve kept in touch ever since.  One of the things we discussed is the daunting task of managing multiple “stories” about the same ancestor, and now, DNA information that relates to that ancestor.  Or maybe, the DNA information doesn’t relate to that ancestor, but “should.”  How do we handle all of these challenges, separately or together?  Peter, an archivist by trade, has a special interest in organizing records, of course, and has been working on this topic.  I asked him to share his recent experience with WikiTree, and he has been gracious enough to do so.  Here’s what he had to say.

We know how personal computers changed the genealogy landscape by allowing us to build our own genealogy databases.  The next step was the Internet which provided easier communication and convenient access to family history information.  Then came DNA which allowed us to confirm if our genealogies were indeed correct.  Now there is a new genetic genealogy tool, WikiTree, that puts it all together for free!
wikitree 1

Peter Roberts originally tested in 2003 and has been not-so-patiently waiting since then for one collaborative online ancestral tree where we can all hang our results.  First he tried uploading a large GEDCOM in WikiTree but faced the daunting task of trying to merge his records with so many of his ancestors among the 6.1 million already in WikiTree.  He opted for a manual approach and focused on DNA tested lines for himself and cousins.

Fortunately, WikiTree has addressed and includes DNA testing.  In Peter’s public profile under “DNA” WikiTree asked, “Has Peter taken a DNA test for genealogy?”  Well yes! As many as he could afford.  He clicked through to an “Add a New Test” page where he selected one of the Y-DNA test options from a drop down menu which generated entry fields for Haplogroup, Number of Markers, YSearch ID, and Kit Number.  He did the same for his mtDNA and atDNA tests and entered his MitoSearch and GEDmatch IDs.  And for good measure he added the ancestry and Y-DNA results for a distant paternal line cousin (whose test kit he manages) who he listed as “Anonymous Roberts” to wikitree 2protect the man’s privacy.  For that easy work WikiTree awarded each test taker a handsome DNA Tested badge which can be displayed on the tester’s public profile.

Like magic (but it actually took about 24 hours) in the public profiles of Peter’s direct line ancestors, WikiTree automatically provided links to corresponding results in YSearch and MitoSearch.  And cousin Anonymous was there also.  Here’s the screen shot from WikiTree regarding DNA testing relevant to this ancestor, Bennie Roberts.

wikitree 3

Now anyone can see Peter’s DNA test list and compare his results with those of his direct line cousins to determine if their DNA is a close enough match.  If not, then the mis-matching DNA is pointing out a problem in that direct line.

Peter’s crotchety cousin Rufus refuses to DNA test and his WikiTree profile notes by default “…there are no known yDNA or mtDNA test-takers in the same direct paternal or maternal line.”  It’s a reminder that perhaps someday Rufus’ son will do that honor.

The profile of Peter’s paternal grandfather, Bennie Roberts, http://www.wikitree.com/wiki/Roberts-7102 illustrates many beneficial features.  Under the DNA heading are the known Y-DNA testers in WikiTree who share his direct paternal line and the mtDNA tester who shares his direct maternal line.  These names link to their public WikiTree profiles.  Here is Peter’s page via the “person who DNA tested” link on his grandfather’s page.  Please note that while WikiTree is “free,” there is no such thing as a “free lunch” so Ancestry ads are plastered all over every page in strategically placed locations.  Peter has no control over this, and neither will you.

wikitree 4

To the right of the tester’s name is the testing company and the type of test (Y-DNA or mtDNA).  This links to a more descriptive Test Connections overview page.  A key feature on these test connections pages is the earliest known direct line ancestor is highlighted and followed by a link to a descendant chart of carriers of the type of DNA tested (Y-DNA http://www.wikitree.com/treewidget/Roberts-7104/890 or mtDNA http://www.wikitree.com/treewidget/Unknown-205578/890).  Unlike many other online genealogy databases, these charts have a web addresses (urls) which facilitates sharing.

wikitree 5

Peter is now joyously (joyfully?) decorating his ancestral tree with haplogroup ornaments and haplotype garlands as well as project badges. His tree is growing in an aspen forest and there is something special about aspen forests.

Aside from the obvious “tree” challenges, in terms of results that might not match the expected line and are not part, genetically, of the aspen forest, there are also other challenges to be addressed.  Over time, the naming of haplogroups has become confusing.  This is because haplogroups are defined by SNPs that are given names like M-269.  M-269 happens to define haplogroup R1b1a2, which used to be R1b1c.

wikitree 6

Genealogists have tried to fit the SNPs into a tree-like structure, shown above (tree compliments of Family Tree DNA) because we understand trees and haplogroups are like trees (trunk, branches, leaves) – but the problem occurred when newly discovered branches needed to be inserted in-between already existing branches that already had names.  Every downstream branch’s name shifted, for example, from R1b1c to R1b1a2, and confusion resulted.  Today, we are moving away from haplogroup names like R1b1a2 and using only the SNP name, M269, which will never change.  Of course, the problem with this is that the name doesn’t give you any idea of where the SNP falls on the tree, where the old nomenclature did – R1b1a2 was downstream from R1b1a which was downstream from R1b1, etc.

When entering information into WikiTree, Y chromosome (Y-DNA) haplogroups should be labeled with the first letter of the major haplogroup branch followed by a dash and the name of the final (downstream or most recent) SNP. For example: R-M269 which is the SNP for R1b1a2.  Because separate labs have reported different labels over time for haplogroups and their subclades, and because there is no verification process for how haplogroups are entered in WikiTree, there will be inconsistencies in haplogroup labeling.  So in the note field it is important to explain how you came up with that haplogroup (eg. Estimated haplogroup R-CTS241, aka R1b1a2a1a2c1 per ISOGG Y-DNA Haplogroup Tree, 17 Jul 2013).  Also, remember to update your information at WikiTree if you take more DNA tests or upgrade.

The source and the date for the Mitochondrial (mtDNA) haplogroups should be entered as reported by the genetic genealogy testing lab, along with which lab did the testing. An example is: L3f. If you have additional knowledge of your more precise subclade (e.g. from full sequence results) then use the more precise haplogroup label.

Peter notes that more features are revealed once you are a registered WikiTree user.

For more information and guidelines see the help pages at

http://www.wikitree.com/wiki/Project:DNA

http://www.wikitree.com/wiki/DNA

Thanks much to Peter Roberts for sharing with us.  Think you might be related or have questions?  You can contact Peter directly at peterebay@yahoo.com.

______________________________________________________________

Disclosure

I receive a small contribution when you click on some of the links to vendors in my articles. This does NOT increase the price you pay but helps me to keep the lights on and this informational blog free for everyone. Please click on the links in the articles or to the vendors below if you are purchasing products or DNA testing.

Thank you so much.

DNA Purchases and Free Transfers

Genealogy Services

Genealogy Research

Native American Maternal Haplogroup A2a and B2a Dispersion

Recently, in Phys.org, they published a good overview of a couple of recently written genetic papers dealing with Native American ancestry.  I particularly like this overview, because it’s written in plain English for the non-scientific reader.

In a nutshell, there has been ongoing debate that has been unresolved surrounding whether or not there was one or more migrations into the Americas.  These papers use these terms a little differently.  They not only talk about entry into the Americas but also dispersion within the Americans, which really is a secondary topic and happened, obviously, after the initial entry event(s).

The primary graphic in this article, show below, from the PNAS article, shows the distribution within the Americas of Native American haplogroups A2a and B2a.

a2a, b2a

Schematic phylogeny of complete mtDNA sequences belonging to haplogroups A2a and B2a. A maximum-likelihood (ML) time scale is shown. (Inset) A list of exact age values for each clade. Credit: Copyright © PNAS, doi:10.1073/pnas.0905753107

As you can see, the locations of these haplogroups are quite different and the various distribution models set forth in the papers account for this difference in geography.

One of the aspects of this paper, and the two academic papers on which it is based, that I find particularly encouraging is that the researchers are utilizing full sequence mitochondrial DNA, not just the HVR1 or HVR1+HVR2 regions which has all too often been done in the past.  In all fairness, until rather recently, the expense of running the full sequence was quite high and there were few (if any) other results in the academic data bases to compare the results with.  Now, the cost is quite reasonable, thanks in part to genetic genealogy and new technologies, and so the academic testing standards are changing.  If you’ll note, Alessandro Achilli, one of the authors of these papers and others about Native Americans as well, also comments towards the end that full genome testing will be being utilized soon.  I look forward to this new era of research, not only for Native Americans but for all of us searching for our roots.

Read the Phys.org paper at: http://phys.org/news/2013-09-mitochondrial-genome-north-american-migration.html#jCp

The original academic papers are found here and here.  I encourage anyone with a serious interest in this topic to read these as well.

______________________________________________________________

Disclosure

I receive a small contribution when you click on some of the links to vendors in my articles. This does NOT increase the price you pay but helps me to keep the lights on and this informational blog free for everyone. Please click on the links in the articles or to the vendors below if you are purchasing products or DNA testing.

Thank you so much.

DNA Purchases and Free Transfers

Genealogy Services

Genealogy Research

Ancestor of Native Americans in Asia was 30% “Western Eurasian”

The complete genome has recently been sequenced from 4 year old Russian boy who died 24,000 years ago near Lake Baikal in a location called Mal’ta, the area in Asia believed to be the origin of the Native Americans based on Y DNA and mitochondrial chromosome similarities.  The map below, from Science News, shows the location.

malta boy map

This represents the oldest complete genome ever sequenced, except for the Neanderthal (38,000 years old) and Denisovan (41,000 years old).

This child’s genome shows that he is related closely to Native Americans, and, surprisingly, to western Asians/eastern Europeans, but not to eastern Asians, to whom Native Americans are closely related.  This implies that this child was a member of part of a “tribe” that had not yet merged or intermarried with the Eastern Asians (Japan, China, etc.) that then became the original Native Americans who migrated across the Beringian land bridge between about 15,000 and 20,000 years ago.

One of the most surprising results is that about 30% of this child’s genome is Eurasian, meaning from Europe and western Asia, including his Y haplogroup which was R and his mitochondrial haplogroup which was U, both today considered European.

This does not imply that R and U are Native American haplogroups or that they are found among Native American tribes before European admixture in the past several hundred years.  There is still absolutely no evidence in the Americas, in burials, for any haplogroups other than subgroups of Q and C for males and A, B, C, D, X and M (1 instance) for females.  However, that doesn’t mean that additional evidence won’t be found in the future.

While this is certainly new information, it’s not unprecedented.  Last year, in the journal Genetics, an article titled “Ancient Admixture in Human History” reported something similar, albeit gene flow in a different direction.  This paper indicated gene flow from the Lake Baikal area to Europe.  It certainly could have been bidirectional, and this new paper certainly suggests that it was.

So in essence, maybe there is a little bit of Native American in Europeans and a little bit of European in Native Americans that occurred in their deep ancestry, not in the past 500-1000 years.

What’s next?  Work continues.  The team is now attempting to sequence genomes from other skeletons from west of Mal’ta, East Asia and from the Americas as well.

You can read the article in Science Magazine.  An academic article presenting their findings in detail will be published shortly in Nature.

A Podcast with Michael Balter can be heard here discussing the recent discovery.

______________________________________________________________

Disclosure

I receive a small contribution when you click on some of the links to vendors in my articles. This does NOT increase the price you pay but helps me to keep the lights on and this informational blog free for everyone. Please click on the links in the articles or to the vendors below if you are purchasing products or DNA testing.

Thank you so much.

DNA Purchases and Free Transfers

Genealogy Services

Genealogy Research

Human Genetics Revolution Tells Us That Men and Women Are Not the Same

Stop laughing.  I know, my initial reaction too was, “really – it took genetics to tell us that?”  But this is serious….really.

Males are 99.9% the same when compared to other males, and females are as well when compared to other females, but males and females are only 98.5% equal to each other – outside of the X and Y chromosomes.  The genetic difference between men and women is 15 times greater than between two men or two women.  In fact, it’s equal to that of men and male chimpanzees.  So men really are from….never mind.  It’s OK to laugh now…

men-women 1

We’ve been taught that other than X and Y, males and females are genetically exactly the same.  They aren’t.

men-women 2

Does this matter?  Dr. David Page, Director of the Whitehead Institute and MacArthur Genius Grant winner, says it absolutely does.  He has discovered that both the X and Y chromosomes function throughout the entire body, not just within the reproductive tract.

In his words, “Humane Genome, we have a problem.”  Medicine and research fails to take into account this most fundamental difference.  We aren’t unisex, and our bodies know this – every cell knows it at the molecular level, according to Dr. Page.

For example, some non-reproductive tract diseases appear in vastly different percentages in men and women.  Autism is found in 5 times as many males as females, Lupus in 6 times as many women as men and Rheumatoid Arthritis in 5 times as many women as men.  In other diseases, men and women either react differently to disease treatment, react differently to the disease itself, or both.  Dr. Page explains more and suggests a way forward in this short but very informative video.

About Dr. David Page:

David Page, Director of the Whitehead Institute and professor of biology at MIT, has shaped modern genomics and mapped the Y chromosome.  His renowned studies of the sex chromosomes have shaped modern understandings of reproductive health, fertility and sex disorders.

______________________________________________________________

Disclosure

I receive a small contribution when you click on some of the links to vendors in my articles. This does NOT increase the price you pay but helps me to keep the lights on and this informational blog free for everyone. Please click on the links in the articles or to the vendors below if you are purchasing products or DNA testing.

Thank you so much.

DNA Purchases and Free Transfers

Genealogy Services

Genealogy Research

Why Are My Predicted Cousin Relationships Wrong?

The answer is, because inherited DNA segments do not always follow the 50% rule.  I guess maybe no one told them???

Many times, when we receive our autosomal DNA results, we wonder why predicted relationships, particularly distant ones, aren’t accurate.  Sometimes people estimated to be 3rd cousins, or maybe 2nd to 4th cousins, turn out to be 6th cousins, for example.  This happens because genetic predictions must use math models and averages, but our actual DNA doesn’t follow those rules.

Dr. Steve Mount is an Associate Professor of Cell Biology and Molecular Genetics at the University of Maryland.  In February 2011, he wrote an article about his experience submitting his DNA to 23andMe and his experiences matching his cousins.  More specifically, he became interested in one particular segment of DNA trackable to a specific ancestor.

He shares these insights.

  • Distant relatives (4th cousins and beyond) often share no genetic material at all.
  • It is possible to share a segment with very distant relatives.
  • Sometimes, more distant relationships are more likely.
  • Most of your relatives may be descended from a small fraction of your ancestors.

In genetic genealogy, people who deal with autosomal DNA spend a lot of time trying to figure out which segments are IBD vs IBS – Identical by Descent versus Identical by State.  In laymen’s terms, identical by descent means that you do in fact share a common ancestor in a timeframe in which you might be able to identify them.  Identical by state really implies, technically, that you just happen to have the same DNA due to spontaneous mutations, not because you share a common ancestor.  In reality, it’s taken to mean that you descend from a common population –  in other words, you do share a common ancestor but the segment is so small that it implies that the ancestor is so far back in time that you can’t possibly identify them.  Some people call these matches “false positives” which really isn’t accurate.

Far from being useless, these small segments are very useful in identifying different ethnic populations found in your ancestral tree and can, often in conjunction with larger segments also be useful in identifying ancestral lines.  Discounting small segments, especially if you share a common ancestor, is akin to throwing away pennies because they aren’t as useful and are more difficult to manage than quarters or dollars.  Furthermore, small segments may be our only way of identifying ancestors that are many generations back in our tree.  After all, we inherited all of our DNA from some ancestor, no matter how small the segments are today.

Because we have no better rule of thumb (or statistical model), we utilize the theory that one inherits about 50% of the DNA of each ancestor in each generation.  We know this is absolutely true between Mom and Dad, but you don’t receive exactly 25% of each of your grandparents’ DNA.  However, the mixture of what and how much of your grandparents’ DNA you do inherit is approximately 25% and appears to be random, like a card shuffle.  If it’s not random, we don’t know what the rules of inheritance are.

In the past few years, as we’ve come to work more closely with autosomal results, we have learned that while the rules of thumb about how much DNA you inherit from specific ancestors are useful, they are not absolute.  In other words, it’s certainly possible to inherit a very large chunk of DNA from a very specific distant ancestor when the rules of probability and the rule of thumb of 50% would indicate that you should not.

This is shown clearly in the Vannoy project where 5 cousins who descend from Elijah Vannoy born in 1786 (5 generations removed) share a very significant portion of chromosome 15.  These people are all 5 generations or more distantly related from the common ancestor, (approximate 4th cousins) and should share less than 1% of their DNA in total, and certainly no large, unbroken segments.   As you can see, below, that’s not the case.  We don’t know why or how some DNA clumps together like this and is transmitted in complete (or nearly complete) segments, but they obviously are.  We often call these “sticky segments” for lack of a better term.

cousin 1

I downloaded this information into a spreadsheet where I can sort it by chromosome.  Below you can see the segments on chromosome 15 where these cousins match me.  Note that Buster is also a cousin from a second ancestor.

cousin 2

Given these incidental discoveries and the very large amount of DNA I share with these cousins on chromosome 15, I was quite interested in Dr. Mount’s following commentary:

“The probability that fourth cousins share at least one IBD [identical by descent] segment is 77%, and the expected length of this segment is 10 cM.” Now consider the next step. There is a 50% chance that that one shared segment will not be transmitted at all, but a 90% chance that if it is transmitted it will be just as big as it was (the same 10 cM.). What this means for genealogy on 23andMe is that for two people sharing one segment identical by descent there is no way to reliably estimate how far back the common ancestor was. Furthermore, no improvement in software can possibly change that, because the limitation is imposed by the genetics itself.”

Well, there goes the 50% rule – flying right out the window.  The 50% rule of thumb says that in any given transmission, there is a 50% chance that it will be transmitted (so good so far) and that if it is transmitted, roughly half of it would be transmitted, or approximately 5 cM..  That’s obviously not what is happening.

Dr. Mount goes on to say that, “No matter how far back you go, every nucleotide of one’s genome is derived from some ancestor, and even going back 20 generations, the chance that the bit which has been inherited is part of a block 5 cM. or greater is still appreciable. In fact, even for 19th cousins, there is a real chance (13%) that any segment of DNA they have inherited in common will be 5 cM. or greater. Of course, as mentioned above, there is very little chance that two 19th cousins will share any IBD segments at all, but this is offset if one has many 19th cousins, which is often the case.”

5cM is the line-in-the-sand cutoff number many genetic genealogists use to determine whether DNA segments are IBD or IBS.

What this really means is that the more distant, or 19th, cousins that you have, the greater the chance that one or more of them will test and will indeed share a piece of DNA large enough to be identified by the testing companies as relevant.  The software companies will then apply their relationship estimating software to the size of the match and number of SNPs.  The results are often inaccurate, as Dr. Mount says.  Not inaccurate in that the match is incorrect, but the estimated relationship is incorrect because the DNA did not divide in half as the mathematical model says it should.  The “problem” is not in the software, but in the DNA itself.

“23andMe reports a “predicted relationship” (e.g. “4th cousin”) and a “relationship range” (e.g. “3rd to 7th cousin”). However, these ranges are likely to be wildly inaccurate, because the likely distance to a common ancestor, given only the information that two people share a single IBD segment, can vary enormously, based largely on how many relatives one has.”

And I will add, it will also vary by how and how much the DNA has or has not divided in every generation.

Dr. Mount goes on to provide the math and probability formulas for these various calculations, and explains what they mean, in English, then he summarizes by saying, “

“Thus, if you have many more distant cousins, as would be expected if your ancestors had large families, then someone who shares a single IBD segment is more likely to be a distant cousin, because you have so many more distant cousins. The point where the increase in the number of cousins outweighs the loss of shared segments is five children per family. This is not extremely uncommon.”

This actually makes a lot of sense when I look at my results.  One of my ancestors, Abraham Estes (1647-1720) had at least 12 children of which 11 reproduced and had very large families.  This line was extremely prolific.  Many of my autosomal matches include Estes descendants.  Some of my other lines where my ancestor was one of just a few children have far fewer matches, likely because there are far fewer people out there descended from them.

Dr. Mount confirms this by saying that, “If one family among [your] 32 [great-great-great-grandparents] had five children and their descendants did as well, while others in the family reproduced at replacement rates (two children per family), then your more prolific ancestors (the parents of just one of your 31 great-great-grandparents) would account for over 3/4 of your fourth cousins.”

So what is the take away message to us from all of this?

  • The autosomal testing companies are doing the best they can predicting your cousin-level relationships with what they have to work with.
  • Real life genetic transmission does not follow the 50% rule of thumb beyond the first generation (parent-child).
  • The predictions get more uncertain and therefore unreliable the more distant they are.
  • Based on the unmeasureable randomness of the genetic transmission involved, there is no way for the testing companies to improve their predictions.
  • Expect more matches to your more prolific lines, and less to lines who had fewer children.
  • Beyond about the first or second cousin level, understand that predictions are only suggestions based on math.  Given that you understand why and how reality can vary, you can then utilize this information when analyzing your matches.
  • Drawing an arbitrary cM line for IBS vs IBD and utilizing only the segments above that threshold may eliminate the small segments you need to identify ancestors many generations removed.
  • Endogamous populations throw a monkey wrench into estimates and calculations, because population members are likely related many times over in unknown ways.  This makes the estimate of relatedness of two people appear closer than it is genealogically.  At least one of the testing companies, Family Tree DNA, attempts to correct for this mathematically when they are aware of the situation, such as in Jewish families.

You can read Dr. Mount’s article including his mathematical proofs, here.

______________________________________________________________

Disclosure

I receive a small contribution when you click on some of the links to vendors in my articles. This does NOT increase the price you pay but helps me to keep the lights on and this informational blog free for everyone. Please click on the links in the articles or to the vendors below if you are purchasing products or DNA testing.

Thank you so much.

DNA Purchases and Free Transfers

Genealogy Services

Genealogy Research

Determining Ethnicity Percentages

Recently, as a comment to one of my blog postings, someone asked how the testing companies can reach so far back in time and tell you about your ancestors.  Great question.

The tests that reliably reach the furthest back, of course, are the direct line Y-Line and mitochondrial DNA tests, but the commenter was really asking about the ethnicity predictions.  Those tests are known as BGA, or biogeographical ancestry tests, but most people just think of them or refer to them as the ethnicity tests.

Currently, Family Tree DNA, 23andMe and Ancestry.com all provide this function as a part of their autosomal product along with the Genographic 2.0 test.  In addition, third party tools available at www.gedmatch.com don’t provide testing, but allow you to expand what you can learn with their admixture tools if you upload your raw data files to their site.  I wrote about how to use these ethnicity tools in “The Autosomal Me” series.  I’ve also written about how accurate ethnicity predictions from testing companies are, or aren’t, here, here and here.

But today, I’d like to just briefly review the 3 steps in ethnicity prediction, and how those steps are accomplished.  It’s simple, really, in concept, but like everything else, the devil is in the details.devil

There are three fundamental steps.

  • Creation of the underlying population data base.
  • Individual DNA extraction.
  • Comparison to the underlying population data base.

Step 1:  Creation of the underlying population data base.

Don’t we wish this was as simple as it sounds.  It isn’t.  In fact, this step is the underpinnings of the accuracy of the ethnicity predictions.  The old GIGO (garbage in, garbage out) concept applies here.

How do researchers today obtain samples of what ancestral populations looked like, genetically?  Of course, the evident answer is through burials, but burials are not only few and far between, the DNA often does not amplify, or isn’t obtainable at all, and when it is, we really don’t have any way to know if we have a representative sample of the indigenous population (at that point in time) or a group of travelers passing through.  So, by and large, with few exceptions, ancient DNA isn’t a readily available option.

The second way to obtain this type of information is to sample current populations, preferably ones in isolated regions, not prone to in-movement, like small villages in mountain valleys, for example, that have been stable “forever.”  This is the approach the National Geographic Society takes and a good part of what the Genograpic Geno 2.0 project funding does.  Indigenous populations are in most cases our most reliable link to the past.  These resources, combined with what we know about population movement and history are very telling.  In fact, National Geographic included over 75,000 AIMs (Ancestrally Informative Markers) on the Geno 2.0 chip when it was released.

The third way to obtain this type of information is by inference.  Both Ancestry.com and 23andMe do some of this.  Ancestry released its V2 ethnicity updates this week, and as a part of that update, they included a white paper available to DNA participants.  In that paper, Ancestry discusses their process for utilizing contributed pedigree charts and states that, aside from immigrant locations, such as the United States and Canada, a common location for 4 grandparents is sufficient information to include that individuals DNA as “native” to that location.  Ancestry used 3000 samples in their new ethnicity predictions to cover 26 geographic locations.  That’s only 115 samples, on average, per location to represent all of that population.  That’s pretty slim pickins.  Their most highly represented area is Eastern Europe with 432 samples and the least represented is Mali with 16.  The regions they cover are shown below.

ancestry v2 8

Survey Monkey, a widely utilized web survey company, in their FAQ about Survey Size For Accuracy provides guidelines for obtaining a representative sample.  Take a look.  No matter which calculations you use relative to acceptable Margin of Error and Confidence Level, Ancestry’s sample size is extremely light.

23andMe states in their FAQ that their ethnicity prediction, called Ancestry Composition covers 22 reference populations and that they utilize public reference datasets in addition to their clients’ with known ancestry.

23andMe asks geographic ancestry questions of their customers in the “where are you from” survey, then incorporates the results of individuals with all 4 grandparents from a particular country.  One of the ways they utilize this data is to show you where on your chromosomes you match people whose 4 grandparents are from the same country.  In their tutorial, they do caution that just because a grandparent was born in a particular location doesn’t necessarily mean that they were originally from that location.  This is particularly true in the past few generations, since the industrial revolution.  However, it may still be a useful tool, when taken with the requisite grain of salt.

23andme 4 grandparents

The third way of creating the underlying population data base is to utilize academically published information or information otherwise available.  For example, the Human Genome Diversity Project (HGDP) information which represents 1050 individuals from 52 world populations is available for scrutiny.  Ancestry, in their paper, states that they utilized the HGDP data in addition to their own customer database as well as the Sorenson data, which they recently purchased.

Academically published articles are available as well.  Family Tree DNA utilizes 52 different populations in their reference data base.  They utilize published academic papers and the specific list is provided in their FAQ.

As you can see, there are different approaches and tools.  Depending on which of these tools are utilized, the underlying data base may look dramatically different, and the information held in the underlying data base will assuredly affect the results.

Step 2:  Your Individual DNA Extraction

This is actually the easy part – where you send your swab or spit off to the lab and have it processed.  All three of the main players utilize chip technology today.  For example, 23andMe focuses on and therefore utilizes medical SNPs, where Family Tree DNA actively avoids anything that reports medical information, and does not utilize those SNPs.

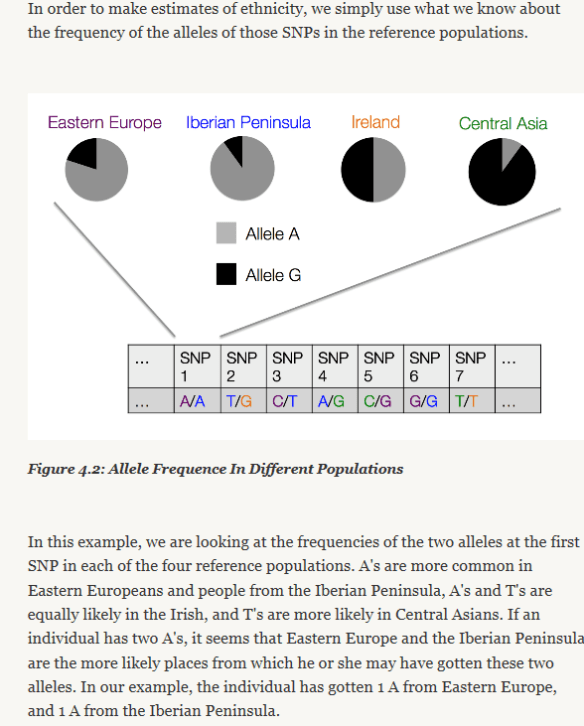
In Ancestry’s white paper, they provide an excellent graphic of how, at the molecular level, your DNA begins to provide information about the geographic location of your ancestors.  At each DNA location, or address, you have two alleles, one from each parent.  These alleles can have one of 4 values, or nucleotides, at each location, represented by the abbreviations T, A, C and G, short for Thymine, Adenine, Cytosine and Guanine.  Based on their values, and how frequently those values are found in comparison populations, we begin to fine correlations in geography, which takes us to the next step.

ancestry allele snps

Step 3:  Comparison to Underlying Population Data Base

Now that we have the two individual components in our recipe for ethnicity, a population reference set and your DNA results, we need to combine them.

After DNA extraction, your individual results are compared to the underlying data base.  Of course, the accuracy will depend on the quality, diversity, coverage and quantity of the underlying data base, and it will also depend on how many markers are being utilized or compared.

For example, Family Tree DNA utilizes about 295,000 out of 710,000 autosomal SNPs tested for ethnicity prediction.  Ancestry’s V1 product utilized about 30,000, but that has increased now to about 300,000 in the 2.0 version.

When comparing your alleles to the underlying data set one by one, patterns emerge, and it’s the patterns that are important.  To begin with, T, A, C and G are not absent entirely in any population, so looking at the results, it then becomes a statistics game.  This means that, as Ancestry’s graphic, above, shows, it becomes a matter of relativity (pardon the pun), and a matter of percentages.

For example, if the A allele above is shown is high frequencies in Eastern Europe, but in lower frequencies elsewhere, that’s good data, but may not by itself be relevant.  However if an entire segment of locations, like a street of DNA addresses, are found in high percentages in Eastern Europe, then that begins to be a pattern.  If you have several streets in the city of You that are from Eastern Europe, then that suggests strongly that some of your ancestors were from that region.

To show this in more detailed format, I’m shifting to the third party tool, GedMatch and one of their admixture tools.  I utilized this when writing the series, “The Autosomal Me” and in Part 2, “The Ancestor’s Speak,” I showed this example segment of DNA.

On the graph below, which is my chromosome painting of one a small part of one of my chromosomes on the top, and my mother’s showing the exact same segment on the bottom, the various types of ethnicity are colored, or painted.

The grid shows location, or address, 120 on the chromosome and each tick mark is another number, so 121, 122, etc.   It’s numbered so we can keep track of where we are on the chromosome.

You can readily see that both of us have a primary ethnicity of North European, shown by the teal.  This means that for this entire segment, the results are that our alleles are found in the highest frequencies in that region.

Gedmatch me mom

However, notice the South Asian, East Asian, Caucus, and North Amerindian. The important part to notice here, other than I didn’t inherit much of that segment at 123-127 from her, except for a small part of East Asian, is that these minority ethnicities tend to nest together.  Of course, this makes sense if you think about it.  Native Americans would carry Asian DNA, because that is where their ancestors lived.  By the same token, so would Germans and Polish people, given the history of invasion by the Mongols. Well, now, that’s kind of a monkey-wrench isn’t it???

This illustrates why the results may sometimes be confusing as well as how difficult it is to “identify” an ethnicity.  Furthermore, small segments such as this are often “not reported” by the testing companies because they fall under the “noise” threshold of between about 5 and 7cM, depending on the company, unless there are a lot of them and together they add up to be substantial.

In Summary

In an ideal world, we would have one resource that combines all of these tools.  Of course, these companies are “for profit,” except for National Geographic, and they are not going to be sharing their resources anytime soon.

I think it’s clear that the underlying data bases need to be expanded substantially.  The reliability of utilizing contributed pedigrees as representative of a population indigenous to an area is also questionable, especially pedigrees that only reach back two generations.

All of these tools are still in their infancy.  Both Ancestry and Family Tree DNA’s ethnicity tools are labeled as Beta.  There is useful information to be gleaned, but don’t take the results too seriously.  Look at them more as establishing a pattern.  If you want to take a deeper dive by utilizing your raw data and downloading it to GedMatch, you can certainly do so. The Autosomal Me series shows you how.

Just keep in mind that with ethnicity predictions, with all of the vendors, as is particularly evident when comparing results from multiple vendors, “your mileage may vary.”  Now you know why!

______________________________________________________________

Disclosure

I receive a small contribution when you click on some of the links to vendors in my articles. This does NOT increase the price you pay but helps me to keep the lights on and this informational blog free for everyone. Please click on the links in the articles or to the vendors below if you are purchasing products or DNA testing.

Thank you so much.

DNA Purchases and Free Transfers

Genealogy Services

Genealogy Research

Correlating Historical Facts to DNA Test Results

Sometimes DNA tests hold surprising results, results that the individual didn’t expect.  That’s what happened to Jack Goins, Hawkins County, Tn. Archivist and founder of the Melungeon Core DNA project.  Jack, a Melungeon descendant through several ancestors, expected that his Y paternal haplogroup would be either European or Native American, based on oral family history, but it wasn’t, it was E1b1a, African.

Jack’s family and ancestors were key members of the Melungeon families found in Hawkins and Hancock Counties in Tennessee beginning in the early 1800s.  In order to discover more about this group of people, which included but was not limited to his own ancestors, Jack founded the Melungeon DNA projects.

Over time, descendants of most of the family lines had representatives test within both a Y-line and mitochondrial DNA project.  The results were a paper, Melungeons, A Multi-Ethnic Population, published in JOGG, the Journal of Genetic Genealogy, in April 2012.

Many people expected to discover that the Melungeons were primarily Native American, but this was not the outcome of the DNA project.  In fact, many of the direct paternal male lines were African and all of the direct maternal female lines tested were European.  While there are paper records, in one case, that state that one of the ancestors of the Melungeons was Native American (Riddle), and there is DNA testing of another line that married into the Melungeon families that proves that indirect line is Native American (Sizemore), there is no direct line testing that indicates Native ancestry.

Aside from the uproar the results caused among researchers who were hopeful of a different outcome, it also begs the question of whether the documents we do have of those families support the DNA results.  What did the contemporary people who knew them during their lifetime think about their race?  Census takers, tax men and county clerks?  Are there patterns that emerge?  Sometimes, when we receive new information, be it genetic or otherwise, we need to revisit our documentation and look with a new set of eyes.

It’s common practice in genetic genealogy circles when “undocumented adoptions” are discovered, for example, to revisit the census and look for things like a child’s birthdate being before the parents’ marriage.  Something that went unnoticed during initial data gathering or was assumed to be in error suddenly becomes extremely important, perhaps the key to unraveling what happened to those long-ago ancestors.  Like in all projects, some descendant lines we expected to match, didn’t.

Recently Jack Goins undertook such an analysis of the documentary records collected over the years in the various counties where the Melungeon families or their direct ancestors lived.  We know that today, and in the 1900s, most of these families appear physically primarily European, an observation supported by autosomal DNA testing.  So we’re looking for records that indicate minority admixture.

Do the records indicate that these people were black, Native, European, mixed or something else, like Portuguese?  Was the African admixture recent, so recent that their descendants were viewed as mixed-race, or were the African haplogroups introduced long ago, hundreds or thousands of years ago perhaps, maybe in Mediterranean Europe?  If that was the case, then the Melungeon ancestors in America would have been considered “European,” meaning they looked white.  What do the records say about these families?  Were they uniformly considered white, black, mixed or Native in all of the locations where family members moved as they dispersed out of colonial Virginia?

If these men were Native Americans, would they have likely fought against the Indians in the French and Indian War in 1754?  Melungeon ancestors did just that and they are specifically noted as fighting “against the Shawnee.”  Their families were found in census records as “free people of color” and “mulatto” countless times which indicates they were not slaves and were not white.  On one later census record, below, in 1880, Portugee was overstricken and W for white entered.

1880 census
1880 census 2

Melungeon families and their ancestors were listed on tax records and other records as mulattoes, never as mustee and only once as Indian.  Mulattoes are typically mixed black and white, although it can be Native and white, while mustee generally means mixed Indian with something else.  On one 1767 tax list, Moses Riddle, a maternal ancestor of a Melungeon family is listed as Indian, but this is the only instance found in the hundreds of records searched.  The Riddle family paternal haplogroup reflects European ancestry so apparently the Indian ancestor originated in a maternal line.

Court records identify Melungeon families as “colored” and “black” and “African” and “free negroes and mulattoes” as well as white.  In the 1840s, a group of Melungeon men, descendants of these individuals classified as mulattoes and free people of color were prosecuted for voting, a civil liberty forbidden to those “not white,” and probably as a political move to make examples of them.  Some of these men were found not guilty, one simply paid the fine, probably to avoid prosecution due to his advanced age, and the cases were dismissed against the rest.  Some were also prosecuted for bi-racial marriage when it was illegal for anyone of mixed heritage to marry a white person.  In earlier cases, in the 1700s in Virginia, these families were prosecuted for “concealing tithables” specifically for not listing their wives, “being mulattoes.”  In another case, the records indicate an individual being referred to as ‘yellow complected,’ a term often used for a light skinned mulatto.  And yet another case states that while the men were “mulattos,” their fathers were free and their wives were white.

There are many records, more than 1600 in total that we indexed and cataloged when writing the paper, and more have surfaced since.  In all of those records, only one contemporaneous record, the 1767 Riddle tax list, states the person was an Indian.  None, other than the 1880 census record, state that they were Portuguese.  There are many that indicate African or mixed heritage, of some description, and there are also many that don’t indicate any admixture.  Especially in later census, as the families outmarried to some extent, they were nearly uniformly listed as white.  Still, this group of people looked “different” enough from their neighbors to be labeled with the derisive name of Melungeon.

While this group, based on mitochondrial DNA testing, did initially marry European women, generations of intermarriage would have caused the entire group to be darker than the nonadmixed European population in the 1700s and 1800s.  By this time, neither they nor their neighbors were sure what they were, so they claimed Portuguese and Indian.  No one claimed to have black ancestors, in fact, most denied it vehemently.  By this time, so many generations had passed that they may not have known the whole truth, and there is indeed evidence of two Indian lines within the Melungeon community.

In light of these records, the DNA results should not have been as surprising as they were.  However, this body of research had never been analyzed as a whole before.

Since the original paper was published, four additional paternal lines documented as Melungeon but without DNA representation/confirmation in the original paper have tested, and all four of them, Nichols, Perkins, Shoemake/Shumach and Bolin/Bolton carry haplogroup E1b1a.  They are not matches to each other or other Melungeon paternal lines, so it’s not a matter of undocumented adoptions within a community.

The DNA project administrators certainly welcome additional participants who descend from the Melungeon families.  Y-line DNA requires a male who descends from a patriarch via all males, given that males pass their Y chromosome to only sons.

There may indeed be Native American lines yet undiscovered within the female or ancestral lines, and we are actively seeking people descended from the wives of these Melungeon families through all women. Mitochondrial DNA, which tests the maternal line, is passed to both genders of children, but only females pass it on.  So to represent your Melungeon maternal ancestor, you must descend from her through all females, but you yourself can be either male or female.

While the primary focus is still to document the various direct family lines utilizing Y-line and mitochondrial DNA, the advent of autosomal testing has opened the door for other Melungeon descendants to test as well.  In fact, the project administrators have organized a separate project for all descendants who have taken the autosomal Family Finder test at Family Tree DNA called the Melungeon Families project.

The list of eligible Melungeon surnames is Bell, Bolton, Bowling, Bolin, Bowlin, Breedlove, Bunch, Collins, Denham, Gibson, Gipson, Goins, Goodman, Minor, Moore, Menley, Morning, Mullins, Nichols, Perkins, Riddle, Sizemore, Shumake, Sullivan, Trent and Williams.  For specifics about the paternal lines, patriarchs and where these families are historically located, please refer to the paper.

Furthermore, anyone with documented proof of additional Melungeon families or surnames is encouraged to provide that as well.  Surnames are only added to the list with proof that the family was referenced as Melungeon from a documented historical record or is ancestral to a documented Melungeon family.  For example, the Sizemore family was never directly referred to as Melungeon in documented sources, but Aggy Sizemore (haplogroup H/European), daughter of George Sizemore (haplogroup Q/Native) married Zachariah Minor (haplogroup E1b1a/African).  The Minor family is one of the Melungeon family names.  So while Sizemore itself is not Melungeon, it is certainly an ancestral name to the Melungeon group.

For more information, read Jack Goins’ article, Written Records Agree with Melungeon DNA Results.

______________________________________________________________

Disclosure

I receive a small contribution when you click on some of the links to vendors in my articles. This does NOT increase the price you pay but helps me to keep the lights on and this informational blog free for everyone. Please click on the links in the articles or to the vendors below if you are purchasing products or DNA testing.

Thank you so much.

DNA Purchases and Free Transfers

Genealogy Services

Genealogy Research