Geno 2.0 Results – Kicking the Tires

Update: Please note that the Genographic Project discontinued public sales of kits in 2019. I am leaving this article for historical context.

Yesterday, my husband’s Geno 2.0 results arrived.  I bought his kit for him for Christmas initially, but couldn’t wait that long so had him swab the very day it arrived.  So much for Santa’s surprise.  But wait, maybe his results will hold a surprise – and isn’t this the first day of Christmas?  Oh, it’s not?  Well, I’ve decided to establish a new tradition this year, that it is the first day of Christmas and this year we will simply have 15 days of Christmas.  The extra three days will be dedicated to Y-line SNPs, a mitochondrial haplogroup and ethnicity results.  Who wants a bird in a pear tree anyway?

Geno Kick JimMeet Jim.  Since you’re going to be looking as his “innards,” so to speak, I think you should formally meet him.  Pretty soon you’re going to be wondering what a Neanderthal, Denisovan, German, Greek, Mediterranean Hun looks like.  I wanted to use the photo of him kissing the dolphin in the Carribbean, but he wouldn’t let me.  Harumph.  I guess Huns have no sense of humor.

There’s a lot of information included on the new Genographic results webpage with some very cool features.  We’re not going to look at everything in-depth today, but we’ll do a flyover so you can see everything.  Right now, because everyone is checking the status of their results, the Genographic webpage is experiencing difficulties.  So if you click and wait, well, go get a cup of coffee.  It will eventually respond and multiple clicks only cause buffer problems when it does respond.  I know this from experience.  How many times have I said that patience is not a virtue attributed to me!

Oh yes, and I had much better luck with the webpage using Chrome as opposed to Internet Explorer 7.

The first screen you see is “Your Story.”  It’s large so I’ll break it into three parts for review.  Notice the 5 tabs at the top of the page.  You’ll be using those.  Actually, if you follow the story line, the story walks you through them all.

Geno kick story

The middle portion of this page shows your mitochondrial DNA, autosomal in the center, followed by your Y-line, if you’re a male.  Your haplogroup is displayed as well for mitochondrial, and your terminal SNP for males, which is the SNP that ultimately defines the deepest level of your haplogroup.  Well, at least until a new terminal SNP is discovered.

geno kick story 2

There are a couple of items of note here.

The tab titled “Your Map” simply won’t load, using either browser.  I’ve sent a note to National Geographic.  I know this is loading for other folks though.  I wonder if it has anything to do with Jim’s haplogroup.

Second, for Jim’s paternal line, CTS11962 is a new SNP not previously tested at Family Tree DNA.  CTS stands for Chris Tyler-Smith, a researcher in the UK at the Sanger Institute who discovered this particular SNP, and named it.

We knew in advance that the new standard for both the Geno 2.0 and also Family Tree DNA will be to only provide the terminal SNP and no longer rename the haplogroups in the way they used to be, such as R1a or R1b1a2.  However, the problem with this approach is that someone looking at this terminal SNP has no reference whatsoever at this point.  There isn’t even a “main” haplogroup branch given, nor a link to any explanation, or at least not that I can find.

After transferring Jim’s results to Family Tree DNA, I noticed that he is now labelled R1a1a1g on his Family Tree DNA haplogroup page.  It looked like his mitochondrial results didn’t transfer initially, but this morning after the Family Tree DNA webpage update, he does have results on his mtDNA Haplogroup Origins page, which is about all you can do with haplogroup only information.  Nat Geo, of course, does not test beyond haplogroup designation for mitochondrial.  However, it looks like his autosomal results didn’t transfer anyplace.  Hmmm….maybe a bug.  I’ll have to contact the helpdesk who is probably swamped this morning.

geno kick ftdna snp

Looking at his Family Tree DNA Haplogroup and SNPs page, all of the SNPs Jim was tested for at Nat Geo appear to be listed, but CTS11962, his terminal SNP, seems to be missing, so others may be as well.  Family Tree DNA updated the data base and web page today, but this didn’t seem to be resolved with the update this morning.  It also looks like it might be a page real estate issue in that this section of his page is quite full.

The bottom portion of the introductory Geno 2.0 page provides an interesting tidbit.

geno kick story 3

Yesterday, when one of my blog followers sent me his initial results, the “you are 1 of” number was 524,384, and that number had been used for some time, so it’s not dynamic.  This new number appeared a few hours later, so I’m thinking that the answer to the number of Geno 2.0 kits sold might be someplace in the ballpark of 35,131.  Just speculation on my part.

Let’s go back now and look at each section.

The mitochondrial DNA area provides a basic description of the haplogroup’s journey, then you can click to see the map.

Since his map won’t load, taking a look at another account I have access to, we see the following map information.

geno kick mito map

See the “share” button on the top right hand side of the next page?  This allows you to send e-mails or a number of other types of messages to friends with a nice summary page of your results.  Be sure to type a message in the message box with your full name because otherwise the recipient will have no idea whose info they are viewing.

Moving to the autosomal section, we see that they have divided the world into 9 regions, plus Neanderthal and Denisovan.

Geno kick auto 1

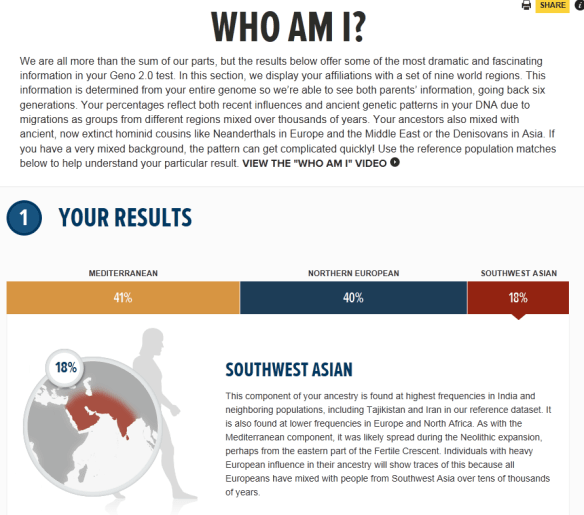
Jim is Mediterranean, Northern European and Southwest Asian.  His genealogy is entirely German and Hungarian.   He’s a second generation immigrant, so none of his genealogy is lost here in the US.  Of course, the term Hungarian should translate into “churning people” because the devastation of multiple wars spanning centuries has disrupted this population significantly.  The same holds true for Germany.  I would suggest that Germanic and Slavic would perhaps be a better description of his heritage.

In any case, the Mediterranean and Southwest Asian were somewhat of a surprise, but when you look at migration patterns, maybe not so much.  After all, we all came through the Middle East on our way out of African and if your ancestors migrated to Germany, they probably went through the Mediterranean unless they went over the Caucus Mountains instead. And that would give you Southwest Asian heritage most likely.

The only problem is, now Jim wants to go on another Mediterranean cruise to commune with his ancestral homeland.  DNA cruises anyone???

The next section explains what the results mean.  This is actually quite interesting because it compares you to the actual reference population.  In his case, in Germany.

geno kick auto 2

His second reference population was somewhat of a surprise.  It’s Greek.  Perhaps it’s the best reference population they have for “Mediterranean” as the Greeks are truly a mixture of just about everyone in the Mediterranean basin.

geno kick auto 3

They do provide links here to more information.  By clicking on the overview of all reference populations, they provide information about how these populations as a whole are made up today.

geno kick ref

I counted and there are 43 populations.  Another option is to click to review the 9 world regions.

geno kick world 1geno kick world 2

The Neanderthal and Denisovan ancestry is particularly interesting since it has been only recently, in the past couple of years, that humans were believed to have interbred with either group.  Neanderthals have been found throughout most of Europe and western Asia, and Denisovans lived in the Altai Mountains of Siberia.  If you click on the little links imbedded in many place on your page, you’ll see that there is more information about almost every topic.  For example, they tell us that everyone outside of Africa carries some Neanderthal and Denisovan.

geno kick hominid

On Jim’s Genographic page, the terminal SNP shown is M458, shown below the map.  Referring now to the ISOGG Y tree, we see that this equates to haplogroup R1a1a1b1a1.  I didn’t expect CTS11962 to be on the ISOGG tree just yet, and it isn’t, but neither is it anyplace else, so we basically have our hands tied relative to where this falls on the R tree until someone places it someplace.  I know that there is what is affectionately referred to as the “Big Paper” in the works that reworks the haplotree, and I surely hope it’s published sooner than later.  Yes, I know, that patience thing again…..sigh.

geno kick y map

You can also view this haplogroup information as a heatmap.

geno kick heat map

Under the “future” button, they ask you to complete your profile and contribute your story.  You may have noticed that these options are stepping you across the tabs at the top of the introductory page.

geno kick next

Under the “Our Story” tab, which is where the “Contribute Your Story” link takes you, they explain about the community and social networking aspects of Geno 2.0.

geno kick our story

Most interesting is the relationship circle, which looks like either a 45RPM record, a CD/DVD or the front of an i-pod, depending on your age.  The stars and planets are the people who are “related” to you and the larger planets are those with stories attached.  You just click on a planet to see their “story.”  The closer they are to the center, the more closely related they are to you, but I’m unsure how “related” is gauged.  For example if you click on the CTS11962 link, does this mean that everyone carries that mutation, or that it’s the terminal SNP for everyone listed?  If it’s the terminal SNP for everyone listed, wouldn’t they all be equally as closely related?  Jim’s V link doesn’t work, but the same questions apply.

geno kick circle

And at the bottom of this page, you can add your own story.

geno kick your story

I understand in the future that one will be able to contact these “related” people.  If so, and if they haven’t tested their STR markers or their mitochondrial DNA at Family Tree DNA, we can encourage them, or invite them, to do so.

And speaking of which, the one thing I really DON’T like is what they’ve done with the download to Family Tree DNA option.  In Geno 1.0, the transfer option said something like “to learn more,” but was tiny and obscure, at the bottom of a page where you had to scroll multiple times.  I’m sure the reason that only 20% of the people ever transferred to Family Tree DNA was because only 20% of the people stumbled across the link and followed it.  Actually, the fact that 20% actually found it is pretty amazing and speaks highly of how interested people actually are in the Genographic project and their results.  This function and where it’s located is even worse in this version.

To initiate a transfer to Family Tree DNA, first, you have to know that you want to do this. There is no enticing “advertising” or education like there is for other information.  This would be a wonderful opportunity for a nice video or at least a writeup and a link that at least says “to learn more” encourages people to investigate.  Now, you need to go to your Profile link, and under the profile link, click on the Advanced Options.

Nope, I don’t think even 20% of the people will find this.  I’ve very disappointed and hope they will reconsider and rework this option.

I am very hopeful that with some constructive and pleasant feedback that perhaps Nat Geo will reconsider and bring this transfer option into line with the otherwise wonderfully designed and world-class project pages.  Their e-mail address is genographic@ngs.org.

Genographic has so much to offer and Family Tree DNA’s customers and project administrators have played a huge role in recruiting for both Geno 1.0 and 2.0.  I’d really like to be sure that all Geno 2.0 participants receive everything they can out of the total genetic genealogy and anthropology experience.  After all, this is the story of all of us, the human population, and we’re all connected.  The only question is how closely we’re related, and when we get close enough in that tree, can we put names and faces on our ancestors, preferably with a few dates and locations as well?  Hence, it’s a continuum from anthropology to genealogy.  It needs to be a continuum from Nat Geo to FTDNA too.

One thing is for sure, we’re getting closer and closer as we learn more and more.  The tools keep improving and one by one, those brick walls are falling.

Well, we’ve kicked the tires a bit and I think this one is a keeper.  I think National Geographic has done a wonderful job of making a topic that has become increasingly complex over the past few years understandable to the average citizen who will take this test and look at their results with a sense of adventure and curiosity.  The website is beautifully designed.  Don’t shortchange yourself by hurrying through and not taking time to look at all of the photos, stories and videos, and be sure to click on the little “i” icon which means more information.  There’s a lot here to savor, slowly, like a connoisseur of fine food or a wonderfully spellbinding book.

I think what I’ve decided though, relative to autosomal DNA testing and ethnicity is that there is no one answer, there is really only a matter of degrees.  Today, with the different testing companies using different population data references, we receive differing results. I don’t worry too much unless they are significantly different, then I have to scratch my head a bit.

When my own results come back I’ll be doing some comparisons on how minority admixture stacks up using the different autosomal tests and analysis tools available.  We kicked the tires today, but soon, we’ll be taking a test drive to see what we can actually do with all of this. So, stay tuned and in the mean time, savor those results!  After all, on the first day of Christmas, my true love gave to me, a new SNP on my own family tree.

______________________________________________________________

Disclosure

I receive a small contribution when you click on some of the links to vendors in my articles. This does NOT increase the price you pay but helps me to keep the lights on and this informational blog free for everyone. Please click on the links in the articles or to the vendors below if you are purchasing products or DNA testing.

Thank you so much.

DNA Purchases and Free Transfers

Genealogy Services

Genealogy Research

Otzi Was A Brown Eyed, Left Handed Farmer


Otzi, the mummified man found in 1991 in the Italian alps has provided a huge amount of information to science for one man, especially one who has been dead for more than 5300 years.  Otzi was killed by an arrow to the back, probably bleeding to death, although maybe not right away.  Based on blood analysis, he may have had companions with him who were also injured.

He was an old man at the time, 45.  Most didn’t survive that long.  Surrounding the mummy was his quiver, copper ax, interpreted as a status symbol, knife and other belongings, which were nearly missed when the body was recovered.  He was dressed in hides from multiple species of animals, sported a bear-skin hat and a woven grass cloak.  He had eaten unleavened bread, fruit and deer meat only a couple of hours before his death.  He had also taken herbal medicine suggesting that perhaps his meal didn’t set too well with him.  He had tattoos which may have been related to a healing ritual since they were on or near body parts which showed wear, knees and ankles, which were probably painful to him.  Hair on his clothes tells us he herded cows, sheep and goats.  He was diminutive compared to today’s people at 5’3″ and 110 pounds.

If you think about it, Europe didn’t have a large population then.  Otzi may be an ancestor of many of us. But then again, maybe not, because genetic analysis tells us that he may have suffered from reduced fertility.  But we could easily still be related in some way, as the population was fairly small and the large population of Europe grew from the founders.  Otzi and his family clearly were founders of the European population.

When Otzi was first discovered, the National Geographic Society did a facial reconstruction of Otzi, depicting him as a robust, healthy relatively young-looking man.  More recent cranial imaging capabilities combined with genetic analysis and other fields of research have shown us that indeed, he wasn’t quite so healthy.  Robust Otzi is shown below.  Perhaps this resembled a younger Otzi.

Otzi, at his death, looked like the more recent reconstruction at the top of this blog.

Most recently, last week, at the American Society of Human Genetics meeting, scientists reported that Otzi was a farmer.  While this may not sound remarkable, it is, just the fact that they can determine this, and what his DNA and other similar DNA reveals about migration and settlement patterns.  It turns out that Otzi most closely resembles people from Sardinia, a large island off the west coast of Italy, not the hunter gatherers in the Alps where he was found.

Isotope analysis of his teeth tell us that Otzi did not grow up in the Alps where he died (red balloon), but south about 50 km near the village of Feldthurns (blue balloon).  But he didn’t grow up in Sardinia (yellow balloon), so that connection is further back in time.

In addition, his DNA also resembled the DNA of the farmers of Bulgaria and Sweden, but again, not the hunter-gatherer population.  Not only does this tell us that Otzi was a farmer, but it tells us how and where the farming population settled, and who they were.

http://www.huffingtonpost.com/2012/11/09/otzi-the-icemans-genes-central-europe_n_2099809.html

More interesting info here:

http://www.livescience.com/24666-otzi-iceman-mummy-life-death.html

Otzi, it appears, was left handed, was probably lactose intolerant and had Lyme disease, making him the earliest known case.  He was also more closely related to Neanderthals than Europeans today.  Today’s Europeans uniformly carry roughly between 2% and 4% Neanderthal ancestry.

Otzi’s mitochondrial DNA line may well be extinct.  If not extinct, then no others have yet been discovered.  He is a subgroup of the K1 lineage, named K1o (that is O for Otzi, not a zero.) His Y-line DNA is haplogroup G2a2b.

http://en.wikipedia.org/wiki/%C3%96tzi

National Geographic has funded significant research on Otzi and has provided additional information and reconstruction photos here:

http://news.nationalgeographic.com/news/2011/02/pictures/110225-otzi-iceman-new-face-science-mummy-oetzi/#/iceman-oetzi-otzi-reconstructed-new_32525_600x450.jpg

______________________________________________________________

Disclosure

I receive a small contribution when you click on some of the links to vendors in my articles. This does NOT increase the price you pay but helps me to keep the lights on and this informational blog free for everyone. Please click on the links in the articles or to the vendors below if you are purchasing products or DNA testing.

Thank you so much.

DNA Purchases and Free Transfers

Genealogy Services

Genealogy Research

The New Root – Haplogroup A00

Now that things have calmed down a bit from the whirlwind of the Family Tree DNA Conference, I’d like to write in a little more comprehensive and sane manner about the revelation that we have a new root on the human tree.

I’m referring to the session given by Bonnie Schrack, Thomas Krahn and Michael Hammer titled “In Search of the Root: Discovery of a Highly Divergent Y Chromosome Lineage.”

Bonnie has posted her slides from the presentation as well as her speaking notes on her new haplogroup A webpage.  She contacted me with some corrections to my original Blog posting about that session at the conference as well as provided additional information.  Thank you Bonnie, not just for this info, but for your work with haplogroup A that has been such a key part of this momentous discovery.  This isn’t just a once-in-a-lifetime event, it’s a once-in-the-history-of-mankind event.  Watch the haplogroup A website for more information from Bonnie about this exciting discovery and project.

Understandably, Bonnie, Thomas and Michael are somewhat restricted in what they can say until such time as the resulting academic paper in the works is published.

We all know that male humans arise from a person we call Y-line Adam, just like we call the first woman Mitochondrial Eve.  Before a 2011 paper, it was believed that shortly after Adam, haplogroup A and B were formed about the same time and were brother haplogroups.  Fulvio Cruciani’s 2011 paper, “A Revised Root for the Human Y Chromosomal Phylogenetic Tree: The Origin of Patrilineal Diversity in Africa” reorganized that tree and showed that indeed, haplogroup A formed from the root of all humanity with B forming from haplogroup A.

Cruciani showed his newly organized tree with haplogroup A1b, A1a and then A2, A3 and BT as brother haplogroups.  Cruciani did not use STR data, only SNP data in his study.

A second recent study, also in 2011, “Signatures of the pre-agricultural peopling processes in sub-Saharan Africa as revealed by the phylogeography of early Y chromosome lineages” by Chiara Batini et al, did include some STR marker that matched some of the haplogroup A samples.  Batini did not use SNP testing, so did not realize the potential of these STR samples.  These did not match the new A00 root, but other rare haplogroup A samples in subgroups.

The 7 marker STR samples that did match the new A00 sample were from a private database at the Center for Genetic Anthropology who very graciously worked with Michael Hammer and provided small amounts of those samples for further analysis.

In my conference blog posting, I asked how this discovery was previously missed, and Bonnie Schrack responded as follows:

“The reasons we had never heard about A00 before would be:

  • Very scanty research and sample collection in Africa, in proportion to the size and diversity of the population, compared to Europe and other more developed countries
  • Only recently has large-scale Y sequencing become practical and affordable; Cruciani’s 2011 paper was a breakthrough precisely because for the first time they were able to sequence a few samples on the scale of a WTY, resulting in a lot of new SNPs, and we’ve been able to make even more progress because we had a larger pool of (customer) samples from which I could cherry-pick the most divergent samples, and then our genetic genealogy/anthropology community made it possible to raise enough funds for us to sequence the most important three of them (after that point, Hammer and FTDNA found the other samples and funds).”

Before the WTY program, this type of analysis simply wasn’t being done.  This monumental discovery was a combination of citizen science, the haplogroup A project, an innovative scientific program, the WTY at Family Tree DNA, academic partnership, Michael Hammer’s lab at the University of Arizona and other institutions, along with that crucial public participation.  Without the public participation aspect, the rest would be a moot point.

Haplogroup A research at Family Tree DNA discovered not only one, but two new branches of haplogroup A, one of which was actually a new base root that needed to be inserted before, upstream of, the current root.  The locations where these new branches/roots needed to be inserted required the renaming of the current branches, hence, the newly discovered branch A00 and Cruciani’s branch, formerly A1b, is now A0.

Thomas Krahn’s A00 discovery presentation slides are also available online.  You can tell he’s a scientist from the nature of his presentation.  You can see the actual process of discovery, in essence, what he saw as this new root was unearthed.  It’s fun to walk along with him, even if you don’t understand everything you see.

As part of this process, Thomas also sequenced the DNA of a chimp and a gorilla.  You can see the results at www.ysearch.org for the chimp at 6RCUU, the gorilla at 9ED3A and the new root, A00, at 6M5JA.  You can breathe easy, humans are far distant from chimps and gorillas, but maybe closer to Neanderthals or other archaic humans than we thought.

Update: As of 2019, Ysearch is no longer available.

At the end of Thomas’s presentation, he included the image of a tree with a new root and lots of interesting branches.

Zooming in on the branches, you can see all of the DNA sequencing paraphernalia, microplates, readouts and results.  Maybe there is a little artist buried someplace in Thomas amid those scientific genes!

This work was no small feat, and the significance is mind-boggling.  This new discovery pushed the date of Y-Adam back a whopping 67% in one fell swoop.  Cruciani’s birth age for haplogroup A1b was 140,000 years ago and A00, compared to Cruciani’s sample, falls at 237,000 years ago.

Dr. Michael Hammer at the University of Arizona reanalyzed the haplogroup A tree and root with the new information available, and his new ages are even more amazing.  Cruciani’s A1b/A0 sample is now at 200,000 years old and A00 is at 338,000, with a 98% confidence level.

These dates pre-date all human fossils, although there are some archaic fossils that have been found and dated after this time in neighboring Nigeria.  This new information provides us with glimpses through the keyhole of time into ancient human origins, and begs even more questions that will be answered in time, with more genetic and anthropology research.  We all descend from this common root, and we may all be more closely related to archaic man that we knew.

The A00 participant descends from a former slave family in South Carolina.  The closest matches are found in western Cameroon near the Gulf of Guinea, a prime location in the slave trade.

There appears to be about 500 years between the participant and the samples from Cameroon, an age that speaks to the beginning of the slave trade.

Having worked closely with Lenny Trujillo, the man whose WTY sample provided us with haplogroup-changing and defining information for haplogroup Q, and understanding what a moving experience this journey has been for Lenny, I wondered about how the family involved with this revolutionary discovery must feel.

As luck would have it, I have worked with this family in one of my projects as well, and they contacted me after seeing my blog about the conference.

I asked how they felt, how they were reacting to this history-changing event in which their family was the keystone.  I have extracted pieces from e-mails back and forth, and with the families permission, am sharing what they had to say.  Clearly, without them and their active and supportive participation, this discovery would not have been made.  We all owe them a debt of gratitude.

“I have a B.S. in Mathematics. I love science and learning. I recently retired, but I spent a lot of that time working with research scientists on cutting edge technology and methods so it is very exciting to me to be a part of such a scientific discovery. My family would say I was the right one chosen.  This is the family line I know the most about so I am glad it was this part of my family.

I don’t yet have the formal results from Family Tree DNA concerning the Y-DNA sample they tested in the Walk Through the Y, I did know that the discovery was monumental from some preliminary results from Thomas.

I wanted to see the tie back to Africa, looks like GOD did exceedingly, abundantly more than I could ever ask or think. Just think of how long HE has preserved this Y-lineage just for such a time as this.”

______________________________________________________________

Disclosure

I receive a small contribution when you click on some of the links to vendors in my articles. This does NOT increase the price you pay but helps me to keep the lights on and this informational blog free for everyone. Please click on the links in the articles or to the vendors below if you are purchasing products or DNA testing.

Thank you so much.

DNA Purchases and Free Transfers

Genealogy Services

Genealogy Research

Family Tree DNA Conference 2012 – Nits and Grits

First things first!  I want to thank Max and Bennett for graciously hosting the 8th Annual Genetic Genealogy Conference in Houston, Texas!  This is actually the 9th year, but a pesky hurricane interfered one year.  Max and Bennett are very generous with their time and resources and heavily subsidize this conference for us.  We’re registering in the photo above.

Georgia Kinney Bopp said it best.  At some point during this amazing conference, someone tweeted an earlier quote from a conversation between Ann Turner and Georgia:

“it’s hard to realize you’re living history while it happens…”

This was ever so true this weekend.  Even my husband (who is not genetic genealogy crazy) realized this.  I’m not sure everyone at the conference did, or realized the magnitude of what they were hearing, as we did have a lot of newbies.  Newbies are a good thing.  It means our obsessive hobby and this industry have staying power and there will be people to pass the torch to someday.

I’ve already covered the Native American focus meeting in an earlier blog.

For those of you who want the nitty gritty play by play as it happened at the conference, go to www.twitter.com and search for hashtag #ftdna2012.  If you want some help with Twitter, I blogged about that too.  Twitter is far from perfect, but it is near-realtime as things are happening.

As always, Family Tree DNA hosts a reception on Friday evening.  This helps break the ice and allows people to put faces with names.  So many of us “know” each other by our e-mail name and online presence alone.

We had a special guest this year too, Nina, a little puppy who was rescued by Rebekah Canada just a few days before the conference.  Nina behaved amazingly well and many of us enjoyed her company. 

Bennett opened the conference this year, and in the Clint Eastwood political tradition, spoke to his companion, the chair named Max.  The real Max, it turns out, was losing his voice, but that didn’t prevent him from chatting with us and answering questions from time to time.

While Bennett was very low key with this announcement, it was monumental.  He indicated that the parent company of Family Tree DNA has reorganized a bit.  It has changed its name to Gene by Gene and now has 4 divisions.  You can check this out at www.genebygene.com.  This isn’t the monumental part.

The new division, DNADTC’s new products are the amazing parts.  Through this new division, they are the first commercial company to offer a full genome sequence test.  The price, only $5495.  For somewhat less, $695, they are offering the exome, which are your 20,000 genes.  Whoever though it would be a genetic genealogy company who would bring this to the public.  Keep in mind that the human genome was only fully sequenced in 2003 at a cost of 3 billion dollars.

The amazing part is that a full genome sequence cost about 3 million in 2007 and the price will continue to fall.  While consumers will be able to order this, if they want, it comes with no tools, as it is focused at the research community who would be expected to have their own analytical tools.  However, genetic genealogists being who and what they are, I don’t expect the research market will outweigh the consumer market for long, especially when the price threshold reaches about $1000.

Bennett also said that he expects that National Geographic will, in 2013 sometime, decide to allow upgrades from Family Tree DNA clients for the Geno 2.0 product.  This will allow those people who cannot obtain a new sample to participate as well.  However, an unopened vial will be required.  No promises as to when, and the decision is not his to make.

The first session was Spencer Wells via Skype from Italy.  Spencer has just presented at two conferences within the week, one in San Francisco and one in Florence, Italy.  Fortunately, he was able to work us into his schedule and he didn’t even sound tired.

Of course, his topic was the Geno 2.0 test which is, of course, run on the new GenoChip.  The first results are in the final stages of testing, so we should see them shortly.  Sometime between the 19th and the end of the month.

This product comes with all new migration maps.  He showed one briefly, and I noticed that one of the two Native Y-lines are now showing different routes than before.  One across Siberia, which hasn’t changed, and one up the pacific rim.  Hmmm, can’t wait for that paper.

The new maps all include heat maps which show frequency by color.  The map below is a haplogroup Q heat map, but it is NOT from the Geno project.  I’m only using it as an example.

Spencer indicated that the sales of the 2.0 product rival those of the 1.0 product and that they have sold substantially more than 10K and substantially less than 100K kits so far.  In total, they have sold more than 470,000 kits in over 130 countries.  And that’s just the public participation part, not the indigenous samples.  They have collected over 75,000 indigenous samples from more than 100 populations resulting in 36 publications to date with another half dozen submitted but not yet accepted.  Academic publication is a very long process.

Nat Geo has given 62 legacy grants to indigenous communities that have participated totaling more than 1.7 million dollars.  That money comes in part from the public participation kits, meaning Geno 1.0 and now 2.0.

Geno 2.0 continues to be a partnership between National Geographic and Family Tree DNAFamily Tree DNA is running all of their samples in the expanded Houston lab.  Also added to the team is Dr. Eran Elhaik at Johns Hopkins University who has developed a new tool, AIMSFINDER, that locates never before identified Ancestral Informative Markers to identify population specific markers.  This is extremely important because it allows us to read our DNA and determine if we carry the markers reflective of any specific population.  Well, we don’t do the reading, they do with their sophisticated software.  But we are the recipients with the new deep ancestral ethnicity results which are more focused on anthropology than genealogy.  Spencer says that if you have 2% or more Native American, they can see it.  They have used results from both public and private repositories in developing these tools.

This type of processing power combined with a new protocol that tests all SNPS in a sequence, not just selected ones, promises to expand the tree exponentially and soon. It has already been expanded 7 fold from 863 branches of the Y tree to 6153 and more have already been discovered that are not on the GenoChip, but will be in the next version.

The National Geographic project will also be reaching out to administrators and groups who may have access to populations of interest.  For example, an ex-pat group in an American city.  Keep this in mind as you think of projects.

Another piece of this pie is a new educational initiative in schools called Threads.

This isn’t all, by any means, on this topic, I really do encourage you to go and use Twitter hashtag #ftdna2012.  Several of us were tweeting and the info was coming so fast and furious that no one could possibly get it all.

The future with Nat Geo looks exceedingly bright.  We have gone from the Barney Rubble age to the modern era and now there is promise for a rosy and as yet undiscovered future.

Judy Russell was next.  I have to tell you, when I saw where they positioned her, I was NOT envious.  I mean, who wants to follow Spencer Wells, even if he’s not there in person.  Well, if anyone was up to this, it certainly was Judy.  For those who don’t know, she blogs as The Legal Genealogist.

Judy is one of us.  That means she actually understands our industry, what drives genealogists and why.  In addition to being a lawyer, she is a certified genealogist and a genetic genealogy crazy too.  Maybe I shouldn’t call a lawyer crazy….well…it was meant as a compliment:)

Judy has the perspective to help us, not just criticize us remotely.  She reviewed several areas where we might make mistakes.  After all, we’re all volunteers coming from quite varied backgrounds.  She suggests that we all put some form of disclosure on our projects explaining what participants can expect in terms of use.  She used the Core Melungeon project as a good example, along with the Fox project.

“The goal of this project is to use DNA to better understand the origins of the Melungeon people, and this will be done by comparing the DNA with other project members, those outside of projects, and will incorporate relevant genealogical and historical research. All participants will be included in the ongoing studies and by joining the project, you are giving consent for your information to be anonymously included in ongoing genetic genealogy research. Your personal identity will not be revealed, but your results will be used to better understand the Melungeons as a people and their ancestors.”

From the Fox project:

“The exact function of these STR markers is not yet known and they have no known medical function but recent research shows they have some sort of regulatory function on the genes. While there is no medical information in these numbers, the absence of a certain few markers near a fertility gene could indicate sterility – something that would certainly already be known.

The results do provide a partial means of personal identification and, for this reason, our haplotype tables list only the FTDNA kit number and the most distant known male line ancestor. Within the project, however, the administrators feel free to disclose identities, particularly when a close match occurs.”

Judy’s stressed that we not tell people that there is no medical information revealed.  Partially, because we’ve discovered in rare cases that’s not true, and partially because we can’t see into the future.

Judy talked about regulation and that while we fear what it might intentionally or inadvertently do to genetic genealogy, it’s important to have regulations to get rid of the snake oil salesman, and yes, there are a couple in genetic genealogy.  They give us all a black eye and a bad name when people discover they’ve been hoodwinked. However, without regulation of some sort, we have no legal tools to deal with them.

Regulation certainly seems to be a double-edged sword.

I hope that Judy writes in her blog about what she covered in her session, because I think her message is important to all administrators and participants alike.  And just to be clear, the sky is not falling and Judy is not Chicken Little.  In fact, Judy is the most interesting attorney I have ever heard speak, and amazingly reasonable too.  She actually makes you WANT to listen, so if you ever get the chance to see one of her webcasts or attend one of her sessions, take the opportunity.

Following the break, breakout sessions began.  CeCe Moore ran one about “Family Finder,” Elise Friedman about “Group Administration” and Thomas Krahn provided the “Walk the Y Update.”  Bennett called this the propeller head session.  Harumph Bennett.  Guess you know which one I attended.  All sessions were offered a second time on Sunday.

Thomas said that they have once again upgraded their equipment, doubling their capacity again.  This gives 4 times the coverage of the original Walk the Y, covering more than 5 million bases.  To date, they have run 494 pre-qualified participants and of those, 198 did not find a new SNP.

There are changes coming in how the palindromic region is scored which will change the matches shown.  Palindromic mismatches will now be scored as one mutation event, not multiples.  Microalleles will able be reported in the next rollout version, expected probably in January.  The problem with microalleles is not the display, but the matching routine.

Of importance, there has not been an individual WTY tested from haplogroups B, M, D or S, and we need one.  So if you know of anyone, please contact Thomas.

Thomas has put his Powerpoint presentation online at  http://www.dna-fingerprint.com/static/FTDNA-Conference-2012-WalkThroughY.pdf

The next session by Dr. Tyrone Bowes was “Pinpointing a Geographical Location Using Reoccurring Surnames Matches.”  For those of us without a genetic homeland, this is powerful medicine.  Dr. Bowes has done us the huge favor of creating a website to tell us exactly how to do this.  http://www.irishorigenes.com/

He uses surnames, clan maps, matches, history and census records to reveal surname clusters.  One tidbit he mentioned is that if you don’t know the family ethnicity, look at the 1911 census records and their religion will often tell you.  Hmm, never thought of that, especially since our American ancestors left the homeland long ago.  But those remaining in the homeland are very unlikely to change, at least not in masse.  I’m glad he gave this presentation, or I would never have found his webpage and I can’t wait to apply these tools to some of my sticky-wickets.

This ended Saturday’s sessions, but at the end of every day, written questions are submitted for that day’s presenters or for Family Tree DNA.

Bennett indicated that another 3000 or 4000 SNPs will be added to the Family Finder calculations and a new version based on reference samples from multiple sources will be released in January.

Bennett also said that if and when Ancestry does provide the raw downloadable data to their clients, they will provide a tool to upload so that you can compare 23andMe and Ancestry both with your Family Finder matches.

Saturday evening is the ISOGG reception, also called the ISOGG party.  Everyone contributes for the room and food, and a jolly good time is had by all.  There is just nothing to compare with face to face communications.

For me, and for a newly found cousin, this was an amazing event.  A person named Z. B. Stroud left me a message that she was looking for me.  When I found her, along with her friend and cousin Revis, she tells me that she matches me autosomally, at 23andMe, and that she had sent me a sharing request that I had ignored.  I am very bad about that, because unless someone says they are related, I presume they aren’t and I don’t like to clutter up my list with non-related people.  It makes comparisons difficult.  My bad.  In fact, I’m going right now to approve that sharing request!!!

I will blog about this in the future, but without spilling too many beans….we had a wonderful impromptu family reunion.  We think our common ancestor is from the Halifax and Pittsylvania County region of Virginia, but of course, it will take some work to figure this out.

I’m also cousins with Revis Leonard (second from left).  We’ve known that for a long time, but Z.B. whose first name is Brisjon (second from right) is new to genealogy, DNA and cousin matching. I’m on the right above.  The Stroud project administrator, Susan Milligan, also related to Brisjon is on the left end.  In the center are Brisjon’s two cousins who came to pick her up for dinner and whom she was meeting for the first time.

But that’s not all all, cousin Brisjon also matches Catherine Borges.  Let me tell you, I know who got the tall genes in this family, and I’m not normally considered short.  Brisjon’s genealogical journey is incredibly amazing and she will be sharing it with us in an upcoming book.  Suffice it to say, things are not always what you think they are and Brisjon is living proof.  She also met her biological father for the first time this weekend!  I’m sure Houston and her 2012 visit where she met so many family members is a watershed event in her lifetime!  She is very much a lovely lady and I am so happy to have met her.  Cousins Rule!

ISOGG traditionally has its meeting on Sunday morning before the first session.  Lots of sleepy people because everyone has so much fun at the ISOGG party and stays up way too late.

Alice Fairhurst, who has done a remarkable job with the ISOGG Y SNP tree (Thank you Alice!) knows an avalanche is about to descend on her with the new Geno 2.0 chip.  They are also going to discontinue the haplogroup names, because they pretty much have to, but will maintain an indented tree so you can at least see where you are.  The names are becoming obsolete because everytime there is an insertion upstream, everything downstream gets renamed and it makes us crazy.  It was bad enough before, but going from 860+ branches to  6150+ in one fell swoop and knowing it’s probably just the beginning confirms the logic in abandoning the names.  However, we have to develop or implement some sort of map so you can find your relative location (no pun intended) and understand what it means.

Alice also mentioned that they need people to be responsible for specific haplogroups or subhaplogroups and they have lost people that have not been replaced, so if anyone is willing or knows of anyone….please contact Alice.

Alice also makes wonderful beaded double helix necklaces.

Brian Swann (sorry, no picture) is visiting from England this year and he spoke just a bit about British records.  He said it’s imperative to learn how they work and to use some of the British sites where they have been indexed.  He also reminded us to check GOONS (Guild of One Name Studies) for our surnames and that can help us localize family groups for recruiting.  He said that you may have to do family reconstructions because to get a Brit to test you have to offer them something.  That’s not terribly different from over here.  He also mentioned that today about half of the British people having children don’t marry, so in the next generation, family reconstruction will be much more difficult.  That too isn’t so terribly different than here, although I’m not sure about the percentages.  It’s certainly a trend, as are varying surname practices even within marriage.

Dr. Doron Behar began the official Sunday agenda with a presentation about the mtCommunity and a discussion of his recently published paper “A ‘Copernican’ Reassesement of the Human Mitochondrial DNA Tree from its Root.”  This paper has absolutely revolutionized the mitochondrial DNA community.  I blogged about this when the paper was first released and our home pages were updated.    One point he made is that it is important to remember is that your mutations don’t change.  The only thing that changes between the CRS (Cambridge Reference Sequence) and the RSRS (Reconstructed Sapiens Reference Sequence)  model is what your mutations are being compared to.  Instead of being compared to someone from Europe who live in 1981 (the CRS) we are now comparing to the root of the tree, Mitochondrial Eve (RSRS) as best we can reconstruct what her mitochondrial DNA looked like.

He also said that when people join the mtCommunity, their results are not automatically being added to GenBank at NCBI.  That is a separate authorization check box.

A survey was distributed to question participants as to whether they want results, when they select the GenBank option, to be submitted with their kit number.  Now, they are not, and they are under Bennett’s name, so any researcher with a question asks Bennett who has no “track back” to the person involved.  About 6000 of the 16,000 submissions today at GenBank are from Family Tree DNA customers.  Dr. Behar said that by this time next year, he would expect it to be over half.  Once again, genetic genealogy pioneers are leading the way!

At these conferences, there is always one session that would be considered the keynote.  Normally, it’s Spencer Wells when he is on the agenda, and indeed, his session was wonderful.  But at the 2012 conference, this next session absolutely stole the show.  Less public by far, and much less flashy, but at the core root of all humanity.

You can’t really tell from the title of this session what is coming.  Michael Hammer with Thomas Krahn and Bonnie Schrack, one of our own citizen scientists, presented something called “A Highly Divergent Y Chromosome Lineage.”  Yawn.  But the content was anything but yawn-material.  We literally watched scientific discovery unfold in front of our eyes.

Bonnie Schrack is the haplogroup A project administrator.  Haplogroup A is African and is at the root of the entire haplotree.  One of Bonnie’s participants, an African American man from South Carolina agreed to participate in WTY testing.  In a nutshell, when Thomas and Astrid began scoring his results, they continued and continued and continued, and wound up literally taking all night.  At dawn’s first light, Thomas told Astrid that he thought they had found an entirely new haplogroup that preceded any known today.  But he was too sleep deprived to be sure. Astrid, equally as sleep deprived, replied with “Huh?” in disbelief.  It’s certainly not a statement you expect to hear, even once in your lifetime.  This is a once in the history of mankind event.

Dr. Michael Hammer confirmed that indeed, they had discovered the new root of the human Y tree.  And not by a little either, but by a lot.  For those who want to take a look for yourself, Ysearch ID 6M5JA.  Hammer’s lab did the age projection on this sample, and it pushed the age of hominid men back by about 100,000 years, from 140,000 years ago to 237,000 years ago.  They then reevaluated the aging on all of the tree and have moved the prior date to about 200,000 years ago and the new one to about 338,000 years ago with a 98% confidence level.  This is before the oldest fossils that have been found, and also before the earliest mitochondrial DNA estimate, which previously had been twice as old as the Yline ancestor.

The previous root, A1b has been renamed A0 and the new root, just discovered is now A00.  Any other new roots discovered will simply get another zero appended.

How is it that we’ve never seen this before?  Well, it turns out that this line nearly went extinct.  Cruciani published a paper in 2012 that included some STR values that matched this sample, but fortunately, Michael Hammer’s lab held the actual samples.  A search of academic data bases reveals only a very few close matches, all in western Cameroon near the Gulf of Guinea.  Interestingly, next door, in Nigeria, fossils have been found younger than this with archaic features.  This is going to cause us to have to reevaluate the source of this lineage and with it the lineage of all mankind.  We must now ask the question about whether perhaps we really have stumbled upon a Neanderthal or other archaic lineage that of course “became” human.  Like many scientific discoveries, this answer only begs more questions.  My husband says this is like Russian tea dolls where ever smaller ones are nested in larger ones.

This discovery changes the textbooks, upsets the proverbial apple cart in a good way, and will keep scientists’ thinking caps on for years.  And to think, this was a result of one of our projects, an astute project administrator (Bonnie) and a single project member.  I wonder what the man who tested thinks of all of this. He is making science and all he thought he was doing was testing for genealogy.  You just never know where the next scientific breakthrough will come from.  Congrats to all involved, Bonnie, Thomas, Michael and to Bennett and Max for having this evolution revolution happen right in their lab!

If I felt sorry for Judy following Spencer, I really felt sorry for the breakout sessions following Thomas, Michael and Bonnie’s session.  Thankfully at least we had a break in-between, but most people were wandering around with some degree of stunned disbelief on their faces.  We all found it hard to fathom that we had been among the first to know of this momentous breakthrough.

I had a hard time deciding which session to attend, CeCe’s “Family Finder” session or Elise’s.  I decided to attend Elise’s “Advanced Admin Techniques” because I work with autosomal DNA with my clients and I tend to keep more current there.  Elise’s session was great for newer admins and held tips and hints for us old-timers too.  I realized I really need to just sit down and play with all of the options.

There are some great new features built in that I’ve never noticed.  For example, did you know that you can group people directly from the Y results chart without going to the subgrouping page?  It’s much easier too because it’s one step.  However, the bad news is that you still can’t invite someone who has already tested to join your project.  Hopefully that feature will be added soon.

The next session was “A Tale of Two Families” given by Rory Van Tuyl detailing how he used various techniques to discern whether individuals who did not show up as matches, meaning they were beyond the match threshold, were actually from the same ancient family or not.  Rory is a retired engineer and it shows in his attention to detail and affinity for math.

We always tell people that mutations can and do happen at any time, but Rory proved this.  He ran a monte-carlo simulation and showed that in one case, it was 50 generations between mutations, but in others, there was one mutation for three generations in a row.  Mutations by no means happen at a constant rate.  Of course, this means that our TIP calculator which has no choice but to use means and averages is by definition “not calibrated” for any particular family.

He also mentioned that his simulation shows that by about 150 generations, there are a couple of back mutations taking place.

The final session before the ending Q&A was Elliott speaking about IT, which really translates into new features and functions.  Let’s face it, today everything involves IT.

Again, I was having trouble typing fast enough, so you might want to check the Twitter feed.

They added the SNP maps (admins, please turn them on) and the interactive tour this year.  The tour isn’t used as much as it should be, so everyone, encourage your newbies to do this.

They have also added advanced matching, which I use a lot for clients, but many people didn’t realize it.  So maybe a quick tour through the website options might be in order for most of us.

They are handling 50 times more data now that a year ago.  Just think what next year will bring.  Wow.

They are going to update the landing page again with more color and more visible options for people to do things.  I hope they prompt people through things, like oldest ancestor mapping, for example.  Otherwise, if it isn’t easy, most don’t.

They are upgrading Population Finder and the Gedcom viewer.  They are adding a search feature.  Thank you!!  Older Gedcome will still be there but not searchable.

But the best news is that they are adding phasing (parent child) and an advanced capability to “reconstruct” an ancestor using more distant relatives, then the ability to search using that ancestral profile against Family Finder.  Glory be!  We are finally getting there.  Maybe my dreaming big wasn’t as far away as I thought.

They will also remove the 5 person autosomal download restriction and the “in common with” requirement to see additional information.  All good news.  They are also upgrading the Chromosome browser to add more filtering options.

They are also going to offer a developer “sandbox” area for applications.

The final Q&A session began with Bennett saying that their other priorities preclude upgrading Y search to 111 markers.

They are not planning to drop the entry level tests, 12 or 25 markers or the HVR1. If they do, lots of people will never take that plunge.  I was very glad to hear this.

And by way of trivia, Family Tree DNA has run more than 5 million individual tests.  Wow, not bad for a company that didn’t exist, in an industry that didn’t exist, 12 years ago!

It’s an incredible time to be alive and to be a genetic genealogist!  Thank you Family Tree DNA for making all of this possible.

______________________________________________________________

Disclosure

I receive a small contribution when you click on some of the links to vendors in my articles. This does NOT increase the price you pay but helps me to keep the lights on and this informational blog free for everyone. Please click on the links in the articles or to the vendors below if you are purchasing products or DNA testing.

Thank you so much.

DNA Purchases and Free Transfers

Genealogy Services

Genealogy Research

The Malhi Molecular Anthropology and Ancient DNA Labs

I’ve known Ripan Malhi for years now, but until this past week, I had never met him in person.  Dr. Malhi attempted to extract the DNA from both a stamp, supposedly licked by my grandfather, and my father’s hair, complete with follicle.  I could hardly wait those long days to determine if any DNA was present.  I tried not to pester him, but I felt like the proverbial child constantly asking “are we there yet?”

Unfortunately, none of the multiple attempts were successful, but they established a relationship between Ripan and myself.  Ripan and I were trying to figure out this week just how long ago that was and we think it was about 10 years.  We know it was more than 7 years, since he has been at the University of Illinois since 2006 where he established the Malhi Labs, and it was significantly prior to that.

After finishing his PhD, Ripan founded a company called Trace Genetics.  It was there that I first met Ripan.  They specialized in ancient DNA processing.  A few years later, in 2006, Ripan sold that company and established both the Malhi Ancient DNA Lab and the Malhi Molecular Anthropology Lab at the University of Illinois where he is an Associate Professor.

Ripan has a long list of publications to his credit.   It won’t surprise you to discover that Native American and ancient DNA are both areas in which he specializes, and in particular, ancient Native American DNA.

The Malhi Molecular Anthropology Laboratory generates DNA variation data from different genetic systems (i.e. mitochondrial genome, Y chromosome, autosomal) to infer evolutionary history of populations and species. Currently, research in the lab is split into two independent research areas, the evolutionary history of Native Americans and evolutionary genetics of non-human primates in the areas of:

  • Molecular Anthropology
  • Ancient DNA Analysis
  • Evolutionary Genomics
  • Forensic Science
  • Population Genetics

Dr. Malhi was very gracious during my visit to the University of Illinois and agreed to show me both of his labs.  Not only that, he came to the Native American House to get me so that I wouldn’t get lost navigating the campus and delivered me back as well.  For that, I’m extremely grateful!  A campus with 40,000 students isn’t a campus, it’s a city and parking is almost non-existent!

First we visited the Ancient DNA Lab.  This lab is separate from the rest of the processing, and is actually in a different building altogether.  Access is extremely limited and only those who need to go inside, do.  I’m not one of those people.

Why such limited access?  In a word, contamination, the arch-nemesis of ancient DNA processing.  Ancient DNA, by definition is old, degraded and generally in short supply.  The process of extracting it from whatever medium you are working with, teasing out whatever is left, without introducing any outside contamination, is tricky at best.  Limiting the exposure in the room itself is the first step in a series of protocols designed to limit, prevent and then identify contamination if it exists.

The room is double air locked and pressurized so that when someone enters or exists the air is blown out and none of the surrounding air enters the lab.

The room itself can accommodate two researchers.  The window is tinted yellow as the lighting is also controlled within the lab.  So if these photos look yellow, it’s because they are.

You can see the DNA extraction area in this photo.  Work is done inside a cubicle, again, to limit contamination.  You can see the mortar and pestle used to sometimes grind the materials.  Other times, such as with teeth, drills are used.

After the DNA is extracted and amplified, assuming DNA is found, and it’s not contaminated, the results are then taken to the second lab, down the street, for processing.

This is the Molecular Anthropology lab where most of the people work, since they deal only with already extracted ancient DNA or contemporary DNA.

Contemporary DNA is considered a medical hazard while the DNA is still in a body fluid of some type (saliva, blood, cheek swab), so medical precautions must be taken.  In many ways, this lab looks just like a lab at a medical facility.  In fact, it’s in the Medical Sciences building.

DNA is extracted from contemporary samples in this work area.  After extraction, it is no longer considered a medical hazard, so from that point forward, only normal lab protocols are in force, not medical biohazard protection.

The DNA is then further processed in this area.  Ripan discussed some of his current projects as we toured.  He continues his work on Native American population genetics, and in particular, the migration and settlement of the Native people on this continent.  Currently he collaborates with Canadian tribes and is involved with an ongoing project to analyze the remains of several hundred Native burials that have previously been discovered.

Not only does he work with Native population genetics, and remains, but he also encourages Native American students to join his programs and work in the labs. He works closely with the Native American House.

I’m hopeful that Ripan’s projects and ongoing analysis will bring some answers to questions like whether or not mitochondrial haplogroup X is found in any tribes west of the St. Lawrence Seaway (inferring that it did come from Asian, not Europe), whether haplogroup M is found in the founding Native population and whether European or African haplogroups of any description are found pre-Columbian contact in the Americas.

I want to thank Dr. Malhi for his hospitality, for making time for the tour this week, and to wish him Godspeed in his continuing research.  And yes, that does mean I want him to hurry.  That hasn’t changed in the past decade!

______________________________________________________________

Disclosure

I receive a small contribution when you click on some of the links to vendors in my articles. This does NOT increase the price you pay but helps me to keep the lights on and this informational blog free for everyone. Please click on the links in the articles or to the vendors below if you are purchasing products or DNA testing.

Thank you so much.

DNA Purchases and Free Transfers

Genealogy Services

Genealogy Research

Matches – Family (IBD) vs Population (IBS)

Recently, I received the following query from one of our blog followers.

Family Finder matches are based on autosomal DNA inherited from both male and female sides of the family. The FAQ indicates that we may share some autosomal DNA with cousins beyond genealogical times “as remote as 20th cousins.”    Population Finder ethnic admixture percentages are also based on autosomal DNA, but cover a range of 100 to 2000 years (up to 80 generations), according to the Population Finder FAQ.  Why does the ethnic admixture calculation extend over a longer period than the Family Finder matches, since both are based on (the same?) autosomal DNA?”

This is a great question.  Let’s look at autosomal DNA and how DNA works, and we’ll soon see why genealogical and anthropological (ethnic admixture) DNA overlap.  And by the way, kudos for reading the FAQ!

In each generation, the child receives half of their DNA from Mom and half from Dad.  As you look back in time, you can see the inheritance percentages, approximately, in the table below.  Why do I say approximate?  Because when the DNA of Grandma and Grandpa that Mom (or Dad) carries is being selected to be passed on to the child, there may be a little more or less of Grandma or Grandpa’s so while the child does receive exactly 50% from Mom and Dad, they don’t receive exactly 25% from each grandparent.  It could be 60-40 or even just 49-51.  It’s here that things begin to get complicated.

Generation Percent of DNA carried by the current Generation
Parents 50%
Grandparents Approximately 25%
Great-grandparents Approximately 12.5%
GG-grandparents Approximately 6.25%
GGG-Grandparents Approximately 3.125%
GGGG-Grandparents Approximately 1.5625%
GGGG-Grandparents Approximately 0.7813%

You can see that in just 7 generations, we are below the threshold of 1%.  This is why Family Tree DNA says that their ethnicity prediction is reliable through about the 5th or 6th generation.  Beyond that, you’re at less than 1% of any one GGGG-grandparent.

Over time, the DNA from any specific ancestor, especially one from 20 generations ago is likely to “wash out”, meaning that in the next generation, the child is less and less likely to receive anything from that ancestor, and what they do receive would be in increasingly small pieces.  However, that’s not always true, because we clearly do inherit our DNA from someone.

So let’s look at an example using the Family Finder Chromosome Browser from Family Tree DNA which allows you to compare the inherited pieces of DNA of multiple people.

The graphic above shows the comparison of my mother to me, shown in orange, and then to a Miller cousin, shown in blue.  My mother and I share half of all of our DNA, so my orange matches her on every chromosome.

My mother and the Miller cousin, shown in blue, share a great grandparent, John David Miller.  So both the Miller cousin and my mother could expect to inherit approximately 12.5% of their DNA from that Miller great-grandparent.  While they wouldn’t inherit exactly the same DNA from that Miller grandparent, they would very likely inherit some of the same DNA from John David Miller.  In fact, they could expect to inherit approximately 3.12% of the same DNA from him.

Looking at chromosome 5, for example, you can see that Mom and her Miller cousin share a total length of 62.18 cM (centimorgans, a unit for measuring genetic linkage, the distance between chromosome positions).

If you look at my comparison, below, with Mom and the Miller cousin, again, shown in blue, you can see that I inherited 33.13 cM of the same DNA, slightly more than half (53%) of the Miller DNA that Mom shares with her cousin.

You can also choose to view this data in a table.

Mom’s table, above, shows that the length of 62.18 cM is comprised of 14,024 individuals SNPs.  For me, the same table, below, shows that my inheritance on chromosome 5 is really in 2 separate segments.  The 33.13 segment contains 8100 SNPs, so more than half of the number (57%) my Mom’s carries.  A second segment of 2.14 cM carries 500 SNPs for total Miller inheritage on chromosome 5 of 8600 SNPs (61%) .  Why didn’t the second segment show up on the Chromosome Browser?  Because I have the threshold set at 5cM, the default.  In the card shuffle between Mom and Dad that decided which SNPs I received, a little segment of Mom’s other parent’s DNA got inserted in the Miller segment, so the Miller segment was no longer intact, but pieces of it are still there and one piece is large.

You can change the cM threshold, but for people who are not known to be family, 5cM is a reasonable threshold to differentiate between identical by state, IBS which means happenstance or a common root population, and identical by descent, IBD, because you share a common ancestor in a genealogical timeframe.

This Miller comparison is a good example of how SNPs are inherited and shows that while approximately 50% of the DNA from each of your ancestors gets inherited in every generation, it’s never really exactly 50%, either in length or in the number of SNPs inherited.  It also shows how larger blocks of DNA are broken into smaller segments in each generation and how chunks move from being IBD to IBS over time and mutiple inheritances.

SNPs, or single nucleotide polymorphisms, are the basic unit of inheritance.  We look at 4 nucleotides to determine the condition, or state of that SNP.  Sometimes SNPs repeat, are in essence strung together, and these are the STRs, short tandem repeats, we are so familiar with in the Y chromosome in genetic genealogy.  These are our markers and the marker values are the number of repeats at marker location 390, for example.

Most of the time, we’re just looking at one SNP location and the nucleotide held at that location.  The magic of course, is when there are many of these nucleotides that are found in common as a group.  A large grouping indicates a common ancestor, like we’ve seen above.

However, for population genetics, the individual nucleotides and groupings of smaller segments are very important, because just like large blocks indicate families and common genealogical ancestry, smaller blocks indicate common populations.  This is how population geneticists identify populations, and how tools like Population Finder identify specific populations from which we descend.  Populations, however, blend, so this is rarely cut and dried, but occasionally, it is.

The Duffy-Null allele is a great example.  The Duffy Null allele is found only in African populations, and is therefore an important informative marker to determine African heritage.  Currently this marker is found in about 68% of American blacks and in 88-100% of African blacks.  If you have the Duffy Null allele, you have African heritage.  Of course, you don’t know which line or which ancestor it came from, but it assures you that you do in fact have African Heritage  This is one of the factors considered when determining percentage of ethnicity.

The relevance of the Duffy Null allele is determined by the number of other “African” markers that appear in high quantity.  If there are few other African markers, then African ancestry was likely further back in time.  If there are many, then African ancestry was likely more recent.  These statistical calculations are how the importance of autosomal markers is determined and how percentages or estimates of ethnicity are calculated.

Most of the time, SNPs and clusters of SNPs aren’t this specific and are found in many populations in varying frequencies. It’s learning how to put this puzzle together, or rather, tease it apart, that keeps population geneticists busy.

What all of this really means is that genealogical relatedness and population relatedness aren’t really two different things, but two different ends of a continuum where genealogical relatedness is evident by a high number of cMs and contiguous SNPs that match.  We saw that in the Miller example.

We know that if two people only show matches if you adjust the threshold to 1cM, for example, they are likely IBS, or only related via a population or region of the world.

However, it’s the grey area inbetween that becomes confusing.  For example, trying to determine whether someone who might be a cousin really is, or not, based on very small matching DNA segments.  For situations such as these, the best answer is to test more cousins to see if they may have inherited differently.  I guess that’s both the bad news and the good news in autosomal genetic genealogy, there’s always hope (and clarity) if you just test more people!!!

______________________________________________________________

Disclosure

I receive a small contribution when you click on some of the links to vendors in my articles. This does NOT increase the price you pay but helps me to keep the lights on and this informational blog free for everyone. Please click on the links in the articles or to the vendors below if you are purchasing products or DNA testing.

Thank you so much.

DNA Purchases and Free Transfers

Genealogy Services

Genealogy Research

Denisovan DNA Tells a Story

The Denisovan are an extinct human species that once lived in the Altai Mountains in Siberia.  Remains were found in the Denisova Cave (shown above with tourists approaching the entrance) and scientists have managed to extract DNA from a bone fragment that is at least 30,000 years old.  What did that DNA tell us?  The bone belonged to a little girl who had brown eyes, brown hair and dark skin.  Gosh, sounds a lot like me.

Her remains were discovered along with microblades (small stone blades used as tools), body ornaments of polished stone, and a molar shaped very differently from that of Neanderthals and modern humans.  The finger bone from the girl and the tooth were from different people.

Body ornaments – I guess jewelry has been forever popular. Maybe not so different from us as we might think.

The Denisovans lived at the same time as the Neanderthals and both Denisovans and Neanderthals interbred with each other and with homo sapiens, the species we now know as modern humans.  Yes indeed, if you are European, then approximately 5% of your genetic material is Neanderthal and part of it may well be Denisovan too.

You can read more about this exciting discovery here and here.

______________________________________________________________

Disclosure

I receive a small contribution when you click on some of the links to vendors in my articles. This does NOT increase the price you pay but helps me to keep the lights on and this informational blog free for everyone. Please click on the links in the articles or to the vendors below if you are purchasing products or DNA testing.

Thank you so much.

DNA Purchases and Free Transfers

Genealogy Services

Genealogy Research