
I’m excited to receive my low-pass whole-genome sequencing test results from MyHeritage. When MyHeritage initially introduced their new test, I wrote about what that means in the article, MyHeritage Introduces a Low-Pass Whole Genome Autosomal DNA Test and Why It Matters.
In that article, I said I was ordering a WGS test and would publish a comparison of the new test with the two tests I’ve previously taken with MyHeritage, plus a test I uploaded to MyHeritage from FamilyTreeDNA in 2016.
Before I review these comparative results with you, I want to properly set expectations.
What To Expect from the MyHeritage Whole Genome Sequence (WGS) Test
From Ran Snir, Vice President of Product Management for MyHeritage DNA:
- Those who take a MyHeritage DNA test now are all sequenced with WGS and will receive the same access to features and results as those who have taken a MyHeritage DNA test and were genotyped with an old chip in the past. In fact, all samples processed by the lab in December were already processed with WGS.
- The transition to WGS does not introduce new features and capabilities immediately.
- The new WGS technology has minor implications when it comes to the ethnicity estimate results and DNA Matches, but people should not expect to get “something completely different”.
- The transition to WGS and having more people processed with it opens the door for deeper research and more insights. It will allow MyHeritage to drastically improve its phasing, imputation and matching algorithms. This will take time as MyHeritage needs to amass a lot of data first. In the long run, MyHeritage plans to improve the product, build new features and introduce new capabilities which will be based on learnings from WGS.
Thank you, Ran.
In this article, I am not focusing on ethnicity, but on DNA matches, which I depend on to help me unravel those pesky genealogy puzzles.
Also, please note, some features I’m discussing here are free with the purchase of a DNA test, and others require a subscription at some level. I have a subscription, and I use it nearly every day.
Coupon Code for a $20 DNA Test
That said, if you already know you want to order the WGS test, or you’re a new tester, use this special coupon code at checkout to reduce the test to $20 through the end of February 2026. That’s a great value!
Coupon Code: RobertaFeb26
Now, let’s look at my results when comparing the WGS test to the results of my other three tests at MyHeritage.
How does the new WGS test fare?
My Results
Before ordering my WGS test from MyHeritage, I already had three tests at MyHeritage to choose from.

MyHeritage allows you to select between different tests, including uploads and tests you’ve taken at MyHeritage at different times. There’s absolutely no need to delete older tests there, and in fact, I recommend that you don’t. This article illustrates why.
My four tests include:
- FamilyTreeDNA (FTDNA) test uploaded to MyHeritage in 2016
- MyHeritage health test taken in 2019
- MyHeritage test taken in June 2024
- MyHeritage low-pass whole genome test (WGS) taken in December 2025
| FTDNA 2016 | MH Health 2019 | MH 2024 | MH WGS | |
| Total Matches | 19,722 | 17,179 | 17,767 | 17,676 |
| TOFR | 128 | 111 | 108 | Not ready |
This chart shows the total number of matches and Theories of Family Relativity for each test in January 2026.
What Are Theories of Family Relativity (TOFR)?
I have several very useful Theories of Family Relativity (TOFR) where MyHeritage uses trees and other documentation, such as census records, to connect you and your DNA matches to common ancestors. TOFR is one of MyHeritage’s most beneficial tools.

In this example, my match only provided their father’s name, but that name was linked to our common ancestors by connecting through a FamilySearch tree. Often, multiple potential relationships and paths are shown. Like with any other tool, each theory needs to be reviewed for accuracy.
Please note that TOFR is only run periodically and has not yet been calculated for the WGS test results. I’m sure that will happen soon.
Evaluating Matches
I wanted to know if (and how) the same people matched me on the different tests, including the new low-pass whole genome (WGS).
- Are there differences?
- Are the differences slight or pronounced?
- Do some people match me on some tests, and not others?
- Do some people match me on earlier tests, but not the WGS?
- Do some people match me on the WGS, but not earlier tests?
- What is the takeaway from all of this?
To compare the results of all four tests, I created a side-by-side comparison spreadsheet.
The Spreadsheet

I created a spreadsheet where I recorded 434 individual matches by entering information in the following columns:
- A – Match number that I assigned
- B – Match source (more about this in a minute)
- C – FTDNA 2016 test matching number of cMs
- D – MH 2019 matching number of cMs
- E – MH 2024 Health matching number of cMs
- F – MH Low Pass Whole Genome Sequencing (WGS) matching number of cMs
- G – Relationship if known
- H – Common Ancestor if known
I included several other columns in my spreadsheet for my own genealogical research purposes that show my matches’ tree size, and the actual lineage from them to our common ancestor couple. However, for comparing matches and accuracy, I’ve utilized the columns indicated above.
Match Sources
I wanted to compare different types of matches, meaning not just the closest or the most distant, or only the matches I can identify. These are the sources of the matches I compared.
- Cousin Finder – I actually started a spreadsheet back in October 2025 when I was using Cousin Finder to find cousins, meaning people with common ancestors identified by MyHeritage. Twenty-eight of the 378 people that MyHeritage identified as cousins are DNA matches, so those were the first matches I entered into this comparison spreadsheet, along with our most recent common ancestors.
- TOFR – All Theories of Family Relativity begin with DNA matches, then connect you and your matches together using trees and/or documents, when possible. Because matches vary with each of the tests, so do the TOFRs. WGS theories aren’t yet calculated, but the matches are, so I’ve included TOFR matches here.
- Family Kits – These 15 matches are family members’ tests that I manage and match, so I clearly know how we’re related.
- Top 100/150 – The first group of matches, other than the above categories, were the top 100 matches using the FamilyTreeDNA 2016 kit, which was my first test at MyHeritage. All tests continue to accumulate matches over time, so it just made sense to start here.
However, after I finished transcribing each of those 100 matches into the spreadsheet and started transcribing the top 100 matches for the MyHeritage 2019 test, I quickly realized that the top 100 matches were not the same between tests. Therefore, I used the top 100 matches from all 4 tests. For every name included from any test in the top 100, I included the matching cM amount from all four tests. This means that in total, there are more than 100 in the “Top 100”, so now it’s called the Top 100/150, but all of the top 100 matches from each of the four tests are included in the spreadsheet. In total, there are about 220 in that category.
- Bottom 100 – Last, I included the bottom 100 matches on the FTDNA 2016 kit, meaning I listed those and searched for them on the other tests. If I had included the bottom 100 from all four tests, it would have been more like the bottom 350.
When I finished listing all of these matches, I had 434 to work with for this comparison. .
Minimum Matching
The minimum MyHeritage reported match is 8 cM, and at that level, a surprising number of tests don’t match either parent, although some clearly match with close relatives on that parent’s side, which means that either:
- Those tests (either mine or the match’s, or both) were uploaded and imputed
- Some portion of the parents’ test did not read
- These are not valid matches, meaning they are identical by chance, not by descent.
About Imputation
Imputation is a widely used technology among vendors to bridge small sections of unread DNA. This is useful when comparing files from different vendors for matching.
Vendors use imputation internally too.
For example, vendors often use different DNA chips in the lab. They sometimes change chips internally, as well, for a variety of reasons. Regardless of why, the same locations aren’t always read, or aren’t read successfully. Imputation levels the playing field, allowing backwards compatibility, and compatibility for matching across platforms. Imputation fills in the blanks to equalize those files, allowing them to be compared for matching.
Let me give you an example. Let’s say you have the letters c_t, where the middle letter between c and t is missing. In English, there are a limited number of letters that can be. To begin with, it must be a vowel. In this case, it has to be either a, o or u. Next, looking at context, if the surrounding words are “the c_t chased a mouse,” the missing word is not cut or cot. It’s almost certainly cat, so the “a” is filled in using imputation.
Imputation usually works well, but occasionally it can extend matching areas improperly. This has always been true, and it’s still true with the new low-pass WGS test. The new WGS test only scans the genome twice to keep the test affordable. Any “no read” area must be imputed. I wrote about imputation here.
Ok, back to the MyHeritage comparison!
Test Comparison Methodology
If you’re recreating this process with your own results:
- Color-code the column headers for the various tests
- Label them clearly so you can easily differentiate between tests
- Freeze your top row
Select the test you want to search for matches, and record the people you want to cross-check. I began the process with my FTDNA test that I uploaded to MyHeritage in 2016.
I entered the matches on my spreadsheet, recording the matching cM amount. Then I selected the other tests, one by one, and searched for the same match name.
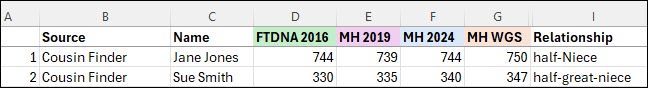
In this case, I started with the FTDNA 2016 test. Jane Jones (not her real name) matched me at 744 cM.
Then I selected the MyHeritage 2019 test, searched for Jane’s name, and recorded the match amount – 739 cM. I did the same with the 2024 test, and last, the WGS test.
When searching by surname at MyHeritage, don’t always expect the person to be at the top of the list where you might expect. Be sure to scroll down a bit, even to page two, especially with common names. MyHeritage also displays people with the same surname in their trees.
Match Analysis
As we work through these match results, keep in mind that the comparison percentage numbers only pertain to the 434 people that I’ve selected to compare across all four tests. This is NOT the total amount in any category for all of my matches. There’s no way to make that determination without manually comparing every single match for all four tests – which is why I selected what I felt was a representative sample.
You’ll quickly discover that many people DON’T MATCH you on all the DNA tests. You’ll notice as I give examples that I’ve colored coded some cells for my own use in both interpreting matches as well as sorting them. For example, People who don’t match on that test were labeled “none” and colored bright blue. Eventually, I simply entered “0” instead of the word “none” so I could perform math functions on those cells. I retained the blue so I could filter by cell color. You get the idea.

Using the new WGS test, 16 people (3.7% of 434) match me ONLY on the WGS test, but do NOT match me on any of the other tests.
Interestingly enough, they are all in the Top 100/150 category for the WGS test. Those match results range from 45 cMs to 53 cMs.
That’s NOT a trivial amount of DNA. It’s rather confusing how someone could match at that level on the WGS test, but not at all on the others.
Equally as interesting is that two of those 16 WGS matches don’t match either of my parents.
So, let’s say this another way to be clear – I only see these matches on the WGS test, and none of the other tests.
How Many People Match Me on Only One Test?
Ok, so how many people match me on ONLY one test?
| FTDNA 2016 Only Matches | MH 2019 Only Matches | MH 2024 Only Matches | MH WGS Only Matches |
| 44 (10.1%) | 3 (0.7%) | 3 (0.7%) | 16 (3.7%) |
- 44 people match me ONLY on the FamilyTreeDNA 2016 uploaded test.
- 3 people match me ONLY on the MyHeritage 2019 and 2024 tests, respectively, but not the same three people
- 16 people match me ONLY on the MyHeritage WGS test
Extrapolating these percentages to the rest of my matches suggests the following number of people would match ONLY on this test in the entire match list for each test.
| FTDNA 2016 | MH Health 2019 | MH 2024 | MH WGS | |
| Total Matches | 19,722 | 17,179 | 17,767 | 17,676 |
| Extrapolated Matches on Only This Test | 10.1% or 1992 matches | 0.7% or 120 matches | 0.7% or 124 matches | 3.7% or 654 matches |
How Many People DON’T Match Me on a Specific Test?
Now, how many people DON’T match me on a specific test?
| No FTDNA Match | No MH 2019 Match | No MH 2024 Match | No MH WGS Match |
| 36 (8.3%) | 117 (27%) | 126 (30%) | 96 (22%) |
- 36 people don’t match me on the FamilyTreeDNA test, but do match me on at least one other test at MyHeritage
- 117 people don’t match on the 2019 MyHeritage test, but do match on at least one other test at MyHeritage
- 126 people don’t match on the 2024 MyHeritage test, but do match on at least one other test at MyHeritage
- 96 people don’t match me on the WGS test, but do match me on at least one other test at MyHeritage
Extrapolating these percentages provides an extrapolated number of matches that I don’t match on any specific test, but that I do match on at least one other test.
| FTDNA 2016 | MH Health 2019 | MH 2024 | MH WGS | |
| Total Matches | 19,722 | 17,179 | 17,767 | 17,676 |
| Extrapolated # That Don’t Match on This Test | 8.3% or 1637 matches | 27% or 4638 matches | 39% or 5330 matches | 22% or 3,889 matches |
How Many Match Me On All Tests
- 195 matches, or 44.9%, nearly half of my matches, match on all four tests at some level.
- Out of those, 68, or 15.7% of the total number of matches match me at exactly the same cM level across all 4 tests. That’s pretty remarkable.
The Largest Differences Between Tests
Another question might be how large the difference is between the various matches.
I calculated the largest differences between the highest and lowest match values between the four tests, and placed that value in column G. This means that I subtracted the lowest value of the four tests on this particular match, from the highest value.
In the first row, that means I subtracted 0, the MH 2019 test value, from 75, the WGS test value. The difference between the lowest and highest values is 75 cMs.
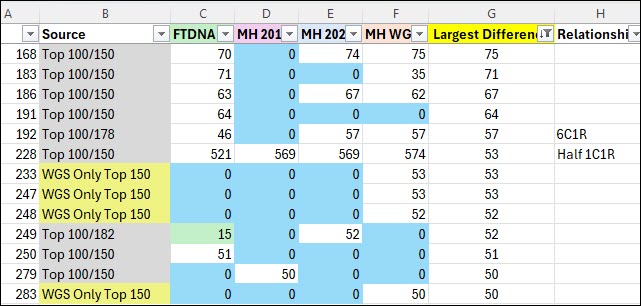
Next, I sorted, highest to lowest in column G, so the largest difference is displayed at the top.
I was VERY surprised to see a difference as high as 75 cM, so let’s evaluate the results where the difference is 50 cM or greater. Thirteen matches fall into this category.
- Entry 168 – The largest difference at 75 cM. This person matches me at 70, 74 and 75 cM, but not at all on the 2019 test, which caused me to go back and check again. Did I spell the name correctly? Yes, I did. We don’t know why I don’t match this person on the 2019 test, but the other matching cM values are very close so they look to be correct.
- Entry 183 – I match this person on both the FamilyTreeDNA uploaded test at 71 cMs, and the WGS test at 35 cMs, around half as much on the WGS test as the FamilyTreeDNA test. I don’t match them at all on either the MyHeritage 2019 or 2024 kits. I have no explanation.
- Entry 186 – Like entry 168, we match on three of four tests at 62, 63 and 67 cMs, with the non-matching test being the 2019 test. I would presume that this match is accurate as well.
- Entry 191 – This one is interesting because I match this person on the FamilyTreeDNA uploaded test at 64 cMs, but none of the other tests.
- Entry 192 – We match at 57 cMs on both the WGS and the 2024 tests, but not the 2019 test, where we don’t match at all. The match on the FamilyTreeDNA test is 11 cMs lower, at 46 cMs.
- Entry 228 – This person is my half 1C1R, and I match them on all the tests, of course. However, there’s a 53 cM difference between the WGS and the FamilyTreeDNA uploaded test. In a relationship this close, 53 cM is a small percentage and won’t affect matching, but it’s not an insignificant amount of DNA.
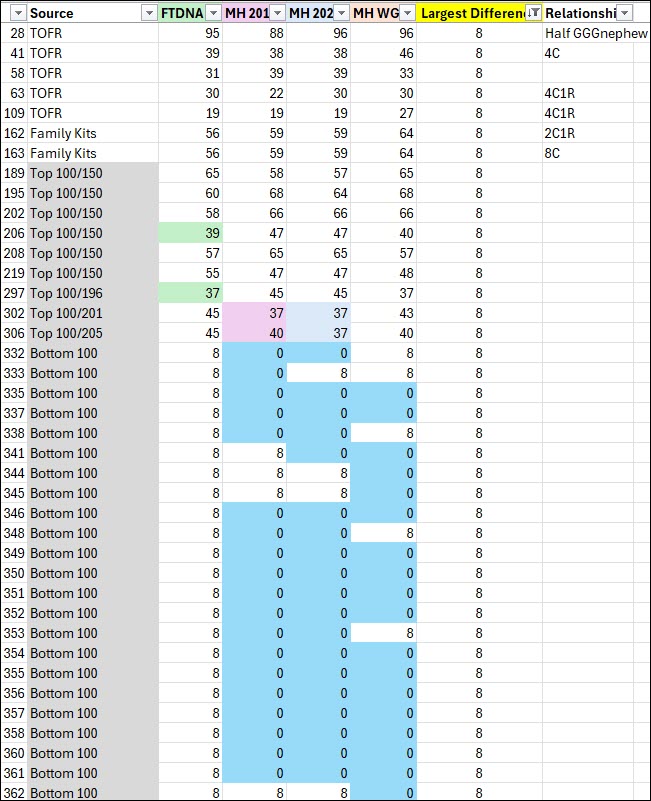
- Entries 233, 247, 248 and 283 – I match these people ONLY on the WGS test at 50, 52 and 53 cMs, so if I hadn’t taken the WGS test, I wouldn’t match them at all. Without additional research, we can’t tell if this is a legitimate match or not, but 50-53 cM would be a lot to be imputed or to be identical by chance. These people also match one of my parents’ tests, which eliminates the identical by chance possibility, meaning some of the DNA matches my mother and some matches my father – at least on my end. We can’t determine if this match is identical by chance on their side. I’ve never seen a 50+ cM segment (or even close) that is identical by chance, though.
- Entry 249 – Matches on the FamilyTreeDNA test at 15 cM, and the MyHeritage 2024 test at 52 cM, but not the others.
- Entry 250 – Matches at 51 cM on the FamilyTreeDNA test, but not on any of the MyHeritage tests.
- Entry 279 – Matches only on the MyHeritage 2019 test at 50 cM.
Difference Range
Next, let’s review the entire range of differences, meaning the largest matching difference for any one person across all four tests, by group. I’m including all 434 here so you can judge for yourself.
- 50-75 cM difference – 13 matches analyzed above

- 45-49 cM difference – 22 matches

- 40-44 cM difference – 11 matches

- 35-39 cM difference – 9 matches

- 30-34 cM difference – 10 matches

- 25-29 cM difference – 12 matches

- 20-24 cM difference – 26 matches

- 16-19 cM difference – 28 matches

- 13-15 cM difference – 29 matches

- 9-12 cM difference – 29 matches

- 8 cM difference – 78 matches
The 8 cM difference has the most of any value or category because this is the lowest level of matching at MyHeritage. Many tests have a minimum level match on a test or tests, and no others.

- 6-7 cM match difference – 41 matches
The match differences at 5 cM and below are inconsequential. 57 matches fall into this category.
Commentary
One of the indicators of a valid match is if a parent has tested and also matches,
Of these 434 matches, 35 match neither parent, and most of those are at the smallest match level, meaning 8 cM. Of all the match amounts, that would be the least reliable, and most likely to be a false positive match, or identical by chance.
However, that’s not universally the case. Some WGS results match people at significantly higher levels, but don’t match parents. Two WGS matches match people at 47 and 49 cMs, respectively, and not on any of the other tests. Those two WGS matches don’t match either parent.
After reviewing all 434 selected matches, it appears that both the FamilyTreeDNA 2016 test, and the WGS test produce the most consistent and reliable results of the four tests.
44 people, or 10%, match on BOTH the WGS and the FTDNA tests, but neither of the other two tests. A total of 13.8% match EITHER the FTDNA test OR the WGS test, but not the others.
Conclusions
I think we can draw several conclusions from this comparison.
First, let’s evaluate the number of matches. Looking at the differences between the total number of matches between the various tests, especially the three MyHeritage tests, over time, isn’t that great. That’s exactly why you can’t depend on these numbers as an accurate comparison.
| FTDNA 2016 | MH Health 2019 | MH 2024 | MH WGS | |
| Total Matches | 19,722 | 17,179 | 17,767 | 17,676 |
There are only a few hundred differences between the three MyHeritage tests, and about 2000 between the FamilyTreeDNA test uploaded in 2016 and the various MyHeritage tests. That’s a substantial difference.
The difference number of matches between tests may seem irrelevant, especially the MyHeritage tests, until you realize that those who match AREN’T ALL THE SAME PEOPLE. In other words, comparing the MyHeritage 2024 test with the WGS test only shows a difference of 91 matches. This DOES NOT mean that the MyHeritage 2024 test and the WGS test have 17,676 of the same people who match both tests, and that the 2024 test simply has 91 more matches than the WGS test.
As we’ve seen, many people who appear on any one match list don’t appear on other match lists.
Our analysis showed that 44.9% of my 434 matches compared appear on all match lists, which means that more than half of my matches appear on one or more match lists, and not the others. Therefore, just comparing the number of matches isn’t really relevant. You need to compare the people included on all the different tests, which is why I created my spreadsheet and included people from a wide variety of sources.
3.7% of my matches on the WGS test were not on any other test, which extrapolates to approximately 654 of my total WGS matches that I wouldn’t receive any other way.
I care a great deal about those matches, especially since at least some appear to be high value.
Yes, I absolutely, positively want those matches, especially when you consider that some of the matching differences are as high as 75 cM. A 75 cM match can be in the second, third or fourth cousin range.
Realistically, they may or may not be valid or useful matches – but if I don’t have the opportunity to compare them, I’ll never know.
Should You Purchase the WGS Test If You’ve Already Tested?
So, now for the question you’re surely asking yourself.
Truthfully, when I ordered my test back in December, I was ambivalent. I only ordered it to do this comparison for my blog readers – and I really dislike spending money on something that I don’t think will benefit me.
Note the words “don’t think.”
I’ve changed my mind, for several reasons, and I’m glad I ordered the test.
The thing that changed my mind was that I received a nontrivial amount of matches on the WGS test that I didn’t receive on any of the others – even if some of them turn out to be identical by chance.
Since we can’t go back in time and take the earlier tests, and MyHeritage no longer accepts uploads from other vendors, our decision now is whether or not we should take the new WGS test, or not, especially if we already have a DNA test at MyHeritage.
If you’re a new tester, by all means, test at all four of the main vendors. DNA matching is the best thing since sliced bread.
However, the people I’m really speaking to here are those who already have a test of some sort at MyHeritage.
Here’s the bottom line:
- You will receive WGS matches that you didn’t receive on your other test – and vice versa, so don’t delete your older test at MyHeritage
- Some of those new WGS matches may well be high-value matches – as was illustrated in the “differences” I discovered.
- Given the differences in who is included in the match list, your TOFR will be different too – perhaps leading to a brick wall breakthrough. I have two that I’m just itching to solve.
- Use matches, shared matches and TOFR from ALL of your tests at MyHeritage.
My Biggest Regret
As Ran Snir said, new features and developments at MyHeritage will be based on the WGS test. We don’t know what those developments might be, or when they will become available. But it’s very clear that while testers on the older testing platforms will receive as much as MyHeritage can give them, the MyHeritage DNA future is being build on the WGS platform. I want to be there and benefit from new discoveries.
My biggest regret is that my parents aren’t around to take the new WGS test – and neither are several other family members.
Of the 15 family members whose tests I manage at MyHeritage, 9 are deceased, and I think that four more are as well. Two others are now quite elderly and are no longer able to consent or retest.
Your closest family members are your DNA anchors, identifying lineages and pointing you in specific directions, guiding your research.
The very best thing you can do for your genetic genealogy is to test your grandparents if they are living, and your parents. If they aren’t available, test your closest relatives such as grandparents, siblings, aunts, uncles and first cousins.
Preparing for the Future
So, here’s my advice:
- Take the WGS test yourself in order to glean as much information as possible and to benefit from future developments.
- Retest any relatives whose tests you manage on the WGS platform, if possible.
- Test your close family members and anyone you know whose DNA test could help you identify ancestral lineages.
Why is testing your relatives important?
Close relatives will carry some of the DNA from your mutual ancestors that you don’t.
Having the known DNA of your ancestors means that you can evaluate and analyze the trees of the entire group of people who match those identified DNA segments to see if you can break down an upstream brick wall.
I’ve been successful doing this for some time – and am in the process again by combining DNA matches and traditional records research.
Coupon Code for $20 DNA Test
MyHeritage has been kind enough to provide a limited-time coupon code (RobertaFeb26) for my readers which DROPS YOUR PRICE for the DNA test to $20 through February 28th at midnight.
This is the absolute lowest price I’ve ever seen for a DNA test.
You’ll receive the following features that are included with every test:
- Ethnicity and ethnicity map
- DNA matches and the ability to contact them
- Shared ancestral surnames
- Chromosome browser
- cM Explainer
In addition, with this code you’ll receive both Shared DNA Matches and Shared Ancestral Places that usually require a subscription.
Normally, a subscription is required to access:
- Trees of DNA matches
- Shared DNA Matches (free now with the coupon code)
- Shared ancestral places (free now with the coupon code)
- AutoClusters
- Theory of Family Relativity (TOFR)
If you’re interested in trying a subscription, click here to purchase a MyHeritage subscription with a free trial.
Here’s the link to purchase the DNA test, and here’s the coupon code to enter at checkout: RobertaFeb26
And yes, absolutely feel free to share the coupon code with your family, friends, and anyone else who might benefit.
Let me know how your results compare when you receive them.
_____________________________________________________________
Share the Love!
You’re always welcome to forward articles or links to friends and share on social media.
Subscribe!
If you haven’t already subscribed, it’s free. You’ll receive an e-mail whenever I publish by clicking the “follow” button at the top of the main blog page, here.
Help Keep This Blog Free
I receive a small commission when you click a vendor link in my articles and purchase that item. This does NOT increase your price but helps me keep the lights on and this informational blog free for everyone. Please click on the affiliate links in the articles or to the vendors below if you are purchasing products or DNA testing.
Thank you so much.
DNA Purchases and Free Uploads
- FamilyTreeDNA – Y-DNA, mitochondrial and autosomal DNA testing
- MyHeritage DNA – Autosomal DNA test
- AncestryDNA – Autosomal DNA test
- AncestryDNA Plus Traits
- 23andMe Ancestry – Autosomal DNA only, no Health
- 23andMe Ancestry Plus Health
Genealogy Products and Services
- MyHeritage Subscription with Free Trial
- Legacy Family Tree Webinars – Genealogy and DNA classes, subscription-based, some free
- Legacy Family Tree Software – Genealogy software for your computer
- OldNews – Old Newspapers with links to save to MyHeritage trees
- MyHeritage Omni comprehensive “everything included” subscription plan
- Newspapers.com – Search newspapers for your ancestors
- NewspaperArchive – Search different newspapers for your ancestors
My Books
- DNA for Native American Genealogy – by Roberta Estes, for those ordering the e-book from anyplace, or paperback within the United States
- DNA for Native American Genealogy – for those ordering the paperback outside the US
- The Complete Guide to FamilyTreeDNA – Y-DNA, Mitochondrial, Autosomal and X-DNA – for those ordering the e-book from anyplace, or paperback within the United States
- The Complete Guide to FamilyTreeDNA – Y-DNA, Mitochondrial, Autosomal and X-DNA for those ordering the paperback from outside the US
Genealogy Books
- Genealogical.com – Lots of wonderful genealogy research books
- American Ancestors – Wonderful selection of genealogy books
Genealogy Research
- Legacy Tree Genealogists – Professional genealogy research
