Big Y Matching

A few days ago, Family Tree DNA announced and implemented Big Y Matching between participants who have taken the Big Y test.

This is certainly welcome news.  Let’s take a look at Big Y matching, what it means and how to utilize the features.

First, there are really two different groups of people who will benefit from the Big Y tests.

People trying to sort through lines of a common and related surname – like the McDonald or Campbell families, for example – and haplogroup researchers and project administrators.

My own family, for example, is badly brick walled with Charles Campbell first found in Hawkins County, TN in the 1780s.  We know, via STR testing that indeed, he matches the Campbell Clan from Scotland, but we have no idea who is father might have been.  STR testing hasn’t been definitive enough on Charles’ two known sons’ descendants, so I’m very hopeful that someday enough Campbell men will test that we’ll be able between STR and SNP mutations to at least narrow the possible family lines.  If I’m incredibly lucky, maybe there will be a family line SNP (Novel Variant) and it won’t just narrow the line, it will give me a long-awaited answer by genetically announcing which line was his.  Could I be that lucky???  That’s like winning the genetic genealogy lottery!

For today, the Big Y test at $695 is expensive to run on an entire project of people, not to mention that many of the original participants in projects, the long-time hard-core genealogists, have since passed away.  We are now into our 15th years of genetic genealogy.

For those studying haplogroups, the Big Y is a huge sandbox and those researchers have lost no time whatsoever comparing various individuals’ SNPS, both known and novel, and creating haplogroup trees of those SNPs.  This is done by hand today, or maybe more accurately stated, by Excel.  This is “not fun” to put it mildly.  We owe these folks a huge debt of gratitude.  Their results are curated and posted, provisionally, on the ISOGG Tree.

There is an in-between group as well, and those are people who are working to establish relationships between people of different surnames.  In my case, Native American ancestors whose descendants have different surnames today, but who do share a common ancestor in some timeframe.  That timeframe of course could be anyplace from a couple hundred to several thousand years, since their entry into the Americas across Beringia someplace in the neighborhood of 12-15 thousand years ago.

The Big Y matching is extremely helpful to projects.

Let’s take a look.

Big Y Matches

Big Y landing

On your personal page, under “Other Results,” you’ll see the Big Y results.  Click on Results” and you’ll see the following page.

big y results

The Known SNPs and Novel Variants tabs have been there since release, but the Matching tab, top left, is new.

By clicking on the Matching tab, you will then see the men you match based on your terminal SNP as determined in the Big Y Known SNPs data base.  You will be matched to men who carry up to and including 4 mutations difference in known SNPs, and unlimited novel variant differences.  If you have a zero in the “Known SNP Difference” column, that means you have no differences at all in known SNPs.

big y matches cropped2

The individual being used for an example here has paternal ancestry from Hungary.  His terminal SNP is reported as R-CTS11962.  Therefore, all of the people he matches should also carry this same SNP as their terminal SNP.

This is actually quite interesting, because of his 10 exact matches, 9 of them have surnames or genealogy that suggests eastern European/Slavic ancestry.  The 10th, however, which happens to be his closest match, carries an English surname and reports their ancestor to be from Yorkshire, England.  His one mutation differences carry the same pattern, with one being from England and two of the other three from eastern Europe.

Our participant has 155 total Novel Variants, 135 high quality and 20 medium quality.  Only high quality are listed in the comparison.  Medium quality are not.

Ancestral Location Known SNP Difference Shared Novel Variants Non Matching Known SNPs
Yorkshire, England 0 134 None
Prussia 0 127 None
Ukraine 0 121 None
Poland 0 121 None
Belarus 0 119 None
Poland 0 116 None
Poland 0 116 None
Russian e-mail 0 113 None
Bulgaria 0 113 None
Slovakia 0 111 None
English surname 1 126 PF6085
Undetermined, poss German 1 121 F1816
Poland 1 118 F552
Poland 1 116 CTS10137
Prussia 2 122 CTS11840 PF4522
Poland 2 112 L1029 PR6932
Russia 3 116 CTS3184 L1029 PF3643
Poland 3 106 CTS11962 L1029 L260
Ukraine 3 105 CTS11962 L1029 L260
Poland 3 104 CTS11962 L1029 L260
Poland 3 100 CTS11962 L1029 L260
Poland 3 99 CTS11962 L1029 L260
Eastern European surname 3 98 CTS11962 L1029 L260
Poland/Germany 3 97 CTS11962 L1029 L260
Austria/Galacia 3 93 CTS11962 L1029 L260
Poland 4 97 CTS11562 CTS11962 L1029 L260

It’s also very interesting to note that his non-matching known SNPs tend to cluster.  Non-matching known SNPs can go in either direction – meaning that they could be absent in our participant and present in the rest, or vice versa.

l1029 search

It’s easy to tell.  In the Big Y Results, under Known SNPs, there is a search feature.  This means that it’s easy to search for SNPs and to determine their status.  For example, above, our participant does carry SNP L1029 (he’s derived or positive (+) for the mutation in question).  This means that our participant has developed L1029, and, it just so happens, also CTS11962 and L260, the three clustered SNPs, since these men shared a common ancestor.

It’s difficult not to speculate a little.  If the TMCRA Big Y SNP estimates are correct, this suggests that these 3 clustered SNPS occurred someplace between 4350 and about 5000 years ago, based on the range (93-106) of the number of high quality novel variant differences.  We’ll talk more about this in a minute.

f552 search

For SNP F552, our participant is negative, meaning that that other person has developed this SNP since their shared ancestor.  In fact, he’s negative for all of the other Known SNP differences.

Novel Variants

The Novel Variants are quite interesting.  Novel Variants are mutations that if found in enough people who are not related within a family group will someday become SNPs on the tree.  Think of them as ripening SNPs.

By clicking on the “Show All” dropdown box you can see the list of the participants novel variants and how many of his matches share that Novel Variant.

novel variant list

In this example, all 26 of our participant’s novel variants share 13142597.  I’m thinking that this Novel Variant will someday become classified as a SNP and not as a Novel Variant anymore.  When that happens, and no, we don’t know how often Family Tree DNA will be reviewing the Novel Variants for SNP candidates, it will no longer be in the Novel Variant list.  The Novel Variants are meant to be family, novel or lineage SNPs, not population based SNPS that apply to a wide variety of people.  Finding these, of course, and adding them to the human haplotree is the entire purpose of full sequence Y chromosomal testing.  Just look at tall of this new information about this man’s ancestors and the DNA that they passed on to this gentleman.

By scrolling down to the bottom of that list, we find that our participant has 8 different Novel Variants where he matches only one individual.  By clicking on the Novel Variant number, you can see who he matches.  Of those 8, 7 of them match to the man who carries the English surname and one matches to a gentleman from Prussia.

This information is extremely interesting, but it gets even more interesting when compared against STR matches.  Our participant has a fairly unusual haplotype above 12 markers.  He has three 67 marker matches, two 37 marker matches and thirty-three 25 marker matches.  None of the men he matches on the SNP test match him on any of those tests.  I did not check his 12 marker matches, because I felt that anyone who would invest the money in the Big Y would certainly have tested above 12 markers plus our participants has several hundred 12 marker matches.

The numbers being bantered around by people working with SNP information suggest that one Big Y mutation equals about 150 years.  If this is true, then his closest match, the English gentleman from Yorkshire, England would share an ancestor about 2850 years ago.  That is clearly beyond the reach of STR markers in terms of generational predictions, so maybe STR matches are not expected in this situation, IF, the 150 year per novel variant estimate is close to accurate.

Another interesting piece of information that can be deduced from this information is how many SNPs were actually found.

At the bottom of our participants page, under Known SNPs, it says “Showing 24 of…571 entries (filtered from 36,274 total entries.)”  We know that the entire data base of SNPs that Family Tree is utilizing, which includes but is not limited to the 12,000+ Geno 2.0 SNPs, is 36,274.  In other words, 36,274 are the number of SNPs available to be found and counted as a SNP because they have already been defined as such.  Any other SNPs discovered are counted as Novel Variants.

Not all available SNPs are found and read in this type of next generation test.  The number of “Matching SNPs” with each individual gives us an idea of how many SNPs actually were found and read at either a medium and high confidence level.  Low confidence SNPs and no-calls are eliminated from reporting.

Our participants best match matches him on 25,397 SNPs.  This leaves a total of 10,877 SNPs that were not called.

The Future

SNP Matching is a wonderful feature and a first in this industry.  A hearty thank you to Family Tree DNA!

However, like all passionate people, we are already looking ahead to see what can be and should be done.

Here are some suggestions and questions I have about how the future will unwrap relative to Big Y SNP testing and matching.

  1. Within surname projects, matching should be relatively easy, unless hundreds of people test. I would be happy to have that problem. Today, administrators are creating spreadsheets of matches and novel SNPs and attempting to “reverse engineer” trees. In family groups, those trees would be of Novel SNPs, and in haplogroup projects, those trees would be of both Known SNPs and Novel Variants and where the Novel SNPS slip in-between the known SNPs to create new branches and sub-branches of the haplotree. We, as a community, need some tools to assist in this endeavor, for both the surname project admin and the haplogroup project admin as well.
  2. As new SNPs are discovered in the future, one will not be retested on this platform. As new SNPs are added to the tree, this could affect the matching by terminal SNP. Family Tree DNA needs to be prepared to deal with this eventuality.
  3. As a community, we desperately need a better tool to determine our actual “terminal SNP” as opposed to the Geno 2.0 terminal SNP. Yes, I know the ISOGG tree is provisional, but the contributed tools initially provided by volunteers to search the ISOGG tree utilizing the known SNPs reported in Big Y no longer work. We desperately need something similar while Family Tree DNA is revamping its own tree. I would hope that Family Tree DNA could add something like a secondary “search ISOGG tree” function as a customer courtesy, even if it needs some disclaimer verbiage as to the provisional nature of the tree.
  4. With the number of SNPs being searched for and reported, no calls begin to become an issue, especially if the no-call happens to be on the terminal SNP. We need to be able to determine whether a non-match with someone is actually a non-match or could be as a result of a no-call, and without resorting to searching raw data files. Today, participants can order a SNP test of a SNP position that has been reported as a no-call, but one needs to first figure that out that it is a no-call by looking at the BAM and BED files, something that is beyond the capability of most genetic genealogists. Furthermore, in the case of a “suspicious” no-call, where, for example, individuals in the same surname project with the same surname and other matching SNPS and STRs, some type of “smart-matching” needs to be put into place to alert the participant and project admin of this situation so that they can decide up on a proper course of action. In other words, no-calls need to be reported and accounted for in some fashion, as they are important data points for the genetic genealogist.

I am extremely grateful to Family Tree DNA for their efforts and for Big Y matching.  After all, matching is the backbone of genetic genealogy.  This list is not a complaint list, in any sense.  Family Tree DNA has a very long history of being responsive to their client base and I fully expect they will do the same with the next step in the Big Y journey.

The story of our DNA is not yet told.  Where our STR matches are found and where our SNP matches are found tells the story of the migration of our ancestors.  Today, SNPs and STRs promise to overlap, and already have in some cases.  If I could, I would order a Big Y test for every individual that I sponsor and for every person in each of my projects. I feel that these tests, combined, will help immensely to complete the puzzle to which we have disparate pieces today.  I look forward to the day when the time to the most recent common ancestor can be calculated by utilizing the Y STR markers, the known SNPs and the Novel Variants.  In a very large sense, the future has arrived today.  Now, we just have to test and figure out how all of the puzzle pieces fit together.

If you haven’t yet ordered a Big Y, you can order here.  The more people who test, the larger the comparison data base, and the sooner we will all have the answers we seek.

______________________________________________________________

Disclosure

I receive a small contribution when you click on some of the links to vendors in my articles. This does NOT increase the price you pay but helps me to keep the lights on and this informational blog free for everyone. Please click on the links in the articles or to the vendors below if you are purchasing products or DNA testing.

Thank you so much.

DNA Purchases and Free Transfers

Genealogy Services

Genealogy Research

That Unruly X….Chromosome That Is

Iceberg

Something is wrong with the X chromosome.  More specifically, something is amiss with trying to use it, the way we normally use recombinant chromosomes for genealogy.  In short, there’s a problem.

If you don’t understand how the X chromosome recombines and is passed from generation to generation, now would be a good time to read my article, “X Marks the Spot” about how this works.  You’ll need this basic information to understand what I’m about to discuss.

The first hint of this “problem” is apparent in Jim Owston’s “Phasing the X Chromosome” article.  Jim’s interest in phasing his X, or figuring out where it came from genealogically, was spurred by his lack of X matches with his brothers.  This is noteworthy, because men don’t inherit any X from their father, so Jim’s failure to share much of his X with his brothers meant that he had inherited most of his X from just one of his mother’s parents, and his brothers inherited theirs from the other parent.  Utilizing cousins, Jim was able to further phase his X, meaning to attribute portions to the various grandparents from whence it came.  After doing this work, Jim said the following”

“Since I can only confirm the originating grandparent of 51% my X-DNA, I tend to believe (but cannot confirm at the present) that my X-chromosome may be an exact copy of my mother’s inherited X from her mother. If this is the case, I would not have inherited any X-DNA from my grandfather. This would also indicate that my brother Chuck’s X-DNA is 97% from our grandfather and only 3% from our grandmother. My brother John would then have 77% of his X-DNA from our grandfather and 23% from our grandmother.”

As a genetic genealogist, at the time Jim wrote this piece, I was most interested in the fact that he had phased or attributed the pieces of the X to specific ancestors and the process he used to do that.  I found the very skewed inheritance “interesting” but basically attributed it to an anomaly.  It now appears that this is not an anomaly.  It was, instead the tip of the iceberg and we didn’t recognize it as such.  Let’s look at what we would normally expect.

Recombination

The X chromosome does recombine when it can, or at least has the capacity to do so.  This means that a female who receives an X from both her father and mother receives a recombined X from her mother, but receives an X that is not recombined from her father.  That is because her father only receives one X, from his mother, so he has nothing to recombine with.  In the mother, the X recombines “in the normal way” meaning that parts of both her mother’s and her father’s X are given to her children, or at least that opportunity exists.  If you’re beginning to see some “weasel words” here or “hedge betting,” that’s because we’ve discovered that things aren’t always what they seem or could be.

The 50% Rule

In the statistical world of DNA, on the average, we believe that each generation receives roughly half of the DNA of the generations before them.  We know that each child absolutely receives 50% of the DNA of both parents, but how the grandparents DNA is divided up into that 50% that goes to each offspring differs.  It may not be 50%.  I am in the process of doing a generational inheritance study, which I will publish soon, which discusses this as a whole.

However, let’s use the 50% rule here, because it’s all we have and it’s what we’ve been working with forever.

In a normal autosomal, meaning non-X, situation, every generation provides to the current generation the following approximate % of DNA:

Autosomal % chart

Please note Blaine Bettinger’s X maternal inheritance chart percentages from his “More X-Chromosome Charts” article, and used with his kind permission in the X Marks the Spot article.

Blaine's maternal X %

I’m enlarging the inheritance percentage portion so you can see it better.

Blaine's maternal X % cropped

Taking a look at these percentages, it becomes evident that we cannot utilize the normal predictive methods of saying that if we share a certain percentage of DNA with an individual, then we are most likely a specific relationship.  This is because the percentage of X chromosome inherited varies based on the inheritance path, since men don’t receive an X from their fathers.  Not only does this mean that you receive no X from many ancestors, you receive a different percentage of the X from your maternal grandmother, 25%, because your mother inherited an X from both of her parents, versus from your paternal grandmother, 50%, because your father inherited an X from only his mother.

The Genetic Kinship chart, below, from the ISOGG wiki, is the “Bible” that we use in terms of estimating relationships.  It doesn’t work for the X.

Mapping cousin chart

Let’s look at the normal autosomal inheritance model as compared to the maternal X chart fan chart percentages, above, and similar calculations for the paternal side.  Remember, the Maternal Only column applies only to men, because in the very first generation, men’s and women’s inheritance percentages diverge.  Men receive 100% of their X from their mothers, while women receive 50% from each parent.

Generational X %s

Recombination – The Next Problem

The genetic genealogy community has been hounding Family Tree DNA incessantly to add the X chromosome matching into their Family Finder matching calculations.

On January 2, 2014, they did exactly that.  What’s that old saying, “Be careful what you ask for….”  Well, we got it, but “it” doesn’t seem to be providing us with exactly what we expected.

First, there were many reports of women having many more matches than men.  That’s to be expected at some level because women have so many more ancestors in the “mix,” especially when matching other women.

23andMe takes this unique mixture into consideration, or at least attempts to compensate for it at some level.  I’m not sure if this is a good or bad thing or if it’s useful, truthfully.  While their normal autosomal SNP matching threshold is 7cM and 700 matching SNPs within that segment, for X, their thresholds are:

  • Male matched to male – 1cM/200 SNPs
  • Male matched to female – 6cM/600 SNPs
  • Female matched to female – 6cM/1200 SNPs

Family Tree DNA does not use the X exclusively for matching.  This means that if you match someone utilizing their normal autosomal matching criteria of approximately 7.7cM and 500 SNPs, and you match them on the X chromosome, they will report your X as matching.  If you don’t match someone on any chromosome except the X, you will not be reported as a match.

The X matching criteria at Family Tree DNA is:

  • 1cM/500 SNPs

However, matching isn’t all of the story.

The X appears to not recombine normally.  By normally, I don’t mean something is medically wrong, I mean that it’s not what we are expecting to see in terms of the 50% rule.  In essence, we would expect to see approximately half of the X of each parent, grandfather and grandmother, passed on to the child from the mother in the maternal line where recombination is a possibility.  That appears to not be happening reliably.  Not only is this not happening in the nice neat 50% number, the X chromosome seems to be often not recombining at all.  If you think the percentages in the chart above threw a monkey wrench into genetic genealogy predictions, this information, if it holds up in a much larger test, in essence throws our predictive capability, at least as we know it today, out the window.

The X Doesn’t Recombine as Expected

In my generational study, I noticed that the X seemed not to be recombining.  Then I remembered something that Matt Dexter said at the Family Tree DNA Conference in November 2013 in Houston.  Matt has the benefit of having a full 3 generation pedigree chart where everyone has been tested, and he has 5 children, so he can clearly see who got the DNA from which of their grandparents.

I contacted Matt, and he provided me with his X chromosomal information about his family, giving me permission to share it with you.  I have taken the liberty of reformatting it in a spreadsheet so that we can view various aspects of this data.

Dexter table

First, note that I have sorted these by grandchild.  There are two females, who have the opportunity to inherit from 3 grandparents.  The females inherited one copy of the X from their mother, who had two copies herself, and one copy of the X from her father who only had his mother’s copy.  Therefore, the paternal grandfather is listed above, but with the note “cannot inherit.”  This distinguishes this event from the circumstance with Grandson 1 where he could inherit some part of his maternal grandfather’s X, but did not.

For the three grandsons, I have listed all 4 grandparents and noted the paternal grandmother and grandfather as “cannot inherit.”  This is of course because the grandsons don’t inherit an X from their father.  Instead they inherit the Y, which is what makes them male.

According to the Rule of 50%, each child should receive approximately half of the DNA of each maternal grandparent that they can inherit from.  I added the columns, % Inherited cM and % Inherited SNP to illustrate whether or not this number comes close to the 50% we would expect.  The child MUST have a complete X chromosome which is comprised of 18092 SNPs and is 195.93cM in length, barring anomalies like read errors and such, which do periodically occur.  In these columns, 1=100%, so in the Granddaughter 1 column of % Inherited cM, we see 85% for the maternal grandfather and about 15% for the maternal grandmother.  That is hardly 50-50, and worse yet, it’s no place close to 50%.

Granddaughter 1 and 2 must inherit their paternal grandmother’s X intact, because there is nothing to recombine with.

Granddaughter 2 inherited even more unevenly, with about 90% and 10%, but in favor of the other grandparent.  So, statistically speaking, it’s about 50% for each grandparent between the two grandchildren, but it is widely variant when looking at them individually.

Grandson 1, as mentioned, inherited his entire X from his maternal grandmother with absolutely no recombination.

Grandsons 2 and 3 fall much closer to the expected 50%.

The problem for most of us is that you need 3 or 4 consecutive generations to really see this happening, and most of us simply don’t have data that deep or robust.

A recent discussion on the DNA Genealogy Rootsweb mailing list revealed several more of these documented occurrences, among them, two separate examples where the X chromosome was unrecombined for 4 generations.

Robert Paine, a long-time genetic genealogy contributor and project administrator reported that in his family medical/history project, at 23andMe, 25% of his participants show no recombination on the X chromosome.  That’s a staggering percentage.  His project consists of  21 people in with 2 blood lines tested 5 generations deep and 2 bloodlines tested at 4 generations

One woman’s X matches her great-great-grandmother’s X exactly.  That’s 4 separate inheritance events in a row where the X was not recombined at all.

The graphic below, provided by Robert,  shows the chromosome browser at 23andMe where you can see the X matches exactly for all three participants being compared.

The screen shot is of the gg-granddaughter Evelyn being compared to her gg-grandmother, Shevy, Evelyn’s g-grandfather Rich and Evelyn’s grandmother Cyndi. 23andme only lets you compare 3 individuals at a time so Robert did not include Evelyn’s mother Shay, who is an exact match with Evelyn.

Paine X

Where Are We?

So what does this mean to genetic genealogy?  It certainly does not mean we should throw the baby out with the bath water.  What it is, is an iceberg warning that there is more lurking beneath the surface.  What and how big?  I can’t tell you.  I simply don’t know.

Here’s what I can tell you.

  • The X chromosome matching can tell you that you do share a common ancestor someplace back in time.
  • The amount of DNA shared is not a reliable predictor of how long ago you shared that ancestor.
  • The amount of DNA shared cannot predict your relationship with your match.  In fact, even a very large match can be many generations removed.
  • The absence of an X match, even with someone closely related whom you should match does not disprove a descendant relationship/common ancestor.
  • The X appears to not recombine at a higher rate than previously thought, the previous expectation being that this would almost never happen.
  • The X, when it does recombine appears to do so in a manner not governed by the 50% rule.  In fact, the 50% rule may not apply at all except as an average in large population studies, but may well be entirely irrelevant or even misleading to the understanding of X chromosome inheritance in genetic genealogy.

The X is still useful to genetic genealogists, just not in the same way that other autosomal data is utilized.  The X is more of an auxiliary chromosome that can provide information in addition to your other matches because of its unique inheritance pattern.

Unfortunately, this discovery leaves us with more questions than answers.  I found it incomprehensible that this phenomenon has never been studied in humans, or in animals, for that matter, at least not that I could find.  What few references I did find indicated that the X seems to recombine with the same frequency as the other autosomes, which we are finding to be untrue.

What is needed is a comprehensive study of hundreds of X transmission events at least 3 generations deep.

As it turns out, we’re not the only ones confused by the behavior of the X chromosome.  Just yesterday, the New York Times had an article about Seeing the X Chromosome in a New Light.  It seems that either one copy of the X, or the other, is disabled cell by cell in the human body.  If you are interested in this aspect of science, it’s a very interesting read.  Indeed, our DNA continues to both amaze and amuse us.

A special thank you to Jim Owston, Matt Dexter, Blaine Bettinger and Robert Paine for sharing their information.

Additional sources:

Polymorphic Variation in Human Meiotic
Recombination (2007)
Vivian G. Cheung
University of Pennsylvania
http://repository.upenn.edu/cgi/viewcontent.cgi?article=1102&context=be_papers

A Fine-Scale Map of Recombination Rates and Hotspots Across the Human Genome, Science October 2005, Myers et al
http://www.sciencemag.org/content/310/5746/321.full.pdf
Supplemental Material
http://www.sciencemag.org/content/suppl/2005/10/11/310.5746.321.DC1

______________________________________________________________

Disclosure

I receive a small contribution when you click on some of the links to vendors in my articles. This does NOT increase the price you pay but helps me to keep the lights on and this informational blog free for everyone. Please click on the links in the articles or to the vendors below if you are purchasing products or DNA testing.

Thank you so much.

DNA Purchases and Free Transfers

Genealogy Services

Genealogy Research

Introducing the Autosomal DNA Segment Analyzer

We have a brand new toy in our DNA sandbox today, thanks to Don Worth, a retired IT professional.  I just love it when extremely talented people retire and we, in the genetic genealogy community, are the benefactors of their Act 2 evolution.  Our volunteers make such a cumulative difference.

Drum Roll please.

Introducing…..the Autosomal DNA Segment Analyzer, or ADSA.

The name alone doesn’t make your heart skip beats, but the product will.  This tool absolutely proves the adage that a picture is worth 1000 words.

Don described his new tool, which, by the way, is free and being hosted by Rob Warthen at www.dnagedcom.com, thus:

I created this tool in an attempt to put all the relevant information available that was needed to evaluate segment matches on a single, interactive web page. It relies on the three files for a single test kit that DNAgedcom.com collects from FamilyTreeDNA.com. These files include information about your matches, matching segment locations and sizes, and “in common with” (ICW) data. Using these files, the tool will construct a table for each chromosome which includes match and segment information as well as a visual graph of overlapping segments, juxtiposed with a customized, color-coded ICW matrix that will permit you to triangulate matching segments without having to look in multiple spreadsheets or on different screens in FamilyTreeDNA. Additional information, such as ancestral surnames, suggested relationship ranges, and matching segments and ICWs on other chromosomes is provided by hovering over match names or segments on the screen. Emails to persons you match may also be generated from the page. The web page produced by this program does not depend on any other files and may be saved as a stand-alone .html file that will function locally (or offline) in your browser. You can even email it to your matches as an attachment. You can play with a working sample output here.

Who wants to play with sample output?  I wanted to jump right in.  Word of caution…read the instructions FIRST, and pay attention, or you’ll wind up downloading your files twice.  The instructions can be found here.

I can’t tell you how many times, when I’ve been working with matches, that I’ve wondered to myself, “How many other people match us on this segment?”  For quite a while you could only download 5 people at a time, but now you can download the entire data file.  I’m a visual person.  To me, visually seeing is believing and the ADSA makes this process so much easier.  Truly, a picture is worth 1000 words.

I knew right away there were three things I wanted to do, so I’m going to run through each one of the three by way of examples to illustrate what you can do with the power of this wonderfully visual tool.  I’ve also anonymized the matches.

1. Clusters of matches.

I know I’ve told you that I’m mapping my DNA to ancestors.  When I first saw Don’s output, I knew immediately that this tool would be invaluable for grouping people from the same ancestral lines.

Barbara, the second row, is my mother and her DNA in this equation is extremely useful.  It helps me identify right away which side of my family a match comes from.  If you don’t have a parent available, aunts, uncles, cousins, all help, especially cumulatively.

Before we begin working with the results, take a minute and just sit and look at the graphic below.  These two clusters shown on this page, one near the top and the other at the bottom….they represent your ancestors.  Two very different ones in this case. This may be the only way you’ll ever “see” them, by virtue of a group of their descendants DNA clustered together.  A view through the keyhole of time provided by DNA. Isn’t it beautiful?

adsa cluster 1

All of these results in this “cluster of matches” example are my matches.  In other words, the file is mine and these are people who are matching me.  You can see that this tool provides us with start and end segments, total cMs and SNPs, and e-mails, but the true power is in the visual representation of the ICW (in common with) matrix.  The mapped segments are a nice touch too, and Don has listed these in progressive order, meaning from beginning to end of the segment (left to right.)

Look at this initial clustered group, shown enlarged below.  The first individual matches me and mother on one pink segment, but matches me on two segments, a pink and a black.  That means he’s from Mom’s side, or at least through one line, but probably somewhat distant since that one segment is his only match on any chromosome.  Because he also matches me on a segment where he doesn’t match Mom, he could also be related to me on my father’s side, or maybe we had a misread error on the black segment when comparing to Mom’s DNA. It is the adjoining segment.  In essence, there isn’t enough information to do much with this, except ask questions, so let’s move on to something more informative.

Beginning with the third person, the next grouping or cluster is entirely non-matching to mother, so this entire cluster is from my father’s side AND related to each other.

There are 6 solid matches here, and then they start to trail off to matches that aren’t so solid.

ADSA cluster 1 A

By flying over the match names with my cursor, I might be able to tell, based on their surnames, which line is being represented by this cluster of matches.  If I already have a confirmed cousin match in the group, then the rest of the group can be loosely attributed to that line, or a contributing (wife) line. Unfortunately, in this case, I can’t tell other than it looks like it might be through Halifax County, VA.  I do have an NPE there and some wives without surnames.

Let’s look on down this chromosome.  There is another very solid cluster, also on my Dad’s side.  In this second cluster, I have identified a solid cousin and I can tell you that this is a Crumley grouping.  My common ancestor with my Crumley cousin is William Crumley born about 1765 in Frederick Co., Va. and who died about 1840 in Lee Co., Va.  His wife is unknown, but we have her mitochondrial DNA.  Now this doesn’t mean that everyone in this group will all have a Crumley ancestor, they may not.  They may instead have a Mercer, a Brown, a Johnson or a Gilkey, all known wives’ surnames of Crumley men upstream of William Crumley.  But someplace, there is a common ancestor who contributed quite a bit of chromosome 1 to a significant number of descendants, and at least two of them are Crumleys.

ADSA Crumley cluster

At first, I found it really odd that my mother had almost no matches with me on chromosome 1.  Some of my mother’s ancestors came to the States later, from the Netherlands and from Germany.  Many of these groups are under-represented in testing.  However other ancestral groups have been here a long time, Acadians and Brethren Germans.  My father’s Appalachian, meaning colonial, ancestors seem to have more descendants who have tested.

However, looking now at chromosome 9, we see something different.

ADSA Acadian cluster

The second person, Doris, doesn’t match Mom anyplace, so is obviously related through my father, but look at that next grouping.

I can tell you based on hovering over the matches name that this is an Acadian grouping.  The Acadians are a very endogamous French-Canadian group, having passed the same DNA around for hundreds of years.  Therefore, a grouping is likely to share a large amount of common DNA, and this one does.

ADSA Acadian flyover

Based on this, I can then label all of these various matches as “Acadian” if nothing more.

Within a cluster, if I can identify one common ancestor, I can attribute the entire large group to the same lineage.  Be careful with smaller groups or just one or two rectangle matches.  Those aren’t nearly as strong and just because I match 2 people on the same segment doesn’t mean they match each other. However, when you see large segments of people matching each other, you have an ancestral grouping of some sort.  The challenge of course is to identify the group – but a breakthrough with one match means a likely breakthrough with the rest of them too, or at least another step in that direction.

2. Source of DNA

I have several cousins who match me on two or more distinct lines.  This tool makes it easy, in some cases, to see which line the DNA on a particular chromosome comes from.

I have both Claxton (James Lee Claxton/Clarkson born c 1775-1815 and Sarah Cook of Hancock Co., TN)  and Campbell (John Campbell b c 1772-1838 and Jane Dobkins born c 1780-1850/1860 of Claiborne Co., Tn.) ancestry.  My cousins, Joy and William do too.  In this case, you can see that Joy matches a Claxton (proven by Y DNA to be from our line) and so does William on the first green matching segment.  The second green segment is not found in the Claxton match, so it could be Claxton and the Claxton cousin didn’t receive it, or it could be Campbell, but it’s one or the other because Joy, William and I all three carry this segment.

ADSA Claxton Campbell

What this means is that the light green segments are Claxton segments, as are the fuchsia segments.  The source of the darker green segment is unknown.  It could be either Claxton or Campbell or a third common line that we don’t know about.

3.  Untangling Those Darned Moores

I swear, the Moore family is going to be the death of me yet. It’s one of my long-standing, extremely difficult brick walls.  It seems like every road of every county in Virginia and NC had one or more Moore families.  It’s a very common name.  To make thing worse, the early Moores were very prolific and they all named their children the same names, like James and William, generation after generation.

The earliest sign I can find of my particular Moore family is in Prince Edward County, Virginia when James Moore married Mary Rice (daughter of Joseph Rice and wife Rachel) in the early 1740s.  By the 1770s, the family was living in Halifax County, Virginia and their children were marrying and having children of their own of course.  They were some of the early Methodists with their son, the Reverend William Moore being a dissenting minister in Halifax County and his brothers Rice and Mackness Moore doing the same in Hawkins and Grainger County, TN.  Another son, James, went to Surry Co., NC.  We have confirmed this with a DNA descendant match.

We have the DNA of our Moore line proven on the Y side through multiple sons.  At the Moore Worldwide DNA project, we are group 19.  Now there are Moores all over the place in Halifax County.  I know, because I’ve paid for about half of them to DNA test and there are several distinct lines – far more than I expected.  Ironically, the Anderson Moore family who lived across the road from our James and then his son Rev. William, who raised the orphan Raleigh Moore, grandson of the Rev. William Moore, is NOT of the same Moore DNA line.  Based on the interaction of these two families, one would think assuredly that they were, which raises questions.  This Anderson Moore was the son of yet another James Moore, this one from Amelia County, VA., found in the large group 1 of the Moore project.  If this is all just too confusing and too close for comfort for you, well, join the crowd and what we Moore descendants have been dealing with for a decade now.

This raises the question of why there are so few matches to our Moore line.  Was our Moore line a “new Moore line,” born perhaps to a Moore daughter who gave the child her surname.  However, the child of course would pass on the father’s Y chromosome, establishing a “new” Moore genetic line.  I’m not saying that is what happened, just that it’s odd that there are so few matches to a clearly colonial Moore line out of Virginia.  With only one exception, someone genealogically stuck in Kentucky, to date, all DNA matches are all descendants of our James.  We do know that there was a William Moore, wife Margaret, living adjacent to James Moore in Prince Edward County but he and his wife sold out and moved on and are unaccounted for.

I’ve seen this same pattern with the Younger family line too, and sure enough, we did prove that these two different Y chromosome Younger families in fact do share a common ancestor.

So you can see why I get excited when I find anything at all, and I mean anything, about the Moore family line.

A Moore descendant of Raleigh, the orphan, has taken the autosomal Family Finder test, and he matched my cousin Buster, a known Moore descendant, and also another Cumberland Gap region researcher, Larry.  Larry also matches Buster.  I was very excited to see this three way match and I wrote to Larry asking if he had a Moore line.  Yes, he did, two in fact.  The Levi Moore line out of Kentucky and an Alexander Moore line out of Stokes County, NC, after they wandered down from Berks Co., PA. sometime before 1803.

Groan. Two Moores – I can’t even manage to sort one out, how will I ever sort two?

Then Larry told me that he had 4 of his cousins tested too.  Bless you Larry.

And better yet, one of Larry’s Moore lines is on his mother’s side and one on his father’s.  Even better yet.  Things are improving.

Now I’m really excited, right up until I discover that my cousin Buster matches two of Larry’s 3 cousins on his mother’s side and my Moore cousin from Halifax County, Virginia, matches the cousin on Larry’s father’s side.

How could I be THIS unlucky???

So I started out utilizing the ICW and Matrix tools at Family Tree DNA.  Because these people all matched Larry on overlapping segments on the chromosome browser, my first thought was maybe that these two Moore lines were really one and the same.  But then I pushed the ICW matches through to the Family Finder Matrix, and no, Larry’s paternal cousin does not match any of the three maternal cousins, who all match each other.  So the two Moore families are not one and the same.

Crumb.  Thank Heavens though for the Matrix which provides proof positive of whether your matches match each other.  Remember, you have two sides to each chromosome and you will have matches to both sides.  Without the Matrix tool, you have no way of knowing which of your matches are from the same side of your chromosome, meaning Mom’s side or Dad’s side.

Just about this time, as I was beginning to construct matrixes of who matches whom in the ICW compares between all of the ICW match permutations, I received a note from Don that he wanted beta testers for his new ADSA application.  I immediately knew what I was going to test!

I started with my cousin Buster’s kit.  Buster is one generation upstream from me, so one generation closer to the Moore ancestors.

On Larry’s maternal line, descended from the Levi Moore (Ky) line, he tested three cousins.  Buster had the following match results with Larry and his maternal line cousins.

  • Larry – match
  • Janice  – no match
  • Ronald  – match
  • B.J.  – match

I have redacted the e-mails and surnames below, but want to draw your attention to the individuals with the red arrows, as noted above.ADSA1 cropped v2

On the graphic below, I’m showing only the right side, so you can see the matching ICW (in common with) block patterns.  Larry is last, I’m second from last and Larry’s two cousins are the first and second red arrows.  We are all matching to my cousin, Buster.

ADSA2 cropped

You can see that all of these people match Buster.  Larry has blocks that are pink, red, fuchsia, gold, navy blue and lime green.  All of the group above, except me and two other people, one of which is my known cousin on another line, match Larry on these blocks, or at least most of these blocks.  I, however, match none of this group on none of these blocks, nor do my other known cousins who also descend through this same Moore line.  This means that this group matches Buster through Buster’s mother’s line, not through the Estes line, which means that this Moore line is not the James Moore line of Halifax County.  So the Levi Moore group of Kentucky is not descended from the James Moore group of Prince Edward and Halifax County.

Of course, I’m disappointed, but eliminating possibilities is just as important as confirming them.  I keep telling myself that anyway.

The male Moore descendant in Halifax Co., proven via Y line testing, does match with Chloa, Larry’s paternal cousin, and with Larry as well, as shown below.  Let’s see if we can discern any other people who match in a cluster, which would give us other people to contact about their Moore lines.  Keep in mind that we don’t know that the DNA in common here is from the Moore line.  It could come from another common line.  That is part of what we’d like to prove.

ADSA3

Let’s take a closer look at what this is telling us.

First, there’s a much smaller group, and this is the only chromosome where Chloa matches our Moore cousin.

So let’s look at each line.  The first person, John, doesn’t match anyone else, so he’s not in this group.

Larry and his cousin, Chloa are second and third from the bottom, and they form the match group.  You can see that they match exactly except Chloa has one brighter green segment that matches our Moore cousin in a location with no other matches.  However, the match group of navy blue, periwinkle, lime green and burgundy form a distinctive pattern.  In addition to Chloa and Larry, Virginia, and Arlina share the same segments, plus Arlina had a pink segment that Larry and Chloa don’t have.  Donald may be a cousin too, but we don’t know if Donald would also match the rest of the group.  Linda might match Donald, but doesn’t look like she matches the group, but she could.  At this point, we can drop back to Family Tree DNA and the matrix and take a look to see if these folks match each other in the way we’d expect based on the ADSA tool.

ADSA Matrix

Just like we expected, John doesn’t match anyone.  As expected, Larry, Chloa, Arlina, and Virginia all matched each other.  As it turns out, Linda does not match the rest of the group, but she does match Donald, who does match Arlina.  Therefore, our focus needs to be on contacting Arlina, Donald and Virginia and asking them about their Moore lines, or the surnames of known Moore wives, such as Rice in my James Moore line or wives surnames in Larry’s Moore line.  Just on the basis of possibility, I would also contact Linda and ask, but she is the long shot.  However, like the lottery, you can’t win if you don’t play, so just send that one extra e-mail.  You never know.  Life is made up of stories about serendipity and opportunities almost missed.

If Larry’s Moore line is the same as our Moore cousin’s line, genetically, maybe we can make headway by tracking Larry’s line.  Larry was kind enough to provide me with a website, and his Moore line begins with daughter Sarah.  Her father is Alexander Moore born in 1730 who married Elizabeth Wright.  His father was Alexander born in 1710 and who lived in Bucks Co., PA.  The younger Alexander died in Stokes Co., NC in 1803.

Moore website 1 cropped

Moore website 2

Moore website 3

Our next step is to see if this Alexander Moore line has been Y DNA tested.  Checking back at the Moore Worldwide project, this family line is not showing, but I’ve dropped a note to the administrators,  just the same.  Unfortunately, not everyone enters their most distant ancestor information which means that information is blank on the project website.

If this Alexander Moore line has been Y tested, then we already know they don’t match our group paternally.  The connection, in that case, if this genetic connection is a Moore line, could be due to a daughter birth.  If this Moore line has not been Y tested, then it means that I’ll be trying to track down a Moore descendant of one of these Alexander Moores to do the DNA test.  It would be wonderful to finally make some headway on the James Moore family.  We’ve been brick walled for such a long time.

If you descend from either of these Moore family lines, the James Moore (c 1720-c 1798) and Mary Rice line, or the Alexander Moore and Elizabeth Wright or Elizabeth Robinson line, please consider taking the Family Finder autosomal DNA test at Family Tree DNA.  If you know of a male Moore who descends from the Alexander Moore line, let’s see if he would be willing to Y DNA test.

There is a great deal of power in the combined results of descendants, as you can clearly see, thanks to Don Worth and his new Autosomal DNA Segment Analyzer tool.

Give it a test run at: http://www.DNAgedcom.com/adsa

Don wrote documentation and instructions, found here.  Please read them before downloading your files.

And Don, a big, hearty thank you for this new way to “see” our ancestors!  Thank you to Rob Warthen too for hosting this wonderful new tool!

______________________________________________________________

Disclosure

I receive a small contribution when you click on some of the links to vendors in my articles. This does NOT increase the price you pay but helps me to keep the lights on and this informational blog free for everyone. Please click on the links in the articles or to the vendors below if you are purchasing products or DNA testing.

Thank you so much.

DNA Purchases and Free Transfers

Genealogy Services

Genealogy Research

Family Tree DNA’s Family Finder Match Matrix Released

Wow, today is a great day in genetic genealogy-land.  After the conference in Houston, which ended just a month ago today, a small group met with the Family Tree DNA team and explained what we, as users, need, and why.  We walked through lots of scenarios and everyone did a lot of explaining.  The whiteboard was full.  We were hopeful.

Bennett made a commitment, publicly, at the conference, to do whatever it took.  However, I never expected this feature, the Family Finder Match Matrix, which was very high on the priority list, to make it out the door this soon.  Less than one month later.  Hats off to the Family Tree DNA team!  YOU ROCK!!!

Why is this so important?  Because you have two halves to your chromosome, and there is no magic zipper to divide Mom’s half from Dad’s half.  So you’re going to match with people who come from Mom’s side, Dad’s side, and some who just happen to match because of random recombination.  The best way to figure this out is to see which of your matches match each other as well.

So, in a nutshell, here’s how this works.

  • If your matches match you, but not your other matches as revealed in the “In Common With” feature, they are questionable matches.  To find who you match in common with one of your matches, use this crossover icon on your matches page:

ftdna 12-4

  • If your matches match you and each other, then they are very likely important genealogical matches.
  • If your matches match you and each other, and you can identify the lineage based on which of your cousins or other family members they match, you’ve got a hugely valuable piece of information.  I discussed this in yesterday’s article, Chromosome Mapping aka Ancestor Mapping.

Here’s the release today from Family Tree DNA.  And even better news, they have promised to keep us apprised on new features to come ON A WEEKLY BASIS!!!

From Family Tree DNA:

Today, we are happy to release our new BETA Family Finder – Matrix page. The Matrix tool can tell you if two or more of your matches match each other. This is most useful when you discover matches with wholly or partly overlapping DNA segments on the Family Finder – Chromosome Browser page.

Due to privacy concerns, the suggested relationship of your two matches (if related) is not revealed. However, we can tell you whether they are related according to our Family Finder program. To use it, you select up to 10 names from the Match list on the left side of the page and add them to the Selected Matches list on the right side of the page. A grid will populate below the lists. It will indicate whether there is a match (a blue check mark) or there is not a match (an empty white tile).

You access the BETA Family Finder – Matrix page through the Family Finder menu in your myFTDNA account.

matrix 1

The page starts out with two list areas: Matches and Selected Matches. You add Matches to the Selected Matches list by clicking on a name and then on the Add button.

matrix 2

Here is a screenshot of the BETA Family Finder – Matches page with a few matches added to the Selected Matches list.

matrix 3

You can change the order of names in the matrix by clicking on a name and then either the Move Up or the Move Down button.

Matrix 4

To remove someone from the Selected Matches list, click on their name and then the Remove button.

______________________________________________________________

Disclosure

I receive a small contribution when you click on some of the links to vendors in my articles. This does NOT increase the price you pay but helps me to keep the lights on and this informational blog free for everyone. Please click on the links in the articles or to the vendors below if you are purchasing products or DNA testing.

Thank you so much.

DNA Purchases and Free Transfers

Genealogy Services

Genealogy Research

Mitochondrial DNA Convergence and Matches

Every now and then, when I’m doing DNA reports, I run across the perfect example of a DNA phenomenon.  Today, it was a mitochondrial DNA mutation in motion.  Let’s take a look at what happened, how it was discovered and what it means.

mtdna convergence chart

I was contacted a few weeks ago by someone I had been working with on another project.  This woman, we’ll call her June, was concerned because both she and her maternal first cousin, Doris, had both taken mitochondrial DNA tests at Family Tree DNA and they didn’t match each other.  I took a look, of course, and sure enough, at the HVR1 level, there was one mutation difference, at location T16271C.

mtdna convergence

This was particularly interesting, because at the first cousin level, these women shared a maternal grandmother, which means that either June’s mother or Doris’s mother had had a mutation in their mitochondrial DNA, or June or Doris did.  June asked me how she could tell who had the mutation.

I asked if either June or Doris had siblings.  June had a brother, John, so she ordered a kit for John.  If John matched June, then their mother is the one who had the mutation.  If John matched Doris, then June herself had the mutation.

How do I know this, that the mutation didn’t happen in Doris or her mother?  Because the mutation is not “normal” and is listed in the RSRS values in the “extra mutations.”

Furthermore, Doris, who did not carry the extra mutation, had 13,204 matches at the HVR1 level (haplogroup H), where June who did carry the extra mutation only had 41.  Clearly to be useful, genealogically, this test would need to be expanded to the full sequence level.

So June’s brother, John, tested and he matched his sister June, telling us that their mother carried this mutation, and gave it to both of her children.  So the mutation occurred between June’s mother and June’s grandmother.

Are These Matches Valid?

June asked me if her matches were valid.

That’s a tough question to answer, because convergence has occurred.

So let me answer this in two ways.

The matches are technically accurate.  This means that indeed she matches all 41 of the people that the matching routine shows as her exact HVR1 matches.  So in that way, those matches are accurate, but they aren’t valid or meaningful for genealogy.

They aren’t useful, because we know, beyond a doubt that these matches are not related to her in a very long time, probably back into prehistory, because the reason she matches them at the HVR1 level is because she just happened to have the same mutation that all 41 of them carry.  Carrying the same mutation does NOT absolutely mean you share a common ancestor who carried that mutation.  Mutations can occur at any time, and if a mutation happens at this location in the mitochondrial DNA, there is a 1 in 3 chance the person who has the mutation will have the same value as you, since there are only 4 choices, T, A, C, and G, to begin with.  This is what we call convergence, and you’ve just seen it happen.  People match each other, but because they happened to have the same spontaneous mutation, not because they share a common ancestor who had that mutation.  Most of the time, we don’t know whether we are looking at real matches or matches by convergence, but this time, we know for sure, because we can prove that June’s grandmother did not have the mutation, because June’s first cousin, Doris, does not.

So, if June’s HVR1 results aren’t useful to her, whose are?  That’s easy, her cousin Doris’s results are representative of the mitochondrial DNA of their mutual grandmother, so Doris’s matches are actually June and John’s ancestral matches as well.

Could There Be A Fly in the Ointment?

Not matching someone you thought you should match is unsettling.  Could we test someone else to be absolutely positive we’re not dealing with a back mutation?

Certainly, if grandmother had another female child who had children, or if grandmother has a living male child, they can be tested too.  The test on the third child would positively confirm grandmother’s mitochondrial DNA values.

Could we prove positively that the first cousins are actually first cousins, to remove any nagging doubt?

Certainly, using the Family Finder test.

______________________________________________________________

Disclosure

I receive a small contribution when you click on some of the links to vendors in my articles. This does NOT increase the price you pay but helps me to keep the lights on and this informational blog free for everyone. Please click on the links in the articles or to the vendors below if you are purchasing products or DNA testing.

Thank you so much.

DNA Purchases and Free Transfers

Genealogy Services

Genealogy Research

Kitty Cooper’s Chromsome Mapping Tool Released

I haven’t had time to try this yet, but I can hardly wait.  Kitty Cooper’s chromosome mapping tool enables those who have taken one of the autosomal tests from Family Tree DNA or 23andMe and downloaded matches to map the segments that you know are associated with certain ancestral lines on your chromosomes with a color key.

The genetic genealogy community has been anxiously waiting for this tool.  You can find it here:  http://kittymunson.com/dna/ChromosomeMapper.php

Until now, we were relegated to keeping this kind of information on a spreadsheet.  I covered how to do this in my blog on Autosomal Triangulation and also in one of the Autosomal Me segments.

vannoy table 1

But thanks to Kitty, we can take the information above and make it look like the example below from Kitty’s blog.

kitty's chromosome mapping

We can’t think you enough Kitty!!!  Way to go!  Woohoo!

______________________________________________________________

Disclosure

I receive a small contribution when you click on some of the links to vendors in my articles. This does NOT increase the price you pay but helps me to keep the lights on and this informational blog free for everyone. Please click on the links in the articles or to the vendors below if you are purchasing products or DNA testing.

Thank you so much.

DNA Purchases and Free Transfers

Genealogy Services

Genealogy Research

The Autosomal Me Summary and Links

“The Autosomal Me” is a 9 part series published between February 6, 2013 and May 31, 2013.  They are a bit dated now, but the concepts are still rock solid.

Here are all of the links in one place.

Part 1 was “The Autosomal Me – Unraveling Minority Admixture” and Part 2 was “The Autosomal Me – The Ancestors Speak.”  Part 1 discussed the technique we are going to use to unravel minority ancestry, and why it works.  Part two gave an example of the power of fragmented chromosomal mapping and the beauty of the results.

Part 3, “The Autosomal Me – Who Am I?,” reviewed using our pedigree charts to gauge expected results and how autosomal results are put into population buckets.

Part 4, “The Autosomal Me – Testing Company Results,” shows what to expect from all of the major testing companies, past and present, along with Dr. Doug McDonald’s analysis.

In Part 5, “The Autosomal Me – Rooting Around in the Weeds Using Third Party Tools,” we looked at 5 different third party tools and what they can tell us about our minority admixture that is not reported by the major testing companies because the segments are too small and fragmented.

In Part 6, “The Autosomal Me – DNA Analysis – Splitting Up” we began the analysis part of the data we’ve been gathering.   We looked at how to determine whether minority admixture on specific chromosomes came from which parent.

Part 7, “The Autosomal Me – Start, Stop, Go – Identifying Native Chromosomal Segments” took a deeper dive and focused on the two chromosomes with proven Native heritage and began by comparing those chromosome segments using the 4 GedMatch admixture tools.

Part 8, “The Autosomal Me – Extracting Data Segments and Clustering,” we  extract all of the Native and Blended Asian segments in all 22 chromosomes, but only used chromosomes 1 and 2 for illustration purposes.  We then clustered the resulting data to look for trends, grouping clusters by either the Strong Native criteria or the Blended Asian criteria.

The final segment, Part 9, “The Autosomal Me – The Holy Grail – Identifying Native Genealogy Lines,” utilized all of the chromosomal information we’ve gathered in the earlier steps.  We apply that information to our matches and determine which of our lines are the most likely to have Native Ancestry.  This, of course, fulfills the goal of using DNA information to identify small amounts of minority admixture.

In summary, this series has been quite interesting and indeed, it did achieve the goals initially set forth.  However, it was very manually intensive and took far longer than anticipated, partly due to circumstances beyond my control, like software updates and vendor changes.  A second reason that it took longer than expected was due to the sheer amount of work involved in the various steps, particularly steps 8 and 9.  In addition, because Minority Admixture Mapping (MAP) is developmental, I had to try several different approaches to determine which one, or ones, worked best.  Despite the immense amount of work, I would describe this approach certainly as useful and successful.  In fact, I don’t know how else I would have ever eliminated some genealogical lines as candidates for Native heritage and focused on others without the combination of MAP’s new techniques combined with both old and new tools provided by others.

Having said that, I would suggest that this technique, because of the intensive manual effort required, is only for the very committed genetic genealogist – the warrior, so to speak.  It also will not work well with only a few matches.  I would suggest that you would need at least 200 or 300 matches, preferably more, which is typical of someone with colonial American heritage.  If that is you, and you are desperate to find your minority admixed lines….then this type of project may be for you.  Please thoroughly read all 9 articles before beginning.

Many of the techniques in the various steps can be utilized individually, without completing the entire MAP process.  For example, comparing vendor and third party results, using the GedMatch admixture tools and the chromosome comparisons for percentages of ethnicity all provide useful information in their own right, outside of the full MAP process.

Bon voyage on your journey of discovery to find “The Autosomal You”!  Your ancestors are the pot of gold at the end of that rainbow.

______________________________________________________________

Disclosure

I receive a small contribution when you click on some of the links to vendors in my articles. This does NOT increase the price you pay but helps me to keep the lights on and this informational blog free for everyone. Please click on the links in the articles or to the vendors below if you are purchasing products or DNA testing.

Thank you so much.

DNA Purchases and Free Transfers

Genealogy Services

Genealogy Research

The Autosomal Me – The Holy Grail – Identifying Native Genealogy Lines

holy grail

Sangreal – the Holy Grail.  We are finally here, Part 9 and the final article in our series.  The entire purpose of The Autosomal Me series has been to use our DNA and the clues it holds to identify minority admixture, in this case, Native American, and by identifying those Native segments, and building chromosomal clusters, to identify the family lines that contributed that Native admixture.  Articles 1-8 in the series set the stage, explained the process and walked us through the preparatory steps.  In this last article, we apply all of the ingredients, fasten the lid, shake and see what we come up with.  Let’s take a minute and look at the steps that got us to this point.

Part 1 was “The Autosomal Me – Unraveling Minority Admixture” and Part 2 was “The Autosomal Me – The Ancestors Speak.”  Part 1 discussed the technique we are going to use to unravel minority ancestry, and why it works.  Part two gave an example of the power of fragmented chromosomal mapping and the beauty of the results.

Part 3, “The Autosomal Me – Who Am I?,” reviewed using our pedigree charts to gauge expected results and how autosomal results are put into population buckets.

Part 4, “The Autosomal Me – Testing Company Results,” shows what to expect from all of the major testing companies, past and present, along with Dr. Doug McDonald’s analysis.

In Part 5, “The Autosomal Me – Rooting Around in the Weeds Using Third Party Tools,” we looked at 5 different third party tools and what they can tell us about our minority admixture that is not reported by the major testing companies because the segments are too small and fragmented.

In Part 6, “The Autosomal Me – DNA Analysis – Splitting Up” we began the analysis part of the data we’ve been gathering.   We looked at how to determine whether minority admixture on specific chromosomes came from which parent.

Part 7, “The Autosomal Me – Start, Stop, Go – Identifying Native Chromosomal Segments” took a deeper dive and focused on the two chromosomes with proven Native heritage and began by comparing those chromosome segments using the 4 GedMatch admixture tools.

Part 8, “The Autosomal Me – Extracting Data Segments and Clustering,” we  extract all of the Native and Blended Asian segments in all 22 chromosomes, but only used chromosomes 1 and 2 for illustration purposes.  We then clustered the resulting data to look for trends, grouping clusters by either the Strong Native criteria or the Blended Asian criteria.

In this final segment, Part 9, we will be applying the chromosomal information we’ve gathered to our matches and determine which of our lines are the most likely to have Native Ancestry.  This, of course, has been the goal all along.  So, drum roll…..here we go.

In Part 8, we ended by entering the start and stop locations of both Strong Native and Blended Asian clusters into a table to facilitate easy data entry into the chromosome match spreadsheet downloaded from either 23andMe or Family Tree DNA.  If you downloaded it previously, you might want to download it again if you haven’t modified it, or download new matches since you last downloaded the spreadsheet and add them to the master copy.

My goal is to determine which matches and clusters indicate Native ancestry, and how to correlate those matches to lineage.  In other words, which family lines in my family were Native or carry Native heritage someplace.

The good news is that my mother’s line has proven Native heritage, so we can use her line as proof of concept.  My father’s family has so many unidentified wives, marginalized families and family secrets that the Native line could be almost any of them, or all of them!  Let’s see how that tree shakes out.

Finding Matches

So let’s look at a quick example of how this would work.  Let’s say I have a match, John, on chromosome 4 in an area where my mother has no Native admixture, but I do.  Therefore, since John does not match my mother, then the match came from my father and if we can identify other people who also match both John and I in that same region on that chromosome, they too have Native ancestry.  Let’s say that we all also share a common ancestor.  It stands to reason at that point, that the common ancestor between us indicates the Native line, because we all match on the Native segment and have the same ancestor.  Obviously, this would help immensely in identifying Native families and at least giving pointers in which direction to look.  This is a “best case’ example.  Some situations, especially where both parents contribute Native heritage to the same chromosome, won’t be this straightforward.

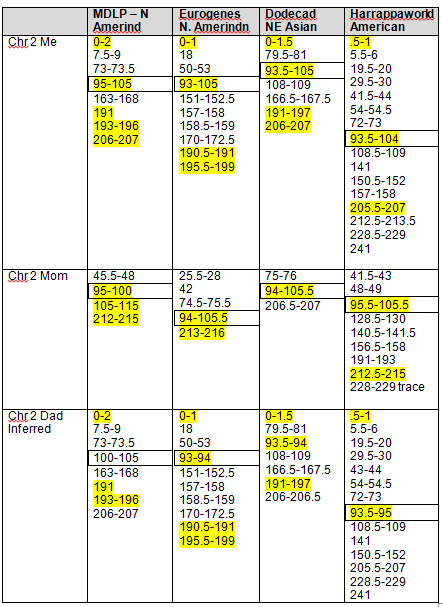
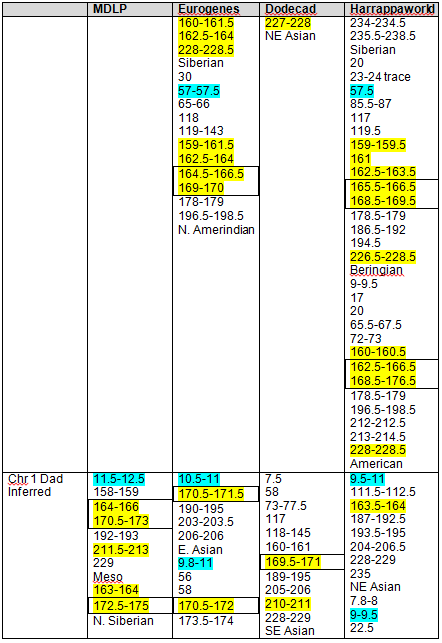
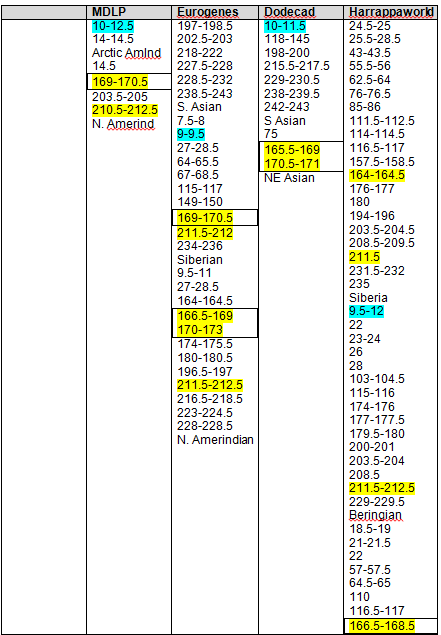
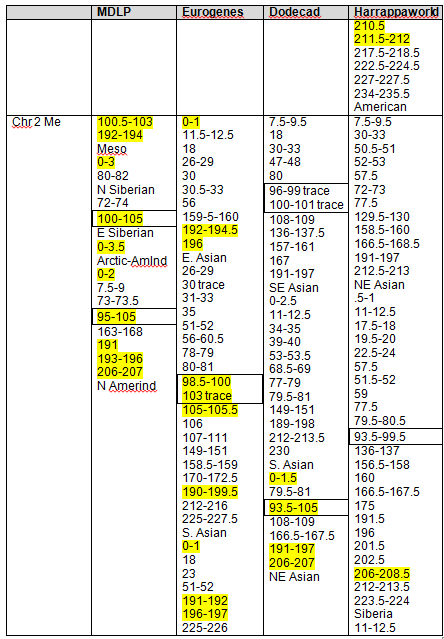
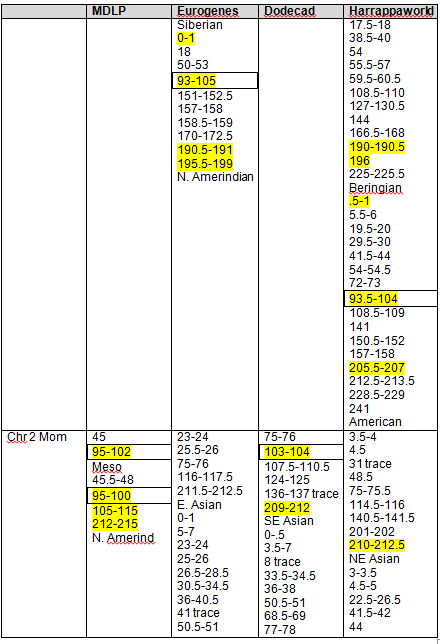
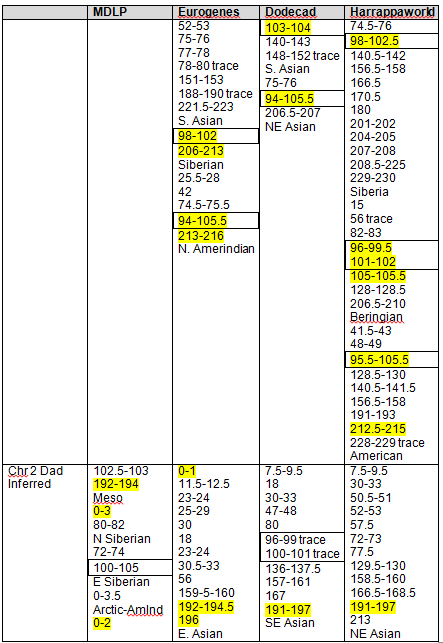
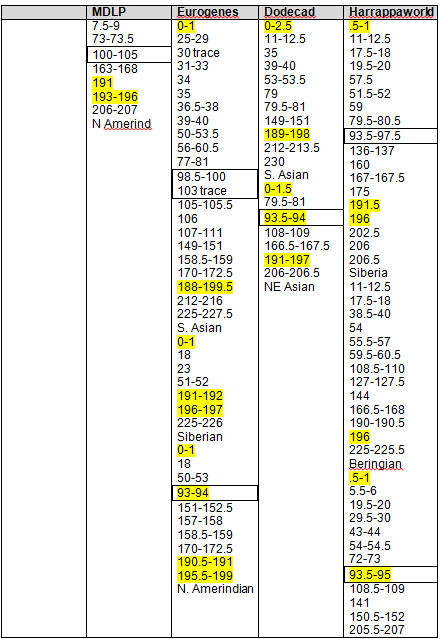
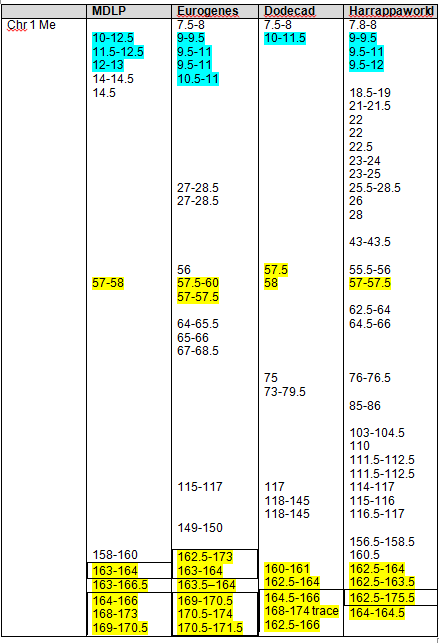
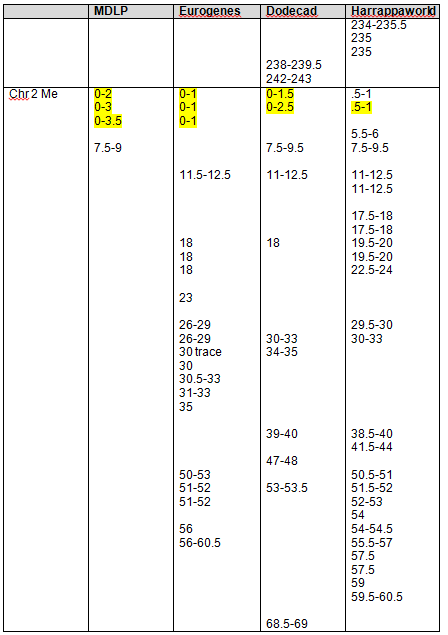
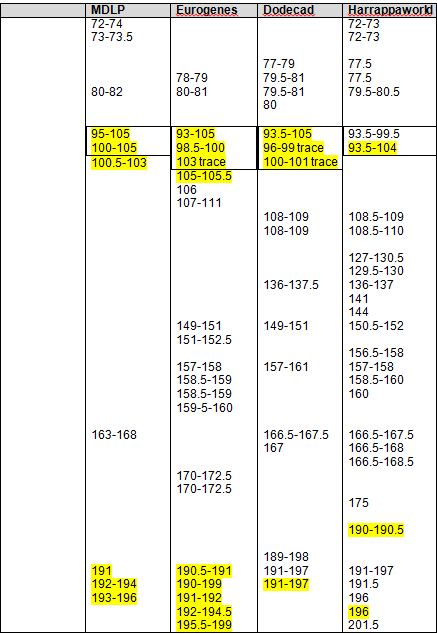
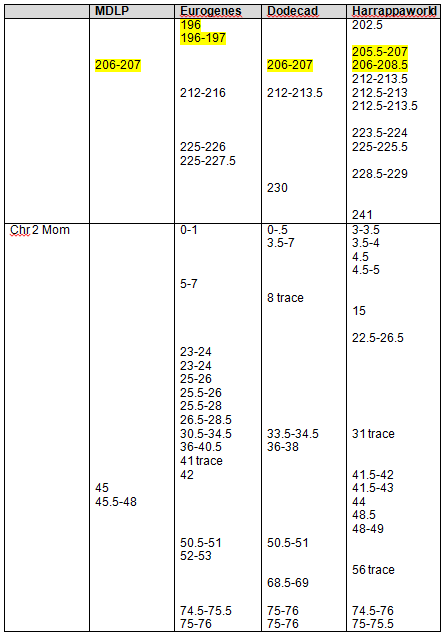
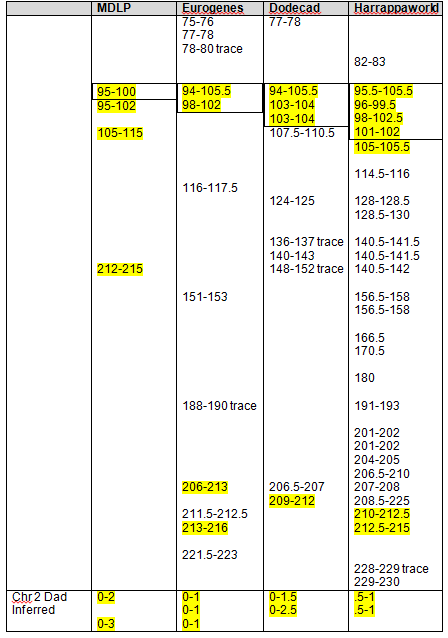
Based on our findings, the maximum range and minimum (least common denominator or “In Common” range is as follows for the strongest Native segments on chromosomes 1 and 2.

  Chromosome 1 Chromosome 2
Largest   Range 162,500,000   – 180,000,000 79,000,000   – 105,000,000
Smallest   Range 165,658,091   – 171,000,000 90,000,000   – 103,145,425
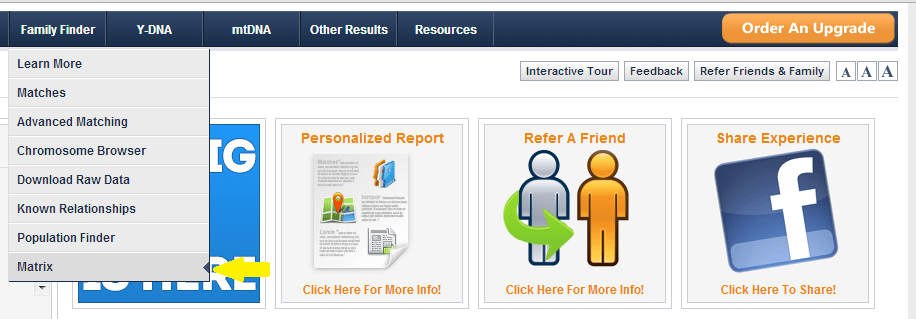
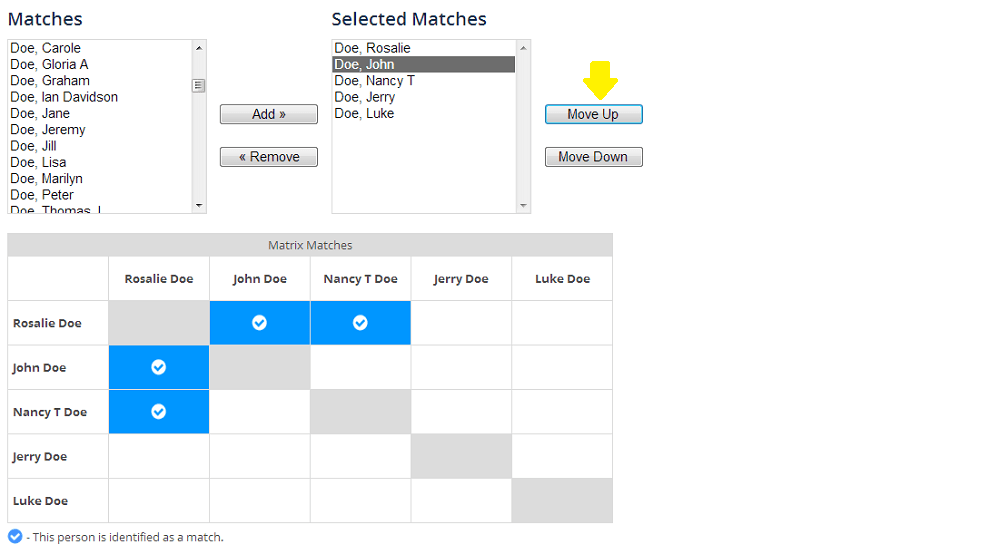
At GedMatch

At GedMatch, I used a comparison tool to see who matched me on chromosome 1.  Only 2 people outside of immediate family members matched, and both from Family Tree DNA.  Both matched me on the critical Native segments between about 165-180mg.  I was excited.  I went to Family Tree DNA and checked to see if these two people also matched my mother, which would confirm the Native connection, but neither did, indicating of course that these two people matched me on my father’s side.  That too is valuable information, but it didn’t help identify any common Native heritage with my mother on chromosome 1.  It did, however, eliminate them as possibilities which is valuable information as well.

DNAGedcom

I used a new tool, DNAGedcom, compliments of Rob Warthen who has created a website, DNA Tools, at www.dnagedcom.com.  This wonderful tool allows you to download all of your autosomal matches at Family Tree DNA and 23andMe along with their chromosomal segment matches.  Since my mother’s DNA has only been tested at Family Tree DNA, I’m limiting the download to those results for now, because what I need is to find the people who match both she and I on the critical segments of chromosome 1 or 2.

Working with the Download Spreadsheet

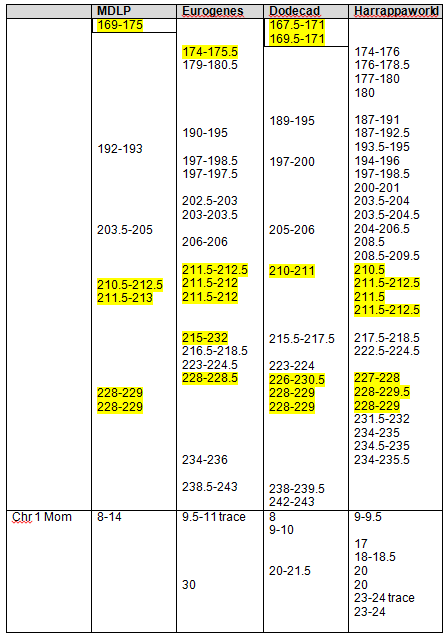
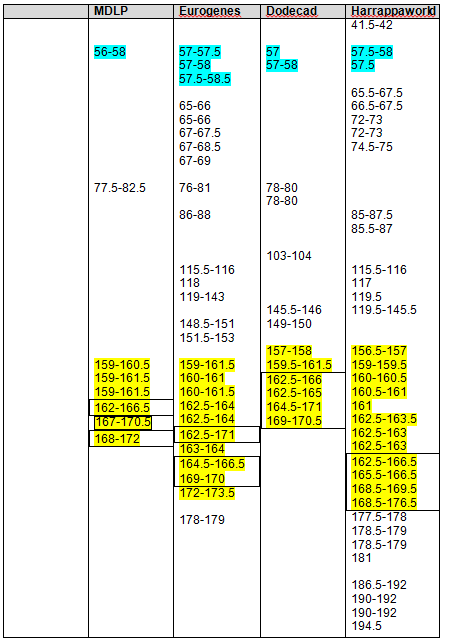
It was disappointing to discover that my mother and I had no common matches that fell into this range on chromosome 1, but chromosome 2 was another matter.  Please note that I have redacted match surnames for privacy.

step 9 table 1

The spreadsheet above shows the comparison of my matches (pink) and Mother’s (white).  The Native segment of chromosome 2 where I match Mother is shaded mustard.  I shaded the chromosome segments that fell into the “common match” range in green.  Of those matches, there is only one person who matches both Mother and I, Emma.  The next step, of course, is to contact Emma and see if we can discover our common ancestor, because whoever it is, that is the Native line.  As you might imagine, I am chomping at the bit.

There are no segments of chromosome 2 that are unquestionably isolated to my father’s line.

Kicking it up a Notch

Are you wondering about now how something that started out looking so simple got so complex?  Well, I am too, you’re not alone.  But we’ve come this far, so let’s go that final leg in this journey.  My mom always used to say there was no point in doing something at all if you weren’t going to do it right.  Sigh….OK Mom.

The easiest way to facilitate a chromosome by chromosome comparison with all of your matches and your Strong Native and Blended Asian segments is to enter all of these segment groups into the match spreadsheet.  If you’re groaning and your eyes glaze over right after you do one big ole eye roll, I understand.

But let’s take a look at how this helps us.

On the excerpt from my spreadsheet below, for a segment of chromosome 5, I have labeled the people and how they match to me.  The ones labeled “Mom” in the last column are labeled that way because these people match both Mom and I.  The ones labeled “Dad” are labeled that way because I know that person is related on my father’s side.

Using the information from the tables created in Step 8, I entered the beginning and end of all matching segment clusters into my spreadsheet.  You can see these entries on lines 7, 8, 22, 23 and 24.  You then proceed to colorize your matches based on the entry for either Mom or Dad – in other words the blue row or the purple row, line 7, 22 or 24.  In this example, actually, line 5 Rex, based on the coloration, should have been half blue and half purple, but we’ll discuss his case in a minute.

The you can then sort either by match name or by chromosome to view data in both ways.  Let’s look at an example of how this works.

Legend:

  • White Rows:  Mother’s matches.  When Mother and I both match an individual, you’ll see the same matches for me in pink.  This double match indicates that the match is to Mother’s side and not Father’s side.
  • Pink Rows:  My matches.
  • Purple “Mom” labels in last column:  The individual matches both me and Mom.  This is a genetic match.
  • Teal “Dad” labels in last column: Genealogically proven to be from my father’s side.  This is a genealogical, not a genetic label, since I don’t have Dad’s DNA and can only infer these genetically when they don’t also match Mother.
  • Dark Pink Rows labeled “Me Amerind Only” are Strong Native or Blended Asian segments from Chromosome Table that I have entered.  My segments must come from one of my parents, so I’ve either colored them purple, if the match is someone who matches Mother and I both, or teal, if they don’t match both Mom and I, so by inference they come from my father’s line.
  • Dark Purple Rows labeled “Mom Amerind Only” are Mom’s segments from the Chromosome Table.
  • Dark Teal Rows labeled “Dad Amerind Only” are inferred segments belonging to my father based on the fact that Mother and I don’t share them.

Inferred Relationships

This is a good place to talk for just a minute about inferred relationships in this context.  Inference gets somewhat tenuous or weak.  The inferred matches on my father’s side began with the Native segments in the admix tools.  Some inferences are very strong, where Mother has no Native at all in that region.  For example, Mom has European and I have Native American.  No question, this had to come from my father.  But other cases are much less straightforward.

In many cases, categorization may be the issue.  Mom has West Asian for example and I have Siberian or Beringian.  Is this a categorization issue or is this a real genetic difference, meaning that my Siberian/Beringian is actually Native and came from my father’s side?

Other cases of confusion arise from segment misreads, etc.  I’ve actually intentionally included a situation like this below, so we can discuss it.  Like all things, some amount of common sense has to enter the picture, and known relationships will also weigh heavily in the equation.  How known family members match on other chromosome segments is important too.  Do you see a pattern or is this match a one-time occurrence?  Patterns are important.

Keep in mind that these entries only reflect STRONG Asian or Native signals, not all signals.  So even if Mother doesn’t have a strong signal, it doesn’t mean that she doesn’t have ANY signal in that region.  In some cases, start and stop segments for Mom and Dad overlapped due to very long segments on some matches.  In this case, we have to rely on the fact that we do have Mother’s actual DNA and assume that if they aren’t also a match to Mother, that what we are seeing is actually Dad’s lines, although this may not in actuality always be true.  Why?  Because we are dealing with segments below the matching threshold limit at both Family Tree DNA and 23andMe, and both of my parents carry Native heritage.  We can also have crossed a transitional boundary where the DNA that is being matched switches from Mom’s side to Dad’s side.

Ugh, you say, now that’s getting messy.  Yes, it is, and it has complicated this process immensely.

The Nitty-Gritty Data Itself

step 9 table 2

Taking a look at this portion of chromosome 5, we have lots going on in this cluster.  Most segments will just be boring pink and white (meaning no Native), but this segment is very busy.  Mom and I match on a small segment from 52,000,000 to 53,000,000.  Indeed, this is a very short segment when compared to the entire chromosome, but it is strongly Native.  We both also match Rex, our known cousin.  I’ve noted him with yellow in the table. Please note that Mom’s white matches are never shaded.  I am focused on determining where my own segments originate, so coloring Mother’s too was only confusing.  Yes, I did try it.

You can see that Mother actually shares all or any part of her segment with only me and Rex.  This simplifies matters, actually.  However, also note that I carry a larger segment in this region than does Mother, so either we have a categorization issue, a misread, or my father also contributed.  So, a conundrum.  This very probably implies that my father also carried Native DNA in this region.

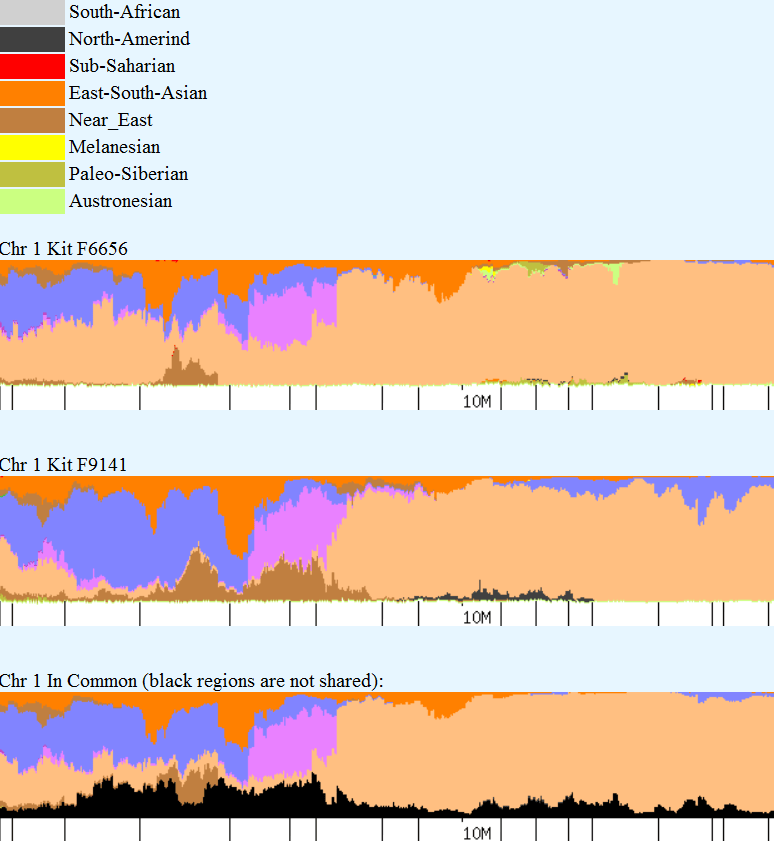
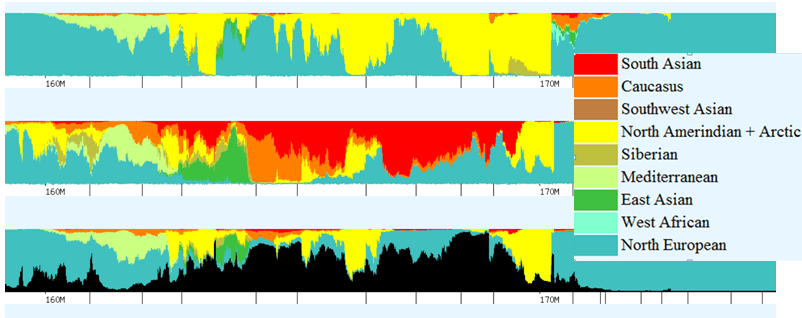
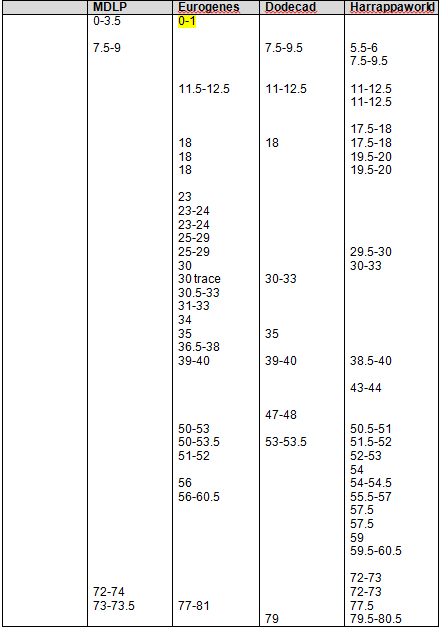
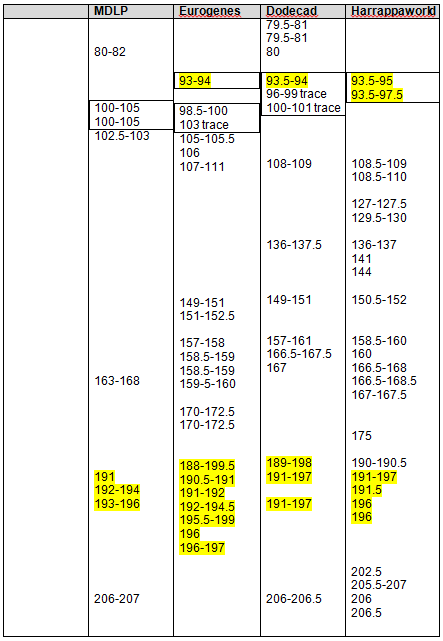
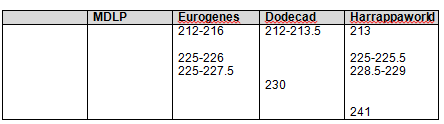
Let’s see what Rex’s DNA looks like on this same segment of chromosome 5, from 52-53 using Eurogenes.  In the graph below, my chromosome is the top bar, Rex’s the middle and the bottom bar shows common DNA with the black nonmatching.  Yellow is Native American, red is South Asian, putty is Siberian, lime green is Mediterranean, teal is North Europe, orange is Caucus.

Step 9 item 3

This same comparison is shown to Mother’s DNA (top row) below.

step 9 item 4

It’s interesting that while Mother doesn’t have a lot of yellow (Native), she does have it throughout the same segment where Rex’s occurs, from about 52 through 53.5.

Does this actually point to a Native ancestor in the common line between Rex, Mom and I, which is the Swiss/German Johann Michael Miller line which does include an unidentified wife stateside, or does this simply indicate a common ancient population long ago in Asia?  It’s hard to say and is deserving of more research.  I feel that it is most likely Native because of the actual yellow, Native segment. If this was an Asian/European artifact, it would be much less likely to carry the actual yellow segment.

Is Rex also genealogically related to my father?  As I’ve worked through this process with all of my chromosomes and matches, I’ve really come to question if one of my father’s dead ends is also an ancestral line of my mother’s.

The key to making sense of these results is clusters.

Clusters vs Singleton Outliers

The work we’ve already done, especially in Step 8, clusters the actual DNA matching segments.  We’ve now entered that information into the spreadsheet and colored the segments of those who match.  What’s next?

The key is to look for people with clusters.  Many matches will have one segment, of say, 10 that match, colored.  Unless this is part of a large chromosome cluster, it’s probably simply an outlier.  Part of a large chromosome cluster would be like the large Strong Native segments on chromosome 1 or 2, for example.  How do we tell if this is a valid match or just an outlier?

Sort the spreadsheet by match name.  Take a look at all of the segments.

The example we’ll use is that of my cousin, Rex.  If you recall, he matches both me and Mother, is a known first cousin twice removed to me, (genetically equal to a second cousin), and is descended from the Miller line.

In this example, I also colored Mother’s segments because I wanted to see which segments that I did not receive from her were also Native. You can see that there are many segments where we all match and several of those are Native.  These also match to other Miller descendants as well, so are strongly indicative of a Native connection someplace in our common line.

If we were only to see one Native segment, we would simply disregard this as an outlier situation.  But that’s not the case.  We see a cluster of matches on various segments, we match other cousins from the same line on these segments, and reverting back to the original comparison admixture tools verifies these matches are Native for Rex, Mom and me.

step 9 item 5

Hmmmm…..what is Dad’s blue segment color doing in there?  Remember I said that we are only dealing with strong match segments?  Well, Mom didn’t have a strong segment at that location and so we inferred that Dad did.  But we know positively that this match does come from Mother’s side.  I also mentioned that I’ve come to wonder if my Mom and Dad share a common line.  It’s the Miller line that’s in question.  One of Johann Michael Miller’s children, Lodowick, moved from Pennsylvania to Augusta County, Virginia in the 1700s and his line became Appalachian, winding up in many of the same counties as my father’s family.  I’m going to treat this as simply an anomaly for now, but it actually could be, in this case, an small indication that these lines might be related.  It also might be a weak “Mom” match, or irrelevant.  I see other “double entries” like this in other Miller cousins as well.

What is the pink row on chromosome 12?  When I grouped the Strong Native and Asian Clusters, sometimes I had a strong grouping, and Mom had some.  The way I determined Dad’s inferred share was to subtract what Mom had in those segments from mine.  In a few cases, Mom didn’t have enough segments to be considered a cluster but she had enough to prevent Dad from being considered a cluster either, so those are simply pink, me with no segment coloring for Mom or Dad.

Let’s say I carry Strong Native/Mixed Asian at the following 8 locations:

10, 12, 14, 16, 18, 20, 22, 24

This meets the criteria for 8 of 15 ethno-geographic locations (in the admix tools) within a 2.5 cM distance of each other, so this cluster would be included in the Mixed Asian for me.  It could also be a Strong Native cluster if it was found in 3 of 4 individual tools.  Regardless of how, it has been included.

Let’s now say that Mom carries Native/Mixed Asian at 10, 12 and 14, but not elsewhere in this cluster.

Mom’s 3 does not qualify her for the 8/15 and it only leaves Dad with 5 inferred segments, which disqualifies him too.  So in this case, my cluster would be listed, but not attributable directly to either parent.

What this really says is that both of my parents carry some Native/Blended Asian on this segment and we have to use other tools to extrapolate anything further.  The logic steps are the same as for Dad’s blue segment.  We’re going to treat that as an outlier.  If I really need to know, I can go back to the actual admixture tools and see whether Mom or Dad really match me strongly on which segments and how we compare to Rex as well.  In this case, it’s obvious that this is a match to my Mother’s side, so I’m leaving well enough alone.

Let’s see what the matches reveal.

Matches

Referring back to the Nitty Gritty Data spreadsheet, Mom’s match to Phyllis on row 15 confirms an Acadian line.  This is the known line of Mother’s Native ancestry.  This makes sense and they match on Native segments on several other chromosomes as well.  In fact, many of my and Mother’s matches have Acadian ancestry.

My match to row 19, Joy, is a known cousin on my father’s side with common Campbell ancestry.  This line is short however, because our common ancestor, believed to be Charles Campbell died before 1825 in Hawkins County, TN.  He was probably born before 1750, given that his sons were born about 1770 and 1772.  Joy and I descend from those 2 sons.  Charles wife and parents are unknown, as is his wife.

My match to row 20, inferred through my father’s side, is to a Sizemore, a line with genetically proven Native ancestry.  Of course, this needs more research, but it may be a large hint.  I also match with several other people who carry Sizemore ancestors.  This line appears to have originated near the NC/VA border.

I wanted to mention rows 4 and 17.  Using our rules for the spreadsheet, if I match someone and they don’t also match Mother on this segment, I have inferred them to be through my father.  These are two instances that this is probably incorrect.  I do match these people through Mother, but Mother didn’t carry a strong signal on this segment, so it automatically became inferred to Dad.  Remember, I’m only recording the Strong Native or the Blended Asian segments, not all segments.  However, I left the inferred teal so that you can see what kinds of judgment calls you’ll have to make.  This also illustrates that while Mom’s genetic matches are solid, Dad’s inferred matches are less so and sometimes require interpretation.  The proper thing to do in this instance would be to refer back to the original admixture tools themselves for clarification.

Let’s see what that shows.

step 9 item 6

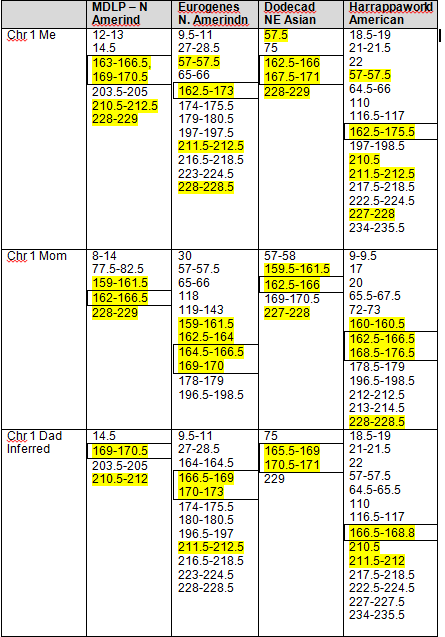
Using HarrappaWorld, the most pronounced segment is at about 52.  Teal is American.  You can see that Mother has only a very small trace between 53 and 54, almost negligible.  Mother’s admixture at location 52 is two segments of purple, brown and cinnamon which translate to Southwest Asian (lt purple), Mediterranean (dk purple), Caucasian (brown) and Balock (cinnamon), from Pakistan.

Checking Dodecad shows pretty much the same thing, except Mother’s background there is South Asian, which could be the same thing as Caucus and Pakistan, just different categorizations.

In this case, it looks like the admixture is not a categorization issue, but likely did come from my father.  Each segment will really be a case by case call, with only the strongest segments across all tools being the most reliable.

It’s times like this that we have to remember that we have two halves of each chromosome and they carry vastly different information from each of our parents.  Determining which is which is not always easy.  If in doubt, disregard that segment.

Raw Numbers

So, what, really did I figure out after all of this?

First, let’s look at some numbers.

I was working with a total of 292 people who had at least one chromosomal segment that matched me with a Strong Native or Blended Asian segment.  Of those, 59 also matched Mom’s DNA.  Of those, 18 had segments that matched only Mom.  This means that some of them had segments that also matched my father.  Keep in mind, again, that we are only using “strong matches” which involves inferring Dad’s segments and that referring back to the original tools can always clarify the situation.  There seems to be some specific areas that are hotspots for Native ancestry where it appears that both of my parents passed Native ancestry to me.

Many of my and my mother’s 59 matches have Acadian ancestry which is not surprising as the Acadians intermarried heavily with the Native population as well as within their own ethnic group.

Several also have Miller Ancestry.  My Miller ancestor is Johann Michael Miller (1692-1771) who immigrated in the colonial period and settled on the Pennsylvania frontier.  His son, Philip Jacob Miller’s (1726-1799) wife was a woman named Magdalena whose last name has been rumored for years to be Rochette, but no trace of a Rochette family has ever been found in the county where they lived, region or Brethren church history…and it’s not for lack of looking.  Several matches point to Native Ancestry in this line.  This also begs the question of whether this is really Native or whether it is really the Asian heritage of the German people.  Further analysis, referring back to the admixture tools, suggests that this is actually Native. It’s also interesting that absolutely none of Mother’s other German or Dutch lines show this type of ancestry.

There is no suggestion of Native ancestry in any of her other lines.  Mother’s results are relatively clean.  Dad’s are anything but.

Dad’s Messy Matches

My father’s side of the family, however, is another story.

I have 233 matches that don’t also match my mother.  There can be some technical issues related to no-calls and such, but by and large, those would not represent many.  So we need to accept that most of my matches are from my Father’s side originating in colonial America.  This line is much “messier” than my mother’s, genealogically speaking.

Of those 233 matches, only 25 can be definitely assigned to my father.  By definitely assigned, I mean the people are my cousins or there is an absolutely solid genealogical match, not a distant match.  Why am I not counting distant matches in this total?  We all know by virtue of the AncestryDNA saga that just because we match family lines and DNA does NOT mean that the DNA match is the genealogical line we think it is.  If you would like to read all about this, please refer to the details in CeCe Moore’s blog where she discussed this phenomenon.  The relevant discussion begins just after the third photo in this article where she shows that 3 of 10 matches at Ancestry where they “identify” the common DNA ancestor are incorrect.  Of course, they never SAY that the common ancestor is the DNA match, but it’s surely inferred by the DNA match and the “leaf” connecting these 2 people to a common ancestor.  It’s only evident to someone who has tested at least one parent and is savvy enough to realize that the individual whose ancestor on Mom’s side that they have highlighted, isn’t a match to Mom too.  Oops.  Mega-oops!!!

However, because we are dealing in our project, on Dad’s side, with inferences, we’re treading on some of the same ground.  Also, because we are dealing with only “strong clustered” segments, not all Native or Asian segments and because it appears that my parents both have Native ancestry.  To make matters worse, they may both have Algonquian, Iroquoian or both.

I have also discovered during this process that several of my matches are actually related to both of my parents.  I told you this got complex.

Of the people who don’t match Mother, 32 of them have chromosomal matches only to my father, so those would be considered reliable matches, as would the closest ones of the 25 that can be identified genealogically as matching Dad.  Many of these 25 are cousins I specifically asked to test, and those people’s results have been indispensable in this process.

In fact, it’s through my close circle of cousins that we have been able to eliminate several lines as having Native ancestry, because it doesn’t’ show as strong and they don’t have it either.

Many of these lines group together when looking at a specific chromosome.  There is line after line and cousin after cousin with highlighted data.

Dad’s Native Ancestors

So what has this told me?  This information strongly suggests that the following lines on my father’s side carry Native heritage.  Note the word “carry.”  All we can say at this point is that it’s in the soup – and we can utilize current matches at our testing company and at GedMatch, genealogy research and future matches to further narrow the branches of the tree.  Many of these families are intermarried and I have tried to group them by marriage group.  Obviously, eventually, their descendants all intermarried because they are all my ancestors on my father’s side.  But multiple matches to other people who carry the Native markers but aren’t related to my other lines are what define these as lines carrying Native heritage someplace.

  • Campbell – Hawkins County, Tn around 1800, missing wife and parents, married into the Dodson family
  • Dodson – Hawkins County, Tn, Virginia – written record of Lazarus Dodson camping with the Cherokee – missing wife, married into the Campbell and Estes family
  • Claxton/Clarkson – Russell Co., Va, Claiborne and Hancock Co., Tn – In NC associated with the known Native Hatcher family.  Possibly a son-in-law.  Missing family entirely.
  • Cook – Russell Co., Va. – daughter married Claxton/Clarkson – missing wives
  • Harrold, Harrell, Herrell – Hancock Co., Tn., Wilkes Co., NC – missing wives
  • McDowell – Hancock Co. Tn, Wilkes Co., NC, Augusta Co., Va – married into the Harrell family, missing wife
  • McNeil, McNiel – Wilkes Co., NC – missing wives, married into the Vannoy family
  • Vannoy – Wilkes County – some wives unaccounted for pre-1800
  • Crumley – Greene County, Tn., Lee Co., Va. – oral history of Native wife, married into the Vannoy family
  • Brown – Greene County, Tn, Montgomery Co., Va – married into the Crumley family, missing wives

While this looks like a long list, the list of families that don’t have any Native ancestry represented is much longer and effectively serves to eliminate all of those lines.  While I don’t have “THE” answer, I certainly know where to focus my research.  Maybe there isn’t the one answer.  Maybe there are multiple answers, in multiple lines.

The Take Away

Is this complex?  Yes!  Is it a lot of work?  You bet it is!  Is everything cast in concrete?  Never!  You can see that by the differences we’ve found in data interpretation, not to mention issues like no-calls (areas that for some reason in the test don’t read) and cross overs where your inheritance switches from your mom’s side to your dad’s side.  Is there any other way to do this?  No, not if your minority admixture is down in that weedy area around 1%.

Is it worth it?  You’ll have to decide.  It guess it depends on how desperately you want to know.

Part of the reason this is difficult is because we are missing tools in critical locations.  It’s an intensively laborious manual process.  In essence, using various tools, one has to figure out the locations of the Native and Asian chromosome segments and then use that information to infer Native matches by a double match (genetic match at DNA company plus match with Strong Native/Blended Asian segment) with the right parent.  It becomes even more complex if neither parent is available for testing, but it is doable although I would think the reliability could drop dramatically.

Tidbits and Trivia

I’ve picked up a number of little interesting tidbits during this process.  These may or may not be helpful to you.  Just kind of file them away until needed:)

  • Matches at testing companies come and go….and sometimes just go.  At Family Tree DNA, I have some matches that must be trembling on the threshold that come and go periodically.  Now you see them, now you don’t.  I lost matches moving from the Affy chip to the Illumina chip and lost additional matches between Build 36 and 37.  Some reappeared, some haven’t.
  • The start and stop boundaries changed for some matches between build 36 and build 37.  I did not go back and readjust, as most of these, in the larger scheme of things, were minor.  Just understand that you are looking for  patterns here that indicate Native heritage, not exact measurements.  This process is a tool, and unfortunately, not a magic wand:)
  • The centromere locations change between builds.  If you have matches near or crossing the middle of the chromosome, called the centromere, there may be breaks in that region.  I enter the centromere start and stop locations in my spreadsheet so that if I notice something odd going on in that region, the centromere addresses are right there to alert me that I’m dealing with that “odd” region.  You can find the centromere addresses in the FAQ at Family Tree DNA for their current build.
  • At 23andMe, when you reach the magic 1000 matches threshold, you start losing matches and the matching criteria is elevated so that you can stay under 1000 matches.  For people with colonial American or Jewish heritage, in other words those with high numbers of matches, this is a problem.
  • Watch for matches that are related to both sides of your family.  If your family lived in colonial America, you’re going to have a lot of matches and many are probably related to each other in ways you aren’t aware of.
  • If your parents are related to each other, this process might simply be too complex and intertwined to provide enough granular data to be useful.
  • Endogamous groups are impossible to sort through as to where, meaning which ancestor, the DNA came from.  This is because the original group founders’ DNA is just getting passed around and around, with little or no new DNA being introduced.  The effect of this on downstream generations relative to genetic genealogy is that matches appear to be more closely related than they are because of the amount of matching DNA they carry.  For my Brethren and my Acadian groups of people, I just list them by the group name, since, as the saying goes, “if you’re related to one Acadian, you’re related to all Acadians.”
  • If you’re going to follow this procedure, save one spreadsheet copy with the Strong Native only and then a second one with both the Strong Native and Blended Asian.  I’m undecided truthfully whether the Mixed Asian adds enough resolution for the extra work it generates.
  • When in question, refer back to the original tools.  The answer will always be found there.
  • Unfortunately, tools change.  You may want to take screen shots.  During this process, FTDNA went from build 36 to 37, match thresholds changed, 23andMe introduced a new user interface (which I find much less intuitive) and GedMatch has made significant changes.  The net-net of this is when you decide to undertake this project, commit to it and do it, start to finish.  Doing this little by little makes you vulnerable to changes that may make your data incompatible midstream – and you may not even realize it.
  • This entire process is intensively manual.  My spreadsheet is over 5500 rows long.  I won’t be doing it again…although I will update my spreadsheet with new matches from time to time.  The hard work is already done.
  • This same technique applies to any minority ancestry, not just Native, although that’s what I’ve been hunting for and one of the most common inquiries I receive.
  • I am hopeful that in the not too distant future many of these steps and processes will be automated by the group of bright developers that contribute to GedMatch or via other tools like DNAGedcom. HINT – HINT!!!

I would like to follow this same process to identify the source of my African heritage, but I’m thinking I’ll wait for the tools to become automated.  The great irony is that it’s very likely in the same lines as my Native ancestors.

If You Want to Test

What does it take to do this for yourself using the tools we have today, as discussed?

If your parents are living, the best gift you can give yourself is to test them, now, while you still can.  My mother has been gone for several years, but her DNA archived at Family Tree DNA was still viable.  This is not always the case.  I was fortunate.  Her DNA is one of the best gifts she gave me.  Not just by inheritance, but by having hers tested.  I thank her every single day, for both!  I could not have written this article without her DNA results.  The gift that keeps on giving.

If you don’t have a parent to test, you can test several other family members who will provide some information, but clearly won’t carry the same amounts of common DNA with you as your parents.  These would include your aunts and uncles, your parents’ siblings and what I’ve referred to as your close cousin circle.  Attempt to test at least someone from each line.  Yes, it gets expensive, but as one of my cousins said, as she took her third or 4th DNA test.  “It’s only money.  This is about family.”

You can also test your own siblings as well to obtain more information that you can use to match up to your family lines. Remember, you only receive half of your parents DNA, and your siblings will received some DNA from your parents that you didn’t.

I don’t have any other siblings to test, but I have tested cousins from several lines which have proven invaluable when trying to discern the sources of certain segments. For example, one of these Native segments fell on a common segment with my cousin Joy.  Therefore, I know it’s from the Campbell line, and because I have the Campbell paternal Y-DNA which is European, I know immediately the Native admixture would have had to be from a wife.

Much of this puzzle is deductive, but we now have the tools, albeit manual, to do this type of work that was previously impossible.  I am somewhat disappointed that I can’t pinpoint the exact family lines, yet, but hopefully as more people test and more matches provide genealogical information, this will improve.

If you want to play in this arena, you need to test at either Family Tree DNA, 23andMe, or both.  Right now, the most cost effective way to achieve this is to purchase a $99 kit from 23andMe, test there, then download your results from 23andMe and upload them to Family Tree DNA for $99.  That way, you are fishing in both pools.  Be aware that less than half of the people who test at either company download results to GedMatch, so your primary match locations are with the testing companies.  GedMatch is auxiliary, but critical for this analysis.  And the newest tool, DNAGedcom is a Godsend.

Also note that transferring your result to Family Tree DNA is NOT the same thing as actually testing there.  Why does this matter?  If you want a future test at Family Tree DNA, who is the premiere genetic genealogy testing company, offering the most variety and “deepest” commercial tests, they archive your DNA for 25 years, but if you transfer results, they don’t have your DNA to archive, so no future products can be ordered.  All I can say is thank Heavens Mom’s DNA was there.

Ancestry.com doesn’t provide any tools such as the chromosome browser or even the basic information of matching segments.  All you get is a little leaf that says you’re related, but the questions of which segment or how are not answerable today at Ancestry and as CeCe’s experience proved, its unreliable.  It’s  possible that you share the same surnames and ancestor, but your genetic connection is not through that family line.  Without tools, there is no way to tell.  Ancestry released raw data files a few weeks ago and very recently, GedMatch has implemented the ability to upload them so that Ancestry participants can now utilize the additional tools at GedMatch.

Although this has been an extraordinarily long and detailed process, I can’t tell you how happy I am to have developed this new technique to add to my toolbox.  My Native and African ancestors have been most elusive.  There are no records, they didn’t write and probably didn’t even speak English, certainly not initially.  The only clues to their existence, prior to DNA, were scant references and family lore.  The only prayer of actually identifying them is though these small segments of our DNA – yep – down in the weeds.  Are there false starts perhaps, and challenges and maybe a few snakes down there?  Yes, for sure, but so is the DNA of your ancestors.

Happy gardening and rooting around in the weeds.  Just think of it as searching for the very best buried treasure!  It’s down there, just waiting to be found.  Keep digging!

I hope you’ve enjoyed this series and that it leads you to your own personal genealogical treasure trove!

treasure chest

______________________________________________________________

Disclosure

I receive a small contribution when you click on some of the links to vendors in my articles. This does NOT increase the price you pay but helps me to keep the lights on and this informational blog free for everyone. Please click on the links in the articles or to the vendors below if you are purchasing products or DNA testing.

Thank you so much.

DNA Purchases and Free Transfers

Genealogy Services

Genealogy Research

The Autosomal Me – Extracting Data Segments and Clustering

This is Part 8 of a multi-part series, “The Autosomal Me.”

Part 1 was “The Autosomal Me – Unraveling Minority Admixture” and Part 2 was “The Autosomal Me – The Ancestors Speak.”  Part 1 discussed the technique we are going to use to unravel minority ancestry, and why it works.  Part two gave an example of the power of fragmented chromosomal mapping and the beauty of the results.

Part 3, “The Autosomal Me – Who Am I?,” reviewed using our pedigree charts to gauge expected results and how autosomal results are put into population buckets.  Part 4, “The Autosomal Me – Testing Company Results,” shows what to expect from all of the major testing companies, past and present, along with Dr. Doug McDonald’s analysis.  In Part 5, “The Autosomal Me – Rooting Around in the Weeds Using Third Party Tools,” we looked at 5 different third party tools and what they can tell us about our minority admixture that is not reported by the major testing companies because the segments are too small and fragmented.

In Part 6, “The Autosomal Me – DNA Analysis – Splitting Up” we began the analysis part of the data we’ve been gathering.   We looked at how to determine whether minority admixture on specific chromosomes came from which parent.

Part 7, “The Autosomal Me – Start, Stop, Go – Identifying Native Chromosomal Segments”, took a deeper dive and focused on the two chromosomes with proven Native heritage and began by comparing those chromosome segments using the 4 GedMatch admixture tools.

In this segment, Part 8, we’ll be extracting all of the Native and Blended Asian segments on all 22 chromosomes, but I’ll only be using chromosomes 1 and 2 for illustration purposes.  We will then be clustering the resulting data to look for trends.  If you’re following along and using this methodology, you’ll be extracting the Native segment start and stop locations from all 22 chromosomes.

I apologize in advance for the length of this article, but there was just no good place to break it into pieces.

So, let’s get started.  As a reminder, we are using the admixture tools at www.gedmatch.com.

I experimented with several types of extractions to see which ones best reflected the results found by both 23andMe and Dr. McDonald and confirmed by the start and stop segments in the highly Native segments of chromosomes 1 and 2 in Part 7 of this series.  We verified that all 4 tools accurately reflected and corroborated the segments listed as Native, so now we’re going to apply that same methodology to the rest of our chromosomal data.

Initially, I tried to use the information from chromosomes 1 and 2 to extract the Native chromosomes using only the “best” tool, but when I looked at all 4 tools, I quickly realized that there was no single “best” choice.  A couple of crucial points came to light.

  • Some of the geographic colors are almost impossible to tell apart.
  • None of the tools are universally best.
  • When looking at all 4 tools, generally a “best 3 out of 4” approach allowed for one of the tools to be wrong, to perhaps reference a slightly different data base that called the segment differently or for the colors to be indistinguishable.  In other words, if three called a segment Native and one did not, it’s Native and conversely, if less than 3 call it Native, in this comparison, it’s not.

Unfortunately, this created an awful lot of work.  This is probably the best example of where automation tools could and would make a huge difference in this process.

I did two separate extracts.  The first one is what I refer to as the “Strong Native” extract and the second is the “Blended Asian.”  In part, I did these separately as a check and balance to be sure that my first extraction was accurate.

In the first extract, I selected only one category, the one best fitted to “Native American” for each tool.  I used the following categories for each admixture tool:

  • MDLP – Amerind
  • Eurogenes – North Amerindian
  • Dodecad – NE Asian
  • Harrappaworld – American

I completed this process for every chromosome, but I’m only showing the first two chromosomes in this article.

By way of example, using the first tool, MDLP, North Amerind looks black, but is actually very dark grey.  It is, fortunately, distinctive.

On the chromosome painting below, my results for the first part of chromosome 1 are shown in the first band, and mother’s for the same segment are shown as the second band.  The bottom band represents common segments and the black is non-matching segments, meaning those I obtained from my father.  Sometimes this third band can help you determine what you are really seeing in terms of colors and blending, but it’s not always useful.  In this case, trying to spot a small amount of dark gray against black is almost impossible, so not terribly helpful.  But if you were looking for red, that would be another story.  As you move through this process, remember, it’s not exact and utilizing best 3 of 4 will help you recover from any major errors.

You can see that my grey segments show up from about 12-13 and then again at about 14.5.  Sometimes it’s difficult to know how to count something.  For example, my Native at 14.5 – it’s actually more like 14.25 -14.5, but I chose not to divide further than half mb segments.  As long as you are consistent in whatever methodology you select, it will work out.

step 8 - 1

Please note that when reading these charts, that the small hash mark is the indicator for the measure.  In other words, the small hash mark above 10M means that is the 10M location.  It’s obvious here, but on some charts, the hash mark and the location legend look to be 1-off.  Again, as long as you’re consistent, it really doesn’t matter.

Mother’s Native segments are more pronounced and obvious.  They range from about 8-14.  Using the actual tools, you would record this and then continue scrolling to the right until you reach the end of the chromosome.  On chromosomes 1 and 2, I found the strong Native segments for the four admixture tools, as shown below.

The boxed numbers show the areas that were found “in common” between 23andMe, Dr. McDonald and the admixture tools, as determined in Part 7 of this series.  Highlighted segments show segments where at least 3 of 4 admixture tools reported Native heritage.  As you can see, there were clearly additional Native segments not reported by 23andme and Dr. McDonald.

Strong Native Chromosomal Detail Table

step 8 - 2

step 8 - 3

Because we have both my and mother’s results, we can infer my father’s contribution.  Clearly, some of his will wind up being some amount of “noise” and some IBS segments, but not all, by any means, and this is the only way to get a “read” on Dad.  This is one form of phasing data.  Phasing refers to various methodologies of figuring out which DNA comes from what source, meaning which parental line.

While the strongest Native segments are the ones individually most likely to indicate Native American ancestry, that really isn’t the whole story.  I discovered that many of these Native segments are actually embedded in other segments that are indicative of Native heritage too.  In other words, it’s not a line in the sand, yes or no, but more of a sliding scale.

On the chromosome painting below, this one using Eurogenes, with my results shown above and mother’s below, you can see two excellent examples.  Regions relevant to Native ancestry include:

  • Red – South Asian
  • Brown – Southwest Asian
  • Yellow – North Amerindian and      Arctic
  • Putty – Siberian
  • Emerald – East Asian

You can see that while mine is almost universally yellow, or Native, with a little Siberian (putty) mixed in for good measure between 169-170, a hint of East Asian (emerald) plus a little Asian (red), mother’s isn’t.  In fact, hers is a mixture of Native American and South Asian (red), with more red than yellow,  Siberian (putty) and a large segment of East Asian (emerald green).

step 8 - 4A

While her yellow Native segments alone would be staggered across this entire segment in 7 different pieces, when taken together as a whole, the “blended Asian” segment reaches entirely across the screen with the exception of 1 mb between 161.5-162.5, roughly.

The following Blended Asian Chromosomal Detail Table shows all of the blended Asian segments using all four of the admixture tools for chromosomes 1 and 2.

It’s clear that these regions are not solely “Native American” but reach back in time genetically into Asia, particularly Northeast Asia.

Again, the boxed numbers show the “in common” segments between all tools and the yellow highlighted segments are common between at least three of the four admixture tools.

Please note that there were some issues distinguishing colors, as follows:

  • For the MDLP comparison, Mesoamerican and Paleo Siberian are both putty colored and indistinguishable on the chart.  Also, the apple green for Arctic Amerind is very similar to the Austronesian.
  • When using Dodecad, Southeast Asian (light green) and South Asian (apple green) are nearly impossible to distinguish from each other on the graphs.
  • When using HarappaWorld, the apple green for Siberian was very similar to the light forest green for Papua New Guinea and was very difficult to distinguish.  The South Asian putty appears often with the other Native markers, and I considered including this group, but it too was difficult to distinguish from other regions so in the end, I opted not to include this category.
  • If you are colorblind – get help as this is impossible otherwise.

Blended Asian Chromosomal Detail Table

On the blended Asian Chromosome Detail Table, I added yellow highlighting where the same segments show in other Asian geographies that showed in the Strong Native table.  In each column, the Strong Native category is the last one at the bottom of the list.

The blue highlighting shows other common segments found that were not included in the Strong Native segments.  For a Strong Native yellow segment to be highlighted, it had to be present in 3 of 4 tools, or 75%.  In the Blended Asian group, there are a total of 15 categories between the 4 admixture tools, so for a segment to be shaded blue, it must be found in at least 8 of the categories, so just over half.  There are many segments that are found in several categories across the tools.  For example, segment 192-193 on chromosome 1 is found five times.  This isn’t to say you should discount this segment, only that it isn’t one of the strongest, most universal.  Surprisingly, there really weren’t too many that were close to the cutoff.  Several, but not a majority, were in the 4 or 5 range, only one was at 7.

step 8 - 4

 step 8 - 5

step 8 - 6

 step 8 - 7

  step 8 - 8step 8 - 9

 step 8 - 10

 Step 8 - 11

step 8 - 12

Clustering

The third step in data extraction is to look at all of the data together.  In this step, we are removing the geographic boundaries of Siberian, N. Amerindian, etc. and combining all of our data.  I have only combined the data within columns, not between columns, so we can get a feel for which tool or tools performed best or maybe not so well.  Each chromosome in each column has its data ordered numerically, and yes, this is a manual cut and paste process.  Sorry.  I warned you, this is an very manually intensive process.

After I put each column in numerical order, I arranged them so that the numbers were approximately in a line, or a row, with each other.  For example, in the first group below, you can clearly see that the first cluster of results is found using all 4 tools.  When looked at individually, only the blue results were noted as common (at least 8 of 15 for blue), but when viewed as a cluster, you can see between the tools that the cluster itself runs from about 7.5, with a small break from 8-9, and then to about 14.5.  As you would expect the beginning and end points of the cluster trail off and are not uniform between tools, but the main part of the cluster is found in all the tools.  This introduces the question of how to measure a cluster.  In this case, there is a clean break using all tools between 8 and 9, but that is only 1 mb, rather difficult to measure accurately.  You could record this as two distinct clusters but since it’s very closely adjacent the rest of the cluster, I’m inclined to include this as one large cluster and use the starting and ending segments for the cluster as a whole, in other words, the cluster runs from 7.5 through 14.5.  The alternate, or more conservative methodology would be to use the “in common” numbers, but in this case, that would be only 10-11.5 and I think you would miss a great deal of useful data.  So, for clusters, I’m recording the full extent of the cluster.  In some cases, you may need to exercise a judgment call.

Let’s look at the second group of numbers, beginning with 18.5 in Harrappaworld.  This grouping runs though about 28.  Eurogenes found some blended Asian between 27-28.5 as well in two of the geographies, but over all, of the 15 tools, we don’t see much.  This could be a result of a number of things.  I could have had problems with the colors, there may be only a very small amount and it may be categorized as something else with the other tools.  I would not consider this a cluster, and using our best 3 or 4 methodology eliminates this cluster from consideration.  This also holds true for 43-43.5.

However, the next cluster, from 55.5 to 58 is found in the Strong Native comparison, indicated by the yellow highlighting and is found using all 4 tools.  This is definitely a cluster.

step 8 - 13

step 8 - 14

step 8 - 15

step 8 - 16

step 8 - 17

step 8 - 18

step 8 - 19

Step 8 - 20

step 8 - 21

step 8 - 22

step 8 - 23

step 8 - 24

I’ve synthesized the cluster information into a list.  From the clusters above, I’ve created a list that I will be using in the next segment for data input into my spreadsheet of matches.  The blended segments below that include Strong Native segments are shown with yellow.

step 8 - 25

Using the GedMatch admixture applications, we’ve isolated the strongest Native and the Blended Asian segments and clusters in preparation for identifying specific Native family lines within our group of matches.

This process shows that, for the most part, the Strong Native segments picked up the strongest signals, about half of the segments that will be useful in determining Native admixture, although it does miss some.

When we use the clustering technique to view our results across all the admixture tools, we see a somewhat different picture emerge, adding several Blended Asian clusters.

In Part 9 of this series, we will use the highlighted Strong Native segments and the Blended Asian clusters, both of which suggest Native chromosomal “hotspots” to begin our comparison to our genetic matches for genealogical relevance.  In other words, using this information, we will determine which genealogical lines carry Native ancestry.

Part 9 may be somewhat delayed.  The good news is that Family Tree DNA is finishing work on their Build 36 to Build 37 conversion.  The bad news is that it fell right in the middle of writing this series.  When they finish Build 37, I’ll finish Part 9 of this series.  In the mean time, you can be extracting your minority segments using the tools and techniques that we have covered in Parts 1-8.

______________________________________________________________

Disclosure

I receive a small contribution when you click on some of the links to vendors in my articles. This does NOT increase the price you pay but helps me to keep the lights on and this informational blog free for everyone. Please click on the links in the articles or to the vendors below if you are purchasing products or DNA testing.

Thank you so much.

DNA Purchases and Free Transfers

Genealogy Services

Genealogy Research

The Autosomal Me – Start, Stop, Go – Identifying Native Chromosome Segments

This is Part 7 of a multi-part series.

Part 1 was “The Autosomal Me – Unraveling Minority Admixture” and Part 2 was “The Autosomal Me – The Ancestors Speak.”  Part 1 discussed the technique we are going to use to unravel minority ancestry, and why it works.  Part two gave an example of the power of fragmented chromosomal mapping and the beauty of the results.

Part 3, “The Autosomal Me – Who Am I?,” reviewed using our pedigree charts to gauge expected results and how autosomal results are put into population buckets.  Part 4, “The Autosomal Me – Testing Company Results,” shows what to expect from all of the major testing companies, past and present, along with Dr. Doug McDonald’s analysis.  In Part 5, “The Autosomal Me – Rooting Around in the Weeds Using Third Party Tools,” we looked at 5 different third party tools and what they can tell us about our minority admixture that is not reported by the major testing companies because the segments are too small and fragmented.

In Part 6, “The Autosomal Me – DNA Analysis – Splitting Up” we began the analysis part of the data we’ve been gathering.   We looked at how to determine whether minority admixture on specific chromosomes came from which parent.

Part 7 – “The Autosomal Me – Start, Stop, Go – Identifying Native Chromosomal Segments”, takes a deeper dive and focusing on the two chromosomes with proven Native heritage, begins by comparing those chromosome segments using the 4 GedMatch admixture tools.  In addition, we’ll be extracting Native segment chromosomal start and stop addresses that we’ll be using in a future segment.

Using Doug McDonald’s tool and the 23andMe results, we can begin with the following two Native segments, one each on chromosome 1 and 2.  These will be our reference points, because according to both sources, these are the largest and most pronounced Native segments, the strongest indicators, so they will be our best yardsticks.

  Chromosome 1 Chromosome 2
23andMe

165,658,091 to 175,711,116

86,316,174 to 103,145,426

McDonald

165,000,000 to 180,000,000

90,000,000 to 105,000,000

On all of these admixture graphs, my results are shown first, then mother’s, then the comparison between the two where the colored regions show common ancestry and the black shows nonmatching segments – in other words those contributed by my father.

Please note that Native contribution in this analysis is being evaluated by a combination of geographies.  In some cases, one individual will show as “Native” meaning in the case of MDLP “North Amerindian” and the parent (or child) will show as something similar, like “Actic,” “South American” or “MesoAmerican.”  In order to normalize this, I have combined all of the geographies that are Native indicators.

MDLP

On the MDLP graph below, the legend indicates that these 4 regions are relevant to Native ancestry.

  • Army green – Mesoamerican
  • Lime Green – Arctic
  • Emerald – South American Indian
  • Grey – North Amerindian

Chromosome 1 – Native Segment

On the graph below, you can see that mother has more grey than I do from about 162-165, but then I have some grey that she does not at about 170.

step 7

A detailed analysis of the segment of chromosome 1 between 158-173 shows the following admixture:

On my results, the putty green, MesoAmerican, is scattered between about 158 and 173, in three segments.  The putty green in my mother’s segments are from 159-160.5 and then 167-170.5.  Therefore, my father, by inference has a segment from about 162-165 and from about 170.5 to 173.

My teal, North Siberian, ranges from 162-163 and from 168-171.  My mother carries no teal in these segments, so this is inferred to be contributed from my father.

My dark grey, North Amerind, ranged from 162-165.5 and then from 168-169.5.  My mother’s range is from 161-165.5.  Therefore my grey segment at 168-169.5 is either recognized as MesoAmerican or Arctic Amerind in my mother.

Chromosome 2 – Native Segment

step 7 - 1

Chromosome 2 is quite interesting.  You can see that on my chromosome, the North Siberian begins at about 80.  Mom has none at that location.  My North Amerind begins at about 95 and extends to 105, where Mom’s begins in the same location but then transitions to a large segment of MesoAmerican which I do not carry.  I do have MesoAmerican, but mine begins about where hers ends and extends to about 105.  Mom’s North Amerind ends about 101, while mine continues to about 105.  She looks to have trace amounts beginning about 105 and extending through 115.

Eurogenes

The next graph shows the same chromosomes using Eurogenes.  Regions relevant to Native ancestry include:

  • Red – South Asian
  • Brown – Southwest Asian
  • Yellow – North Amerindian and Arctic
  • Putty – Siberian
  • Emerald – East Asian

Chromosome 1 – Native Segment

step 7 - 2

The difference between my chromosome 1 and my mother’s in this region is quite pronounced.  My mother’s is drenched in beautiful red South Asian, while I have absolutely none.  Some of the area where I have North Amerindian shows as South Asian on hers, but in other areas, there is no correlation.  It is expected of course, that there are areas where she has some ancestry and I have none, due to the fact that I only inherit half of her DNA, but she has a significant segment of East Asian between 163 and 164, and I look to have received only a very small portion.  The same is true of her Siberian segments at 163-164, but then I have Siberian that she does not at 169-170 and she has some that I don’t at 160-161.5.  Some of this difference can likely be explained, especially between the yellow North Amerindian and the red South Asian by slight differences in the DNA read and how it is categorized, but in other cases, the difference is real.  Looking at mother’s red segments from about 166.5 to about 168 and then looking at my corresponding region, you can see that I have nothing that hints at Native.  In that region, I clearly inherited from my father as well as my mother’s North European.

Chromosome 2 – Native Segment

step 7 - 3

As different as our chromosomes 1 were, one wouldn’t expect chromosome 2 to be so similar.  In the graph, I included my large South Asian segment surrounding 80, where Mom has a trace, although that is beyond the area indicated as Native by 23andMe and Doug McDonald.  In the range of interest, beginning at about 80, we find nothing until about 94 where mother and I both have North Amerindian segments that stretch through about 105.  Mom’s goes slightly further than mine, to about 105.5.  It’s interesting to note that in part of this region, on either side of 101, her Siberian and my North Amerindian are the same shape at the same location, so obviously the same DNA is being read and categorized as two different regions, probably due to my father’s admixture.

Dodecad

On the Dodecad graph of the Native segment, you can see the Native colors are in shades of green.

  • Putty – West Asian
  • Yellow-green – South Asian
  • Emerald – Northeast Asian
  • Light Green – Southeast Asian

To use Dodecad in an equivalent manner as the rest of the tools, it looks like Northeast Asian is the closest we would get to Native American since that is where Native Americans lived just prior to crossing Beringia, so the greens should probably be evaluated as a group.  As can be seen on chromosome 1, they do clump together.  Even though West Asian is also found with this group, it seems to be outside the range, so I am not including it in the evaluation.

Chromosome 1 – Native Segment

You can see another example here of one segment being called South Asian in Mom’s and Northeast Asian in mine at about 170mb.

step 7-4

The Native, or in this case, Northeast Asian/Southeast Asian begins at about 162.5 where Mom’s and mine are very similar.  However, we diverge at about 164.5 where Mom begins with large segments of South Asian.  I have a little bit, but not much.  Beginning about 168, I have a large Northeast Asian segment, but she shows with South Asian there, although the segments are not exact.

Chromosome 2 – Native Segment

step 7 - 5

Chromsome 2 is quite simple using Dodecad.  Only two of the three groups appear.  Southeast Asian is absent, South Asian is present only in trace amounts except for one small area between 79.5 and 80 on my chromosome.  As expected, Northeast Asia is more prominent.  Mother has a few areas that I don’t, which is to be expected.

HarrappaWorld

Last, we have HarrappaWorld.  American and Beringian are the Native American categories here.  Regions relevant to Native American heritage would be:

  • Teal – American
  • Periwinkle – Beringian
  • Lime Green – Siberia
  • Emerald – Northeast Asia

Chromosome 1 – Native Segment

You can see both Beringian and American embedded again at about location 169.  In mine, this entire block reads as American.

step 7 - 6

There is one large chunk of Northeast Asian showing for both results, but part of that region of my chromosome, between 163-164 shows as American instead of Northeast Asian.  The Beringian is scattered through the American, which I would expect.  The American runs either strongly or weakly through this entire segment from 163 to 175 in mine or to 179 in mother’s.  Surprisingly there is no Siberian at all.  I would have expected to see Siberian before Northeast Asian.

Chromosome 2 – Native Segment

step 7 - 7

Where on chromosome 1, we saw no Siberian, on chromosome 2, we find Siberian instead of Northeast Asian.  I have no Beringian, but mother has 4 segments.  Three of her 4 segments are embedded with American segments.  Two may simply be categorized differently in my results, but two, I did not inherit.

Analysis Discussion

What have we learned?

When we are dealing with small amounts of minority admixture, they may or may not be able to be picked up directly by the testing companies.  Of course, part of this has to do with their thresholds for what is “real” and reportable, and what isn’t.  Aside from that, lack of identification of minority admixture probably has to do with which segments were inherited and their size, if they have been isolated and identified as Native by population geneticists, and the robustness of the data base sources the data is being compared against.

We can also see how difficult it is to sort through threshold matches, meaning what is Native, Asian, central Asian, etc.  Many of these differences are probably not actually differences between groups, but similarities with slight categorization differences.  Of course, it’s those differences we seek to identify our ancestral heritage.  Combining similar geographies may help reveal relationships masked my reporting and categorization differences.

Given that multiple sources have indicated Native ancestry, and on the same two chromosomes, I have no doubt that it exists.  Had any doubt remained, the exercises creating the MDLP Chromosome Map Table and reviewing the segments on chromosome 1 between 160 and 180mb would have removed any residual concerns.

The following table shows the results for the Native segments of chromosomes 1 and 2 beginning with the 23andMe and McDonald results, and adding the start and stop segments from each of the 4 admixture tools we used.

  Chromosome 1 Chromosome 2
23andMe

165,658,091 to 175,711,116

86,316,174 to 103,145,426

McDonald

165,000,000 to 180,000,000

90,000,000 to 105,000,000

MDLP

162,000,000 to 173,000,000

80,000,000 to 105,000,000

Eurogenes

162,500,000 to 171,500,000

79,000,000 to 105,000,000

Dodecad?

162,500,000 to 171,000,000

79,500,000 to 105,000,000

Harrappaworld

163,000,000 to 180,000,000

79,000,000 to 104,000,000

In Common

165,658,091 to 171,000,000

90,000,000 to 103,145,426

Although the start and end (or stop) segments vary a bit, all resources above confirm that the region on chromosome 1 between 165,658,091 and 171,000,000 is Native and on chromosome 2, between 90,000,000 and 103,145,426.  Those are the areas “in common” between all resources, which is shown in the last table entry.

The concept of “in common” is important, because while any one resource may report something differently, or not at all, when all or most of the resources report something the same way, it is less likely to be a fluke or reporting issue, and is much more likely to be real.  We’ll be using this methodology throughout the rest of the articles in “The Autosomal Me” series.

In the next segment, Part 8, we’ll be extracting the actual start and stop addresses of the Native only segments, referred to as the “Strong Native” method, and the combined Native indicator segments, referred to as the “Blended Asian” method and looking at how we can use those results.

______________________________________________________________

Disclosure

I receive a small contribution when you click on some of the links to vendors in my articles. This does NOT increase the price you pay but helps me to keep the lights on and this informational blog free for everyone. Please click on the links in the articles or to the vendors below if you are purchasing products or DNA testing.

Thank you so much.

DNA Purchases and Free Transfers

Genealogy Services

Genealogy Research