Estes Big Y DNA Results

In late 2013, a new Y DNA product called the Big Y was introduced by Family Tree DNA.  The goal of this new test was to read virtually all of the Y chromosome that was useful for genealogical purposes.

I decided to wait and see how useful this tool actually was, and how to effectively use the information before delving into a family study, in part, because the individuals tests are quite expensive. We began our Estes Big Y family study in 2014 and I have now completed a report for family members.  With their permission, I’m sharing this information with the hope that other groups will see the potential in combining STR and full sequence SNP testing for family groups.

The temptation, of course, especially in the case of the Estes lineage is to see if we could reach back further in time to see if we can connect with, confirm or dispel the persistent myth that the Estes line is descended from the d’Este family line of Italy.  Of course, if there was a direct line male from that family that existed, or was willing to test, that would answer the question in a heartbeat but that’s not the case.

The belief that the Estes family was descended from the d’Este’s is an old one and not just limited to the American Estes family or the Estes family itself.

Long-time Estes researcher and archivist, David Powell, gathered several instances where various families in England used the d’Este name, at least one of which was suggested by King James himself.

King James I of England and Scotland (reigned from 1603 to 1625) was convinced that a gentleman in his service by the name of East was in fact a descendent of the d’Este family and suggested he change his name to Este. One did not gainsay a suggestion from the king in those days!

Even earlier, the English printer Thomas East (1540-1608) used the names East, Est, Este and Easte and hinted at a connection with the d’Este family, although his motivations were much more obvious – he made his fame publishing Italian music in England and suggesting a connection to the d’Este’s would certainly not have adversely affected his sales! Thomas’ son, Michael (1580-1680), who was a composer in his own right, also used the names East, Est, Este and Easte.

Somewhat more recent was the case of Sir Augustus d’Este (1794-1848), who despite the surname, was pure English. Augustus was son of the Duke of Sussex and the daughter of the Earl of Dunmore. The marriage of his parents was without the King’s consent and he (George III) subsequently annulled the marriage, thus making Augustus illegitimate *after* his birth.  After the annulment, Augustus and his sister were given the name d’Este by their father, a name that was “anciently belonging to the House of Brunswick”. There were several other instances where English aristocrats named Este or East changed their name to d’Este, including one family in the 1800’s that changed their name from East and claimed the non-existent title “Baron d’Este.”

The Big Y test holds out the promise, or at least the possibility, of being able to connect the outside limits of the standard genealogy Y DNA STR tests and bridge the hundreds to a couple thousand year gap between STR testing and haplogroup definitions.

In our case, we needed to know where our ancestors were and what they were doing, genetically, between about 500BC and 1495AD when we both find them (coming forward in time) and lose them (going backward in time) in Deal, Kent, England.

Had they been in Kent forever, without a surname or with a surname, but not reflected in the available records, or had they truly been royalty on the continent and recently immigrated?

In the article, Nycholas Ewstas (c1495-1533) English Progenitor, I found and compiled the various list of Estes/d’Este ancestral stories.  The most reasonable seems to be found in David Powell’s article, “Origins of the Estes/Eastes Family Name,” as follows:

“…Francesco of Este, who was the son of Marquis Leonello [1407-1450], left Ferrara [1471] to go and live in Burgundy, by the will of Duke Ercole [Francesco’s uncle, who succeeded Leonello] .. and, in order that he should go at once, he gave him horses and clothes and 500 ducats more; and this was done because His Excellency had some suspicions of him .. ‘Francesco .. went to Burgundy and afterward to England’. These were the words written on the back of the picture of Francesco found in a collection of paintings near Ferrara.”

Many of the details are similar to earlier stories. But why would Francesco flee Italy? In 1471 Francesco’s brother, Ericolo, led a revolt in an attempt to overthrow Duke Ercole. The attempt was unsuccessful and in typical royal tradition, Ericolo lost his head and Francesco exiled, if only because he was Ericolo’s brother. Did Francesco really travel to England? The only evidence for this is the writing in the back of the painting, the existence of which is unconfirmed. Essentially the same story is told by Charles Estes in his book:

“.. Francesco Esteuse (born c.1440), the illegitimate son of Leonnello d’Este. Francesco was living in Burgundy. In the time of Duke Borso he came to Ferrara, and at Borso’s death was declared rebellious by Ercole because of efforts made by his brother, Ericolo, to seize power. Francesco returned to Burgundy and was heard of no more from that time (1471). As the time coincided with that when Edward conquered [sic] England with the aid of Burgundy, it was possible that Francesco followed Edward and after Edward’s victory made England his home.”

I checked with the Metropolitan Museum of Art who indicated no such notation on the painting and provided additional information showing that it’s likely that Francesco died in Burgundy.

If Francesco was the progenitor of the Estes family of Kent, who were mariners, the family in one generation, in essence, in one fell swoop, went from royalty to peasantry in Kent.  Nicholas was born in 1495 and two other Estes men, Richard and Thomas, found nearby, born about the same time.  Extremely unlikely, but not impossible.

The d’Este family of Italy was said by Edward Gibbon in his “Decline and Fall of the Roman Empire” to originate from the Roman Attii family, which migrated from Rome to Este to defend Italy against Goths. However there is no evidence to support this hypothesis.

The names of the early members of the family indicate that a Frankish origin is much more likely. The first known member of the house was Margrave Adalbert of Mainz, known only as father of Oberto I, Count palatine of Italy, who died around 975. Oberto’s grandson Albert Azzo II, Margrave of Milan (996–1097) built a castle at Este, near Padua, below, and named himself after it.

Este Castle

The city of Mainz is the capital of the state of Rhineland-Palatinate in Germany. It was the capital of the Electorate of Mainz at the time of the Holy Roman Empire which began in 962. In antiquity Mainz was a Roman fort city which commanded the west bank of the Rhine and formed part of the northernmost frontier of the Roman Empire; it was founded as a military post by the Romans in the late 1st century BC and became the provincial capital of Germania Superior.

Mainz Germany

The city is located on the river Rhine at its confluence with the Main opposite Wiesbaden, in the western part of the Frankfurt Rhine-Main.  The painting above shows Mainz looking toward the Rhine, across the old part of the city, in 1890.

There is absolutely no question that the Romans occupied Mainz as the remnants of architectural structures such as Roman City gates from the 4th century and Roman aqueducts (below) permeate the landscape yet today.

Mainz Roman aquaducts

The town of Frankfurt was adjacent Mainz and the name of Frankfurt on Main is derived from the Franconofurd of the Germanic tribe of the Franks plus Furt, meaning ford,  where the river was shallow enough to be crossed by wading. The Alemanni and Franks lived there and by 794 Charlemagne presided over an imperial assembly and church synod, at which Franconofurd (-furt -vurd) was first mentioned.

The Franks and the Alemanni were both Germanic tribes.  The Alemanni were found in what is today German Swabis and Baden, French Alsace, German-speaking Switzerland and Austrian Voralberg.  Their name means “all men” as they were a Germanic confederation tribe.  One historian, Walafrid Strabo, a monk of the Abbey of St Gall wrote in the 9th century that only foreigners called the Alemanni by that name, that they called themselves the Suebi.

This map shows the approximate location of the original Frankish tribes in the third century.

Frankish Tribes 3rd Century

“Carte des peuples francs (IIIe siècle)” by Odejea – Own work, d’après : Patrick Peron, Laurence Charlotte Feiffer, Les Francs (tome 1 – A la conquête de la Gaule), Armand Collon Editeur, Paris, 1987, isbn 2-200-37070-6. Licensed under CC BY-SA 3.0 via Wikimedia Commons

The Franks, who eventually conquered the Alemanni, were found predominately in northeastern Europe in what is now Belgium and the Netherlands along the lower and middle Rhine, extending into what is now France.

Another source claims that the Italian d’Este family roots were found as the Marquis of Sicily, affiliated with Lombardy, which was ruled by the Lombards. If this is true, the Lombards were also descendants of the Suebi, having originated in Scandinavia, and the Franks defeated the Lombards as well, so either way, the DNA would appear in the same locale.

Lombard Migration

“Lombard Migration” by Castagna – Own elaboration from Image: Europe satellite orthographic.jpg. Licensed under Public Domain via Wikimedia Commons –

Relative to the Estes family of Kent, if they do descend from the d’Este family of Italy, based on this information, their Y DNA should look like and correlate with that of either Italians or Germanic tribes such as the Franks and the Suebi.

Aside from answering this origins question that has burned for years, what other types of information might we learn from Big Y testing?

  • Does the Estes family have any mutations that are unique? In other words, specific SNP mutations have evolved in the Estes family and would, in combination with other SNPs and STRs, identify us uniquely. Someday, in hundreds of years, as we have many descendants, these individual SNPs found only in our family line will define our own haplogroup.
  • What other families are the closest to the Estes family?
  • When and where did we “split” with those other families? Does their family history help define or identify ours?
  • Can SNP mutations in combination with STR mutations help identify specific lineages within the Estes family? This is particularly important for people who don’t know which ancestral line they descend from.

These same questions would be relevant for any family interested in doing a Big Y DNA study.

The Estes family is fortunate that we have several people who are interested in the deep history of the family, and were willing to pay for the Big Y test, along with the full 111 marker Y STR tests to facilitate our research and understanding.

The Estes family is first found in Kent, England in 1495 with Nicholas whose name was spelled variably, as were all names at that time.  Estes is spelled in many ways such as Ewstas, Eustace, Estes, Eastes, Estice and more.  I am using Estes for consistency.

I have created a pedigree chart of sorts to show the descent of the Estes Big Y testers.

Estes pedigree

Robert Estes and Anne Woodward had two sons, Silvester and Robert, who have descendants Big Y testing today.

Silvester had two sons, Richard and Abraham who have descendants who have Y DNA tested, but only Abraham’s descendants have taken the Big Y test.  Robert had son Matthew whose descendant also took the Big Y test.  Note that Abraham and Matthew are shown in green which indicates that they immigrated to America.  Richard, in blue, between Abraham and Matthew did not immigrate and his descendants did not take the Big Y test.

Of Abraham’s sons, we have Y DNA tested descendants from 7 sons, but only descendants of 5 sons are participating in the Big Y project.  We are uncertain of the direct lineage of kit 199378 as noted by the ? with Elisha’s name in his ancestry.  We know positively from his DNA results that he is biologically an Estes, but he could be descended from a different son.

We are also very fortunate that we have been able through several volunteers and professional genealogists to document the Estes line reliably both back in time into Kent and forward in time to current through several lines.

The Estes DNA project is somewhat unique in the fact that we have 10, 11 and 12 generations to work with in each line.  Our closest participants are 7th cousins and our furthest, 10th cousins once removed.  We have a total of 65 separate DNA transmission events that have occurred, counting each birth in each line as one transmission event, introducing the possibility of either STR mutations or new SNPS in each new generation.

STR mutations show up in the traditional 12, 25, 37, 67 and 111 marker panels.  SNP mutations  show up in the Big Y report as either SNPs or Novel Variants which is a newly discovered SNP that has not yet been assigned an official SNP name, assuming is isn’t just a family occurrence.

Let’s look at the STR markers first.

All of our participants except one extended to 111 markers and that individual tested at 67.  Of the 111 markers, 97 marker locations have identical marker values in all participants, so have no mutations in any line since our common ancestor lived.  Of course, this means that our common ancestor carried this same value at this DNA location.

I created a virtual Estes ancestor, in green, below, by utilizing the most common values of the descendants and compared everyone against that ancestor.  Of course, this is a bit skewed because we have several descendants of Silvester’s line through Abraham and only one descendant of Robert through Matthew.

Estes ancestral Y

The reconstructed or triangulated ancestral value is shown in green, at the top, and the results that don’t match that value are highlighted.  I can’t show all 111 markers here, but enough that you get the idea.  You can see all of the Estes STR test results on the Estes DNA project page.

Comparing against the recreated ancestor, Matthew’s descendant, kit 166011, only has 7 mutations difference from our recreated Estes Y ancestor.  At 111 markers, this averages out to about one STR mutation every 1.5-2 generations.

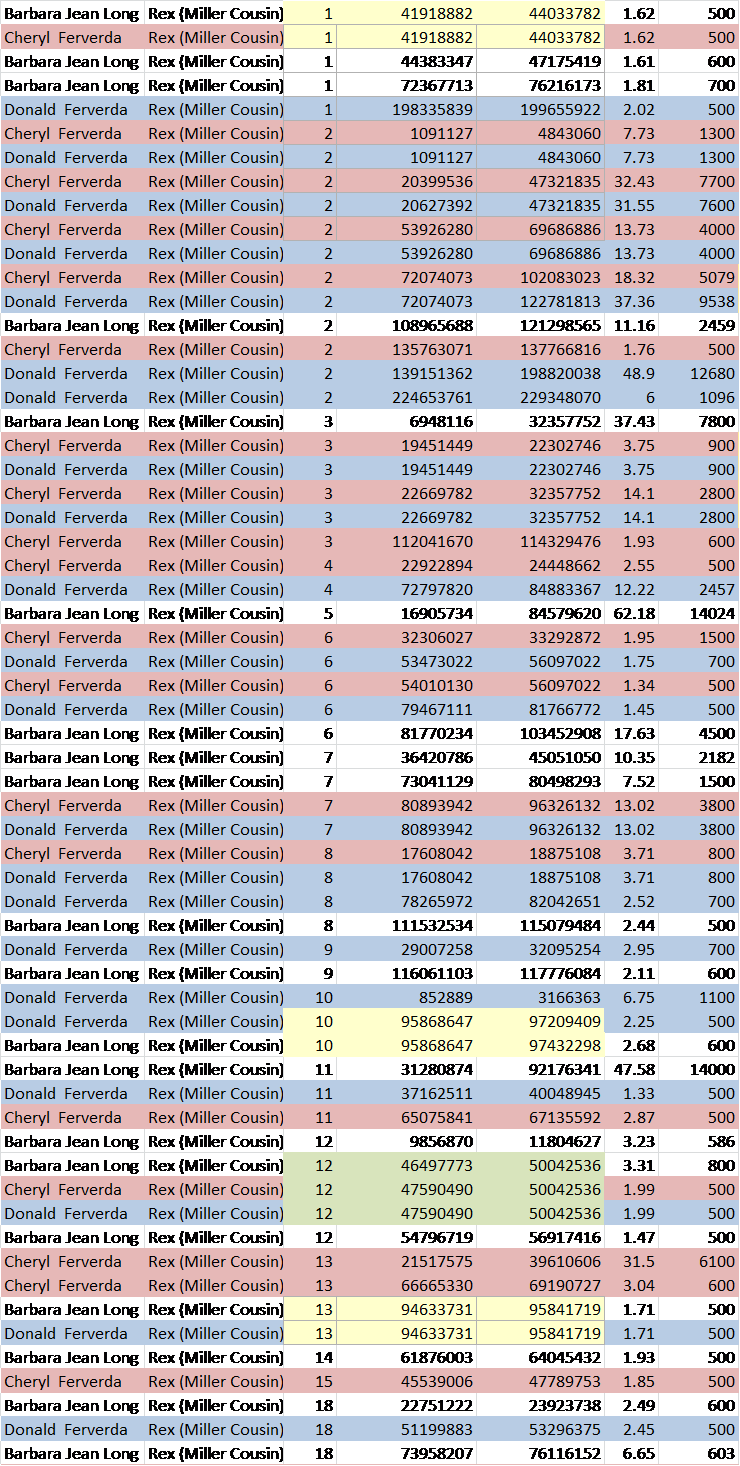
The chart below shows Matthew’s descendant kit, 166011, compared to all of Abraham’s descendants.  Matthew’s descendant, of course, is the kit furthest genealogically from Abraham’s descendants.

The number in the intersecting cells shows the number of mutations at both 67 and 111 markers compared to kit 166011.

Kit Numbers 9993 13805 244708 366707 199378
166011 at 67 6 6 6 6 5
166011 at 111 10 10 11 11 No test

When compared to each other, and not the ancestral values, kits 244708 and 366707 are not shown as matches to kit 166011 at 111 markers at Family Tree DNA, but are at 67 markers.  When possible, I match participants to a recreated ancestor (on my spreadsheet) as opposed to matching to each other within a surname project, because it gives us a common starting point, providing a more realistic picture of how the DNA mutated to be what it is today in each line.

The Kent Estes Y DNA falls within haplogroup R-L21.  From Eupedia, here’s a map of where haplogroup R-L21 is found.

R-L21

L21 is known for being Celtic, not Germanic, meaning not the same as Franks and Suebi.  Scholars are not unified in their interpretation of the maximum influence of the Celts.  Some show no influence at all in Italy, some show a slight eastern coastal influence and this genetic maps shows a Sicilian influence.

However, because nothing in genealogy can every be straightforward, and people are always migrating from place to place, there is one known exception.

According to Barry Cunliffe’s book, “The Celts, a Very Short Introduction”, in 391 BC Celts “who had their homes beyond the Alps streamed through the passes in great strength and seized the territory that lay between the Appennine mountains and the Alps” according to Diodorus Siculus. The Po Valley and the rest of northern Italy (known to the Romans as Cisalpine Gaul) was inhabited by Celtic-speakers.  While Este is somewhat north of this region, Este history indicates that there were fights with the Celts and then assimilation to some extent, so all is not entirely black and white.

The descendants of these invading Celts, having inhabited Italy for approximately 2500 years would be expected, today, to have some defining mutations that would differentiate them from their more northern European kinsmen and they would form a cluster or subgroup, perhaps a sub-haplogroup.

However, if the d’Este family was from the Mainz region of Germany, then Celtic influence in the Po Valley is irrelevant to their Y DNA.  Unfortunately, because this history is cast in warm jello, at best, we need to consider all possibilities.

The various haplogroup project administrators are working very hard to analyze all of the Big Y results within their haplogroup projects and to make sense of them.  By making sense of them, I mean in regards to the haplogroup and haplotree as a whole, not as individuals.  The point of individual testing is to provide information that citizen scientists can utilize to flesh out the haplotree, which in turn fleshes out the history of our ancestors.  So it’s a symbiotic relationship.

The Y DNA haplotree has gone from about 800 branches to 12,000 branches with the announcement of the Genographic 2.0 test in July of 2012 to over 35,000 SNPs that the Big Y is compared against.  And that doesn’t count the thousands of new SNPs discovered and yet unnamed and unplaced on the tree.

This scientific onslaught has been termed the “SNP tsumani” and it truly is.  It’s one of those wonderful, terrible, events – simply because there is so much good information it overwhelms us.  Fortunately, the force of the tsunami is somewhat mitigated by the fact that the haplotree is broken into haplogroups and subgroups and many volunteer administrators are working feverishly to assemble the results in a reasonable manner, determining what is a leaf, a twig and a branch of the tree.

Mike Walsh is one of the administrators who maintains the L21 project and tree and has been extremely helpful in this process, providing both guidance and analysis.  The project administrators have access to the results of all of the project participants, something individuals don’t have, so the project administrator’s assistance and perspective is invaluable.  We’d be lost without them

Mike has created an extended tree of the R-L21 haplogroup

R-L21 tree crop

The Estes men are here, in the DF49 group indicated by the red arrow.

The Estes men have tested positive for SNPs which include:

  • L21
  • DF13
  • DF49

Downstream, meaning closer in time to us, the haplogroup DF49 project administrator, Peter M. Op den Velde Boots, has created a tree rooted from the DF49 mutation.

I’m pleased to say that we are on that tree as well, towards the right hand side.  The ZP SNPs on this tree are placeholder names created by the administrator so he could create a tree until an official name is issued for Z SNP locations.

DF49 tree crop2

The interesting thing is that Mike Walsh had predicted that both the Estes and a few other surnames would fall into a common subgroup based on our unusual values at three different STR markers:

  • 460<=10
  • 413=23,24
  • 534>=17

Surnames that fell into Mike’s cluster based on Y STR marker values include:

  • Gallagher (Ireland)
  • Churchville (Ireland)
  • Killeen/Killian (Ireland)
  • Hall (England)
  • Mahon (Ireland)
  • Estes (England)

We’re seeing a lot of Irish names, and Ireland was settled by Celtic people.

Initially, the Estes men matched each other fairly closely, but had many differences from any other individuals who had tested.  I have bolded the Matthew descendant kit that is the furthest from the other men who descend from Abraham.

SNP Differences With Other Estes Men

John 244708 Edward 13805 Garmon 9993 Emory III366707 Howard 166011 Dennis 199378
John 244708 x 1 (Z2001) 0 2 (Z2001, F1314) 1 (Z2001) 2 (Z2001, PF682)
Edward 13805 1 (Z2001) x 0 1 (F1314) 0 0
Garmon 9993 0 0 x 1 (F1314) 0 0
Emory III 366707 2 (Z2001, F1314) 1 (F1314) 1 (F1314) x 1 (F1314) 1 (F1314)
Howard 166011 1 (Z2001) 0 0 1 (F1314) x 0
Dennis 199378 2 (Z2001, PF682) 0 0 1 (F1314) 0 x

SNPs are haplogroup subgroup defining mutations.  SNPs with a number assigned, as shown above, prefixed by a capital letter, means that the SNP has been registered and the originating letter indicates the lab in which it was found.  SNPs discovered in Big Y testing are prefixed by BY for example.

Not all SNPs with numbers assigned have been placed on the haplogroup tree, nor will they all be placed on the tree.  Some may be determined to be private or personal SNPs or not widespread enough to be of general interest.  One certainly doesn’t want the tree to become so subdivided that family members with the same surname and known ancestor wind up in different haplogroups, appearing to not be related.  Or maybe we have to redefine how we think of a haplogroup.

Case in point, these men with known, proven common Estes ancestors have differences on three SNPs, shown in the columns, below.

Estes Men Unique SNP Mutations

Z2001 F1314 PF682
John 244708 Yes No Yes
Garmon 9993 ? No ?
Edward 13805 No No ?
Emory III 366707 No Yes ?
Dennis 199378 No No No
Howard 166011 No No ?

What does this mean?

This means that John has developed two SNP mutations that none of the other Estes men have, unless some of the men with no-callls at that location, indicated by a ?, have that mutation.  The common ancestor of all of the Estes participants except Howard is Abraham Estes, so SNP Z2001 and PF682 have occurred in John’s line someplace since Abraham.

PF682 is quite interesting in that two Estes men, both descendants of Abraham did have results for this location, one with an ancestral value (Dennis) and one with a derived, or mutated, value (John.)  What is so interesting is that the four other men had ambiguous or unclear results at this location. In this case, I would simply disregard this SNP entirely since the results of reading this location seem to be unreliable.

Emory III, also a descendant of Abraham has developed a mutation at location F1314.

In these cases, these SNPs would fall into the category of line marker mutations that are found in that family’s line, but not in the other Estes lines.  These are similar to STR line marker mutations as well.

The next type of SNP mutation reported in the Big Y results are called Novel Variants.  Novel Variants are SNPs that haven’t yet been named, because they have just recently been discovered in the past few months in the testing process.  The Big Y test compares everyone against a data base of 36,288 known SNPs.  The balance of mutations found, called novel variants, are discoveries in the testing process.

Shared Novel Variants Between Estes Men

John 244708 Edward 13805 Garmon 9993 Emory III 366707 Howard 166011 Dennis 199378
John 244708 x 88 84 89 89 84
Edward 13805 88 x 84 88 89 85
Garmon 9993 84 84 x 83 84 81
Emory III 366707 89 88 83 x 89 87
Howard 166011 89 89 84 89 x 86
Dennis 199378 84 85 81 87 86 x

In essence, the Estes family has 30 differences from the DF49 base.  Translated, that means that in essence, our Estes family line broke away from the DF49 parent haplogroup about twice as long ago as the infamous M222 subclade named after Niall of the Nine Hostages.  So, our ancestor was the ancestor of Niall of the Nine Hostages too, some 4000 years or so ago.

Finally, a Gallagher male tested, and the Gallagher and Estes families share a block of DNA that no one else shares that is comprised of 18 different individual mutations.  As these things go, this is a huge number.

The numbers below are “addresses” on the Y chromosome because SNP names have not yet been assigned.  The first letter listed is the ancestral value and the second is the mutated value found in the Estes/Gallagher combined group.

  • 07457863-C-T
  • 07618400-G-A
  • 07738519-G-A
  • 07956143-A-G
  • 08432298-A-G
  • 14005952-AATAAATAA-A
  • 14029772-C-T
  • 15436998-C-T
  • 15549360-A-C
  • 16286264-C-T
  • 17833232-TT-T
  • 18417378-G-A
  • 18638729-A-G
  • 19402586-G-A
  • 22115259-T-C
  • 22445270-G-A
  • 22445271-A-G
  • 23560522-G-A

This DNA will very likely define a new subclade of haplogroup R and has been submitted to obtain SNP names for these mutation locations for the Estes/Gallagher subclade.  Unfortunately, they will not call it the Estes/Gallagher subclade, but we can for now:)

The Estes line still shares another dozen SNPs between themselves that are not yet shared by any other surname.  At this point, those are considered family SNPs, but if others test and those SNPs are found outside the Estes family, they too will receive SNP names and become a new subclade.

So how long ago did all of this happen?  When did we split, genetically, from the people who would become the Gallaghers?

The estimates for the number of average years per SNP creation vary, but range from 110 to 170.  Utilizing this range, when comparing how long ago the Gallagher and the Estes family shared a common ancestor, we find that our common ancestor lived between 1320 and 2040 years ago.  What we don’t know is whether that ancestor lived on continental Europe or in the British Isles.  Certainly, this was before the adoption of surnames.

Another interesting aspect of this testing is that the Estes and Gallagher families don’t match above 12 markers, but they do match at 12 markers with one mutation difference.  If the Estes and Gallagher participants weren’t in the same haplogroup project, they wouldn’t even see this match since they do have 1 difference at 12 markers and only exact 12 marker matches are shown outside of projects.  This shows that sometimes very basic STR testing can reach far back in time if (multiple) mutations haven’t occurred in those first 12 markers.

I was interested to check the TIP calculator to see how closely in terms of generations the calculator expected the common ancestor to be at the 50th percentile, meaning the point at which the common ancestors is equally as likely to be earlier as later.  The calculator indicated that 17 generations was at the 50th percentile, so about 425 to 510 years ago, allowing 25-30 years per generation.  At 24 generations, or 600-720 years, which is as far as the calculator reaches, the likelihood of a common ancestor was still only at 68% and the TIP calculator would reach the 100th percentile at about the 34th generation, or 850-1020 years – if it reached that far.

It’s interesting to compare the results of the two tools.  Both agree that the common ancestor is far back in time, and extrapolating now, very likely before the advent or surnames.  The SNP estimate of 1320-2040 does not overlap with the STR estimate of 850-1020 – although in all fairness, a 12 marker TIP estimate is expecting a lot in terms of this kind of extrapolation.

After the Gallagher and Estes lines split, probably between 1300 and 2000 years ago, or between 700AD and the time of Christ, did the Estes men then find their way to Italy by the year 900 when the d’Este family is unquestionably found in Italy, and back again to Europe before we find Nicholas in Kent in 1495AD?  It’s possible, but quite unlikely.  We also have found absolutely no DNA, either utilizing STR markers or SNPs that suggest any connection with any line in or near Italy.

The Estes line is and was unquestionably L21, a haplogroup closely allied with the Celts for the past 4,000 to 5,000 years, with no indication of an Italian branch.  Unless very unexpected new data arises, I think the Estes family can put the d’Este family story away, at least as far as cold storage – unless new data arises in the form of a proven male Y-line d’Este descendant testing or matching Italian L21 DNA participants.

As it turns out, the DNA was simply the final blow to the d’Este story.  As I worked with English and European historical records, and in particular records of wealthy nobles and lesser nobles, I came to realize that children were an asset of the families to be married off for political and social favor.  This sounds terrible by today’s cultural standards, but by the standards of the times in which our ancestors were living, politically advantageously arranged marriages were the best way to provide for your children’s well-being as well as your own.  What this means to us is that no royal d’Este family member would ever have fallen into the working, peasant class.  Even if they weren’t loved or even liked, they were still valuable and would simply have been married off far away.  Our Estes family was a group of hard-working mariners in Deal, certainly not nobility.  And now we know, they were Celts in Europe before they were Deal mariners.

Our more realistic claim to royalty, albeit very distant, lies in the fact that our ancestors were also the ancestors of the Irish King, Niall of the Nine Hostages, King of Tara who died about the year 405 and was the progenitor of the Ui Neill family that dominated Ireland from the 6th to the 10th centuries.  Niall of the Nine Hostages and his descendants were very prolific, with about 3 million people being descendants.  This means that the Estes family is distant cousins to just about everyone.  It indeed, is a very small world, made smaller by the connections we can now make via DNA.

celtic tree

______________________________________________________________

Disclosure

I receive a small contribution when you click on some of the links to vendors in my articles. This does NOT increase the price you pay but helps me to keep the lights on and this informational blog free for everyone. Please click on the links in the articles or to the vendors below if you are purchasing products or DNA testing.

Thank you so much.

DNA Purchases and Free Transfers

Genealogy Services

Genealogy Research

Demystifying Autosomal DNA Matching

dna word cluster4

What, exactly, is an autosomal DNA match?

Answer:  It’s Relative

I’m sorry, I just had to say that.

But truthfully, it is.

I know this sounds like a very basic question, and it is, but the answer sometimes isn’t as straightforward as we would like for it to be.

Plus, there are differences in quality of matches and types of matches.  If you want to sigh right about now, it’s OK.

We’ve talked a lot about matching in various recent articles.  I have several people who follow this blog religiously, and who would rather read this than, say, do dishes (who wouldn’t).  One of our regulars recently asked me the question, “what, exactly, is a match and how do I tell?”

Darned good question and I wish someone had explained this to me so I wouldn’t have had to figure it out.

In the computer industry, where I spent many years, we have what we call flow charts or wernier diagrams which in essence are logic paths that lead to specific results or outcomes depending on the answers at different junctions.

flow chart

I had a really hard time deciding whether to use the beer decision-making flow chart or the procrastinator flow chart, but the procrastinator flow chart was just one big endless loop, so I decided on the beer.

What I’m going to do is to step you through the logic path of finding and evaluating a match, determining whether it’s valid, identical by descent or chance, when possible, and how to work with your matches and what they mean.

Let me also say that while I use and prefer Family Tree DNA, these matching techniques are universal and apply to results from 23andMe as well, but not for Ancestry who gives you no browser or tools to compare your DNA to anyone else.  So, you can’t compare your results at Ancestry.

Comparing DNA results is the lynchpin of genetic genealogy.  You’re dead in the water without it.  If you have tested at Ancestry, you can always transfer your results to Family Tree DNA, where you do have tools, and to GedMatch as well.  You’re always better, in terms of genealogy, to fish in as many ponds as possible.

Before we talk about how to work with matches, for those who need to figure out how to find matches at Family Tree DNA and 23andMe, I wrote about that in the Chromosome Browser War article.  This article focuses on working with matching DNA after you have found that you are a match to someone – and what those matches might mean.

Matching Thresholds

All autosomal DNA vendors have matching thresholds.  People who meet or exceed those thresholds will be shown on your match list.  People who do not meet the initial threshold will not be considered as a match to you, and therefore will not be on your match list.

Currently, at Family Tree DNA, their match threshold to be shown as a match is about 20cM of total matching DNA and a single segment of about 7.7cM with 500 SNPs or over. The words “about” are in there because there is some fuzziness in the rules based on certain situations.

After you meet that criteria and you are shown as a match to an individual, when you download your matching data, your matches to them on each chromosome will be shown to the 1cM and 500 SNP level

At 23andMe, the threshold is 7cMs/700 SNPs for the first segment.  However, 23andMe has an upper limit of people who can match you at about 1000 matches.  This can be increased by the number of people you are communicating or sharing with.  However, your smallest matches will be dropped from your list when you hit your threshold.  This means that it’s very likely that at least some of your matches are not showing if you have in excess of 1000 matches total.  This means that your personal effective cM/SNP match threshold at 23andMe may be much higher.

Step 1 – Downloading Your Matching Segments

For this comparison, I’m starting with two fresh files from Family Tree DNA, one file of my own matches and one of my mother’s matches.  My mother died before autosomal DNA testing was available, so her results are only at Family Tree DNA (and now downloaded to GedMatch,) because her DNA was archived there.  Thank you Family Tree DNA, 100,000 times thank you!!!

At Family Tree DNA, the option to download all matches with segment information is on the chromosome browser tab, at the top, at the right, shown below.

ftdna download button

If you have your parents DNA available to test and it hasn’t been tested, order a kit for them today.  If either or both parents have been tested, download their results into the same spreadsheet with yours and color code them in a way you will understand.

In my case, I only have my mother’s results, and I color coded my matches pink, because I’m the daughter.  However, if I had both parents, I might have colored coded Mother pink and Dad blue.

Whatever color coding you do, it’s forever in your master spreadsheet, so make a note of what it is.  In my case, it’s part of the match column header.  Why is it in my column header?  Because I screwed up once and reversed them in a download.

Step 2 – Preparing and Sorting Your Spreadsheet

In my master DNA spreadsheet, I have the following columns,

dna master header

The green cell matches are matches to me from 23andMe.  My cousin, Cheryl also tested at 23andMe before autosomal testing was offered at Family Tree DNA.

The Source column, in my spreadsheet, means any source other than FTDNA.  The Ignore column is an extraneous number generated at one time by downloads.  I could delete that column now.

The “Side” column is which side the match is from, Mom or Dad.  Mom’s I can identify easily, because I have her DNA to compare to.  I don’t identify a match as Dad’s without having identified an ancestral line, because I don’t have his DNA to compare to.

And no, you can’t just assume that if it doesn’t match Mom, it’s an automatic match to Dad because you may have some IBS, identical by chance, matches.

The Common Ancestors/Comments column is just that.  I include things like when I e-mailed someone, if the match is triangulated and if so, with whom, etc.

In my master spreadsheet, the first “name” column (of who tested) is deleted, but I’ve left it in the working spreadsheet (below) with my mother for illustration purposes.  That way, neither of us has to remember who is pink!

Step 3 – Reviewing IBD and IBS Guidelines

If you need a refresher on, phasing, IBD, identical by descent, IBS which can mean either identical by chance or identical by population, it would be a good time to read or reread the article titled How Phasing Works and Determining IBD Versus IBS Matches.

Let’s briefly review the IBD vs IBS guidelines, because we’ll be applying them in this article.

Identical by Chance – Can be determined if an individual you match does not match to one of your parents, if parents are available.  If parents are not available for matching, IBS by chance segments won’t triangulate with other known genealogical matches on a common segment.

Identical by Descent – Can be suggested if a common ancestor (or ancestral line) can be determined between any two people who are not known relatives. If the two people are known close relatives, and their DNA matches, identical by descent is proven.  IBD can be proven with previously unknown family or genealogical matches when any three people descending from that same ancestor or ancestral line all match each other on the same segment of DNA.  Three way matching is called triangulation.

Identical by Population – Can be determined when multiple people triangulate with you on a specific segment of DNA, but the triangulated groups are from proven different lineages and are not otherwise related.  This is generally found in smaller segments from similar regions of the world.  Identical by population is identical by descent, but the ancestors are so far back in time that they cannot be determined and may contribute the same DNA to multiple lineages.  This is particularly evident in Jewish genealogy and other endogamous groups.

Step 4 – Determining Parental Side and IBS by Chance

The first thing to do, if you have either or both parents, is to determine whether your matches phase to your parents or are IBS by chance.

In this context, phasing means determining whether a particular match is to your father’s side of the family or to your mother’s side of the family.

Remember, at every address in your DNA, you will have two valid matches to different lines, one from your mother and one from your father.  The address on your DNA consists of the chromosome number which equates to the street name, and then the start and end locations, which consists of a range of addresses on that street.  Think of it as the length of your property on the street.

First, let’s look at my situation with only my mother’s DNA for comparison.

It’s easy to tell one of three things.

  1. Do mother and I both match the person? If so, that means that DNA match is from mother’s side of the family. Mark it as such. They are green, below.
  2. If the individual does not match me and mother, both, and only matches me, then the match is either on my father’s side or it’s IBS by chance. Those matches are blue below. Because I don’t have my father’s DNA, I can’t tell any more at this step.
  3. Notice the matches that are Mom’s but not to me. That means that I did not receive that DNA from Mom, or I received a small part, but it’s not over the lowest matching threshold at Family Tree DNA of 1cM and 500 SNPs.

match mom

In this next scenario, you can see that mother and I both match the same individual, but not on all segments.  I selected this particular match between me, my mother and Alfred because it has some “problems” to work through.

match mom2

The segments shown in green above are segments that Mom carries that I don’t.  This means that I didn’t receive them from mother.  This also means they could be  matching to Alfred legitimately, or are IBS by chance.  I can’t tell anything more about them at this point, so I’ve just noted what they are.  I usually mark these as “mother only” in my master spreadsheet.

match mom3

The first of the two green rows above show a match but it’s a little unusual.  My segment is larger than my mothers.  This means that one of five things has happened.

  1. Part of this segment is a valid match.  At the end, where we don’t match, the match extends IBS by chance a bit at the end, in my case, when matching Alfred. The valid match portion would end where my mother’s segment ends, at 16,100,293
  2. There is a read error in one of the files.
  3. The boundary locations are fuzzy, meaning vendor calculations like ‘healing’ for no calls, etc..
  4. I also match to my father’s line.
  5. Recombination has occurred, especially possible in an endogamous population, reconnecting identical by population segments between me and Alfred at the end of the segment where I don’t match my mother’s segment, so from 16,100,293 to 16,250,884.

Given that this is a small segment, the most likely scenario would be the first, that this is partly valid and partly IBS by chance.  I just make the note by that row.

The second green segment above isn’t an exact match, but if my segment “fits within” the boundaries of my mother’s segments, then we know I inherited the entire segment from her.  Once again, my boundaries are off a bit from hers, but this time it’s the beginning.  The same criteria applies as in 1-5, above.

match mom4

The green segments above are where I match Alfred, but my mother does not.  This means that these segments are either IBS by chance or that they will match my father.  I don’t know which, so I simply label them.  Given that they are all small segments, they are likely IBS by chance, but we don’t know that.  If we had my father’s DNA, we would be able to phase against him, too, but we don’t.

Now, if I was to leave this discussion here, you might have the impression that all small segment matches have problems, but they don’t.  In fact, here’s a much more normal “rea life” situation where mother and I are both matching to our cousin, Cheryl, Mom’s first cousin.  These matches include both large and small segments.  Let’s take a look and see what we can tell about our matches.

match mom complete

Roberta and Barbara have a total of 83 DNA matches to Cheryl.

Some matches will be where Barbara matches Cheryl and Roberta doesn’t.  That’s normal, Barbara is Roberta’s mother and Roberta only inherits half of Barbara’s DNA.  These rows where only Barbara, the mother, matches Cheryl are not colorized in the Start, End, cM and SNP columns, so they show as white.

Some matches will be exact matches.  That too is normal.  In some cases, Barbara passes all of a particular segment of DNA to Roberta.  These matches are colored purple.

Some of these matches are partial matches where Roberta inherited part of the segment of DNA from Barbara.  These are colored green. There are two additional columns at right where the percentage of DNA that Roberta inherited from Barbara on these segments is calculated, both for cM and SNPs.

Some of the matches are where Roberta matches Cheryl and Barbara doesn’t.  Cheryl is not known to be related to Roberta on her father’s side, so assuming that statement is correct, these matches would be IBS, identical by state, meaning identical by chance and can be disregarded at legitimate matches.  These are colored rust.  Note that most of these are small segments, but one segment is 8.8cM and 2197 SNPs.  In this case, if this segment becomes important for any reason, I would be inclined to look at the raw data file of Barbara to see if there were no calls or a problem with reads in this region that would prevent an otherwise legitimate match.

Let’s look at how these matches stack up.

Number Percent (rounded) Comment
Exact Matches 26 31 100% of the DNA
Barbara Only 20 24 0% of the DNA
Partial Matches 29 35 11-98% of the actual DNA matches
Roberta Only (IBS by chance) 7 8 Not a valid match

I think it’s interesting to note that while, on the average, 50% of the DNA of any segment is passed to the child, in actuality, in this example of partial inheritance, meaning the green rows, inheritance was never actually 50%.  In fact, the SNP and cM percentages inherited for the same segment varied, and the actual amounts ranged from 11-98% of the DNA of the parent being inherited by the child.  The average of these events was 54.57143 (cM) and 54.21429 (SNPs) however.

On top of that, in 13 (26 rows) instances, Roberta inherited all of Barbara’s DNA in that sequence, and in 20 cases, Roberta inherited none of Barbara’s DNA in that sequence.

This illustrates that while the average of something may be 50%, none of the actual individual values may be 50% and the values themselves may include the entire range of possibilities.  In this case, 11-98% were the actual percentage ranges for partial matches.

Matching Both Parents

I don’t have my father’s DNA, but I’m creating this next example as if I did.

match both parents

Matches to mother are marked in green.

I have two matches where I match my father, so we can attribute those to his side, which I’ve done and marked in orange.

The third group of matches to me, at the bottom, to Julio, Anna, Cindy and George don’t match either parent, so they must be IBS by chance.

I label IBS by chance segments, but I don’t delete them because if I download again, I’ll have to go through this same analysis process if I don’t leave them in my spreadsheet

Step 5 – How Much of the DNA is a Match?

One person asked, “exactly how do I tell how much DNA is matching, especially between three people.”  That’s a very valid question, especially since triangulation requires matching of three people, on the same segment, proven to a common ancestral line.

Let’s look at the match of both me and my mother to Don, Cheryl and Robin.

match mom part

In this example, we know that Don, Cheryl and Robin all match me on my mother’s side, because they all three match me and my mother, both on the same segment.

How do we determine that we match on the same segment?

I have sorted this spreadsheet in order of end location, then start location, then chromosome number so that the entire spreadsheet is in chromosome order, then start location, then end location.

We can see that both mother and I match Cheryl partially on this segment of chromosome 1, but not exactly.  The start location is slightly different, but the end location matches exactly.

The area where we all three match, meaning me, Mom and Cheryl, begins at 176,231,846 and ends at the common endpoint of 178,453,336

On the chart below, you can see that mother and I also both match Don, Cheryl’s brother, on part of this same segment, but not all of the same segment.

match mom part2

The common matching areas between me, Mom and Don begins at 176,231,846 and ends at 178,453,336.

Next, let’s look at the third person, Robin.

Mom and I both match Robin on part of this same overlapping segment as well.  Note that my segment extends beyond Mom’s, but that does not invalidate the portion that does match between Robin, Mom and I.

match mom part3

Our common match area begins at the same location, but ends at 178,453,336, the same location as the common end area with Don and Cheryl

Step 6 – What Do Matches Mean? IBD vs IBS in Action

So, let’s look at various types of matches and what they tell us.

match mom example

Looking at our matching situation above, let’s apply the various IBD/IBS rules and guidelines and see what we have

1. Are these matches identical by chance?  No.  How do we know?

a. Because they all match both me and a parent.

2. Are these matches identical by descent? Yes. How do we know?

a. Because we all match each other on this segment, and we know the common ancestor of Cheryl, Don, Barbara and me is Hiram Ferverda and Evaline Miller.  We know that Robin descends from the same ancestral Miller line.

3. Are these matches identical by population.  We don’t know, but there is no reason at this point to think so. Why?

a. Because looking at my master spreadsheet, I see no evidence that these segments are also assigned to other lineages. These individuals are also triangulated on a large number of other, much larger, segments as well.

4. Are these matches triangulated, meaning they are proven to a common ancestor? Yes. How do we know?

a. Documented genealogy of Hiram Ferverda and Evaline Miller. Don, Barbara, Cheryl and me are known family since birth.
b. Documented genealogy of Robin to the same ancestral family, even though Robin was previously unknown before DNA matching.
c. Even without the documented genealogy, Robin matches a set of two triangulation groups of people documented to the same ancestral line, which means she has to descend from that same line as well.

In our case, clearly these individuals share a common ancestor and a common ancestral line.  Even though these are small segments on chromosome 1, there are much larger matching segments on other chromosomes, and the same rules still apply.  The difference might be at some point smaller segments are more likely to be identical by population than larger segments.  Larger segments, when available, are always safer to use to draw conclusions.  Larger groups of matching individuals with known common genealogy on the same segments are also the safest way to draw conclusions.

Step 7 – Matching With No Parents

Sometimes you’re just not that lucky.  Let’s say both of your parents have passed and you have no DNA from them.

That immediately eliminates phasing and the identical by chance test by comparing to your parents, so you’ll have to work with your matches, including your identical by chance segments.

A second way to “phase” part of your DNA to a side of your family is by matching with known cousins or any known family member.

In the situation above, matching to Cheryl, Don and Robin, let’s remove my mother and see what we have.

match no mom

In this case, I still match to both of my first cousins, once removed, Cheryl and Don.  Given that Cheryl and Don are both known cousins, since forever, I don’t feel the need for triangulation proof in this case – although the three of us are triangulated to our common ancestor.  In other words, the fact that my mother does match them at the expected 1st cousin level is proof enough in and of itself if we only had one cousin to test.  We know our common ancestor is Cheryl and Don’s grandparents, who are my great-grandparents, Hiram Ferverda and Evaline Miller.

When I looked at Robin’s pedigree chart and saw that Robin descended from Philip Jacob Miller and wife Magdalena, I knew that this segment was a Miller side match, not a Ferverda match.

Therefore, matching with someone whose genealogy goes beyond the common ancestor of Cheryl, Don and me proves this line through 4 more generations.  In other words, this DNA segment came through the following direct line to reach Me, Mother, Cheryl and Don.

  • Philip Jacob Miller and Magdalena
  • Daniel Miller
  • David Miller
  • John David Miller
  • Evaline Louise Miller who married Hiram Ferverda

Clearly, we know from the earlier chart that my mother carried this DNA too, but even if we didn’t know that, she obviously had to have carried this segment or I would not carry it today.

So, even though in this example, our parents aren’t directly available for IBS testing and elimination, we can determine that anyone who matches both me and Cheryl or me and Don will have also matched mother on that segment, so we have, in essence, phased those people by triangulation, not by direct parental matching.

Step 8 – Triangulation Groups

What else does this match group tell us?

It tells us that anyone else who matches me and any one of our triangulation group on that segment also descends from the Miller descendant clan, one way or another.

Why do they have to match me AND one of the triangulation group members on that segment?  Because I have two sides to my DNA, my Mom’s side and my Dad’s side.  Matching me plus another person from the triangulation group proves which side the match is on – Mom’s or Dad’s.

We were able to phase to eliminate any identical by chance segments people on Mom’s side, so we know matches to both of us are valid.

On Dad’s side, there are some IBS by chance people (or segments) thrown in for good measure because I don’t have my Dad’s DNA to eliminate them out of the starting gate.  Those IBS segments will have to be removed in time by not triangulating with proven triangulated groups they should triangulate with, if they were valid matches.

When you map matches on your chromosome spreadsheet, this is what you’re doing.  Over time, you will be able to tell when you receive a new match by who they match and where they fall on your spreadsheet which ancestral line they descend from.

GedMatch also includes a triangulation utility.  It’s a great tool, because it produces trios of people for your top 400 matches.  The results are two kits that triangulate to the third person whose kit number you are matching against.

The output, below, shows you the chromosome number followed by the two kit numbers (obscured) that triangulate at this location, and then the start and end location followed by the matching cMs.  The result is triangulation groups that “slide to the right.”

gedmatch triang group3

In the example above, all of the triangulation matches to me above the red arrow include either Mother, my Ferverda cousins or the Miller group that we discussed in the Just One Cousin article.  In other words they are all related via a common ancestor.

You can tell a great deal about triangulation groups by who is, and isn’t in them using deductive reasoning.  And once you’ve figured out the key to the group, you have the key to the entire group.

In this case, Mom is a member of the first triangulation group, so I know this group is from her side and not Dad’s side.  Both Ferverda cousins are there, so I know it’s Mom’s Dad’s side of the family.  The Miller cousins are there, so I know it’s the Miller side of Mom’s Dad’s side of the family.

Please also note that while this entire group triangulates within itself, that the group manages to slide right and the first triangulated group of 3 in the list may not overlap the DNA of the last triangulated group of 3.  In fact, because you can see the start and end points, you can tell that these two triangulated groups don’t overlap.  The multiple triangulation groups all do match some portion of the group above and below them (in this case,) and as a composite group, they slide to the right. Because each group overlaps with the group above and below them, they all connect together in a genetic chain.  Because there is an entire group that are triangulated together, in multiple ways, we know that it is one entire group.

This allows me to map that entire segment on my Mom’s side of my DNA, from 10,369,154 to 41,685,667 to this group because it is contiguously connected to me, triangulated and unbroken.  The most distant ancestor listed will vary based upon the known genealogy of the three people being triangulated  For example, part of this segment, may come from Philip Jacob Miller himself, the line’s founder,, but another part could come from his son’s wife, who is also my ancestor.  Therefore, the various pieces of this group segment may eventually be attributed to different ancestors from this particular line based upon the oldest common ancestor of the three people who have triangulated.

In our example above, the second group starts where the red arrow is pointing.  I have absolutely no idea which ancestor this second group comes from – except – I know it does not come from my mother’s side because her kit number isn’t there.

Neither are any of my direct line Estes or Vannoy relatives, so it’s probably not through that line either.  My Bolton cousins are also missing, so we’ve probably eliminated several possible lines, 3 of 4 great grandparents, based on who is NOT in the match group.  See the value of testing both close and distant cousins?  In this case, the family members not only have to test, they also have to upload their results to GedMatch.

Conversely, we could quickly identify at least a base group by the presence in the triangulation groups of at least one my known cousins or people with whom I’ve identified my common ancestor.  Two from the same line would be even better!!!

Endogamy

The last thing I want to show you is an example of what an endogamous group looks like when triangulated.

gedmatch endogamy

This segment of chromosome 9 is an Acadian matching group to my Mom – and the list doesn’t stop here – this is just the size of the screen shot.  These matches continue for pages.

How do I know this group is Acadian?  In part, because this group also triangulates with my known Lore cousin who also descends from the same Acadian ancestor, Antoine Lore, son of Honore Lore and Marie Lafaille.  Additionally, I’ve worked with some of these people and we have confirmed Honore Lore and Marie Lafaille as our common ancestor as well.  In other cases, we’ve confirmed upstream ancestors.

Unfortunately, the Acadians are so intermarried that it’s very difficult to sort through the most distant genetic ancestor because there tend to be multiple most distant ancestors in everyone’s trees.  There is a saying that if you’re related to one Acadian, you’re related to all Acadians and it’s the truth.  Just ask my cousin Paul who I’m related to 137 different ways.

Matches to endogamous groups tend to have very, very long lists of matches, even triangulated, which means proven, matches.

Oh, and by the way, just for the record, this lengthy group includes some of my proven Acadian matches that were trimmed, meaning removed, from my match list when Ancestry did their big purge due to their new and improved phasing.  So if there was ever any doubt that we did in fact lose at least some valid matches, the proof lies right here, in the triangulation of those exact same people at GedMatch

Summary

I hope this step by step article has helped take the Greek, or maybe the geek, out of matching.  Once you think of it in a step by step logical basis, it makes a lot of sense and allows you to reasonably judge the quality of your matches.

The rule of thumb has been that larger matches tend to be “legitimate” and smaller matches are often discarded en masse because they might be problematic.  However, we’ve seen situations where some larger matches may not be legitimate and some smaller matches clearly are.  In essence, the 50% average seldom applies exactly and rules of thumb don’t apply in individuals situations either.  Your situation is unique with every match and now you have tools and guidelines to help you through the matching maze.

And hey, since we made it to the end, I think we should celebrate with that beer!!!

beer

______________________________________________________________

Disclosure

I receive a small contribution when you click on some of the links to vendors in my articles. This does NOT increase the price you pay but helps me to keep the lights on and this informational blog free for everyone. Please click on the links in the articles or to the vendors below if you are purchasing products or DNA testing.

Thank you so much.

DNA Purchases and Free Transfers

Genealogy Services

Genealogy Research

Lazarus – Putting Humpty Dumpty Back Together Again

Recently, GedMatch introduced a tool, Lazarus, to figuratively raise the dead by combining the DNA of descendants, siblings and other relatives of long-dead ancestors to recreate their genome.  Kind of like piecing Humpty Dumpty back together again.

Humpty Dumpty

Blaine Bettinger wrote about using Lazarus here and here where he recreated the genome of his grandmother.  I’d like to use Lazarus to see how it works with one pair of siblings and a first cousin.  Blaine was fortunate to have 4 siblings.  I have a much smaller group of people to work with, so let’s see what we can do and how successful we are, or aren’t.  But first, lets talk about the basics and how we can reconstruct an ancestor.

The Basics

An individual has 6766.2 cM of DNA.  Both parents give half of their DNA to each child, but not exactly the same parental DNA is contributed to each child.  A random process selects which half of the parents’ DNA is given to each child.  Different children will have some of the same DNA from their parents, and some different DNA from each parent.

Obviously, the DNA contributed to each child from a parent is a combination of the DNA given to the parent by the grandparents.  Approximately half of the grandparent’s DNA is given to each child.  In many cases, the DNA contributed to the child from the grandparents is not actually divided evenly, and we receive all or nothing of individual segments, not half.  Half is an average that works pretty well most of the time.  It’s a statistic, and we all know about statistics…right???

Therefore, children carry 3383cM of each parent’s DNA.  Each sibling carries half of the same DNA from their parents.  From the ISOGG autosomal DNA statistics chart, each sibling actually carries 25% of exactly the same DNA from both parents, 50% where they inherited half of the same DNA from one parent and different DNA from the other parent, and 25% where the siblings don’t share any of the identical DNA from their parents. This averages 50%.

This chart, also from ISOGG, sums up what percentage of the same DNA different relatives can expect to carry.

cousin percents

Recreating Ferverda Brothers

I have a situation where I have a person, Barbara, and two of her first cousins, Cheryl and Don, who are siblings.  This is the same family we discussed in the Just One Cousin article.

Miller Ferverda chart

In this case, Cheryl and Don share 50% of Roscoe’s DNA.

Barbara shares 12.5% of Hiram and Evaline’s DNA with Cheryl and 12.5% with Don, but not the same 12.5%.  Since siblings share 50% of their DNA, Barbara should share about 12.5% of Cheryl’s DNA and an additional 6.25% that the Cheryl didn’t receive from Roscoe, but that Don did.

Translating that into cMs, Barbara should share about 850 cM with Cheryl and an additional 425 cM with Don, for an approximate total of 1275 cM.

At http://www.gedmatch.com, I selected the Tier 1 (subscription or donation) option of Lazarus and was presented with this menu.

lazarus menu

My first attempt was to recreate Barbara’s father, John W. Ferverda.  I allowed 100 SNPs and 4cM because I was hoping to be able to accumulate more than the required 1500cM of matching DNA for the kit to be utilized as a “real kit,” available for one-to-many matching.

100SNP 4cM 200SNP 4cM 300SNP 4cM 400SNP 4cM 500SNP 4cM 600SNP 4cM 700SNP 4cM
John W. Ferverda 1330.7 cM 1370.2 cM 1360.0 cM 1353.5 cM 1338.7 cM 1336.2 cM 1322.9 cM

I then experimented with the various SNP levels, leaving the cM at 4.

The resulting number of cM of just over 1300, no matter how you slice and dice it, is very near the expected approximation of 1275.

Using the Lazarus tool, I created “John Ferverda” by listing Barbara as his descendant and both Cheryl and Don as cousins.

To create “Roscoe Ferverda,” I reversed the positions of the individuals, listing Don and Cheryl as descendants and Barbara as the cousin.

Lazarus options

These two created individuals, “John” and “Roscoe” should be exactly the same, and, thankfully, they were.

Both recreated “John” and “Roscoe” represent a common set of DNA from the parents of both of these men, Hiram Ferverda and Evaline Miller based on the matching DNA of their descendants, Barbara, Cheryl and Don.

The way Lazarus works is that all kits in Group 1, the descendants, are compared with Group 2, other relatives but not descendants.  The descendants will carry some of Roscoe’s DNA, but also the DNA of Roscoe’s wife, the mother of Don and Cheryl.  By comparing against known relatives but not direct descendants, Lazarus effectively narrows the DNA to that contributed only by the common ancestor of group 1 and group 2.  In this case, that common ancestor would be John and Roscoe’s parents, Hiram Ferverda and Evaline Miller.  By comparing the descendant and non-descendant-but-otherwise-related groups, you effectively subtract out the mother’s DNA from the descendants – in this case meaning the DNA of John Ferverda’s wife and Roscoe Ferverda’s wife.

In other words, the descendants, above, are NOT compared to each other, but instead, to each one of the not-descendant-but-otherwise-related group.

Unfortunately, none of the kits generated was over the 1500 cM threshold.  I remembered that there is also a second cousin, Rex, whose DNA we can add because he descends from the parents of Evaline Miller.

Adding Rex to the mix brought the resulting “Roscoe” kit to 1589.7 cM and the resulting “John” kit to 1555.7 cM, both now barely over the 1500 threshold – but over just the same and that’s all that matters.  Soon, we’ll be able to utilize both of these kits for direct matching as a “person” at GedMatch.  Now how cool is that???

You receive four pieces of output information when you create a Lazarus kit.

First, a comparison between the descendants (Group 1 above, Kit 2 below) and each of the cousins and related-but-not-descendants individuals (Group 2 above, Kit 1 below), by chromosome.

John W. Ferverda

Processed: 2015/01/09 17:32:41
Name: John W. Ferverda
SNP threshold = 100 cM
Threshold = 4.0 cM
Batch processing will be performed if resulting kit achieves required threshold of 1500 cM.

Contributions:

Kit 1

Kit 2

Chr

Start

End

cM

F9141

M133930

1

72017

5703284

14.8

F9141

M133930

1

17271101

18589169

4.1

F9141

M133930

1

32804999

65722466

37.8

F9141

M133930

1

242601404

247174776

8.5

Obviously, these are only snippets of the output for chromosome 1.  You receive a chart of this same information for all of the chromosomes of the people being compared.

Second, a chart that shows the resulting matching segments.

Resulting Segments:

Chr

Start

End

cM

1

742429

5694404

14.8

1

17285357

18588145

4.1

1

38226163

43823334

7.2

1

43975578

54990495

8.0

1

55040097

62847030

12.1

1

76341094

85237614

8.7

1

242606491

247179501

8.5

At the bottom of this second set of numbers is the all-important total cM.  This is the only place you will find this number

Total cM: 1555.7

Third, a list of the original kits that have match results between the two groups.

Original Kits match with result:

Kit

Chr

Start

End

cM

F9141

1

742429

5700507

14.8

F9141

1

10899689

12530765

4.5

F9141

1

35075204

65714854

35.3

F9141

1

76334120

85252045

8.7

F9141

1

242606379

247169190

8.5

M133930

1

742429

5705356

14.8

M133930

1

35075956

65714854

35.3

M133930

1

242606491

247165725

8.5

F50000

1

10899689

12530765

4.5

F153785

1

742584

5700507

14.8

F153785

1

76337055

85252045

8.7

F153785

1

242606379

247169190

8.5

And finally, a summary.

196074 single allele SNPs were derived for the resulting kit.
37068 bi-allelic SNPs were derived for the resulting kit.
233142 total SNPs were derived for the resulting kit.
Kit number of Result: LX056148
Kit Name: John Ferverda 8
Your Lazarus file has been generated.

Is this as good as the real McCoy, meaning swabbing John and Roscoe?  Of course not, but John and Roscoe aren’t available for swabbing.  In fact, John and Roscoe are both probably finding this pretty amusing from someplace on the other side, watching their children “recreate” them!

I can hear them now, shaking their heads, “Well I never….”

They should have known if they left Cheryl and me here, together, unsupervised that we would do something like this!!!

______________________________________________________________

Disclosure

I receive a small contribution when you click on some of the links to vendors in my articles. This does NOT increase the price you pay but helps me to keep the lights on and this informational blog free for everyone. Please click on the links in the articles or to the vendors below if you are purchasing products or DNA testing.

Thank you so much.

DNA Purchases and Free Transfers

Genealogy Services

Genealogy Research

Just One Cousin

Recently, someone wrote to me and said that they thought the autosomal DNA matching between groups of family members was wonderful, but they have “just one first cousin” and feel left out.  So, I decided to see what could be done with just two cousins.  In this case, the two cousins are full siblings and both first cousins to my mother, Barbara.  This would be the same process whether there was one or two cousins, since the two are siblings. Utilizing two cousins who are siblings just gives me the advantage of additional matching and triangulation capabilities.

This does presume that both people involved are willing to share and do a bit of comparison work on their various DNA accounts.  In other words, you can’t do this by yourself without cooperation from your cousin.

Here’s the common ancestor of our testers.

Miller Ferverda chart

Barbara, Cheryl and Don took a Family Finder autosomal DNA test at Family Tree DNA.

The DNA shared by Barbara, Cheryl and Don is from their common ancestral couple, Hiram B. Ferverda and Evaline Louise Miller.

Some of that shared DNA will be Hiram’s Ferverda DNA and some will be Evaline’s Miller DNA.  The only way to differentiate between the Ferverda and Miller DNA is to test people who are only Ferverda or only Miller, descendants of people upstream of Hiram and Evaline, and if there are any common segments between the testers and those Ferverda or Miller individuals, you can then assign that DNA segment to that side of the family – Miller or Ferverda.

I’m using Barbara’s chromosome as the “match to” background, below.  Cheryl, in orange, and Don, in blue, are shown as matches to Barbara.  You can see that these three people share a lot of their grandparents DNA.  You can also see where Don and Cheryl didn’t inherit the same DNA from their father, in some instances, like on chromosome 1 below, where Cheryl (orange) matches Barbara on a much larger part of the chromosome than Don does (blue.)  But then look at chromosome 13 where Barbara and Don match on a huge segment and Cheryl, just a small portion.  Don and Cheryl inherited different DNA from their parents at these locations.

Two cousins browser

The three testers’ common DNA segments on chromosome 1 are shown in the table below.  I’ve colored Cheryl’s pink and her brother, Don’s, blue.  You can see that Barbara matches some segments with Don that Cheryl didn’t inherit from her parents.  All of the DNA Barbara matches with Cheryl on this chromosome is also matched, at least in part, in that location, with Don.  The chart below, matches the graphic above, for chromosome 1 and is the “view data in a table” option on the chromosome browser as well as the leftmost “download to excel” option.  The download to excel option at right downloads all of the matches for the individual, not just the ones currently showing in the chromosome browser.

Two cousins combined

When at least two known relatives have tested, we have something to compare against.  In this case, we have a total of 3 people, 2 siblings and a first cousin, before we start matching outside known family.  We don’t know which of their shared DNA comes from which ancestor, but we can now look for people who match Barbara and at least Cheryl OR Don which proves a common ancestor between the three individuals.  Matching Barbara, Cheryl AND Don would be even better.

The gold standard for DNA matching, called triangulation, that proves a particular segment to a specific ancestor is as follows.

  • All (at least 2) people match you on the same segment.
  • Those people also match each other on the same segment.
  • Meaning, at least three people with a known common ancestral line must match on the same segment.

The key word here is “on the same segment”.

The next thing to do is to find out which of Barbara’s, Cheryl’s and Don’s matches are “in common with” each other.  This means Barbara, Cheryl and Don all share a matching segment with these other people, but without additional analysis, we can’t determine whether they share a match on the same segment or not.

I ran Barbara “in common with” Cheryl and you can see that the first two people returned on that match list were me and Don because matches are listed in the order of the largest cM of shared data first.  The “in common with” tool is the blue crossed arrows, below.

Two cousins ICW

Next I ran Barbara in common with Don.

There were a total of 43 people in common with Cheryl and 49 with Don.

I downloaded the matching individuals (download link at the bottom right of the match page) and sorted them in a spreadsheet to see who matches whom. Here’s what the first part of my spreadsheet looks like (sorted in chromosome and segment order.)  I colorized the rows by cousin for easier visualization.

Two cousins match example

We have 92 total matching individuals in common with Barbara and Cheryl and then Barbara and Don.  A total of 19 people are listed as matching BOTH Cheryl and Don (for a total of 38 rows in the spreadsheet), so that means that there are 54 people who are in common with either Barbara and Cheryl or Barbara and Don, but not in common with all 3, Barbara AND Cheryl AND Don.  This illustrates how differently siblings inherit DNA from their parents and how it affects matches another generation later.

In Common With Matches To both Don and Cheryl To Cheryl only or Don only, but not both
Barbara 19 (38 rows of 92) 54

Clearly, the people who match all three individuals, Barbara, Cheryl and Don are likely the closest relatives.

So let’s focus on those closest matching people.  If you were utilizing only one cousin here, you would simply utilize every “in common with” match between two individuals and move forward.  Because I have siblings here, and because I don’t want to deal with 72 different people, I’m using the fact that they are siblings to focus my efforts on the most closely related matches – people who match Barbara AND both siblings.  You could also limit your focus by something like a common ancestral surname between all match members.

The next step is for each tester, meaning Barbara, Cheryl and Don, to compare each individual on the common match list to their DNA.  This means that Barbara, Cheryl and Don all three will compare to all 18 individuals.  We now have only 18 matching people, instead of 19, because I removed my own matches, since mine are a subset of Barbara’s.  Checking to see how each of our testers matches each common matching person is the only way to determine that there is a three (or 4) way triangulation that will confirm a common ancestor.

There are two ways to do this at Family Tree DNA.

1. You can, 5 matches at a time, compare in the chromosome browser, then download only the matching segments to a spreadsheet for those 5 individuals. This means 4 sets of matches for each of three people.

Two cousins browser download

2. You can download Barbara, Cheryl and Don’s entire segment match list and then eliminate the matches that aren’t relevant to the discussion – meaning everyone except the 18 common matches between the three people.

The download option for the entire segment match list for the person whose kit you are looking at is shown at the top of the chromosome browser, to the right.  Downloading the currently showing individuals matching segments is shown at the top of the chromosome browser, to the left.

Because we can only push 5 people at a time to the chromosome browser, in this case, it will be easier to simply download all of the matches for each of the three individuals and then put them into a common spreadsheet and sort by the names we determined match in common between all three cousins.

I downloaded all of the matches for Barbara, Cheryl and Don, colorized them and then sorted them in the spreadsheet by the name of who they matched.  I then searched for the names of the 18 individuals who matched Barbara, Cheryl and Don, and copy/pasted them into a separate spreadsheet.

I could then sort the 18 matching individuals results by chromosome and start and end location.

two cousin matches

Barbara’s DNA matches are white rows, Cheryl’s are pink and Don’s are blue.

The segments where Barbara, Don and Cheryl all match more than one other person on an overlapping area of their DNA segments are colorized green.  This means that 4 or more people match on that same identical segment, the three known cousins and at least one other person.

The segments where at least Barbara and either Don or Cheryl (but not both) match at least one other person are colorized yellow. This means that least three people match on that same segment.

Since the gold standard of triangulation is 3 individuals matching on the same segment, both the yellow and green segments contain matches that fall into this category and are triangulated.  All of those segments match at least two of the cousins, who match each other, plus in some cases, additional people too.

Let’s walk through one triangulation sequence.

In the green cluster, above, you can see that Barbara, Cheryl and Don all match Arthur on overlapping portions of the same segment.  The overlapping portion between all 3 individuals and Arthur runs from 49,854,186 to 53,551,492.  In addition, both Don and Cheryl match Tiffany on part of that same segment and Barbara matches Dean on part as well.  These segments aren’t exactly the same for any of the cousins, with different amounts of matching DNA as reflected in the different cM and SNP values.

So, who is triangulated based on just this one green cluster?  Barbara, Cheryl, Don and Arthur are triangulated to a common ancestor.  We know that common ancestor is either the common ancestor of Cheryl, Don and Barbara – Hiram Ferverda and Evaline Miller – or upstream of that couple.

Tiffany is triangulated to both Cheryl and Don, but since Cheryl and Don are siblings, that’s irrelevant at this point – meaning we can’t tell if that match is IBS by chance or real because there is no additional match – at least not in this cluster.

In total, there are 19 green clusters (triangulated to at least 4 people) and 12 yellow clusters (triangulated to at least 3 people.)

In other words, the DNA that came from Hiram Ferverda and Evaline Miller is present in these matching people as well.  The million dollar question, is, of course, which upstream ancestor did it come from?  We genealogists are never satisfied, are we?  Every answer just leads to more questions.

Before we begin looking at the DNA results and discussing what they mean, I want to share with you the family tree of Hiram Ferverda and Evaline Miller, because the DNA of the people who match Don, Cheryl and Barbara had to come from these people as well.  This chart shows 7 generations back from Barbara, Cheryl and Don.  The common ancestors of the people with whom they triangulate are likely to be within this timeframe.

two cousins fan chart

The colorized ancestors above are the ancestors who contributed the X chromosome to both John Ferverda, Barbara’s father and Roscoe Ferverda, Cheryl and Don’s father.

In my working example, below, I’m utilizing the matches on chromosome 14 because chromosome 14 includes examples of a couple of interesting features.

Two cousins chr 14

Let’s look at the first green grouping.  All three cousins match to SB and then Barbara matches also to Constance and William, our Lentz cousin on part of that overlapping segment as well.  This suggests that this grouping might come from the Lentz side of the Miller tree, although we’ll see something else in a minute that might give us pause to reflect.  So just hold that thought.  Regardless, it does tell us that these individuals do share a common ancestor and it’s on the Miller side, not the Ferverda side.

The second green grouping is larger and includes larger segments as well, which are more reliably used, although the smaller green cluster clearly meets and exceeds the triangulation requirement of 3 matching individuals on the same segment.

This larger green cluster is actually quite interesting, because there are a total of 4 individuals, Ellen, Arthur, Eric and Tiffany who are all triangulated on this same segment with Don, Cheryl and Barbara.  So, not only are they triangulated to Don, Cheryl and Barbara, but also to each other.  These 7 people all share a common ancestor.

The yellow grouping shows an area where Eric matches Barbara and Don plus Arthur as well, but not Cheryl.  We don’t know anything about Arthur or Eric’s genealogy, so we don’t know if this is Miller or Ferverda DNA, at least not yet.  We’ll learn more about Arthur and Eric in a minute, even without their genealogy!

There are a couple of other areas on other chromosomes that are of interest too.

On this cluster on chromosome 12, we find a known Miller cousin, Rex, 2nd cousin to Barbara, Cheryl and Don.  Because Rex also descends from the parents of Evaline Miller, we know that this segment shared with Rex has to be Miller DNA, not Ferverda DNA.

Two cousins chr 12

On this segment of chromosome 3, below, we see that Barbara, Cheryl and Don match Herbert, another known Miller cousin, plus Dee and Constance in much smaller amounts on the same segment.  This tells us that this segment is descended from our common ancestor with Herbert.

Two cousins chr 3

Barbara, Don and Cheryl’s common ancestor with Herbert is Daniel Miller and Elizabeth Ulrich (Ullery), which makes them third cousins once removed – except – Herbert got a second dose of Miller DNA because Daniel Miller’s son, Isaac, married his first cousin who was also a Miller and shared grandparents with him.  So Herbert, genetically, is closer than he would appear since he received the double dose of Miller DNA three generations upstream.

Gotta love these close knit families.  The Millers were Brethren.  These double doses of family DNA often carry forward by matching downstream when they might otherwise not be expected do so.  That’s the upside of these endogamous groups.  Now, here’s the downside.

Two cousins chr 7

See the segments with the words problem written to the right?  Do you recognize what the problem is?  You’ll notice that in the matching group we have BOTH cousin Herbert who is a Miller (and not a Lentz) and cousin William who is a Lentz (and not a Miller.)

This is a very common situation in endogamous communities.

To make matters worse, we are dealing with very small segments here, where we often see confusion.  However, let’s look at the possibilities.

We do have triangulation, so one of three things has happened here.

First, the Brethren are an endogamous population that intermarried nearly exclusively within their faith.  The Lentz and Miller families were both Brethren.

Here are our possibilities.

  1. Our Lentz cousin has some Miller in one of his lines. This is entirely possible since he has a “short” pedigree chart and his families are living in the same Brethren communities as the other Lentz and Miller families.
  2. Our Miller cousin has some Lentz in one of his lines. That is less likely, because his genealogy is pretty well fleshed out, although certainly possible because, once again, the families were living within close proximity and attending the same churches, etc.
  3. This segment is truly a population based segment and will be found in people descending from that same base population. If this is the case, we still received it from one of our ancestors who came from that population, but since the Lentz and Miller lines may have both carried this same segment, we can’t tell who it came from. In other words, their common ancestor is further back in time than the Lentz and Miller families found in the US.

This segment cannot be IBS by chance because it does triangulate with the three cousins, Barbara, Don and Cheryl.  The definition of IBS by chance shows us that chance segments would not phase (or match with) with a parent.  If Don, Cheryl and Barbara all three carry this matching segment, it’s because their fathers both received it from their grandparents who were the common ancestor of Don, Cheryl and Barbara.

Neither Cheryl, Don nor Barbara can phase directly to their parents, who are deceased, so in this case, matching against first cousins is the best substitute we have.  We know that common DNA between the first cousins had to come from their father’s, who were brothers.  This in essence virtually phases Barbara, Don and Cheryl to their father’s on these matching segments.  Not ideal, by any means, but even partial parental phasing is better than no phasing at all.

A third match, Dean, shows Miller in his family tree, but I could not connect his Miller line to the Johann Michael Miller ancestral line, from which our Miller line descends – so Dean is not a known cousin.  Sometimes a common surname, even if found in the same geographic location, is not proof that the DNA connection is through that line.  It’s easy to make that assumption, but it’s an assumption that is just waiting to bite you.  Don’t do it!

Because of our known, proven DNA and genealogy matches to Herbert, we can attribute all of the segments where Herbert triangulates with either Barbara and Cheryl or Barbara and Don as Miller for all people involved.  This means that this common DNA descends either from Daniel Miller and Elizabeth Ulrich or Daniel’s father Philip Jacob Miller and Magdalene, surname unknown.

Why have I listed two couples?  Because, remember, Herbert has a double dose of Miller DNA from cousins and we don’t know which segment Barbara inherited, one from Daniel/Elizabeth or one from Philip Jacob/Magdalene (or some of each.)  If the segment is from Daniel/Elizabeth, it could have come from either the Ulrich or Miller side.  If it came from Daniel, then it also came from his father and mother, Philip Jacob/Magdalena and could either be Miller or Magdalena’s unknown line.

Herbert triangulate

Because of our known, proven DNA and genealogy matches to Rex, we can attribute all of the segments where Rex triangulates with either Barbara and Cheryl or Barbara and Don as Miller for all people involved.  Their common ancestor is John David Miller and Margaret Lentz, so their shared DNA could be either Lentz or Miller and is likely some of each.

Rex triangulate

For segments where there is no triangulation, but Barbara matches either Herbert or Rex, I still note that segment as Miller on my spreadsheet, since they are proven cousins, but I just omit the triangulation note.

For Barbara, that’s a total of 51 segments of her DNA that we can now assign to a Miller ancestral couple.

Furthermore, every segment that Barbara matches with either Cheryl or Don is now confirmed to be from her father’s side of the family, not her mother’s.  While we don’t have Barbara’s parents available for testing, this is a pseudo way to phase your results to determine matches from one parents’ side of the family.  For Barbara, that’s a total of 91 segments, some of them quite large.  For example, roughly half of chromosome 13 matched with Don.

Just as a matter of interest, within those 91 segments that Barbara matches with either Don or Cheryl, a total of only 7 segments matched exactly between all 3 individuals in terms of start and end location, cMs and SNPs.  While you might expect a number of small segments to match exactly, these weren’t all small.  In fact, most weren’t small and some were quite large.

Exactly matching DNA segments between Barbara and Cheryl and Barbara and Don.

Chromosome Matching cM Matching SNPs
1 8.65 1189
1 7.01 1150
8 27.79 7279
10 20.78 5141
12 27.68 6046
14 2.11 700
14 49.47 9032

This means that these segments were not divided at all in a total of 5 DNA transmission events.

  • Hiram to John
  • Hiram to Roscoe
  • John to Barbara
  • Roscoe to Cheryl
  • Roscoe to Don

Additionally, I carry two of these exact segments as well, so those two segments survived 6 transmission events.

Clearly these segments are what we would term “sticky” because they certainly are not following the statistical average of dividing the DNA in half (by 50%) in each transmission event.

There is one more thing we can tell from matching.

Both Barbara and Cheryl match with SB on the X chromosome on the same segments.

Two cousins X

This is particularly interesting because of the special inheritance path of the X chromosome.  We know that SB must be related on Evaline Miller’s side of the family, because John and Roscoe Ferverda did not receive an X chromosome from their father.  So Barbara, Cheryl and Don have to have received it from Evaline.  Unfortunately, SB listed no genealogy on Family Tree DNA, but based on the X chromosome inheritance path, I can tell you that SB is either descended from John David Miller and Margaret Lentz, or from the Schaeffer, Lentz or Moselman lines colored pink or blue, below.

Two cousins X fan

At this point, I made a chart of how the matches grouped with each other on each of the green clusters.

Just one cousin chart

I intended to create a nice chart in Excel or Word, but with all of the various colors of ink involved, I didn’t think I could find enough color differentiation so we’ll just have to suffer with my hand-made chart.  There are subtle color differences here – a different color or marker type for each of the 19 green clusters.

What I did was to look at each of the green DNA spreadsheet groupings and create a colorized chart, by group, for each grouping.  So everyone in the first cluster had their X in the boxes of who they matches in the same color, say blue pen.  The second group, orange marker, and so forth.  That way I can see who was orange or yellow or blue and if those groups tend to cluster together.

Remember Arthur and Eric from above, whose genealogy we knew nothing about.  You can see, for example, that Arthur matches in various groups with lots of people, and most often, Tiffany.  Arthur and Eric also match in multiple groups that include each other and Rex, a known Miller descendant, so we can attribute both Arthur and Eric’s DNA matches to the Miller side of the tree.  Keep in mind, all of these people also match with Barbara, Cheryl and Don.

Tiffany clusters with Arthur and Sarah and Eric in multiple groups and with Constance, David, Ellen, Leland and Rex in at least one other cluster.  So another Miller side person.

On chromosome 14, Eric, Ellen, Arthur and Tiffany were all triangulated on the same segment with Don, Cheryl and Barbara, so we know those 7 individuals unquestionably share a common ancestor.

Let’s look at SB again, our X match.  Since SB’s X connection can’t come from the Miller side, given the X inheritance path, and SB also matches with our Lentz cousin, it’s likely that SB is related through the Lentz lines.

Normally, when doing this matching relationship chart, you tend to see two distinct groupings, a mother’s side and a father’s side.  In other words, there will be some groups that absolutely don’t overlap with the others.  That’s not the case here.

So, by now you might be wondering what happened to the Ferverda side of the family?  I was secretly hoping to find a closet Ferverda relative in this exercise, and I thought we might have, actually.  Notice that Harold has no clustering at all, but he clearly matches Barbara, Cheryl and Don – but doesn’t cluster with any other Miller or Lentz cousins.  Therefore, he could be from the Ferverda side of the family, but since he provided no genealogy information or surnames at Family Tree DNA, I can’t easily tell.

However, I am not entirely without recourse.  I checked Harold “in common with” Barbara and discovered that he matches both Rex, our Miller cousin and William, our Lentz cousin, so even though Harold did not triangulate with William and/or Rex on any segments with both Barbara and/or Cheryl/Don, those Miller/Lentz matches certainly suggest descent from this line.  I’ll be sending him an e-mail!

So, there are no Ferverda cousins represented in these matches.

I decided to check one more thing, now that I know that all of these matches are on the Miller side and that we have 3 known, proven genealogical cousins, Rex, Herbert and William.  I wanted to see how many of our individuals who match Barbara, Cheryl and Don also match one of the known cousins.  I selected Barbara as the base match kit to use, since we know they all matched Barbara, Cheryl and Don, and then I ran “in common with” for each one of them with Barbara, with the following results.  A few did match one of the Miller or Lentz cousins, but fewer than I expected.miller matches chart

*However, we had a surprise.  Dean matched another Miller male individual whose line is proven to descend through two children of Philip Jacob Miller and Magdalena, surname unknown.  Another first cousin marriage.  Another cousin discovered!

Furthermore, I noticed yet another individual, Doug, in Barbara’s match list and in common with 6 of the matches as well.  Looking at Doug’s pedigree chart, not only is he a Miller descendant, he also descends from two of the Miller wives lines too.  Another cousin confirmed!

But why no Ferverda matches?

Recent immigrants.

The Ferverda side of the family immediately jumps the pond to Holland, with Hiram himself being an immigrant as a young teen in the 1860s.  There are few Ferverda (Fervida, Ferwerda) descendants here in the US to test, and many are Brethren or Mennonite.  Few people in the Netherlands have participated in DNA testing.

The converse of that, Evaline Miller’s lines have all been in the US since the early/mid-1700s, so there are lots of descendants.  Oh, the difference about a hundred years and 5 or 6 generations makes in the number of descendants who might be available to test.  This situation, unfortunately, created a very lopsided chart without the division I’m used to seeing.  On the other hand, thank goodness Evaline’s line and Hiram’s line are very distinct!

At this point, if you’re doing this “one cousin” exercise, you’ll need to do a few things.

1.  Check each of the matching individuals to see if they have uploaded or created a pedigree chart at Family Tree DNA. If they do, their pedigree icon will be green, shown below. If so, click on the icon and search for every surname (and variant) associated with your known common lines with your cousin.

2.  Check to see if these people entered a list of surnames, even if they don’t have a pedigree chart. The surnames are listed in the furthest right column. If you have entered your surnames, any that match yours will be bolded. Beware of variant spellings.

two cousins pedigree and surnames

You can see above that I am the only one of the matches shown with a pedigree chart icon, shown in green, and the common surnames are bolded at right.

3.  If your matches don’t have a pedigree chart, write to them and tell them you have a common ancestor and give them a list of your ancestors in your direct line. Please, PLEASE include the name on the kit that you match. Many people manage multiple kits and will ignore requests with only partial information.

4.  If you have additional cousins to test, do so. I’m sure you can see how valuable additional cousins DNA would be.

5.  Be sure to check your matches by “ancestral surname” to be sure that you haven’t missed any cousins who have already tested. The ancestral surname search box can be seen above the “known relationship” heading in the graphic above.

6.  If you haven’t done so, enter your surnames under the “Manage Personal Information” tab under “My Account” at Family Tree DNA. Then click on the genealogy tab, then Surnames.

Two cousins genealogy settings

7.  From your main personal page, of course, you can upload your Gedcom file by clicking on “My Family Tree.”

8.  Run “in common with” for each of the common matches of your two cousins and look for common matching names between them.  Those matching “in common with” names serve as a hint as to shared ancestry.  Your answer may be hiding in your cousins’ trees!

Utilize all of these tools to help your search.

Summary

Not bad for thinking we couldn’t do anything with our DNA matches because we had “just one cousin” to work with, even though I cheated and used siblings.

What, exactly, did we manage to do?

  • I attributed 91 segments of Barbara’s DNA to her father’s side of the tree.
  • I filled in 51 segments of Barbara’s DNA to ancestral couples.
  • I found 5 confirmed genealogy/DNA cousins.
  • I found 16 people whose genealogy is unknown, but who triangulate with Barbara, Cheryl and Don.  We know for sure which side of the tree these people match on – all Millers.
  • I can tell the X match which lines they descend from, even if they don’t know.
  • I can do one more very cool thing.  Utilizing the Lazarus utility at GedMatch, I can now recreate at least a partial autosomal DNA file for both John and Roscoe Ferverda, the fathers of our testers.  Join me in a couple days and we’ll see how that works!

This same process works between any two people who know how they are related and their common ancestor.  It’s a great way to find cousins you didn’t know you had, or you didn’t know have DNA tested, and how they are related to you and each other.

Some people get very discouraged when even thinking about working with endogamous populations, or cousin marriages.  One of the reasons I used this particular example is that I wanted to illustrate that while these situations are challenging from time to time, they are far from hopeless – so don’t let that deter you.

In fact, of the 5 confirmed cousins discovered during this process, some in unexpected ways, at least 3 and possibly 4 are through multiple lines.  Some of these matches are probably thanks to endogamy.

Happy hunting!

______________________________________________________________

Disclosure

I receive a small contribution when you click on some of the links to vendors in my articles. This does NOT increase the price you pay but helps me to keep the lights on and this informational blog free for everyone. Please click on the links in the articles or to the vendors below if you are purchasing products or DNA testing.

Thank you so much.

DNA Purchases and Free Transfers

Genealogy Services

Genealogy Research

How Phasing Works and Determining IBD Versus IBS Matches

Over the past few weeks there has been quite a bit of discussion surrounding phasing and matching of autosomal DNA.  I’ve had several questions about what phasing is, why it might be important, and how phasing affects matching.  These topics go hand in hand.

Phasing

One of the terms used in genetic genealogy is phasing.  Many people don’t understand what phasing is, why it’s important, and that there are really two kinds of phasing.

The goal of phasing originally was to determine which side of our family, Mom or Dad, a piece of our DNA, and therefore a particular match, came from.  As the industry has developed, phasing has taken on a slightly different meaning.  Today, it’s often used generally to imply that phasing would improve our matches and therefore “should be done.”

These are really two kinds of phasing, used for two different purposes.  Originally phasing was used to mean parent phasing.  A second type, which I’ll call academic phasing, has wider applications.  But first, let’s talk about why we need phasing at all.

Why Do We Need Phasing?

Because there is no zipper in our DNA.  It would be very useful….very…if  our DNA came in nice straight columns, with Mom’s on one side and Dad’s on the other.  But that’s not how it works.

We carry two nucleotides in each inherited position, one from Mom and one from Dad.  I discussed this in detail in this article.

Our autosomal DNA, when read, does not and cannot separate Mom’s contribution from Dad’s (except for the X chromosome in some situations, which we are not going to discuss in this article.)

Zipper 5

In this example, Mom contributed all As and Dad contributed all Cs.

My results example

My results for these locations look like this – a mixture of Mom’s and Dad’s in no order.  In other words, they are combined and I can’t tell the difference – at least not without either Mom or Dad’s data to compare against.

Zipper 7

Ideally, if we could separate my values into Mom and Dad’s columns, like above, then we could match exactly against cousins from Mom’s side and from Dad’s side, because those cousins would also carry all As or all Cs in part or all of those locations, like in the example above.

In this case, I match both Mary and Myrtle, and Mary and Myrtle each match a respective parent.

This is the textbook case of IBD, or identical by descent.

Joe IBS chance

But then, there’s Joe.  I match Joe, because I carry both A and C at each of these locations. Joe, however, has alternating As and Cs.  The acid test of whether I match Joe by descent (IBD) or by chance (IBS) is if Joe matches my parents.

In this case, as you can see, Joe does not match my parents.  Because my matches to both Mary on my mother’s side and Myrtle on my father’s side are IBD, Joe also does NOT match Mary or Myrtle.

This is the underlying foundation of why we use triangulation and can say that if three people with a known ancestor all match each other, we can map that segment as IBD, identical by descent, from that known ancestor.

In fact, the definition of a proven ancestral “match” in genetic genealogy is when:

  • Two or more people match you on a particular segment
  • Those people also match each other on the same segment

This is true whether or not you’ve been able to identify the ancestor responsible for those shared segments.

Let’s look at how that works.

In the following example, you can see that Mary, Anne and Sue all match Mom, because they all have all As.  They also match me, because I have an A and a C in each location, so they match my A, but they do not match Joe who has alternating As and Cs.  So you can see that I am the only person in the group that Joe matches.  This is how we know that Joe is an IBS by chance match and this particular matching segment for Joe can be eliminated as a valid match to me.

Joe IBS chance plus cousins

Let’s also say that I know that Anne, Sue and Mary descend from my mother’s Miller line and that Henry, Harold and Myrtle descend from my father’s Vannoy line.  So, in this case, I have proven triangulation of myself, my parents and 3 other known individuals with the same genealogy lines.  These segments are now considered proven to those particular ancestors or ancestral lines because there is no other way for all of us to share these segments other than sharing a common ancestor.

This is also the basis upon which we can infer that our parents carried a particular piece of DNA if we don’t have their DNA to compare – because that’s the ONLY way we could have acquired that DNA segment – through that parent.

So let’s look at this exact same situation if we don’t have either parent’s data to utilize.  You can see that Mom and Dad are missing from this next example.

Joe IBS chance parents removed

If three cousins all share that same segment of DNA, it HAD to come from a common ancestor, and one or the other of our parents HAD to have carried it too.

You can see that while we don’t have the benefit of our parent’s DNA in the above example, that Joe still matches me.  Anne, Sue and Mary still all match each other, as do Henry, Harold and Myrtle.  But Joe does not match any of the known cousins.  We can therefor determine that Joe’s DNA, on this particular segment, is IBS by chance, not IBD, so not inherited from a common ancestor.  Therefore, we can discard Joe as a valid match on this segment.  This does NOT infer that Joe might not be a valid match on other segments, just not on this segment.

So, there are two ways to determine IBS by chance segments.

  1. To compare your matches on that segment against both parents.
  2. To compare your matches on that segment against proven genealogical matches from both sides of your tree.

For specifics of how to do this, also refer to the Chromosome Browser War article and for the basics, to the Ancestor Mapping article.

Now, let’s remove Joe, who doesn’t match, and see what our segment match looks like.

Me, parents, matches

All of these people match me, because I carry an A and a C, one from each parent.  With my parents DNA included, I can tell immediately where the matches occur.

I’m fortunate that I have my mother’s autosomal DNA. That means that I can do “poor man’s phasing” by comparing  my results against at least one parent.  The people who don’t match me and my mother must match me and my father or they are IBS by chance.

But even without any parents, because I know that the green people share a common Miller ancestor and the blue people share a common Vannoy ancestor, we can clearly identify that these people match, and why – and we can infer that our parents had this same DNA because there is no other way for us to obtain it.

Now let’s look at one final situation where we have Nancy who doesn’t know how her genealogy connects.  Let’s say she is an adoptee.

Me, matches, adoptee

You can see very clearly where Nancy matches me and my mother’s proven cousins.  She does not match my father’s proven cousins.

I’m sure I don’t need to tell you at this point that Nancy shares a common ancestor with our Miller line.  We may not know who, at this point, but by studying the genealogy of these people and others who also match, we may be able to narrow it down quite substantially.

So, in a nutshell, phasing against a parent, or both parents, determines quite accurately which side of our family tree a match comes from.

We can do that same thing in essence by finding cousins who all match on the same DNA segment and share a common ancestor.  This is why testing multiple cousins is so important.  Once that segment of our DNA is mapped to an ancestor or ancestral line, we know that anyone else who also matches at least two other people with that same segment also share this same genealogical line at some level.

No Parent DNA       

Phasing is fine and dandy if you have the DNA of one and preferably both of your parents, but probably more than 50% of the genealogists don’t have that luxury.

In the adoptee community, they not only don’t have their parents DNA to test, they don’t have a pedigree chart so they can’t even utilize triangulation techniques with cousins or people with a shared genealogy.  This is why they attempt to piggyback off of our already triangulated data to a particular ancestral line – again, based on the proven concept that if you match a group of 3 other people who have triangulated – you too inherited that DNA from a common ancestor with those people.

In the example above, Anne, Sue, Mary and I match on that DNA segment and know that our common ancestral line is that of Johann Michael Miller.  Since Nancy, an adoptee, matches us, she too is descended in some fashion from the Johann Michael Miller lineage (upstream or downstream – meaning possibly a wife’s line) as well.

What about all of the matches that we have that we can’t attribute to one side or the other, or those people like adoptees who don’t have any pedigree chart or parent’s data to work with?

Obviously, they can’t utilize phasing in the typical sense.  Nor can companies figure out our genealogy and apply it to our DNA results – that’s up to us – with the possible exception of a parent match.

A second type of phasing is being used to attempt to reduce the number of IBS matches by both chance and population.

Academic Phasing

In academia, in order to study populations, computer programs were written to attempt to sort through data for likenesses and differences.  The goal, for genetic genealogists is to find segments that are IBD, identical by descent and eliminate others that are either IBS by chance or IBS by population.

What academic phasing programs like Beagle attempt to do is to sort through populations and determine the most likely combinations of nucleotides found, and thereby extrapolate IBD vs IBS.

These programs have inherent problems, not the least of which is that they are not created to deal with an ever increasing data base size where hundreds (if not thousands) of new records are added daily.  Ancestry, when faced with the problem of a rapidly increasing data base of over half a million DNA testers who were accumulating matches in the thousands, tried to address this.  Ancestry’s problem is only growing, which is one of those wonderful business problems to have.  In order to attempt to reduce the number of matches and improve those matches, they created their own technology relative to phasing, which they detailed in a white paper released with their new DNA Circles feature.  The jury is still out on how well they succeeded.

Inherent to all of the academic phasing programs is the challenge that the vendor (or whomever) involved must decide where to draw the line between what they consider to be useful and not useful.  Ancestry did not tell us their criteria for determining the cutoff that they used in their proprietary phasing program.

However, we can determine some things based on the graph they did provide to each of the attendees during DNA Day.  They gave us a “before phasing” and “after phasing” picture of our own genomes as compared with our matches.  We’ve talked before about the pileup areas that Ancestry discovered based on their phasing.  Please note that I’ve used my own chart in this example, but based on the charts of others at the same meeting, each person’s was quite different – so the numbers here are provided only as examples utilizing my own information.

genome pileups

This is my genome compared to my matches before Ancestry reduced my matches after phasing.

genome pileups2

This is my genome compared to my matches after my pileup reduction surgery.

In this second chart, you can see, that for me, they have drawn the line at about 25 common matches as being a relevant cutoff point, out of just under 13,000 prior matches.  Please note that this cutoff of about 25 is my cutoff point.  Yours might be quite different – but there is no way of knowing.

This looks like locations where I had more than 25 matches, out of 13,000, were determine to be “too matchy” and therefore a pileup area.  Now, given that I descend from at least four endogamous populations, the Mennonite, Brethren, Acadians and Native Americans, I would suggest that I would expect to have more than 25 matches on some of the same segments within these populations groups – especially those closer in time and with many descendants.  At Family Tree DNA, where I have 770 matches, I have matches with more than 25 people with Acadian ancestry.  If you extrapolate only the 25/770 number at Family Tree DNA (which is low) to 13,000 matches, I would expect to have over 400 Acadian matches at Ancestry – which might explain why I lost all of my Acadian matches at Ancestry.

pileup cutoff

It appears in my first chart that the cutoff line is drawn at about the location of this arrow – if you drew a line straight across at that location from left to right.  It appears from looking at this, that I didn’t lose that many matches, but I did.  I went from 12,846 to 3,350 or a reduction of about 75%.  I’m not bemoaning the loss of the number of matches, because as they were, they weren’t terribly useful.

However, I did lose all of my known Acadian matches.  In other words, in some cases, the matches may have gotten pruned too far.  Now truthfully, at Ancestry, since we don’t have analysis tools, this really doesn’t matter much to me.

I’m only using this example because it’s the only concrete example that we have today of academic phasing applied to a commercial data base and the effects of utilizing academic phasing and applying it commercially to prune our matches.  In my case, I found it extremely interesting to see the large pileup area and I would just love to see where that maps to on my chromosome spreadsheet, and if there is anything remarkable about it.  Is it my Acadian matches, or is it truly an amalgamation of miscellaneous matches from Europe (or someplace else) with no story to tell?  I’m fine with either answer, but I can’t now and will never be able to know.

In any event, this type of phasing is used in essence to prune our trees universally by determining which matches are more legitimate and which are less so.

To date, Ancestry is the only vendor to implement this type of phasing.

Felix Immanuel discusses phased data, IBS and endogamous societies in his article, “Why phasing DNA is bad for valid and close matches.”

Phasing Summary

There are two types of phasing.  The first, which is phasing to parents and known family data is achievable by genetic genealogists.   We have been utilizing a form of “poor man’s” phasing for a long time now where we compare known matches to one or both of parents and selectively remove matches that match us but not either parent.  Of course, you need both parents to do this reliably.

The second type of phasing, academic phasing, is still more of an unknown in terms of how it truly affects the accuracy of our genealogy matches.  Ancestry has created a proprietary form of phasing optimized for large data bases and while we have seen the first generation of phased data, the jury is still out as to the success of this tool, in part, because we don’t have any tools like chromosome browsers and matrix matching tools to confirm the that the matches we have or lost were and are both genetic and genealogical matches.

Now that we understand how phasing works relative to matching, let’s talk about what an IBD and IBS match are, and why that’s important.

IBD vs IBS

When two people have a match on a autosomal DNA segment, it can either be identical by descent, IBD, or identical by state, IBS, although IBS really should be broken into multiple categories.  In some cases, IBS can become IBD, but in the situation where the IBS match is actually false, it is simply not a valid match.  Let’s talk about how to tell the difference.

Matches between any two people on a particular segment can be due to any of the following situations.

  1. A valid IBD, meaning identical by descent, match where the segment has been passed from one specific ancestor to all of the people who match. That matching segment can be labeled and utilized as such. In these cases, we know, for example, that the segment is passed to the descendants of a specific ancestor or ancestral couple.
  2. An IBS match, meaning identical by state, which is called that because we can’t yet identify the common ancestor, but there is one. So this is actually IBD but we can’t yet identify it as such by connecting it with an ancestral line. So this really isn’t IBS. With more matches, we may well be able to identify it with its contributing ancestor. As more people test and larger data bases and more sophisticated software become available, these matches will fall into place. Some people refer to any match they can’t identify as IBD as IBS.
  3. An IBS match that is population based. These are often difficult to determine, because this is a segment that is found widely or within in a specific population. It is passed from your ancestors, but this segment may be found in a large part of the population they descend from. The key to determining these pileup areas is that you may find this same segment matching different proven lineages.  I’ve found a couple of areas where I appear to have matches from my mother’s side of the family from different ancestors – so these areas are potentially IBS on a population level. That does not, however, make them completely irrelevant. In fact, this article speaks to how one genealogist noticed and worked with a group of 22 matches that appear to be IBS by population which are quite relevant to her genealogy.
  4. An IBS match that is a false match, meaning the DNA segments that we receive from our father and mother just happen to align in a way that matches another person. Generally these are relatively easy to determine because the people you match won’t match each other. You also won’t tend to match other people with the same ancestral line, so they will tend to look like lone outliers on your match spreadsheets, but not always. I refer to these as IBS by chance, to distinguish them from IBS by population.

So, actually, there are three kinds of IBD and only one kind of IBS, which is by chance.  This is because you do inherit DNA referred to as IBS because you don’t know which ancestor it is inherited from, and you do inherit IBS by population DNA from your ancestors, by descent.  The only IBS that is actually inherited by state is a false match or IBS by chance.  So, word to the wise – when someone tells you a match is IBS, ask what they mean and how they know.

Regarding IBS by chance, Felix Immanuel Chandrakumar (formerly Felix Chandrakumar) has been analyzing the probability of IBS matching. His interest was spurred because contrary to what had been expected, there are matches among living people to some of the ancient DNA results and at levels that, if interpreted today, would suggest a relationship in a genealogical timeframe.  This means that these segments must be either IBS by population, meaning passed down within a population through a specific ancestor (and parent) to the living person, or they are IBS by chance and not relevant, although many of these matches have been phased against parents.

Felix’s article, “The true IBS noise range” discusses his findings that a true noise or false IBS segment cannot occur above the threshold of 150 SNPs at the 1MB threshold.

In addition, he generated a “noise file” which would allow people to see just how often they actually would match any segments down to 1cM and 100 SNPs just by chance. It is kit F999901 and surprisingly, not one person in the GedMatch data base matches at any segment.

The challenge of course is differentiating between these types of matches and then using that information to tell us something about our ancestry, either genealogically, meaning a specific ancestor, or ethnically, meaning that a segment of our DNA descends from a particular group of ancestors, like Acadians or Native Americans or Finns.

To do this, we need to map our chromosome segments to ancestors, but there are very few people actually mapping their chromosomes to ancestors.  Why?  Because it’s tedious and it certainly is not the “quick answer” many of us would like.  Hopefully, the IBS and IBD guidelines below will help people better understand and categorize matches.

Guidelines for Determining IBS vs IBD

As mentioned previously, there are really 4 kinds of DNA segments.  I’ve developed some guidelines for how to identify each type of match and attempted to quantify them below.

Segment Type Characteristics – Definition How to Identify
IBD  – Identical by Descent Can determine a common ancestor.  Let’s say that we know that Mary, in our example, shares the ancestor Johann Michael Miller on my mother’s line.  I label this segment IBD on my spreadsheet with the name of our common ancestor. For genealogy matching of previously unknown cousins, at least three people match with a common segment and a common ancestor.  In closer family, such as parents, grandparents, sibling and known close cousins, this three match criteria is not needed.  Larger segments are much more likely to be IBD.
IBS that will be IBD The segment is really IBD, but since we don’t know which ancestor contributed the segment, yet, it sometimes gets labeled it IBS. Let’s say this is Myrtle, and she matches us and others on the same segments, but we don’t know which ancestors contributed that segment.  More genealogy work and/or more testers who know their pedigree charts will make determining the common ancestor more likely to occur. Matches parents and/or multiple (sometimes close) known family members on the same segments.  Sometimes the steps to identifying the common ancestor is to first identify a common surname or geography and pursue from that point, although multiple common surnames can occur that are not necessarily relevant.  I have some people that I am genealogically related to on two different lines, but any one segment can only be contributed by one ancestral line.
IBS by population These segments truly are IBD, but since they exist in a large population, you may see matches on these segments from multiple ancestors.  Typically these are small because they have been passed within a population for a very long time, although based on the Anzick ancient DNA matches, they are not always small.  Often, in population genetics, these would or could be called AIMS or Ancestry Informative Markers, meaning that they show up in a particular population at higher levels than elsewhere.  Are these useful to genealogy?  It depends on what you are looking for and the frequency at which they are found in any given population.  They wouldn’t be terribly useful in terms of European genealogy, if you’re primarily European, but if you have minority admixture, finding one of these IBS by population segments would be extremely informative. Indicated by areas where you find matches from multiple family lines on the same side of your family, on the same segment. These would be pileup areas. Alternatively, they can be segment areas where you notice a specific trend, like matches are primarily Acadian, or Finnish, etc.   I label these segments, but I don’t discard them.  IBS by population matches are generally, but not always, found in smaller segments, as shown by the ancient DNA matches.
IBS by chance The example I used with Joe.  False matches that match only by the luck of the draw in how the 2 strands of DNA was distributed in the two people who match. When matching against both parents, IBS by chance can be discerned when a match matches you, but does not match either of your parents on that segment.  If these segments are “larger,” 5 or 7 cM or with more than 500 or 700 SNPs, this could be due to a data read error or “no calls” in the parent’s file.  You may want to check the original data file before disregarding the segment.  If you don’t have both parents, but you do have triangulated cousins on both sides of your family on this same segment, you can still triangulate by determining if a match matches you and either set of cousins.  If not, then the match is IBS by chance.  Generally, I simply label these “IBS by chance” and leave them in the spreadsheet so I don’t confuse myself by coming across them again, but they could be discarded.  The smaller the segment, the more likely it will be IBS by chance but all smaller segments are not IBS by chance.

______________________________________________________________

Disclosure

I receive a small contribution when you click on some of the links to vendors in my articles. This does NOT increase the price you pay but helps me to keep the lights on and this informational blog free for everyone. Please click on the links in the articles or to the vendors below if you are purchasing products or DNA testing.

Thank you so much.

DNA Purchases and Free Transfers

Genealogy Services

Genealogy Research

Chromosome Browser War

There has been a lot of discussion lately, and I mean REALLY a lot, about chromosome browsers, the need or lack thereof, why, and what the information really means.

For the old timers in the field, we know the story, the reasons, and the backstory, but a lot of people don’t.  Not only are they only getting pieces of the puzzle, they’re confused about why there even is a puzzle.  I’ve been receiving very basic questions about this topic, so I thought I’d write an article about chromosome browsers, what they do for us, why we need them, how we use them and the three vendors, 23andMe, Ancestry and Family Tree DNA, who offer autosomal DNA products that provide a participant matching data base.

The Autosomal Goal

Autosomal DNA, which tests the part of your DNA that recombines between parents every generation, is utilized in genetic genealogy to do a couple of things.

  1. To confirm your connection to a specific ancestor through matches to other descendants.
  2. To break down genealogy brick walls.
  3. Determine ethnicity percentages which is not the topic of this article.

The same methodology is used for items 1 and 2.

In essence, to confirm that you share a common ancestor with someone, you need to either:

  1. Be a close relative – meaning you tested your mother and/or father and you match as expected. Or, you tested another known relative, like a first cousin, for example, and you also match as expected. These known relationships and matches become important in confirming or eliminating other matches and in mapping your own chromosomes to specific ancestors.
  2. A triangulated match to at least two others who share the same distant ancestor. This happens when you match other people whose tree indicates that you share a common ancestor, but they are not previously known to you as family.

Triangulation is the only way you can prove that you do indeed share a common ancestor with someone not previously identified as family.

In essence, triangulation is the process by which you match people who match you genetically with common ancestors through their pedigree charts.  I wrote about the process in this article “Triangulation for Autosomal DNA.”

To prove that you share a common ancestor with another individual, the DNA of  three proven descendants of that common ancestor must match at the same location.  I should add a little * to this and the small print would say, “ on relatively large segments.”  That little * is rather controversial, and we’ll talk about that in a little bit.  This leads us to the next step, which is if you’re a fourth person, and you match all three of those other people on that same segment, then you too share that common ancestor.  This is the process by which adoptees and those who are searching for the identity of a parent work through their matches to work forward in time from common ancestors to, hopefully, identify candidates for individuals who could be their parents.

Why do we need to do this?  Isn’t just matching our DNA and seeing a common ancestor in a pedigree chart with one person enough?  No, it isn’t.  I recently wrote about a situation where I had a match with someone and discovered that even though we didn’t know it, and still don’t know exactly how, we unquestionably share two different ancestral lines.

When you look at someone’s pedigree chart, you may see immediately that you share more than one ancestral line.  Your shared DNA could come from either line, both lines, or neither line – meaning from an unidentified common ancestor.  In genealogy parlance, those are known as brick walls!

Blaine Bettinger wrote about this scenario in his now classic article, “Everyone Has Two Family Trees – A Genealogical Tree and a Genetic Tree.”

Proving a Match

The only way to prove that you actually do share a genealogy relative with someone that is not a known family member is to triangulate.  This means searching other matches with the same ancestral surname, preferably finding someone with the same proven ancestral tree, and confirming that the three of you not only share matching DNA, but all three share the same matching DNA segments.  This means that you share the same ancestor.

Triangulation itself is a two-step process followed by a third step of mapping your own DNA so that you know where various segments came from.  The first two triangulation steps are discovering that you match other people on a common segment(s) and then determining if the matches also match each other on those same segments.

Both Family Tree DNA and 23andMe, as vendors have provided ways to do most of this.  www.gedmatch.com and www.dnagedcom.com both augment the vendor offerings.  Ancestry provides no tools of this type – which is, of course, what has precipitated the chromosome browser war.

Let’s look at how the vendors products work in actual practice.

Family Tree DNA

1. Chromosome browser – do they match you?

Family Tree DNA makes it easy to see who you match in common with someone else in their matching tool, by utilizing the ICW crossed X icon.

chromosome browser war13

In the above example, I am seeing who I match in common with my mother.  Sure enough, our three known cousins are the closest matches, shown below.

chromosome browser war14

You can then push up to 5 individuals through to the chromosome browser to see where they match the participant.

The following chromosome browser is an example of a 4 person match showing up on the Family Tree DNA chromosome browser.

This example shows known cousins matching.  But this is exactly the same scenario you’re looking for when you are matching previously unknown cousins – the exact same technique.

In this example, I am the participant, so these matches are matches to me and my chromosome is the background chromosome displayed.  I have switched from my mother’s side to known cousins on my father’s side.

chromosome browser war1

The chromosome browser shows that these three cousins all match the person whose chromosomes are being shown (me, in this case), but it doesn’t tell you if they also match each other.  With known cousins, it’s very unlikely (in my case) that someone would match me from my mother’s side, and someone from my father’s side, but when you’re working with unknown cousins, it’s certainly possible.  If your parents are from the same core population, like Germans or an endogamous population, you may well have people who match you on both sides of your family.  Simply put, you can’t assume they don’t.

It’s also possible that the match is a genuine genealogical match, but you don’t happen to match on the exact same segments, so the ancestor can’t yet be confirmed until more cousins sharing that same ancestral line are found who do match, and it’s possible that some segments could be IBS, identical by state, meaning matches by chance, especially small segments, below the match threshold.

2. Matrix – do they match each other?

Family Tree DNA also provides a tool called the Matrix where you can see if all of the people who match on the same segment, also match each other at some place on their DNA.

chromosome browser war2

The Matrix tool measures the same level of DNA as the default chromosome browser, so in the situation I’m using for an example, there is no issue.  However, if you drop the threshold of the match level, you may well, and in this case, you will, find matches well below the match threshold.  They are shown as matches because they have at least one segment above the match threshold.  If you don’t have at least one segment above the threshold, you’ll never see these smaller matches.  Just to show you what I mean, this is the same four people, above, with the threshold lowered to 1cM.  All those little confetti pieces of color are smaller matches.

chromosome browser war3

At Family Tree DNA, the match threshold is about 7cM.  Each of the vendors has a different threshold and a different way of calculating that threshold.

The only reason I mention this is because if you DON’T match with someone on the matrix, but you also show matches at smaller segments, understand that matrix is not reporting on those, so matrix matches are not negative proof, only positive indications – when you do match, both on the chromosome browser and utilizing the matrix tool.

What you do know at this point is that these individuals all match you on the same segments, and that they match each other someplace on their chromosomes, but what you don’t know is if they match each other on the same locations where they match you.

If you are lucky and your matches are cousins or experienced genetic genealogists and are willing to take a look at their accounts, they can tell you if they match the other people on the same segments where they match you – but that’s the only way to know unless they are willing to download their raw data file to GedMatch.  At GedMatch, you can adjust the match thresholds to any level you wish and you can compare one-to-one kits to see where any two kits who have provided you with their kit number match each other.

3. Downloading data – mapping your chromosome.

The “download to Excel” function at Family Tree DNA, located just above the chromosome browser graphic, on the left, provides you with the matching data of the individuals shown on the chromosome browser with their actual segment data shown. (The download button on the right downloads all of your matches, not just the ones shown in the browser comparison.)

The spreadsheet below shows the downloaded data for these four individuals.  You can see on chromosome 15 (yellow) there are three distinct segments that match (pink, yellow and blue,) which is exactly what is reflected on the graphic browser as well.

chromosome browser war4

On the spreadsheet below, I’ve highlighted, in red, the segments which appeared on the original chromosome browser – so these are only the matches at or over the match threshold.

chromosome browser war5

As you can see, there are 13 in total.

Smaller Segments

Up to this point, the process I’ve shared is widely accepted as the gold standard.

In the genetic genealogy community, there are very divergent opinions on how to treat segments below the match threshold, or below even 10cM.  Some people “throw them away,” in essence, disregard them entirely.  Before we look at a real life example, let’s talk about the challenges with small segments.

When smaller segments match, along with larger segments, I don’t delete them, throw them away, or disregard them.  I believe that they are tools and each one carries a message for us.  Those messages can be one of four things.

  1. This is a valid IBD, meaning identical by descent, match where the segment has been passed from one specific ancestor to all of the people who match and can be utilized as such.
  2. This is an IBS match, meaning identical by state, and is called that because we can’t yet identify the common ancestor, but there is one. So this is actually IBD but we can’t yet identify it as such. With more matches, we may well be able to identify it as IBD, but if we throw it away, we never get that chance. As larger data bases and more sophisticated software become available, these matches will fall into place.
  3. This is an IBS match that is a false match, meaning the DNA segments that we receive from our father and mother just happen to align in a way that matches another person. Generally these are relatively easy to determine because the people you match won’t match each other. You also won’t tend to match other people with the same ancestral line, so they will tend to look like lone outliers on your match spreadsheets, but not always.
  4. This is an IBS match that is population based. These are much more difficult to determine, because this is a segment that is found widely in a population. The key to determining these pileup areas, as discussed in the Ancestry article about their new phasing technique, if that you will find this same segment matching different proven lineages. This is the reason that Ancestry has implemented phasing – to identify and remove these match regions from your matches. Ancestry provided a graphic of my pileup areas, although they did not identify for me where on my chromosomes these pileup regions occurred. I do have some idea however, because I’ve found a couple of areas where I have matches from my mother’s side of the family from different ancestors – so these areas must be IBS on a population level. That does not, however, make them completely irrelevant.

genome pileups

The challenge, and problem, is where to make the cutoff when you’re eliminating match areas based on phased data.  For example, I lost all of my Acadian matches at Ancestry.  Of course, you would expect an endogamous population to share lots of the same DNA – and there are a huge number of Acadian descendants today – they are in fact a “population,” but those matches are (were) still useful to me.

I utilize Acadian matches from Family Tree DNA and 23andMe to label that part of my chromosome “Acadian” even if I can’t track it to a specific Acadian ancestor, yet.  I do know from which of my mother’s ancestors it originated, her great-grandfather, who is her Acadian ancestor.  Knowing that much is useful as well.

The same challenge exists for other endogamous groups – people with Jewish, Mennonite/Brethren/Amish, Native American and African American heritage searching for their mixed race roots arising from slavery.  In fact, I’d go so far as to say that this problem exists for anyone looking for ancestors beyond the 5th or 6th generation, because segments inherited from those ancestors, if there are any, will probably be small and fall below the generally accepted match thresholds.  The only way you will be able to find them, today, is the unlikely event that there is one larger segments, and it leads you on a search, like the case with Sarah Hickerson.

I want to be very clear – if you’re looking for only “sure thing” segments – then the larger the matching segment, the better the odds that it’s a sure thing, a positive, indisputable, noncontroversial match.  However, if you’re looking for ancestors in the distant past, in the 5th or 6th generation or further, you’re not likely to find sure thing matches and you’ll have to work with smaller segments. It’s certainly preferable and easier to work with large matches, but it’s not always possible.

In the Ralph and Coop paper, The Geography of Recent Genetic Ancestry Across Europe, they indicated that people who matched on segments of 10cM or larger were more likely to have a common ancestor with in the past 500 years.  Blocks of 4cM or larger were estimated to be from populations from 500-1500 years ago.  However, we also know that there are indeed sticky segments that get passed intact from generation to generation, and also that some segments don’t get divided in a generation, they simply disappear and aren’t passed on at all.  I wrote about this in my article titled, Generational Inheritance.

Another paper by Durand et al, Reducing pervasive false positive identical-by-descent segments detected by large-scale pedigree analysis, showed that 67% of the 2-4cM segments were false positives.  Conversely, that also means that 33% of the 2-4cM segments were legitimate IBD segments.

Part of the disagreement within the genetic genealogy community is based on a difference in goals.  People who are looking for the parents of adoptees are looking first and primarily as “sure thing” matches and the bigger the match segment, of course, the better because that means the people are related more closely in time.  For them, smaller segments really are useless.  However, for people who know their recent genealogy and are looking for those brick wall ancestors, several generations back in time, their only hope is utilizing those smaller segments.  This not black and white but shades of grey.  One size does not fit all.  Nor is what we know today the end of the line.  We learn every single day and many of our learning experiences are by working through our own unique genealogical situations – and sharing our discoveries.

On this next spreadsheet, you can see the smaller segments surrounding the larger segments – in other words, in the same match cluster – highlighted in green.  These are the segments that would be discarded as invalid if you were drawing the line at the match threshold.  Some people draw it even higher, at 10 cM.  I’m not being critical of their methodology or saying they are wrong.  It may well work best for them, but discarding small segments is not the only approach and other approaches do work, depending on the goals of the researcher.  I want my 33% IBD segments, thank you very much.

All of the segments highlighted in purple match between at least three cousins.  By checking the other cousins accounts, I can validate that they do all match each other as well, even though I can’t tell this through the Family Tree DNA matrix below the matching threshold.  So, I’ve proven these are valid.  We all received them from our common ancestor.

What about the white rows?  Are those valid matches, from a common ancestor?  We don’t have enough information to make that determination today.

chromosome browser war6

Downloading my data, and confirming segments to this common ancestor allows me to map my own chromosomes.  Now, I know that if someone matches me and any of these three cousins on chromosome 15, for example, between 33,335,760 and 58,455,135 – they are, whether they know it or not, descended from our common ancestral line.

In my opinion, I would think it a shame to discount or throw away all of these matches below 7cM, because you would be discounting 39 of your 52 total matches, or 75% of them.  I would be more conservative in assigning my segments with only one cousin match to any ancestor, but I would certainly note the match and hope that if I added other cousins, that segment would be eventually proven as IBD.

I used positively known cousins in this example because there is no disputing the validity of these matches.  They were known as cousins long before DNA testing.

Breaking Down Brick Walls

This is the same technique utilized to break down brick walls – and the more cousins you have tested, so that you can identify the maximum number of chromosome pieces of a particular ancestor – the better.

I used this same technique to identify Sarah Hickerson in my Thanksgiving Day article, utilizing these same cousins, plus several more.

Hey, just for fun, want to see what chromosome 15 looks like in this much larger sample???

In this case, we were trying to break down a brick wall.  We needed to determine if Sarah Hickerson was the mother of Elijah Vannoy.  All of the individuals in the left “Name” column are proven Vannoy cousins from Elijah, or in one case, William, from another child of Sarah Hickerson.  The individuals in the right “Match” column are everyone in the cousin match group plus the people in green who are Hickerson/Higginson descendants.  William, in green, is proven to descend from Sarah Hickerson and her husband, Daniel Vannoy.

chromosome browser war7

The first part of chromosome 15 doesn’t overlap with the rest.  Buster, David and I share another ancestral line as well, so the match in the non-red section of chromosome 15 may well be from that ancestral line.  It becomes an obvious possibility, because none of the people who share the Vannoy/Hickerson/Higginson DNA are in that small match group.

All of the red colored cells do overlap with at least one other individual in that group and together they form a cluster.  The yellow highlighted cells are the ones over the match threshold.  The 6 Hickerson/Higginson descendants are scattered throughout this match group.

And yes, for those who are going to ask, there are many more Vannoy/Hickerson triangulated groups.  This is just one of over 60 matching groups in total, some with matches well above the match threshold. But back to the chromosome browser wars!

23andMe

This example from 23andMe shows why it’s so very important to verify that your matches also match each other.

chromosome browser war8

Blue and purple match segments are to two of the same cousins that I used in the comparison at Family Tree DNA, who are from my father’s side.  Green is my first cousin from my mother’s side.   Note that on chromosome 11, they both match me on a common segment.  I know by working with them that they don’t match each other on that segment, so while they are both related to me, on chromosome 11, it’s not through the same ancestor.  One is from my father’s side and one is from my mother’s side.  If I hadn’t already known that, determining if they matched each other would be the acid test and would separate them into 2 groups.

23andMe provides you with a tool to see who your matches match that you match too.  That’s a tongue twister.

In essence, you can select any individual, meaning you or anyone that you match, on the left hand side of this tool, and compare them to any 5 other people that you match.  In my case above, I compared myself to my cousins, but if I want to know if my cousin on my mother’s side matches my two cousins on my father’s side, I simply select her name on the left and theirs on the right by using the drop down arrows.

chromosome browser war9

I would show you the results, but it’s in essence a blank chromosome browser screen, because she doesn’t match either of them, anyplace, which tells me, if I didn’t already know, that these two matches are from different sides of my family.

However, in other situations, where I match my cousin Daryl, for example, as well as several other people on the same segment, I want to know how many of these people Daryl matches as well.  I can enter Daryl’s name, with my name and their names in the group of 5, and compare.  23andMe facilitates the viewing or download of the results in a matrix as well, along with the segment data.  You can also download your entire list of matches by requesting aggregated data through the link at the bottom of the screen above or the bottom of the chromosome display.

I find it cumbersome to enter each matches name in the search tool and then enter all of the other matches names as well.  By utilizing the tools at www.dnagedcom.com, you can determine who your matches match as well, in common with you, in one spreadsheet.  Here’s an example.  Daryl in the chart below is my match, and this tool shows you who else she matches that I match as well, and the matching segments.  This allows me to correlate my match with Gwen for example, to Daryl’s match to Gwen to see if they are on the same segments.

chromosome browser war10

As you can see, Daryl and I both match Gwen on a common segment.  On my own chromosome mapping spreadsheet, I match several other people as well at that location, at other vendors, but so far, we haven’t been able to find any common genealogy.

Ancestry.com

At Ancestry.com, I have exactly the opposite problem.  I have lots of people I DNA match, and some with common genealogy, but no tools to prove the DNA match is to the common ancestor.

Hence, this is the crux of the chromosome browser wars.  I’ve just showed you how and why we use chromosome browsers and tools to show if our matches match each other in addition to us and on which segments.  I’ve also illustrated why.  Neither 23andMe nor Family Tree DNA provides perfect tools, which is why we utilize both GedMatch and DNAGedcom, but they do provide tools.  Ancestry provides no tools of this type.

At Ancestry, you have two kinds of genetic matches – ones without tree matches and ones with tree matches.  Pedigree matching is a service that Ancestry provides that the other vendors don’t.  Unfortunately, it also leads people to believe that because they match these people genetically and share a tree, that the tree shown is THE genetic match and it’s to the ancestor shown in the tree.  In fact, if the tree is wrong, either your tree or their tree, and you match them genetically, you will show up as a pedigree match as well.  Even if both pedigrees are right, that still doesn’t mean that your genetic match is through that ancestor.

How many bad trees are at Ancestry percentagewise?  I don’t know, but it’s a constant complaint and there is absolutely nothing Ancestry can do about it.  All they can do is utilize what they have, which is what their customers provide.  And I’m glad they do.  It does make the process of working through your matches much easier. It’s a starting point.  DNA matches with trees that also match your pedigree are shown with Ancestry’s infamous shakey leaf.

In fact, in my Sarah Hickerson article, it was a shakey leaf match that initially clued me that there was something afoot – maybe. I had to shift to another platform (Family Tree DNA) to prove the match however, where I had tools and lots of known cousins.

At Ancestry, I now have about 3000 matches in total, and of those, I have 33 shakey leaves – or people with whom I also share an ancestor in our pedigree charts.  A few of those are the same old known cousins, just as genealogy crazy as me, and they’ve tested at all 3 companies.

The fly in the ointment, right off the bat, is that I noticed in several of these matches that I ALSO share another ancestral line.

Now, the great news is that Ancestry shows you your surnames in common, and you can click on the surname and see the common individuals in both trees.

The bad news is that you have to notice and click to see that information, found in the lower left hand corner of this screen.

chromosome browser war11

In this case, Cook is an entirely different line, not connected to the McKee line shown.

However, in this next case, we have the same individual entered in our software, but differently.  It wasn’t close enough to connect as an ancestor, but close enough to note.  It turns out that Sarah Cook is the mother of Fairwick Claxton, but her middle name was not Helloms, nor was her maiden name, although that is a long-standing misconception that was proven incorrect with her husband’s War of 1812 documents many years ago. Unfortunately, this misinformation is very widespread in trees on the internet.

chromosome browser war12

Out of curiosity, and now I’m sorry I did this because it’s very disheartening – I looked to see what James Lee Claxton/Clarkson’s wife’s name was shown to be on the first page of Ancestry’s advanced search matches.

Despite extensive genealogical and DNA research, we don’t know who James Lee Claxton/Clarkson’s parents are, although we’ve disproven several possibilities, including the most popular candidate pre-DNA testing.  However, James’ wife was positively Sarah Cook, as given by her, along with her father’s name, and by witnesses to their marriage provided when she applied for a War of 1812 pension and bounty land.  I have the papers from the National Archives.

James Lee Claxton’s wife, Sara Cook is identified as follows in the first 50 Ancestry search entries.

Sarah Cook – 4

Incorrect entries:

  • Sarah Cook but with James’ parents listed – 3
  • Sarah Helloms Cook – 2, one with James’ parents
  • Sarah Hillhorns – 15
  • Sarah Cook Hitson – 13, some with various parents for James
  • No wife, but various parents listed for James – 12
  • No wife, no parents – 1

I’d much rather see no wife and no parents than incorrect information.

Judy Russell has expressed her concern about the effects of incorrect trees and DNA as well and we shared this concern with Ancestry during our meeting.

Ancestry themselves in their paper titled “Identifying groups of descendants using pedigrees and genetically inferred relationships in a large database” says, “”As with all analyses relating to DNA Circles™, tree quality is also an important caveat and limitation.”  So Ancestry is aware, but they are trying to leverage and utilize one of their biggest assets, their trees.

This brings us to DNA Circles.  I reviewed Ancestry’s new product release extensively in my Ancestry’s Better Mousetrap article.  To recap briefly, Ancestry gathers your DNA matches together, and then looks for common ancestors in trees that are public using an intelligent ranking algorithm that takes into account:

  1. The confidence that the match is due to recent genealogical history (versus a match due to older genealogical history or a false match entirely).
  2. The confidence that the identified common recent ancestor represents the same person in both online pedigrees.
  3. The confidence that the individuals have a match due to the shared ancestor in question as opposed to from another ancestor or from more distant genealogical history.

The key here is that Ancestry is looking for what they term “recent genealogical history.”  In their paper they define this as 10 generations, but the beta version of DNA Circles only looks back 7 generations today.  This was also reflected in their phasing paper, “Discovering IBD matches across a large, growing database.”

However, the unfortunate effect has been in many cases to eliminate matches, especially from endogamous groups.  By way of example, I lost my Acadian matches in the Ancestry new product release.  They would have been more than 7 generations back, and because they were endogamous, they may have “looked like” IBS segments, if IBS is defined at Ancestry as more than 7 or 10 generations back.  Hopefully Ancestry will tweek this algorithm in future releases.

Ancestry, according to their paper, “Identifying groups of descendants using pedigrees and genetically inferred relationships in a large database,” then clusters these remaining matching individuals together in Circles based on their pedigree charts.  You will match some of these people genetically, and some of them will not match you but will match each other.  Again, according to the paper, “these confidence levels are calculated by the direct-line pedigree size, the number of shared ancestral couples and the generational depth of the shared MRCA couple.”

Ancestry notes that, “using the concordance of two independent pieces of information, meaning pedigree relationships and patterns of match sharing among a set of individuals, DNA Circles can serve as supporting evidence for documented pedigree lines.”  Notice, Ancestry did NOT SAY proof.  Nothing that Ancestry provides in their DNA product constitutes proof.

Ancestry continues by saying that Circles “opens the possibility for people to identify distant relatives with whom they do not share DNA directly but with whom they still have genetic evidence supporting the relationship.”

In other words, Ancestry is being very clear in this paper, which is provided on the DNA Circles page for anyone with Circles, that they are giving you a tool, not “the answer,” but one more piece of information that you can consider as evidence.

joel vannoy circleJoel Vannoy circle2

You can see in my Joel Vannoy circle that I match both of these people both genetically and on their tree.

We, in the genetic genealogy community, need proof.  It certainly could be available, technically – because it is with other vendors and third party sites.

We need to be able to prove that our matches also match each other, and utilizing Ancestry’s tools, we can’t.  We also can’t do this at Ancestry by utilizing third party tools, so we’re in essence, stuck.

We can either choose to believe, without substantiation, that we indeed share a common ancestor because we share DNA segments with them plus a pedigree chart from that common ancestor, or we can initiate a conversation with our match that leads to either or both of the following questions:

  1. Have you or would you upload your raw data to GedMatch?
  2. Have you or would you upload your raw data file to Family Tree DNA?

Let the begging begin!!!

The Problem

In a nutshell, the problem is that even if your Ancestry matches do reply and do upload their file to either Family Tree DNA or GedMatch or both, you are losing most of the potential information available, or that would be available, if Ancestry provided a chromosome browser and matrix type tool.

In other words, you’d have to convince all of your matches and then they would have to convince all of the matches in the circle that they match and you don’t to upload their files.

Given that, of the 44 private tree shakey leaf matches that I sent messages to about 2 weeks ago, asking only for them to tell me the identity of our common pedigree ancestor, so far 2 only of them have replied, the odds of getting an entire group of people to upload files is infinitesimal.  You’d stand a better chance of winning the lottery.

One of the things Ancestry excels at is marketing.

ancestry ad1

If you’ve seen any of their ads, and they are everyplace, they focus on the “feel good” and they are certainly maximizing the warm fuzzy feelings at the holidays and missing those generations that have gone before us.

ancestry ad2

This is by no means a criticism, but it is why so many people do take the Ancestry DNA test. It’s advertised as easy and you’ll learn more about your family.  And you do, no question – you learn about your ethnicity and you get a list of DNA matches, pedigree matches when possible and DNA Circles.

The list of what you don’t get is every bit as important, a chromosome browser and tools to see whether your matches also match each other.  However, most of their customers will never know that.

Judging by the high percentage of inaccurate trees I found at Ancestry in my little experiment relative to the known and documented wife’s name of James Lee Claxton, which was 96%, based on just the first page of 50 search matches, it would appear that about 96% of Ancestry’s clientele are willing to believe something that someone else tells them without verification.  I doubt that it matters whether that information is a tree or a DNA test where they are shown  matches with common pedigree charts and circles.  I don’t mean this to be critical of those people.  We all began as novices and we need new people to become interested in both genealogy and DNA testing.

I suspect that most of Ancestry’s clients, especially new ones, simply don’t have a clue that there is a problem, let alone the magnitude and scope.  How would they?  They are just happy to find information about their ancestor.  And as someone said to me once – “but there are so many of those trees (with a wrong wife’s name), how can they all be wrong?”  Plus, the ads, at least some of them, certainly suggest that the DNA test grows your family tree for you.

ancestry ad3 signoff

The good news in all of this is that Ancestry’s widespread advertising has made DNA testing just part of the normal things that genealogists do.  Their marketing expertise along with recent television programs have served to bring DNA testing into the limelight. The bad news is that if people test at Ancestry instead of at a vendor who provides tools, we, and they, lose the opportunity to utilize those results to their fullest potential.  We, and they, lose any hope of proving an ancestor utilizing DNA.  And let’s face it, DNA testing and genealogy is about collaboration.  Having a DNA test that you don’t compare against others is pointless for genealogy purposes.

When a small group of bloggers and educators visited Ancestry in October, 2014, for what came to be called DNA Day, we discussed the chromosome browser and Ancestry’s plans for their new DNA Circles product, although it had not yet been named at that time.  I wrote about that meeting, including the fact that we discussed the need for a chromosome browser ad nauseum.  Needless to say, there was no agreement between the genetic genealogy community and the Ancestry folks.

When we discussed the situation with Ancestry they talked about privacy and those types of issues, which you can read about in detail in that article, but I suspect, strongly, that the real reason they aren’t keen on developing a chromosome browser lies in different areas.

  1. Ancestry truly believes that people cannot understand and utilize a chromosome browser and the information it provides. They believe that people who do have access to chromosome browsers are interpreting the results incorrectly today.
  2. They do not want to implement a complex feature for a small percentage of their users…the number bantered around informally was 5%…and I don’t know if that was an off-the-cuff number or based on market research. However, if you compare that number with the number of accurate versus inaccurate pedigree charts in my “James Claxton’s wife’s name” experiment, it’s very close…so I would say that the 5% number is probably close to accurate.
  3. They do not want to increase their support burden trying to explain the results of a chromosome browser to the other 95%. Keep in mind the number of users you’re discussing. They said in their paper they had 500,000 DNA participants. I think it’s well over 700,000 today, and they clearly expect to hit 1 million in 2015. So if you utilize a range – 5% of their users are 25,000-50,000 and 95% of their users are 475,000-950,000.
  4. Their clients have already paid their money for the test, as it is, and there is no financial incentive for Ancestry to invest in an add-on tool from which they generate no incremental revenue and do generate increased development and support costs. The only benefit to them is that we shut up!

So, the bottom line is that most of Ancestry’s clients don’t know or care about a chromosome browser.  There are, however, a very noisy group of us who do.

Many of Ancestry’s clients who purchase the DNA test do so as an impulse purchase with very little, if any, understanding of what they are purchasing, what it can or will do for them, at Ancestry or anyplace else, for that matter.

Any serious genealogist who researched the autosomal testing products would not make Ancestry their only purchase, especially if they could only purchase one test.  Many, if not most, serious genealogists have tested at all three companies in order to fish in different ponds and maximize their reach.  I suspect that most of Ancestry’s customers are looking for simple and immediate answers, not tools and additional work.

The flip side of that, however, if that we are very aware of what we, the genetic genealogy industry needs, and why, and how frustratingly lacking Ancestry’s product is.

Company Focus

It’s easy for us as extremely passionate and focused consumers to forget that all three companies are for-profit corporations.  Let’s take a brief look at their corporate focus, history and goals, because that tells a very big portion of the story.  Every company is responsible first and foremost to their shareholders and owners to be profitable, as profitable as possible which means striking the perfect balance of investment and expenditure with frugality.  In corporate America, everything has to be justified by ROI, or return on investment.

Family Tree DNA

Family Tree DNA was the first one of the companies to offer DNA testing and was formed in 1999 by Bennett Greenspan and Max Blankfeld, both still principles who run Family Tree DNA, now part of Gene by Gene, on a daily basis.  Family Tree DNA’s focus is only on genetic genealogy and they have a wide variety of products that produce a spectrum of information including various Y DNA tests, mitochondrial, autosomal, and genetic traits.  They are now the only commercial company to offer the Y STR and mitochondrial DNA tests, both very important tools for genetic genealogists, with a great deal of information to offer about our ancestors.

In April 2005, National Geographic’s Genographic project was announced in partnership with Family Tree DNA and IBM.  The Genographic project, was scheduled to last for 5 years, but is now in its 9th year.  Family Tree DNA and National Geographic announced Geno 2.0 in July of 2012 with a newly designed chip that would test more than 12,000 locations on the Y chromosome, in addition to providing other information to participants.

The Genographic project provided a huge boost to genetic genealogy because it provided assurance of legitimacy and brought DNA testing into the living room of every family who subscribed to National Geographic magazine.  Family Tree DNA’s partnership with National Geographic led to the tipping point where consumer DNA testing became mainstream.

In 2011 the founders expanded the company to include clinical genetics and a research arm by forming Gene by Gene.  This allowed them, among other things, to bring their testing in house by expanding their laboratory facilities.  They have continued to increase their product offerings to include sophisticated high end tests like the Big Y, introduced in 2013.

23andMe

23andMe is also privately held and began offering testing for medical and health information in November 2007, initially offering “estimates of predisposition for more than 90 traits ranging from baldness to blindness.”  Their corporate focus has always been in the medical field, with aggregated customer data being studied by 23andMe and other researchers for various purposes.

In 2009, 23andMe began to offer the autosomal test for genealogists, the first company to provide this service.  Even though, by today’s standards, it was very expensive, genetic genealogists flocked to take this test.

In 2013, after several years of back and forth with 23andMe ultimately failing to reply to the FDA, the FDA forced 23andMe to stop providing the medical results.  Clients purchasing the 23andMe autosomal product since November of 2013 receive only ethnicity results and the genealogical matching services.

In 2014, 23andMe has been plagued by public relations issues and has not upgraded significantly nor provided additional tools for the genetic genealogy community, although they recently formed a liaison with My Heritage.

23andMe is clearly focused on genetics, but not primarily genetic genealogy, and their corporate focus during this last year in particular has been, I suspect, on how to survive, given the FDA action.  If they steer clear of that landmine, I expect that we may see great things in the realm of personalized medicine from them in the future.

Genetic genealogy remains a way for them to attract people to increase their data base size for research purposes.  Right now, until they can again begin providing health information, genetic genealogists are the only people purchasing the test, although 23andMe may have other revenue sources from the research end of the business

Ancestry.com

Ancestry.com is a privately held company.  They were founded in the 1990s and have been through several ownership and organizational iterations, which you can read about in the wiki article about Ancestry.

During the last several years, Ancestry has purchased several other genealogy companies and is now the largest for-profit genealogy company in the world.  That’s either wonderful or terrible, depending on your experiences and perspective.

Ancestry has had an on-again-off-again relationship with DNA testing since 2002, with more than one foray into DNA testing and subsequent withdrawal from DNA testing.  If you are interested in the specifics, you can read about them in this article.

Ancestry’s goal, as it is with all companies, is profitability.  However, they have given themselves a very large black eye in the genetic genealogy community by doing things that we consider to be civically irresponsible, like destroying the Y and mitochondrial DNA data bases.  This still makes no sense, because while Ancestry spends money on one hand to acquire data bases and digitize existing records, on the other hand, they wiped out a data base containing tens of thousands of irreplaceable DNA records, which are genealogy records of a different type.  This was discussed at DNA Day and the genetic genealogy community retains hope that Ancestry is reconsidering their decision.

Ancestry has been plagued by a history of missteps and mediocrity in their DNA products, beginning with their Y and mitochondrial DNA products and continuing with their autosomal product.  Their first autosomal release included ethnicity results that gave many people very high percentages of Scandinavian heritage.  Ancestry never acknowledged a problem and defended their product to the end…until the day when they announced an update titled….a whole new you.  They are marketing geniuses.  While many people found their updated product much more realistic, not everyone was happy.  Judy Russell wrote a great summary of the situation.

It’s difficult, once a company has lost their credibility, for them to regain it.

I think Ancestry does a bang up job of what their primary corporate goal is….genealogy records and subscriptions for people to access those records. I’m a daily user.  Today, with their acquisitions, it would be very difficult to be a serious genealogist without an Ancestry subscription….which is of course what their corporate goal has been.

Ancestry does an outstanding job of making everything look and appear easy.  Their customer interface is intuitive and straightforward, for the most part. In fact, maybe they have made both genealogy and genetic genealogy look a little too easy.  I say this tongue in cheek, full well knowing that the ease of use is how they attract so many people, and those are the same people who ultimately purchase the DNA tests – but the expectation of swabbing and the answer appearing is becoming a problem.  I’m glad that Ancestry has brought DNA testing to so many people but this success makes tools like the chromosome browser/matrix that much more important – because there is so much genealogy information there just waiting to be revealed.  I also feel that their level of success and visibility also visits upon them the responsibility for transparency and accuracy in setting expectations properly – from the beginning – with the ads. DNA testing does not “grow your tree” while you’re away.

I’m guessing Ancestry entered the DNA market again because they saw a way to sell an additional product, autosomal DNA testing, that would tie people’s trees together and provide customers with an additional tool, at an additional price, and give them yet another reason to remain subscribed every year.  Nothing wrong with that either.  For the owners, a very reasonable tactic to harness a captive data base whose ear you already have.

But Ancestry’s focus or priority is not now, and never has been, quality, nor genetic genealogy.  Autosomal DNA testing is a tool for their clients, a revenue generation source for them, and that’s it.  Again, not a criticism.  Just the way it is.

In Summary

As I look at the corporate focus of the three players in this space, I see three companies who are indeed following their corporate focus and vision.  That’s not a bad thing, unless the genetic genealogy community focus finds itself in conflict with the results of their corporate focus.

It’s no wonder that Family Tree DNA sponsors events like the International DNA Conference and works hand in hand with genealogists and project administrators.  Their focus is and always has been genetic genealogy.

People do become very frustrated with Family Tree DNA from time to time, but just try to voice those frustrations to upper management at either 23andMe or Ancestry and see how far you get.  My last helpdesk query to 23andMe submitted on October 24th has yet to receive any reply.  At Family Tree DNA, I e-mailed the project administrator liaison today, the Saturday after Thanksgiving, hoping for a response on Monday – but I received one just a couple hours later – on a holiday weekend.

In terms of the chromosome browser war – and that war is between the genetic genealogy community and Ancestry.com, I completely understand both positions.

The genetic genealogy community has been persistent, noisy, and united.  Petitions have been created and signed and sent to Ancestry upper management.  To my knowledge, confirmation of any communications surrounding this topic with the exception of Ancestry reaching out to the blogging and education community, has never been received.

This lack of acknowledgement and/or action on the issues at hand frustrates the community terribly and causes reams of rather pointed and very direct replies to Anna Swayne and other Ancestry employees who are charged with interfacing with the public.  I actually feel sorry for Anna.  She is a very nice person.  If I were in her position, I’d certainly be looking for another job and letting someone else take the brunt of the dissatisfaction.  You can read her articles here.

I also understand why Ancestry is doing what they are doing – meaning their decision to not create a chromosome browser/match matrix tool.  It makes sense if you sit in their seat and now have to look at dealing with almost a million people who will wonder why they have to use a chromosome browser and or other tools when they expected their tree to grow while they were away.

I don’t like Ancestry’s position, even though I understand it, and I hope that we, as a community, can help justify the investment to Ancestry in some manner, because I fully believe that’s the only way we’ll ever get a chromosome browser/match matrix type tool.  There has to be a financial benefit to Ancestry to invest the dollars and time into that development, as opposed to something else.  It’s not like Ancestry has additional DNA products to sell to these people.  The consumers have already spent their money on the only DNA product Ancestry offers, so there is no incentive there.

As long as Ancestry’s typical customer doesn’t know or care, I doubt that development of a chromosome browser will happen unless we, as a community, can, respectfully, be loud enough, long enough, like an irritating burr in their underwear that just won’t go away.

burr

The Future

What we “know” and can do today with our genomes far surpasses what we could do or even dreamed we could do 10 years ago or even 5 or 2 years ago.  We learn everyday.

Yes, there are a few warts and issues to iron out.  I always hesitate to use words like “can’t,” “never” and “always” or to use other very strongly opinionated or inflexible words, because those words may well need to be eaten shortly.

There is so much more yet to be done, discovered and learned.  We need to keep open minds and be willing to “unlearn” what we think we knew when new and better information comes along.  That’s how scientific discovery works.  We are on the frontier, the leading edge and yes, sometimes the bleeding edge.  But what a wonderful place to be, to be able to contribute to discovery on a new frontier, our own genes and the keys to our ancestors held in our DNA.

______________________________________________________________

Disclosure

I receive a small contribution when you click on some of the links to vendors in my articles. This does NOT increase the price you pay but helps me to keep the lights on and this informational blog free for everyone. Please click on the links in the articles or to the vendors below if you are purchasing products or DNA testing.

Thank you so much.

DNA Purchases and Free Transfers

Genealogy Services

Genealogy Research

Ancient DNA Matching – A Cautionary Tale

egg

I hope that all of my readers realize that you are literally watching science hatch.  We are on the leading, and sometimes bleeding edge, of this new science of genetic genealogy.  Because many of these things have never been done before, we have to learn by doing and experimenting.  Because I blog about this, these experiments are “in public,” so there is no option of a private “oops.”  Fortunately, I’m not sensitive about these kinds of things.  Plus, I think people really enjoy coming along for the ride of discovery.  I mean, where else can you do that?  It’s really difficult to get a ride-along on the space shuttle!

One of the best pieces of advice I ever got was from someone who was taken from my life far too early.  I had made a mistake of some sort…don’t even remember what…and he gave me a card that said, “The only people who don’t make mistakes are the people who don’t try.”

This isn’t an “oops” moment.  More like an “aha” moment.  Or more precisely, a “huh” moment.  It falls in the “Houston, we’ve got a problem” category.

So, this week’s new discovery is that there seems to be some inconsistency in the matching to the Anzick kit at GedMatch.  Before I go any further, I want to say very clearly that this is in no way a criticism of anyone or any tool.  Every person involved is a volunteer and we would not be making any of these steps forward, including a few backwards, without these wonderful volunteers and tools.

I have reached out to the people involved and asked for their help to unravel this mystery, and I’m sharing the story with you, partly so you can understand what is involved, and the process, partly so that you don’t inadvertently encounter the same kinds of issues and draw unrealistic or incorrect conclusions, and partly so you can help.  If there has been any common theme in all of my articles in the past week or so about the ancient DNA articles, it has been that we really don’t understand what conclusions to draw yet…and we still don’t.  So don’t.

Let’s introduce the players here.

The Players

Felix Chandrakumar has very graciously prepared the various ancient DNA files and uploaded them to GedMatch.  Felix has written a number of DNA analysis tools as well.

John Olson is one of the two volunteers who created and does everything at Gedmatch, plus works a full time job.  By the way, in case you’re not aware, this is a contribution site, meaning they depend on your financial contributions to function, purchase hardware, servers, etc.  If you use this site, periodically scroll down and click on the donate button.  We, as a community, would be lost without John and his partner.

David Pike is a long time genetic genealogist who I have had the pleasure of working with on a number of Native American and related topics over the years. He also has created several genetic genealogy tools to deal with autosomal DNA. David prepared the Anzick files for some private work we were doing several months ago, so he has experience with this DNA as well.  Dr. Pike has a great deal of experience analyzing the endogamous population of Newfoundland, which is also admixed with Native Americans.

Marie Rundquist, also a long time genetic genealogist who specializes in both technology and Acadian history along with genetic genealogy.  Acadians are proven to be admixed with Native Americans.  Marie shares my deep interest and commitment to Native American study and genetics.  Furthermore, Marie and I also share ancestors and co-administer several related projects.   As you might imagine, Marie and I took this opportunity immediately to see if she and her mother share any of Anzick’s segments with me and my mother.

So, a big thank you to all of these people.

The Mystery

When Felix originally e-mailed me about the Anzick kit being uploaded to GedMatch, as you might imagine, I stopped doing whatever I was doing and immediately went to study Anzick and the other ancient DNA kits.

I wrote about this experience in the article, “Utilizing Ancient DNA at GedMatch.”

As part of that process, I not only ran Anzick’s kit utilizing the “one to many” option, I also compared my own kit to Anzick’s.  My proven Native lines descend through my mother, so I ran her kit against Anzick’s as well, at the same thresholds, and I combined the two results to see where mother and I overlapped.

I showed these overlaps in the article, along with which genealogy lines they matched by utilizing my ancestor matching spreadsheet.

Everything was hunky dory…for then.

Day 2

The next day, I received a note from Felix that the Anzick kit may not have been fully tokenized at GedMatch previously, so I reran the Anzick “one to all” comparison and wrote about those results in the second article, “Analyzing the Native American Clovis Ancient Results.”  Because it wasn’t yet fully processed originally, the second results produced more matches, not fewer.

I wasn’t worried about the one to one comparison of Anzick to my own kit, because one to one comparisons are available immediately, while one to many comparisons are not, per the GedMatch instructions.

“Once you have loaded your data, you will be able to use some features of the site within a minute or so. Additional batch processing, which usually takes a couple of days, must complete before you can use some of the tools comparing you to everyone in the data pool.”

So, everything was stlll hunky dory.

Day 3

The next day, Marie and I had a few minutes, sometime between 2 and 3AM, and no, I’m not kidding.  We decided to compare results.  I decided it would be quicker to run the match again at GedMatch than to sort through my Master spreadsheet, into which I had copied the results and added other information.  So, I did a second download of the Anzick comparison, utilizing the exact same thresholds (200 SNPs, 2cM, and the rest left at the default,) and added them to a spreadsheet that Marie and I were passing back and forth, and sent them to Marie.  I noticed that there seemed to be fewer matches, but by then it was after 3AM and I decided to follow up on that later.

Not so hunky dory…but I didn’t know it yet.

Day 4

The following day, Dr. Ann Turner (MD), also a long-time genetic genealogist, posted the following comment on the article.

“These results, finding “what appear to be contemporary matches for the Anzick child”, seemed very counter-intuitive to me, so I asked John Olson of GEDMatch to look under the hood a bit more. It turns out the ancient DNA sequence has many no-calls, which are treated as universal matches for segment analysis. Another factor which should be examined is whether some of the matching alleles are simply the variants with the highest frequency in all populations. If so, that would also lead to spurious matching segments. It may not be appropriate to apply tools developed for genetic genealogy to ancient DNA sequences like this without a more thorough examination of the underlying data.”

I had been aware of the no-calls due to the work that Dr. David Pike did back in March with the Anzick raw data files, but according to David, that shouldn’t affect the results.

Here’s what Dr. Pike, a Professor of Mathematics, had to say:

“Yes, these forensic samples have very high No-Call rates, which may give rise to more false matches than we would normally experience.  Also, be aware that false matches are more prone to occur when using reduced thresholds (such as 100 SNPs and 1 cM) and unphased data.  In this case I don’t think there’s any way around using low thresholds, simply because we’re looking for very small blocks of DNA (probably nobody alive today will have any large matching blocks with the Anzick child).

On the assumption that there will be a nearly constant noise ratio, meaning that most people will have about the same number of false matches with the Anzick child, those who are from the same gene pool should have an increased number of real matches.  So by comparing the total amount of matching DNA, it ought to be possible to gauge people’s affinity with Anzick’s gene pool.”

Here are Felix’s comments about no-calls as well:

“Personally, no calls are fine as long as there are more SNPs matching above the threshold level because the possibility of errors occurring exactly on no-call positions for all the matches in all their matching segments is impossible.”

Courtesy of Felix, we’ll see an example of how no calls intersperse in  a few minutes.

If no-calls were causing spurious matches in the Anzick kit, you’d expect to see the same for the other ancient DNA kits.  I know that the Denisovan and Neanderthal kits also have many no-calls, and based on the nature of ancient DNA, I’m sure all of them do.  So, if no calls are the culprit, they should be affecting matches to the other kits in the same way, and they aren’t.

Hunky-doryness is being replaced by a nonspecific nagging feeling…same one I used to get when my teenagers were up to something.

Day 5

A day or so later, Felix uploaded file F999913 to replace F999912 with the complete SNPs from all of the companies.  The original 999912 kit only included the SNP locations utilized by Family Tree DNA.  Felix added the SNPs utilized by 23and Me not utilized at Family Tree DNA, and the ones from Ancestry as well.  This is great news for anyone who tested at those two companies, but I had utilized my kit from Family Tree DNA, so for me, there should be no difference at all.

I later asked Felix if he had changed anything else in the file, and he said that he had not.  He provided extensive documentation about what he had done.

I waited until kit F999912 was deleted to be sure tokenizing was complete for F999913 and re-compared the data again.  As expected, Anzick’s one to all had more matches than before, because additional people were included due to the added SNPs from 23andMe and Ancestry.

Some of Anzick’s matches are in the contemporary range, at 3.1 estimated generations, with the largest cM segment of 22.8 and total cMs of 202.8.

anzick 999913

These relatively large matches cause Felix to question whether the sample is actually ancient, based on these relatively large segments.  I addressed my feelings on this in the article, Ancient DNA Matches – What Do They Mean?

Marie and Dr. Pike, both with extensive experience with admixed populations addressed this as well.  Marie commented,

“Native DNA found in the Anzick sample hasn’t changed all of that much and may still be found in modern, Native American populations, and that if people have Native American ancestry, they’ll match to it.”

Dr. Pike says:

“I agree with Marie on this… within endogamous populations, there is an increased likelihood of blocks of DNA being preserved over lengthy time frames.  Moreover, even if a block of DNA gets cut up via recombination, within an endogamous population the odds of some parts of the block later reuniting in a person’s DNA are higher than otherwise.  And it exaggerates the closeness of [the] relationship that gets predicted when comparing people.

I have seen something similar within the Newfoundland & Labrador Family Finder Project, whereby lots of people are sharing small blocks of DNA, likely as a result of DNA from the early colonists still circulating among the modern gene pool.

As an anecdotal example, I have a semi-distant relative (with ancestry from Newfoundland) at 23andMe who shares 3 blocks of DNA with my father, 2 with my mother and 5 five me.  As you can imagine, the relative is predicted to be a closer cousin to me than she is to either of my parents!

It doesn’t take an endogamous or isolated population to see this effect.

It can also happen in families involving cousin marriages too, although that would be more pronounced and not quite the same thing as we’re discussing with respect to ancient DNA.”

This addition of other companies SNPs should not affect my matches with Anzick because my kits are both from FTDNA and won’t utilize the added SNPs.

However, I ran my and my mother’s matches again, and we had a significantly different outcome than either of the previous times.

I utilized the same threshold for all downloads and those are the only values I changed – 200 SNPs and 2cM, leaving the other values at default, for all Anzick comparisons to my mother and my kits.

I am not hunky-dory anymore.

The Heartburn

These matches, which should be the same in all three downloads, produced significantly different results.

Here are the number of matches at the same threshold comparing me and Mom to the Anzick file:

Me and Anzick

  • original download 999912 – 47 matches
  • second download 999912 – 21 matches
  • 999913 – 35 matches

Mom and Anzick

  • original download 999912 – 63
  • second download 999912 – 37
  • 999913 – 36

And no, the 36 /35 that mom and I have for 999913 are not all the same.

Kit Number Matches Between Me, Mother and Anzick
#1-F999912 original download 19
#2-F999912 second download 6
#3-F999913 11

Of those various downloads, the following grid shows which ones matched each other.

#1 to #2 #2 to #3 #1 to #3 All 3
# of Matches 6 2 3 2

So, comparing the first download to the last download, of the 19 original matches, we lost 16 matches.  In the third download, we gained 8 matches and only 3 remained as common matches. So of 30 total matches between my mother, myself and Anzick, in two downloads that should have been exactly the same, only 3 matches held, or 10%.

Obviously, something is wrong, but what, and where?  At that point, I asked Marie to download her and her mother’s results again too, and she experienced the same issue.

Clearly a problem exists someplace.  That’s the question I asked Felix, John and David to help answer.

I realize that this spreadsheet it very long, and I apologize, but I think this issue is much easier to see visually.  I’ve compiled the matches by color and shade to make looking at them relatively easy.

My matches to the Anzick kit are in shades of pink – the first match download being the lightest and the last one to kit F999913 being the darkest.  Mother is green, same shading scheme.

The three columns to the right show the matching segments for each download – shaded in green.  You can easily see which ones line up, meaning which ones match consistently across all three downloads.  There aren’t many.  They should all match.

anzick me mom problem

Obviously this led to many questions that I asked of the various players involved.

My first thought was that perhaps a matching algorithm change occurred in GedMatch, but John assured me that he had made no changes.

Next question was whether or not Felix changed something other than adding the 23andMe and Ancestry SNPs.  He had not.

Felix was kind enough to explain about bunching and to do some analysis on the files.

“When you have low thresholds, make sure you don’t allow errors. For example, at 200 SNPs, the default ‘Mismatch Evaluation window’ and in GEDMatch is same as SNP threshold and ‘Mismatch-Bunching limit’ is half of mismatch evaluation window. So, at 200 cM, you are allowing 1 error every 100 SNPs apart from no-calls.

I did some analysis on your phased mother’s kit, PF6656M1 so that at least we know that it is an IBD for one generation.  The spreadsheet (below) are segments I found at 2 cM/200 SNPs threshold without allowing any errors.”

Kit PF6656M1 is one single kit created by phasing my data against my mother’s so that we don’t have to run both kits.  I had not utilized the phased kit previously, so I was interested in his results.

felix anzick

The results above confirm chromosome matches, 2, 17, 19 and 21, but introduce a new match on chromosome 4.  This match was present in the original download, but not in the second or third download, so once again, we have disparate data, except the thresholds Felix used were at a different level.

One of the more interesting things that Felix included is the no-call match information, the three columns to the right.  I want to show what the no-calls look like.  There are not huge segments that are blank and are being called as matches because they are no-calls, when they shouldn’t be.  No calls are scattered like salt and pepper.  In fact, no calls happen in every kit and they are called as matches so they don’t in fact disrupt a valid match string, potentially making it too small to be considered a match.  Of course, ancient DNA has more no-calls that contemporary DNA kits.

Below are the first few match positions from chromosome 2 where mother, Anzick and I have a confirmed match across all downloads.  The genotype shows you that both kits match.

felix no calls

For consistency, I ran the same kits that Felix ran, PF6656M1 and F999913, with the original thresholds I had used, and found the following:

Chr Start Location End Location Centimorgans (cM) SNPs
1 31358221 33567640 2.0 261
2 218855489 220351363 2.4 253
4 1957991 3571907 2.5 209
5 2340730 2982499 2.3 200
17 53111755 56643678 3.4 293
19 46226843 48568731 2.2 250
21 35367409 36761280 3.7 215

This introduces chromosomes 1 and 5, not shown above.   The chromosome 1 match was shown in the first and second download, but not the third, and the chromosome 5 match was shown in the first download only, but not the second or third.

Can you see me beating my head against the wall yet??

In a fit of apparent insanity, I decided to try, once again, an individual download of Anzick compared to my mother and to me, but not utilizing the phased kit – the original F6656 and F9141, and at the original thresholds, for consistency.  I wanted to see if the matches were the same now as they were a day or so ago.  They should be exact.  This first one is mine.

me second 999913

What you should see are two identical downloads.  I have color coded the rows so you can see easily – and what you should see are candy-cane stripes – one red and one white for every match location.

That’s not what we’re seeing.  The kits are the same, the match parameters are the same, but the results are not.  Once again, the downloads don’t match.

I did another match on mother and Anzick, and her results were consistent between the first and second match to kit F999913.

mom second 999913

The begs the next question.  Have mother’s results always been consistent, suggesting a problem with my kit?

I sorted all of her downloads, and no, they are not consistent, except for the first and second download matches to kit F999913, shown above.  The inconsistencies show up in both mother and my kits, although not in the same locations.  Recall also that Marie had the same issue.

In Summary

Something is wrong, someplace.  I know that sounds intuitively obvious – NOW.  But it wasn’t initially and I wouldn’t even have suspected a problem without running the second and third downloads, quite unintentionally.  Most people never do that, because once you’ve done the match, you have no reason to ever match to that particular person again.  Given that, you’ll never know if a problem exists.

So, the only Anzick GedMatch matches I have any confidence in at all, at this point, are the few that are consistent between all of the downloads, and I didn’t add the fourth download into the mix.  I don’t’ see any point because I’ve pretty much concluded that until we determine where the issue resides, that I won’t have confidence in the results.

The next question that comes to mind, and that I can’t answer, is whether or not this issue is present in contemporary matching kits – or if this is somehow an ancient DNA problem – although I don’t know quite how that could be – since matching is matching.

I haven’t saved any matches that I’ve run to other people in spreadsheets, so I can’t go back and see if a GedMatch match today produces the exact same results as a previous match.

Clearly there is no diagnosis or solution in this summary.  We are not yet hunky dory.

What You Can Do

  1. Run your Anzick and ancient DNA matches multiple times, at the same exact thresholds, on different days, to see if your results are consistent or inconsistent. Same kit, same thresholds, the results should be identical.
  2. If you have some saved GedMatch matches with contemporary people, and you are positive of the match thresholds used, please run them again to see if the results are identical. They should be.
  3. No drawing of or jumping to conclusions, please, especially about ancient DNA:) It’s a journey and we are fellow pilgrims!

If your results are not consistent, please document the problem and let the appropriate person know.  I don’t want to overwhelm John at GedMatch but I’m concerned at this point that the problem may not be isolated to ancient DNA matching since the issue seems to extend to Marie’s results as well.

If your results, especially to Anzick, from previous matches to now are consistent, that’s worth knowing too.  Please add a comment to that effect.

Thoughts and ideas are welcome.

______________________________________________________________

Disclosure

I receive a small contribution when you click on some of the links to vendors in my articles. This does NOT increase the price you pay but helps me to keep the lights on and this informational blog free for everyone. Please click on the links in the articles or to the vendors below if you are purchasing products or DNA testing.

Thank you so much.

DNA Purchases and Free Transfers

Genealogy Services

Genealogy Research

Ancient DNA Matches – What Do They Mean?

The good news is that my three articles about the Anzick and other ancient DNA of the past few days have generated a lot of interest.

The bad news is that it has generated hundreds of e-mails every day – and I can’t possibly answer them all personally.  So, if you’ve written me and I don’t reply, I apologize and  I hope you’ll understand.  Many of the questions I’ve received are similar in nature and I’m going to answer them in this article.  In essence, people who have matches want to know what they mean.

Q – I had a match at GedMatch to <fill in the blank ancient DNA sample name> and I want to know if this is valid.

A – Generally, when someone asks if an autosomal match is “valid,” what they really mean is whether or not this is a genealogically relevant match or if it’s what is typically referred to as IBS, or identical by state.  Genealogically relevant samples are referred to as IBD, or identical by descent.  I wrote about that in this article with a full explanation and examples, but let me do a brief recap here.

In genealogy terms, IBD is typically used to mean matches over a particular threshold that can be or are GENEALOGICALLY RELEVANT.  Those last two words are the clue here.  In other words, we can match them with an ancestor with some genealogy work and triangulation.  If the segment is large, and by that I mean significantly over the threshold of 700 SNPs and 7cM, even if we can’t identify the common ancestor with another person, the segment is presumed to be IBD simply because of the math involved with the breakdown of segment into pieces.  In other words, a large segment match generally means a relatively recent ancestor and a smaller segment means a more distant ancestor.  You can readily see this breakdown on this ISOGG page detailing autosomal DNA transmission and breakdown.

Unfortunately, often smaller segments, or ones determined to be IBS are considered to be useless, but they aren’t, as I’ve demonstrated several times when utilizing them for matching to distant ancestors.  That aside, there are two kinds of IBS segments.

One kind of IBS segment is where you do indeed share a common ancestor, but the segment is small and you can’t necessarily connect it to the ancestor.  These are known as population matches and are interpreted to mean your common ancestor comes from a common population with the other person, back in time, but you can’t find the common ancestor.  By population, we could mean something like Amish, Jewish or Native American, or a country like Germany or the Netherlands.

In the cases where I’ve utilized segments significantly under 7cM to triangulate ancestors, those segments would have been considered IBS until I mapped them to an ancestor, and then they suddenly fell into the IBD category.

As you can see, the definitions are a bit fluid and are really defined by the genealogy involved.

The second kind of IBS is where you really DON’T share an ancestor, but your DNA and your matches DNA has managed to mutate to a common state by convergence, or, where your Mom’s and Dad’s DNA combined form a pseudo match, where you match someone on a segment run long enough to be considered a match at a low level.  I discussed how this works, with examples, in this article.  Look at example four, “a false match.”

So, in a nutshell, if you know who your common ancestor is on a segment match with someone, you are IBD, identical by descent.  If you don’t know who your common ancestor is, and the segment is below the normal threshold, then you are generally considered to be IBS – although that may or may not always be true.  There is no way to know if you are truly IBS by population or IBS by convergence, with the possible exception of phased data.

Data phasing is when you can compare your autosomal DNA with one or both parents to determine which half you obtained from whom.  If you are a match by convergence where your DNA run matches that of someone else because the combination of your parents DNA happens to match their segment, phasing will show that clearly.  Here’s an example for only one location utilizing only my mother’s data phased with mine.  My father is deceased and we have to infer his results based on my mother’s and my own.  In other words, mine minus the part I inherited from my mother = my father’s DNA.

My Result My Result Mother’s Result Mother’s Result Father’s Inferred Result Father’s Inferred Result
T A T G A

In this example of just one location, you can see that I carry a T and an A in that location.  My mother carries a T and a G, so I obviously inherited the T from her because I don’t have a G.  Therefore, my father had to have carried at least an A, but we can’t discern his second value.

This example utilized only one location.  Your autosomal data file will hold between 500,000 and 700,000 location, depending on the vendor you tested with and the version level.

You can phase your DNA with that of your parent(s) at GedMatch.  However, if both of your parents are living, an easier test would be to see if either of your parents match the individual in question.  If neither of your parents match them, then your match is a result of convergence or a data read error.

So, this long conversation about IBD and IBS is to reach this conclusion.

All of the ancient specimens are just that, ancient, so by definition, you cannot find a genealogy match to them, so they are not IBD.  Best case, they are IBS by population.  Worse case, IBS by convergence.  You may or may not be able to tell the difference.  The reason, in my example earlier this week, that I utilized my mother’s DNA and only looked at locations where we both matched the ancient specimens was because I knew those matches were not by convergence – they were in fact IBS by population because my mother and I both matched Anzick.

ancient compare5

Q – What does this ancient match mean to me?

A – Doggone if I know.  No, I’m serious.  Let’s look at a couple possibilities, but they all have to do with the research you have, or have not, done.

If you’ve done what I’ve done, and you’ve mapped your DNA segments to specific ancestors, then you can compare your ancient matching segments to your ancestral spreadsheet map, especially if you can tell unquestionably which side the ancestral DNA matches.  In my case, shown above, the Clovis Anzik matched my mother and me on the same segment and we both matched Cousin Herbie.  We know unquestionably who our common ancestor is with cousin Herbie – so we know, in our family line, which line this segment of DNA shared with Anzick descends through.

ancient compare6

If you’re not doing ancestor mapping, then I guess the Anzick match would come in the category of, “well, isn’t that interesting.”  For some, this is a spiritual connection to the past, a genetic epiphany.  For other, it’s “so what.”

Maybe this is a good reason to start ancestor mapping!  This article tells you how to get started.

Q – Does my match to Anzick mean he is my ancestor?

A – No, it means that you and Anzick share common ancestry someplace back in time, perhaps tens of thousands of years ago.

Q – I match the Anzick sample.  Does this prove that I have Native American heritage? 

A – No, and it depends.  Don’t you just hate answers like this?

No, this match alone does not prove Native American heritage, especially not at IBS levels.  In fact, many people who don’t have Native heritage match small segments?  How can this be?  Well, refer to the IBS by convergence discussion above.  In addition, Anzick child came from an Asian population when his ancestors migrated, crossing from Asia via Beringia.  That Eurasian population also settled part of Europe – so you could be matching on very small segments from a common population in Eurasia long ago.  In a paper just last year, this was discussed when Siberian ancient DNA was shown to be related to both Native Americans and Europeans.

In some cases, a match to Anzick on a segment already attributed to a Native line can confirm or help to confirm that attribution.  In my case, I found the Anzick match on segments in the Lore family who descend from the Acadians who were admixed with the Micmac.  I have several Anzick match segments that fit that criteria.

A match to Anzick alone doesn’t prove anything, except that you match Anzick, which in and of itself is pretty cool.

Q – I’m European with no ancestors from America, and I match Anzick too.  How can that be?

A – That’s really quite amazing isn’t it.  Just this week in Nature, a new article was published discussing the three “tribes” that settled or founded the European populations.  This, combined with the Siberian ancient DNA results that connect the dots between an ancient population that contributed to both Europeans and Native Americans explains a lot.

3 European Tribes

If you think about it, this isn’t a lot different than the discovery that all Europeans carry some small amount of Neanderthal and Denisovan DNA.

Well, guess what….so does Anzick.

Here are his matches to the Altai Neanderthal.

Chr Start Location End Location Centimorgans (cM) SNPs
2 241484216 242399416 1.1 138
3 19333171 21041833 2.6 132
6 31655771 32889754 1.1 133

He does not match the Caucasus Neanderthal.  He does, however, match the Denisovan individual on one location.

Chr Start Location End Location Centimorgans (cM) SNPs
3 19333171 20792925 2.1 107

Q – Maybe the scientists are just wrong and the burial is not 12,500 years old,  maybe just 100 years old and that’s why the results are matching contemporary people.

A – I’m not an archaeologist, nor do I play one…but I have been closely involved with numerous archaeological excavations over the past decade with The Lost Colony Research Group, several of which recovered human remains.  The photo below is me with Anne Poole, my co-director, sifting at one of the digs.

anne and me on dig

There are very specific protocols that are followed during and following excavation and an error of this magnitude would be almost impossible to fathom.  It would require  kindergarten level incompetence on the part of not one, but all professionals involved.

In the Montana Anzick case, in the paper itself, the findings and protocols are both discussed.  First, the burial was discovered directly beneath the Clovis layer where more than 100 tools were found, and the Clovis layer was undisturbed, meaning that this is not a contemporary burial that was buried through the Clovis layer.  Second, the DNA fragmentation that occurs as DNA degrades correlated closely to what would be expected in that type of environment at the expected age based on the Clovis layer.  Third, the bones themselves were directly dated using XAD-collagen to 12,707-12,556 calendar years ago.  Lastly, if the remains were younger, the skeletal remains would match most closely with Native Americans of that region, and that isn’t the case.  This graphic from the paper shows that the closest matches are to South Americans, not North Americans.

anzick matches

This match pattern is also confirmed independently by the recent closest GedMatch matches to South Americans.

Q – How can this match from so long ago possibly be real?

A – That’s a great question and one that was terribly perplexing to Dr. Svante Paabo, the man who is responsible for producing the full genome sequence of the first, and now several more, Neanderthals.  The expectation was, understanding autosomal DNA gets watered down by 50% in every generation though recombination, that ancient genomes would be long gone and not present in modern populations.  Imagine Svante’s surprise when he discovered that not only isn’t true, but those ancient DNA segmetns are present in all Europeans and many Asians as well.  He too agonized over the question about how this is possible, which he discussed in this great video.  In fact he repeated these tests over and over in different ways because he was convinced that modern individuals could not carry Neanderthal DNA – but all those repeated tests did was to prove him right.  (Paabo’s book, Neanderthal Man, In Search of Lost Genomes is an incredible read that I would highly recommend.)

What this means is that the population at one time, and probably at several different times, had to be very small.  In fact, it’s very likely that many times different pockets of the human race was in great jeopardy of dying out.  We know about the ones that survived.  Probably many did perish leaving no descendants today.  For example, no Neanderthal mitochondrial DNA has been found in any living or recent human.

In a small population, let’s say 5 males and 5 females who some how got separated from their family group and founded a new group, by necessity.  In fact, this could well be a description of how the Native Americans crossed Beringia.  Those 5 males and 5 females are the founding population of the new group.  If they survive, all of the males will carry the men’s haplogroups – let’s say they are Q and C, and all of the descendants will carry the mitochondrial haplogroups of the females – let’s say A, B, C, D and X.

There is a very limited amount of autosomal DNA to pass around.  If all of those 10 people are entirely unrelated, which is virtually impossible, there will be only 10 possible combinations of DNA to be selected from.  Within a few generations, everyone will carry part of those 10 ancestor’s DNA.  We all have 8 ancestors at the great-grandparent level.  By the time those original settlers’ descendants had great-great-grandparents – of which each one had 16, at least 6 of those original people would be repeated twice in their tree.

There was only so much DNA to be passed around.  In time, some of the segments would no longer be able to be recombined because when you look at phasing, the parents DNA was exactly the same, example below.  This is what happens in endogamous populations.

My Result My Result Mother’s Result Mother’s Result Father’s Result Father’s  Result
T T T T T T

Let’s say this group’s descendants lived without contact with other groups, for maybe 15,000 years in their new country.  That same DNA is still being passed around and around because there was no source for new DNA.  Mutations did occur from time to time, and those were also passed on, of course, but that was the only source of changed DNA – until they had contact with a new population.

When they had contact with a new population and admixture occurred, the normal 50% recombination/washout in every generation began – but for the previous 15,000 years, there had been no 50% shift because the DNA of the population was, in essence, all the same.  A study about the Ashkenazi Jews that suggests they had only a founding population of about 350 people 700 years ago was released this week – explaining why Ashkenazi Jewish descendants have thousands of autosomal matches and match almost everyone else who is Ashkenazi.  I hope that eventually scientists will do this same kind of study with Anzick and Native Americans.

If the “new population” we’ve been discussing was Native Americans, their males 15,000 year later would still carry haplogroups Q and C and the mitochondrial DNA would still be A, B, C, D and X.  Those haplogroups, and subgroups formed from mutations that occurred in their descendants, would come to define their population group.

In some cases, today, Anzick matches people who have virtually no non-Native admixture at the same level as if they were just a few generations removed, shown on the chart below.

anzick gedmatch one to all

Since, in essence, these people still haven’t admixed with a new population group, those same ancient DNA segments are being passed around intact, which tells us how incredibly inbred this original small population must have been.  This is known as a genetic bottleneck.

The admixture report below is for the first individual on the Anzick one to all Gedmatch compare at 700 SNPs and 7cM, above.  In essence, this currently living non-admixed individual still hasn’t met that new population group.

anzick1

If this “new population” group was Neanderthal, perhaps they lived in small groups for tens of thousands of years, until they met people exiting Africa, or Denisovans, and admixed with them.

There weren’t a lot of people anyplace on the globe, so by virtue of necessity, everyone lived in small population groups.  Looking at the odds of survival, it’s amazing that any of us are here today.

But, we are, and we carry the remains, the remnants of those precious ancestors, the Denisovans, the Neanderthals and Anzick.  Through their DNA, and ours, we reach back tens of thousands of years on the human migration path.  Their journey is also our journey.  It’s absolutely amazing and it’s no wonder people have so many questions and such a sense of enchantment.  But it’s true – and only you can determine exactly what this means to you.

______________________________________________________________

Disclosure

I receive a small contribution when you click on some of the links to vendors in my articles. This does NOT increase the price you pay but helps me to keep the lights on and this informational blog free for everyone. Please click on the links in the articles or to the vendors below if you are purchasing products or DNA testing.

Thank you so much.

DNA Purchases and Free Transfers

Genealogy Services

Genealogy Research

Utilizing Ancient DNA at GedMatch

Mummy of 6 month old boy found in Greenland

It has been a wonderful week for those of us following ancient DNA full genome sequencing, because now we can compare our own results to those of the ancient people found whose DNA has been fully sequenced, including one Native American.

Felix Chandrakumar has uploaded the autosomal files of five ancient DNA specimens that have been fully sequenced to GedMatch.  Thanks Felix.

When news of these sequences first hit the academic presses, I was wishing for a way to compare our genomes – and now my wish has come true.

Utilizing GedMatch’s compare one to all function, I ran all of the sequences individually and found, surprisingly, that there are, in some cases, matches to contemporary people today.  I dropped the cM measure to 1 for both autosomal and X.

Please note that because these are ancient DNA sequences, they will all have some segments missing and none can be expected to be entirely complete.  Still, these sequences are far better than nothing.

1.  Montana Anzick at GedMatch

This is the only clearly Native American sample.

http://www.y-str.org/2014/09/clovis-anzick-dna.html

F999912

9-27-2014 – Please note that kit F999912 has been replaced by kit F999913.

10-23-2014 – Please note that kit F999913 has been replaced by kit F999919.

No matches at 1cM in the compare to all.  This must be because the SNP count is still at default thresholds, in light of information discovered later in this article.

Update – as it turns out, this kit was not finished processing when I did the one to one compare.  After it finished, the results were vastly different.  See this article for results.

2.  Paleo Eskimo from Greenland at GedMatch

http://www.y-str.org/2013/12/palaeo-eskimo-2000-bc-dna.html

F999906

Thirty-nine matches with segments as large at 3.8.  One group of matches appears to be a family.  One of these matches is my cousin’s wife.  That should lead to some interesting conversation around the table this holiday season!  All of these matches, except 1, are on the X chromosome.  This must be a function of these segments being passed intact for many generations.

I wrote about some unusual properties of X chromosomal inheritance and this seems to confirm that tendency in the X chromosome, or the matching thresholds are different at GedMatch for the X.

3.  Altai Neanderthal at GedMatch

http://www.y-str.org/2013/08/neanderthal-dna.html

F999902

One match to what is obviously another Neaderthal entry.

4.  Russian Causasus Neanderthal at GedMatch

Another contribution from the Neanderthal Genome Project.

http://www.y-str.org/2014/09/mezmaiskaya-neanderthal-dna.html

F999909

No matches.

5.  Denisova at GedMatch

http://www.y-str.org/2013/08/denisova-dna.html

F999903

Two matches, one to yet another ancient entry and one to a contemporary individual on the X chromosome.

But now, for the fun part.

My Comparison

Before I start this section, I want to take a moment to remind everyone just how old these ancient segments are.

  • Anzick – about 12,500 years old
  • Paleo-Eskimo – about 4,000 years old
  • Altai Neanderthal – about 50,000 years old
  • Russian Caucasus Neanderthal – about 29,000 years old
  • Denisova – about 30,000 years old

In essence, the only way for these segments to survive intact to today would have been for them to enter the population of certain groups, as a whole, to be present in all of the members of that group, so that segment would no longer be divided and would be passed intact for many generation, until that group interbred with another group who did not carry that segment.  This is exactly what we see in endogamous populations today, such as the Askenazi Jewish population who is believed, based on their common shared DNA, to have descended from about 350 ancestors about 700 years ago.  Their descendants today number in the millions.

So, let’s see what we find.

I compared by own kit at GedMatch utilizing the one to one comparison feature, beginning with 500 SNPs and 1cM, dropping the SNP values to 400, then 300, then 200, until I obtained a match of some sort, if I obtained a match at all.

Typically in genetic genealogy, we’re looking for genealogy matches, so the default matching thresholds are set relatively high.  In this case, I’m looking for deep ancestral connections, if they exist, so I was intentionally forcing the thresholds low.  I’m particularly interested in the Anzick comparison, in light of my Native American and First Nations heritage.

The definition of IBS, identical by state, vs IBD, identical by descent segments varies by who is talking and in what context, but in essence, IBD means that there is a genealogy connection in the past several generations.

IBS means that the genealogy connection cannot be found and the IBS match can be a function of coming from a common population at some time in the past, or it can be a match by convergence, meaning that your DNA just happened to mutate to the same state as someone else’s.  If this is the case, then you wouldn’t expect to see multiple segments matching the same person and you would expect the matching segments to be quite short.  The chances of hundreds of SNPs just happening to align becomes increasingly unlikely the longer the matching SNP run.

So, having said that, here are my match results.

Anzick

I had 2 matches at 400 SNPs, several at 300 and an entire list at 200, shown below.

Chr Start Location End Location Centimorgans (cM) SNPs
1 6769350 7734985 1.7 232
1 26552555 29390880 1.9 264
1 31145273 33730360 2.7 300
1 55655110 57069976 1.9 204
1 71908934 76517614 2.8 265
1 164064635 165878596 2.8 264
1 167817718 171330902 3.3 466
1 186083870 192208998 4.2 250
2 98606363 100815734 1.4 256
2 171132725 173388331 2.0 229
2 218855489 220373983 2.5 261
3 128892631 131141396 1.7 263
3 141794591 143848459 2.5 207
4 1767539 3571907 2.7 235
4 70345811 73405268 2.5 223
5 2340730 2982499 2.3 200
5 55899022 57881001 2.3 231
5 132734528 134538202 1.9 275
5 137986213 140659207 1.7 241
6 34390761 36370969 1.8 293
8 17594903 18464321 1.9 200
8 23758017 25732105 1.7 240
8 109589884 115297391 1.9 203
9 122177526 124032492 1.6 229
10 101195132 102661955 1.2 264
10 103040561 105596277 1.3 304
10 106135611 108371247 1.5 226
12 38689229 41184500 1.6 247
13 58543514 60988948 1.6 220
13 94528801 95252127 1.0 277
14 60929984 62997711 1.8 255
14 63724184 65357663 1.7 201
14 72345879 74206753 1.7 263
15 36850933 38329491 2.7 238
16 1631282 2985328 2.5 273
16 11917282 13220406 3.7 276
16 15619825 17324720 3.1 305
16 29085336 31390250 1.3 263
16 51215026 52902771 3.4 224
17 52582669 56643678 4.7 438
19 11527683 13235913 1.7 203
19 15613137 16316773 1.2 204
19 46195917 49338412 3.3 397
20 17126434 18288231 2.1 225
21 35367409 36969215 4.1 254
21 42399499 42951171 1.6 233
22 33988022 35626259 5.0 289

In my case, I’m particularly fortunate, because my mother tested her DNA as well.  By process of elimination, I can figure out which of my matches are through her, and then by inference, which are through my father or are truly IBS by convergence.

I carry Native heritage on both sides, but my mother’s is proven to specific Native ancestors where my father’s is only proven to certain lines and not yet confirmed through genealogy records to specific ancestors.

Because I had so many matches, quite to my surprise, I also compared my mother’s DNA to the Anzick sample, combined the two results and put them in a common spreadsheet, shown below.  White are my matches.  Pink are Mom’s matches, and the green markers are on the segments where we both match the Anzick sample, confirming that my match is indeed through mother.

ancient compare

We’ll work with this information more in a few minutes.

Paleo

At 200 SNP level, 2 segments.

1 26535949 27884441 1.1 258
2 127654021 128768822 1.2 228

My mother matches on 9 segments, but neither of the two above, so they are either from my father’s side or truly IBS by convergence.

Altai Neanderthal

ancient compare2

Russian Neanderthal

Neither my mother nor I have any matches at 100SNPs and 1cM.

Denisovan

I have one match.

Chr Start Location End Location Centimorgans (cM) SNPs
4 8782230 9610959 1.2 100

My mother matches 2 segments at 100 SNPs but neither match is the same as my segment.

Matching to Ancestral Lines

I’ve been mapping my DNA to specific ancestors utilizing the genealogy information of matches and triangulation for some time.  This consists of finding common ancestors with your matches.  Finding one person who matches you and maps to a common ancestor on a particular segment consists of a hint.  Finding two that share the same ancestral line and match you and each other on the same segment is confirmation – hence, the three of you triangulate.  More than three is extra gravy:)

I have also recorded other relevant information in my matches file, like the GedMatch Native chromosomal comparisons when I wrote “The Autosomal Me” series about hunting for my Native chromosomal segments.

So, after looking at the information above, it occurred to me that I should add this ancestral match information to my matches spreadsheet, just for fun, if nothing else.

I added these matches, noted the source as GedMatch and then sorted the results, anxious to see what we might find.  Would at least one of these segments fall into the proven Native segments or the matches to people who also descend from those lines?

What I found was both astonishing and confusing….and true to form to genealogy, introduced new questions.

I have extracted relevant matching groups from my spreadsheet and will discuss them and why they are relevant.  You can click on any of the images to see a larger image.

ancient compare3

This first set of matches is intensely interesting, and equally as confusing.

First, these matches are to both me and mother, so they are confirmed through my mother’s lines.  In case anyone notices, yes, I did switch my mother’s line color to white and mine to pink to be consistent with my master match spreadsheet coloration.

Second, both mother and I match the Anzick line on the matches I’ve utilized as examples.

Third, both 23andMe and Dr. Doug McDonald confirmed the segments in red as Native which includes the entire Anzick segment.

Fourth, utilizing the Gedmatch admixture tools, mother and I had this range in common.  I described this technique in “The Autosomal Me” series.

Fifth, these segments show up for two distinct genealogy lines that do not intersect until my grandparents, the Johann Michael Miller line AND the Acadian Lore line.

Sixth, the Acadian Lore line is the line with proven Native ancestors.

Seventh, the Miller line has no Native ancestors and only one opportunity for a Native ancestor, which is the unknown wife of Philip Jacob Miller who married about 1750 to a women rumored to be Magdalena Rochette, but research shows absolutely no source for that information, nor any Rochette family anyplace in any proximity in the same or surrounding counties to the Miller family.  The Miller’s were Brethren.  Furthermore, there is no oral history of a Native ancestor in this line, but there have been other hints along the way, such as the matching segments of some of the “cousins” who show as Native as well.

Eighth, this makes my head hurt, because this looks, for all the world, like Philip Jacob Miller who was living in Bedford County, PA when he married about 1750 may have married someone related to the Acadian lines who had intermarried with the Micmac.  While this is certainly possible, it’s not a possibility I would ever have suspected.

Let’s see what else the matches show.

ancient compare4

In this matching segment Mom and I both match Emma, who descends from Marie, a MicMac woman.  Mom’s Anzik match is part of this same segment.

ancient compare5

In this matching segment, Mom and I both match cousin Denny who descends from the Lore line who is Acadian and confirmed to have MicMac ancestry.  Mom’s Anzik segments all fit in this range as well.

ancient compare6

In this matching segment, cousin Herbie’s match to Mom and I falls inside the Anzick segments of both Mom and I.

ancient compare7

More matching to the proven Miller line.

ancient compare8

This last grouping with Mom is equally as confusing at the first.  Mom and I both match cousin Denny on the Lore side, proven Acadian.

Mom and I both match the Miller side too, and the Anzik for both of us falls dead center in these matches.

There are more, several more matches, that also indicate these same families, but I’m not including them because they don’t add anything not shown in these examples.  Interestingly enough, there are no pointers to other families, so this isn’t something random.  Furthermore, on my father’s side, as frustrating as it is, here are no Anzick matches that correlate with proven family lines.  ARGGHHHHHH……

On matches that I don’t share with mother, there is one of particular interest.

ancient compare9

You’ll notice that the Anzik and the Paleo-Greenland samples match each other, as well as me.  This is my match, and by inference, not through mother.  Unfortunately, the other people in this match group don’t know their ancestors or we can’t identify a common ancestor.

Given the genetic genealogy gold standard of checking to see if your autosomal matches match each other, I went back to GedMatch to see if the Paleo-Greenland kit matched the Clovis Anzik kit on this segment, and indeed, they do, plus many more segments as well.  So, at some time, in some place, the ancestors of these two people separated by thousands of miles were related to each other.  Their common ancestor would have either been in Asia or in the Northern part of Canada if the Paleo people from Greenland entered from that direction.

Regardless, it’s interesting, very interesting.

What Have I Learned?

Always do experiments.  You never know what you’ll find.

I’m much more closely related to the Anzick individual than I am to the others. This isn’t surprising given my Native heritage along with the endogamous culture of the Acadians.

My relationship level to these ancient people is as follows:

Lived Years Ago Relatedness Comments
Montana Anzick 12,500 107.4cM at 200 SNP level Confirmed to Lore (Acadian) and Miller, but not other lines
Greenland Paleo 4,000 2.3cM at 200 SNP level No family line matches, does match to Anzick in one location
Altai Neanderthal 50,000 2.1cM at 200 SNP level No family line matches
Russian Neanderthal 29,000 0
Denisovan 30,000 1.2cM at 200 SNP No family line matches

The Lores and the Millers

Looking further at the Lore and Miller lines, there are only two options for how these matching segments could have occurred.  There are too many for them all to be convergence, so we’ll have to assume that they are indeed because we shared a common population at some time and place.

The nature of how small the segments are testify that this is not a relatively recent common ancestor, but how “unrecent” is open to debate.  Given that Neanderthal and Denisovan ancient segments are found in all Europeans today, it’s certainly possible for these segments to be passed intact, even after thousands of years.

The confirmations to the Lore line come through proven Lore cousins and also through other proven Acadian non-specific matches.  This means that the Acadian population is highly endogamous and when I find an Acadian match, it often means that I’m related through many ancestors many times.  This, of course, increases the opportunity for the DNA to be passed forward, and decreases the opportunity for it to be lost in transmission, but it also complicates the genealogy greatly and makes determining which ancestor the DNA segment came from almost impossible.

However, I think we are safe to say the segments are from the Acadian population, although my assumption would be that they are from the Native Ancestors and not the French, given the high number of Anzick matches, Anzick being proven to be Native.  Having said that, that assumption may not be entirely correct.

The Miller line is relatively well documented and entirely from Germany/Switzerland, immigrating in the early 1700s, with the exception of the one unknown wife in the first generation married in the US.  Further examination would have to be done to discover if any of the matches came through Johann Michael Miller’s sons other than Philip Jacob Miller, my ancestor.  There are only three confirmed children, all sons.  If this segment shows up in Johann Michael Miller’s line not associated with son Philip Jacob Miller, then we would confirm that indeed the segment came from Europe and not a previously unknown Native or mixed wife of Philip Jacob.

Bottom Line

So, what’s the bottom line here?  I know far more than I did.  The information confirms, yet again, the Acadian Native lines, but it introduces difficult questions about the Miller line.  I have even more tantalizing questions for which I have no answers today, but I tell you what, I wouldn’t trade this journey along the genetic pathway with all of its unexpected bumps, rocks, slippery slopes and crevices for anything!!  That’s why it’s called an adventure!

______________________________________________________________

Disclosure

I receive a small contribution when you click on some of the links to vendors in my articles. This does NOT increase the price you pay but helps me to keep the lights on and this informational blog free for everyone. Please click on the links in the articles or to the vendors below if you are purchasing products or DNA testing.

Thank you so much.

DNA Purchases and Free Transfers

Genealogy Services

Genealogy Research

Big Y DNA Results Divide and Unite Haplogroup Q Native Americans

featherOne of my long standing goals has been to resurrect the lost heritage of the Native American people.  By this I mean, primarily, for genealogists who search for and can’t find  their Native ancestors.  My blog, www.nativeheritageproject.com, is one of the ways that I contribute towards that end.  Many times, records are buried, don’t exist at all, or don’t reflect anything about Native heritage.  While documents can be somewhat evasive and frustratingly vague, the Y DNA of the male descendants is not.  It’s rock solid.

The Native communities became admixed beginning with the first visits of Europeans to what would become the Americas.  Native people accepted mixed race individuals as full tribal members, based on the ethnicity of the mother.  Adoption also played a key role.  If a female, the mother, was an adopted white child, the mother was considered to be fully Native, as was her child, regardless of the ethnicity of the father.

Therefore, some people who test their DNA expecting to find Native genetics do not – they instead find European or African – but that alone does not mean that their ancestors were not tribal members.  It means that these individuals have to rely on non-genetic records to prove their ancestors Native heritage – or they need to test a different line – like the descendants of the mother, through all females, for example, for mitochondrial DNA.

On the other hand, some people are quite surprised when their DNA results come back as Native.  Many have heard a vague story, but often, they don’t have a clue as to which genealogical line, if any, the Native ancestry originated.  Native ancestry was often hidden because the laws that prevailed at the time sanctioned discrimination of many kinds against people “of color,” and if you weren’t entirely of European origin, you were “of color.”  Many admixed people, as soon as they could, “became” white socially and never looked back. Not until recently, the late 20th century, when discrimination had for the most part become a thing of the past and one could embrace their Native or African heritage without fear of legal or social reprisal.

Back in December of 2010, we found the defining SNP that divided haplogroup Q between Europeans and Native Americans.  At the time, this was a huge step forward, a collaboration between testing participants, haplogroup administrators, citizen scientists and Family Tree DNA.

This allowed us to determine who was, and was not included in Native American haplogroups, but it was also the tip of the iceberg.  You can see below just how much the tree has expanded and its branches have been shuffled.  This is a big part of the reason for the change from haplogroup names like Q1a3 to Q-M346.  For example, at one time or another the SNP M3 was associated with haplogroup names Q1a3a, Q1a3a1 and Q1a3a1a.  On the ISOGG tree below, today M3 is associated with Q1a2a1a1.

isogg q tree

The new Family Tree DNA 2014 tree is shown below for one of the Big Y participants whose terminal SNP is L568, found beneath SNP CTS1780 which is found beneath L4, which is beneath L213 which is beneath L474 which is beneath MEH2 which is beneath L232 which is, finally, beneath M242.

ftdna 2014 q tree

The introduction of the Big Y product from Family Tree DNA, which sequences a large portion of the Y chromosome, provided us with the opportunity to make huge strides in unraveling and deciphering the haplogroup Q (and C, the other male Native haplogroup in the Americas) tree.  I am hopeful that in time, and with enough people taking the Big Y test, that we will one day be able to at least sort participants into language and perhaps migration groups.

In November, 2013, we asked for the public and testers to support our call for funds to be able to order several Big Y tests.  The project administrators intentionally did not order tests in family groups, but attempted to scatter the tests to the far corners, so to speak, and to include at least one person from each disparate group we have in the haplogroup Q project, based on STR matches, or lack thereof, and previous SNP testing.

Thanks to the generosity of contributors, we were able to order several tests.  In addition, some participants were able to order their own tests, and did.  Thank you one and all.

The tests are back now, and with the new Big Y SNP matching, recently introduced by Family Tree DNA, comparisons are a LOT easier.

So, of course, I had to see what I could find by comparing the SNP results of the several gentlemen who tested.

To protect the privacy of everyone involved, I have reduced their names to initials.  I have included their terminal SNP as identified at Family Tree DNA as well as any tribal, ethnic or location information we have available for their most distant paternal ancestor.

There are two individuals who believe their ancestors are from Europe, and there is a very large group of European haplogroup Q members, but I’m not convinced that the actual biological ancestors of these two gentlemen are from Europe.  I have included both of these individuals as well. Let’s just say the jury is still out. As a control, I have also included a gentleman who actually lives in Poland.

native match clusters

Of the individuals above, SD, CT and CM are SNP matches.

CD, WJS and WBS are SNP matches with each other.

BG and ETW are also SNP matches to each other.

None of the rest of these individuals have SNP matches.  (Note, you can click to enlarge the chart.)

native snp matches

In the table above, the Non-Matching Known SNPs are shown with the number of Shared Novel Variants.  For example, SD and CT have 4 non-matching SNPS and share 161 Novel Variants and are noted as 4/161.

We can easily tell which of the known SNPs are nonmatching, because they are shown on the participants match page.

snp matches page

What we don’t know, and can’t tell, is how many Novel Variants these people share with each other, and how many they might share with the individuals that aren’t shown as matches.

Keep in mind that there may be individuals here that are not shown as matches to due no-calls.  Only people with up to and including 4 non-matching Known SNPs are counted as matches.  If you have the wrong combination of no-calls, or, aren’t in the same terminal haplogroup, you may not be shown as a match when you otherwise would be.

The other reason for my intense interest in the Novel Variants is to see if they are actually Novel, as in found only in a few people, or if they are more widespread.

I downloaded each person’s Novel Variants through the Export Utility (blue button to the right at the top of your personal page,) and combined the Novel Variants into a single spreadsheet.  I colorized each person’s result rows so that they would be easy to track.  I have redacted their names. The white row, below, is the individual who lives in Poland.

novel variant 1

There are a total of 3506 Novel Variants between these men.  When sorting, many clustered as you would expect.  There is the Algonguian group and what I’ve taken to calling the Borderlands group.  This group has someone whose ancestor was born in VA and two in SC.  I have documentation for the Virginia family having descendants in SC, so that makes sense.  The third group is an unusual combination of the gentleman who believes his ancestors are from Germany and the gentleman whose ancestors are found in a New Mexico Pueblo tribe, but whose ancestor was, likely, based on church records, a detribalized Plains Indian who had been kidnapped and sold.

Clusters that I felt needed some scrutiny, for one reason or another, I highlighted in yellow in the Terminal SNP column.  Obviously the Polish/Pueblo matching needs some attention.

Another very interesting type of match are several where either all or nearly all of the individuals share a Novel Variant – 15 or 16 of 16 total participants.  I don’t think these will remain Novel Variants very long.  They clearly need to be classified as SNPs.  I’m not sure about the process that Family Tree DNA will use to do this, but I’ll be finding out shortly.

Here’s an example where everyone shares this Novel Variant at location 7688075,except the gentleman who lives in Poland, the man who believes his ancestor is from Germany, and the Creek descendant.

novel variant 2

I was very surprised at how many Novel Variants appear in all 16 results of the participants, including the gentleman who lives in Poland – represented by the white row below.

novel variant 3

So, how were the Novel Variants distributed?

Category # of Variants Comments
Algonquian Group 140 This is to be expected since it’s within a specific group.  Any matches that include people outside the 3 Algonquian individuals are counted in a separate category.  These matches give us the ability to classify anyone who tests with these marker results as provisionally Algonquian.
Borderlands 83 This confirms that these three individuals are indeed a “group” of some sort.  This also gives us the ability to classify future participants using these mutations.
All or Nearly All – 15 or 16 Participants 80 These are clearly candidates for SNPs, and, given that they are found in the Native and the European groups, they appear to predate the division of haplogroup Q.
Several Native and European, Combined 45 This may or may not include the person who lives in Poland.  This group needs additional scrutiny to determine if it actually does exist in Europe, but given that there are more than 3 individuals with each of these Novel Variants, they need to be considered for SNPhood.
Pueblo/NC 1
Poland/Borderlands 2
Mexico/Algonquian 2
German/Pueblo 9 I wonder if this person is actually German.
Poland/Mexico 20 I wonder if this person’s ancestors are actually from Poland.
Algonquian, NC, Creek 1
Borderland, Mexico, Creek 1
Algonquian/Cherokee 1
All Native, no Euro 2
Algonquian, Borderlands, Mexico, NC 1
Algonquian, Mexico, Borderlands 1
Borderlands, Pueblo 1
Borderlands, Creek, NC 1
Algonquian, Cherokee, Mexico 3
Algonquian, Pueblo, Creek, Borderlands 1
Cherokee, NC 2
Algonquian, Borderlands 2
Borderlands, NC 1
Algonquian, NC 1
Polish/NC 10

Some of this distribution makes me question if these SNP mutations truly are a “once in the history of mankind” kind of thing.  For example, how did the same SNP appear in the Polish person and the NC person, or the Pueblo person, and not in the rest of the Native people?

New SNPs?

So, are you sitting down?

Based on these numbers, it looks like we have at least 125 new SNP candidates for  haplogroup Q.  If we count the Algonquian and the Borderlands groups of matches, that number rises to about 250.  This is very exciting.  Far, far more than I ever expected.  of these SNPS, about half will identify Native people, even Native groupings of people.  This is a huge step forward, a red letter day for Native American ancestry!

SNPs and STRs

Lastly, I wanted to see how the SNP matching compared to STR matching, or if it did at all, for these men.

Only two men match each other on any STR markers.  CD and WJS matched on 12 markers, but not on higher panels.  The TIP calculator estimated their common ancestor at the 50th percentile to be 17 generations, or between 425 and 510 years ago.  We all know how unrealistic it is to depend on the TIP calculator, but it’s the only tool we have in situations like this.

Given that these are the only two men who do match on STR markers, albeit distantly, in a genealogical timeframe, let’s see what the estimates using the 150 years per SNP mutation comes up with.  This estimate is just that, devised by the haplogroup R-U106 project administrators, and others, based on their project findings.  150 years is actually the high end of the estimate, 98 being the lower end.  Of course, different haplogroups may vary and these results are very early.  Just saying.

CD has 207 high quality Novel Variants.  He shares 188 of those with WJS, leaving 19 unshared Novel Variants.  Utilizing this number, and multiplying by 150, this suggests that, if the 150 years per SNP is anyplace close to accurate, their common ancestor lived about 2850 years ago.  If you presume that both men are incurring mutations at the same rate in their independent lines, then you would divide the number of years in half, so the common ancestor would be more likely 1425 years ago.  If you use 100 years instead of 150, the higher number of years is 1900 and the half number is about 950 years.

It’s fun to speculate a bit, but until a lot more study has occurred, we won’t be able to reasonably estimate SNP age or age to common ancestor from this information.   Having said all of that, it’s not a long stretch from 710 years to 950 years.

It looks like STR markers are still the way to go for genealogical matching and that SNPS may help to pull together the deeper ancestry, migration patterns and perhaps define family lines.  I hope the day comes soon that I can order the Big Y for lots more project members.  Most of these men do have STR marker matches, and to men with both the same and different surnames.  I’d love to see the Big Y results for those individuals who match more closely in time.

This is still the tip of the iceberg.  There is a lot left to discover!  If you or a family member have haplogroup Q results, please consider ordering the Big Y.  It would make a wonderful gift and a great way to honor your ancestors!

You can also contribute to the American Indian project at this link:

https://www.familytreedna.com/group-general-fund-contribution.aspx?g=AIP

In order to donate to the haplogroup C-P39 project which also includes Native Americans, please click this link:

http://www.familytreedna.com/group-general-fund-contribution.aspx?g=Y-DNAC-P39

______________________________________________________________

Disclosure

I receive a small contribution when you click on some of the links to vendors in my articles. This does NOT increase the price you pay but helps me to keep the lights on and this informational blog free for everyone. Please click on the links in the articles or to the vendors below if you are purchasing products or DNA testing.

Thank you so much.

DNA Purchases and Free Transfers

Genealogy Services

Genealogy Research