Pedigree collapse can be responsible for you sharing more DNA than expected with another person.
What is pedigree collapse?

Pedigree collapse occurs when you descend from the same ancestor(s) through more than one path. In other words, you descend from those ancestors through two different children. Therefore, when matching with someone else who descends through those ancestors, you may share more DNA than would be expected from that level of relationship on the surface, meaning without pedigree collapse.
Endogamy is different and means that you descend from a community of ancestors who descend from the same group of ancestors. Often out-marriage is discouraged or otherwise impossible, so all of the group of people share common ancestors, which means they often match on segments without sharing close ancestors. Examples of descent from endogamous populations are Jewish, Amish, Brethren, Acadian, Native Hawaiian, Māori, and Native American people, among others.
I wrote about the difference between pedigree collapse and endogamy in the article, What’s the Difference Between Pedigree Collapse and Endogamy?
I’ve also written about endogamy in the following articles:
Degrees of Consanguinity

If you’re a genealogist, and especially if you’ve worked with Catholic church records, you’ve probably heard of “degrees of sanguinity,” which are prohibited blood relationships in marriage. For example, siblings are prohibited from marrying because they are too closely related, according to church doctrine.

By SVG remake by WClarke based on original by User:Sg647112c – Own work, CC BY-SA 4.0, https://commons.wikimedia.org/w/index.php?curid=54804980
Today, we think of the genetic results of inbreeding, but originally, relationships (and consanguinity) also had to do with inheritance.
Essentially, marriages are prohibited by degree of sanguinity, and that degree is calculated based on this relationship chart. Prohibited degrees of consanguinity changed over time. Sometimes, a priest granted dispensation for a couple to wed who was of a prohibited degree of sanguinity. That’s a genealogy goldmine because it tells you where to look for common ancestors. It also tells you something else – that you may share more DNA with other descendants of that couple than one would otherwise expect.
More Than You Ever Expected
Recently, I’ve been working with an academic research team on a very interesting ancient DNA case that involves pedigree collapse. Doing the genealogy and genetic work on how much DNA was expected in a match without pedigree collapse, and how much was expected with pedigree collapse, was very interesting.
The team was working to confirm relationships between people in a cemetery. The burials shared more DNA than anticipated for who the people were believed to be. Enter pedigree collapse.
I can’t disclose the circumstances just yet – but I will as soon as possible. It’s an extremely interesting story.
We needed to ensure that readers, both academic and more generally understood pedigree collapse and our calculations. Why did burials share higher than expected DNA than indicated by the expected relationships? This puzzle becomes much more interesting when you add in pedigree collapse.
Academic researchers and scientists have access to models and mathematical algorithms that normal air-breathing humans don’t have easy access to.
So, what do you do if you and a match have a known pedigree collapse in your tree? How much DNA can you expect to share, and how do you calculate that?
These are all great questions, so let’s take a look.
I’m sharing the PowerPoint slides I prepared for our team on this topic. I’ve removed anything that would identify or even hint at the project and modified the slides slightly for easier consumption.
This presentation has never been given publicly, so you’re first! It seemed a waste to do this work and not share it!
Pedigree Collapse and DNA


Pedigree collapse occurs when you share an ancestor or ancestors through different pathways. In this case, the person at the bottom is the child of parents who were third cousins, but the father’s grandparents were also first cousins.
First cousin marriages were common in the not-too-distant past. Today, you could easily marry your third or fourth cousin and not even realize it unless someone in your family just happened to be a genealogist.

Genealogists use various tools to calculate the expected amount of shared DNA in relationships – first cousins, siblings, or half-siblings, for example. Both the Shared cM Project at DNAPainter and SegcM at DNA-Sci Tools provide tools.
Take a look at the article, DNA: In Search of…Full and Half-Siblings, for some great examples.

First cousins share common grandparents. Their child inherits DNA from two paths that lead back to the same ancestors. Some of that DNA will be the same, meaning the child will or can inherit the same ancestral segment from both parents, and some will be different segments from those ancestors that the parents do not share with each other.
Inheritance – How It Works
Let’s look at inheritance to see how this happens.

Let’s start with full and half-siblings.
Each child inherits half of their DNA from each parent, but not entirely the same half (unless they are identical twins.)
Therefore, full siblings will match on about 50% of their DNA, which is illustrated by the segments on the chromosome browser. However, and this will be important in a minute, about 25% of their DNA is exactly the same, when compared to each other, on the chromosome inherited from their father and mother at the same location.

On the chromosome browser, you can see that three siblings do match. One sibling (the grey background chromosomes) is the person both other full siblings are being compared to, in the example above.
What you can’t determine is whether they share the exact same DNA on both their mother and father’s Chromosome 1, where the matches overlap, for example. We know they both match their sibling, but the top person could match the sibling due to a match from their paternal chromosome in that location, and the bottom person could match due to their maternal chromosome. There’s no way to know, at least not from that view.
The areas where the siblings share exactly the same DNA on both their maternal and paternal chromosome, both, with each other are called Fully Identical REgions (FIR), as compared to Half Identical Regions (HIR) where the siblings match on either their maternal or paternal copy of the chromosome, but not both.
23andMe used to provide a tool that displayed both types of matches.

Since the data exposure incident at 23andMe, they no longer provide this lovely tool, and since that help page is now gone as well, I doubt this view will ever be returned. Fortunately, I grabbed a screenshot previously.

The dark purple segments are fully identical, meaning that these two full siblings match on both their maternal and paternal chromosomes in that location. The magenta are half identical, which means they match on EITHER the maternal or paternal chromosome in that location but not on both chromosomes. Of course, no color (light grey) means there is no match at that location.
Please note that because 23andMe counts fully identical regions (FIR) twice, their total matching cMs are elevated. The other companies do NOT count those regions twice.
GEDmatch also shows both full and half-identical regions as described more fully, here.

In this full-sibling example from GEDmatch, the green segments are fully identical regions across both the maternal and paternal chromosomes.

The definition of FIR is that two people match on both their mother’s and father’s DNA on the same chromosome. Therefore, in following generations, there technically should not be FIR matches, but in some instances we do find FIR matches outside of full siblings.
Moving down another generation, first cousins may share SOME fully identical DNA, especially if they are from an endogamous population or their mothers are related, but less, and it’s generally scattered.
![]()
Here’s my Mom’s GEDmatch comparison to her first cousin. The purple-legend segment shows a match, and the green within that match shows fully identical locations.
You can easily see that these are very scattered, probably representing “chance” or population-based fully identical matching locations within a segment. Comparatively, the green FIR segments for full siblings are dense and compact, indicating a segment that is fully identical.
Evaluating matches for dense FIR segments (known as runs of homozygosity – ROH) is a good indicator of parental relatedness.
Double Cousins
Of course, if these people were double first cousins, where the wives of the siblings were sisters to each other – the first cousins would have large patches of dense green FIR segments.
First cousins share grandparents.
Double first cousins occur when two people share both sets of grandparents, meaning that brothers marry sisters. Normal first cousins share about 12.5% of their DNA, but double first cousins share about 25% of their DNA.
 In this case, Sharon and Donna descend from two brothers, James and Henry, who were sons of Joseph and Jane. In this scenario, James and Henry married unrelated women, so Sharon and Donna are first cousins to each other.

Double first cousins share both sets of grandparents so they would inherit FIR from both sets of siblings.
You need to be aware of this, but for now, let’s stick with non-double relationships. You’re welcome!
DNA Inheritance

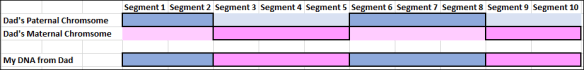
Here’s a different example of DNA inheritance between two siblings.
- You can see that in the first 50 cM segment, both siblings inherited the same DNA from both parents, so they match on both their mother’s and father’s chromosomes. They match on both the 50 cM green and 50 cM pink segments. 23andMe would count that as 100 cMs, but other vendors only count a segment IF it matches, NOT if it matches twice. So, other vendors count this as a 50 cM match.
- In column two, these two people don’t match at all because they inherited different DNA from each parent. In this example, Person 1 inherited their maternal grandmother’s segment, and Person 2 inherited their maternal grandfather’s segment.
- In column three, our siblings match on their paternal grandmother’s segment.
- In column four, no match again.

How much can we expect to inherit at different levels – on average?
Different tools differ slightly, and all tools provide ranges. In our example, I’ve labeled the generations and how much shared DNA we would expect – WITHOUT pedigree collapse.
| Ancestral couple | Inherited cM | Inherited % |
| Gen 1 – Their children | 3500 cM | 50 |
| Gen 2 – Grandchildren | 1750 cM | 25 |
| Gen 3 – Great-Grandchildren | 875 cM | 12.5 |
| Gen 4 – GG-Grandchildren | 437.5 | 6.25 |
| Gen 5 – GGG-Grandchildren | 218.75 | 3.125 |
| Gen 6 – GGGG-Grandchildren | 109.375 | 1.5625 |
| Gen 7 – GGGG-Grandchildren | 54.6875 | .078125 |
Please note that this is inherited DNA, not shared (matching) DNA with another person.

Adding in pedigree collapse, you can see that we have three Gen 1 people involved, three Gen 2 descendants, and two Gen 3 and Gen 4 people.
Each of those people inherit and pass on segments from our original couple at the top.
We have three distinct inheritance paths leading from our original couple to Gen 5.
We have a first cousin marriage at Gen 2, at left, which means that their child, Gen 3, will have an elevated amount of the DNA of their common ancestors.
In Gen 4, two people marry who both descend from a common couple, meaning their child, Gen 5, descends from that couple in three different ways.
Did your eyes just glaze over? Well, mine did, too, which is why I had to draw all of this out on paper before putting it into PowerPoint.

The Gen 5 child inherits DNA from the ancestral couple via three pathways.
The next thing to keep in mind is that just because you inherit the DNA from an ancestor does not mean you match another descendant. Inheritance is not matching.
You must inherit before you can match, but just because you and someone else have inherited a DNA segment from a common ancestor does not guarantee a match. Those segments could be in different locations.
Categories of DNA
When dealing with inheritance and descent, we discuss four categories of DNA.
- In the first generation, full siblings will, in about 25% of their locations, share the same DNA that has been inherited from both parents on the same chromosome. In other words, they match each other both maternally and paternally at that location. Those are FIR.
- The DNA you inherit from an ancestor.
- The DNA that both you and your cousin(s) inherit from a common ancestor and match on the same location. This is shared DNA.
- The DNA that both you and your cousin(s) inherit from a common ancestor, but it’s not in the same location, so you do not match each other on that segment. Just because you inherit DNA from that ancestor does not necessarily mean that your cousin has the same DNA from that ancestor. This is inherited but not shared.
Inheritance is Not The Same as Matching
Inheritance is not the same thing as matching.
Inheriting our ancestor’s DNA isn’t enough. We need to match someone else who inherited that same segment in order to attribute the segment to that specific ancestor.
Depending on how close or distant the relationship, two people may share a lot of DNA (like full siblings), or one segment in more distant matches, or sometimes none at all. As we reach further back in time, we inherit less and less of our increasingly distant ancestors’ DNA, which means we match increasingly fewer of their descendants. I wrote about determining ancestral percentages in the article, Ancestral Percentages – How Much of Them is in You?
Based on how much DNA we share with other known relatives, we can estimate relationships.

Pedigree collapse, where one descends from common ancestors more than once, increases the expected amount of inherited DNA, which in turn increases the probability of a shared match with other descendants.
| Ancestral Couple | Matching Between | Shared DNA ~cM | Shared DNA ~% | Range (Shared cM Project) | FIR – Identical DNA |
| Generation 1 | Full Siblings | 2600 | 50 | 1613-3488 | 25% |
| Generation 2 | First Cousins | 866 | 12.5 | 396-1397 | 0 |
| Generation 3 | Second Cousins | 229 | 3.125 | 41-592 | 0 |
| Generation 4 | Third Cousins | 73 | 0.78125 | 0-234 | 0 |
Here’s an example through third cousins, including expected FIR, fully identical regions where full siblings match each other on both their maternal and paternal chromosomes in the same location.
I provided a larger summary chart incorporating the information from public sources, here, minus FIR.
Of course, double cousins, where two pairs of siblings marry each other, represent another separate level of complexity. DNA-Sci’s Double Cousin Orogen explains this here and also provides a tool.
Double cousins, meaning when two pairs of siblings marry each other, are different from doubly related.
Doubly related means that two people descend from common ancestors through multiple paths, meaning multiple lines of descent. Doubly related is pedigree collapse. Double cousins is pedigree collapse on steroids.
Pedigree Collapse, aka Doubly Related
Calculating expected inherited DNA from multiple lines of descent is a bit more challenging.

A handy-dandy chart isn’t going to help with multiple relationships because the amount of expected shared DNA is based on the number of and distance of relationships.
Please note that this discussion excludes X-DNA matching which has its own inheritance path.
It’s time for math – but I promise I’ll make this relatively easy – pardon the pun.
What’s Behind the Math?
So, here’s the deal. I want you to understand why and how this works. You may not need this information today, but eventually, you probably will. This is one of those “refer back to it” articles for your personal library. Read this once as a conceptual overview, then read it again if you need to work through the relationships.
This is easy if you take it one step at a time.

First, we calculate each path separately.

In the first generation, full siblings inherit identical (FIR) DNA on both their mother’s and father’s chromosomes.
In the second generation, the male inherits the maternal segment, and the female inherits the paternal segment.
In the third generation, their child inherits those segments intact from both of their parents. The child inherits from the ancestral couple twice – once through each parent.
In generation 1, those two segments were FIR, fully identical regions. Both of those men married unrelated wives. When their children, Gen 2, were born, they had either the maternal or paternal segment from their father because they had an entirely different segment in that location from their mother.
However, the child in Gen 3 inherited the original green segment from their father and the original pink segment from their mother – reuniting those FIR segments in later generations.
First Cousin’s Child
Let’s calculate the inheritance for the child of those two first cousins who married.
| Ancestral couple | Inherited cM | Inherited % |
| Gen 3 – Great-Grandchildren | 875 cM | 12.5 |
| Gen 3 – Great-Grandchildren | 875 cM | 12.5 |
| Total | 1750 cM | 25 |
Normally, a Gen 3 person inherits roughly 875 cM, or 12.5% of their great-grandparent’s DNA. However, since their grandparents were first cousins, they inherit about twice that amount, or 1750 cM.
While a Gen 3 person inherits as much as a grandchild (25%) normally would from the original couple, they won’t match on all of that DNA. When matching, we need to subtract some of that DNA out of the equation for two reasons:
- In the first generation, between siblings, some of their DNA was fully identical and cannot be identified as such.
- In the second generation, they will each have some parts of the ancestral couple’s DNA that will not match the other person. So, they inherit the same amounts from their common ancestors, but they can only be expected to match on about 25% of that amount two generations later.
However, the child of first cousins who marry inherits more DNA of the common ancestors than they would if their parents weren’t related. It’s just that some of that DNA is the same, potentially on the maternal and paternal chromosomes again, and some won’t match at all.

While matching DNA is the whole point of autosomal DNA testing, fully identical DNA matching regions (FIR) cannot be identified that way. For the most part, other than identifying full and half-siblings, sometimes pedigree collapse, and parent-relatedness, fully identical DNA isn’t terribly useful for genealogy. However, we still need to understand how this works.
It’s OK if you just want to say, “I know we’ll share more DNA due to pedigree collapse,” but if you want to know how much more to expect, keep reading. I’d really like for you to understand use cases and be able to track those segments.
Remember, we will learn a super-easy shortcut at the end, so for now, just read. It’s important to understand why the shortcut works.
Sibling Inheritance Versus Matching

In order to compare apples to apples, sometimes we need to remove some portion of DNA in our calculations.
Remember story problems where you had to “show your work”?
Calculating Expected DNA

Here’s the step-by-step logic.
| Ancestral couple | Inherited Non-Identical cM | Inherited % |
| Gen 1 first son | 3500 | 50 |
| Gen 1 second son | 3500 | 50 |
| Less identical segments (FIR) | -1750 (subtracted from one child for illustration) | 25 |
| Gen 2 son | 1750 | 25 |
| Gen 2 daughter married Gen 2 son | 875 | 12.5 |
| Gen 3 – Their child path through Gen 2 son | 875 cM | 12.5 |
| Gen 3 – Their child path through Gen 2 mother | 437.5 cM | 6.25 |
| Their child total without removing identical segments | 1750 cM | 25 |
| Their child total after removing identical segments | 1312.5 | 18.75 |

| Category | cMs | Most Probable | Degree Relationship |
| No Pedigree Collapse | 875 | 98% Great grandparent or great-grandchild, great or half aunt/uncle, great or half niece/nephew, 1C | 3 |
| Pedigree Collapse without identical segment removal | 1750 | 100% Grandparent, grandchild, aunt/uncle, half-sibling, niece/nephew | 2 |
| Pedigree Collapse after identical segment removal | 1312.5 | 56% grandparent, grandchild, aunt/uncle, niece/nephew, half-sibling | 2 |
Just because you HAVE this much shared (and/or identical) DNA doesn’t mean you’ll match on that DNA.
Next, let’s look at Gen 5 child who inherited three ways from the ancestors.

If you think, “This will never happen,” remember that it did, which is why I was working through this story problem. It’s not uncommon for families to live in the same area for generations. You married who you saw – generally, your family and neighbors, who were likely also family.
Let’s take a look at that 5th generation child.

The more distantly related, the less pedigree collapse affects matching DNA. That’s not to say we can ignore it.

Here’s our work product. See, this isn’t difficult when you take it step by step, one at a time.
| Ancestral couple | Inherited Non-Identical cM | Inherited % |
| Gen 3 Child total after removing identical segments | 1312.5 | 18.75 |
| Gen 4 father – half of Gen 3 father | 656.25 | 9.375 |
| Gen 5 child – half of Gen 4 father | 328.125 | 4.6875 |
| Gen 5 child – mother’s side calculated from ancestral couple normally | 218.75 | 3.125 |
| Total for Gen 5 Child | 546.875 | 7.8125 |
Inheritance Ranges
Lots of factors can affect how much DNA a person in any given generation inherits from an ancestor. The same is true with multiple paths from that same ancestor. How do we calculate multiple path inheritance ranges?

As with any relationship, we find a range, or combined set of ranges for Gen 5 Child based on the multiple pathways back to the common ancestors.
| Gen 5 Child | Inherited Non-Identical cM | Inherited % |
| Without removing either paternal or maternal identical cMs | 656.25 | 9.375 |
| After removing paternal identical cMs only | 546.875 | 7.8125
|
| After removing maternal cMs only | 546.875 | 7.8125
|
| After removing both paternal and maternal identical cMs | 362.50 | 6.25 |
| Normal Gen 5 no pedigree collapse | 218 | 3.125 |
What About Matching?
Inheritance and matching are different. Most of the time, two people are unlikely to share all of the DNA they inherited from a particular ancestor. Of course, inheriting through multiple paths increases the likelihood that at least some DNA from that ancestor is preserved and that it’s shared with other descendants.

Two people aren’t expected to match on all of the segments of DNA that they inherit from a particular ancestor. The closer in time the relationship, the more segments they will inherit from that ancestor, which increases the chances of matching on at least one or some segments.

Clearly, pedigree collapse affects matching. It’s most pronounced in closer relationships, but it may also be the only thing that has preserved that ONE matching segment in a more distant relationship.
So, how does pedigree collapse actually affect the likelihood of matching? What can we actually expect to see? Is there a name for this and a mathematical model to assist with calculations?
I’m so glad you asked! It’s called Coefficient of Relationship.
Coefficent of Relationship

My colleague, Diahan Southard, a scientist who writes at YourDNAGuide has authored two wonderful articles about calculating the statistical effects of pedigree collapse.
You can also read another article about the methodology of calculating coefficient of relationship, here, on WaybackMachine.

Diahan is a math whiz. I’m not, so I needed to devise something “quick and dirty” for my own personal use. I promised you a “cheat sheet,” so here’s the methodology.
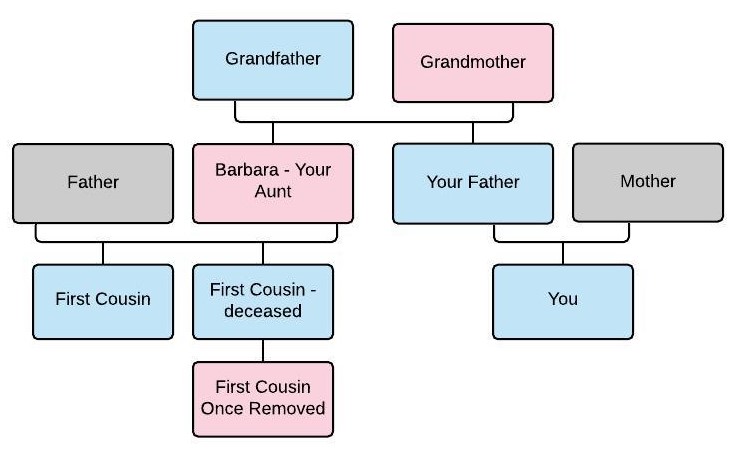
Two Inheritance Paths – First and Third Cousins
Let’s look at an example where two people are both first cousins and third cousins because their grandparents were also first cousins.

Let’s calculate how these two people are related. They are first cousins and also third cousins.

When calculating the effects of pedigree collapse, we calculate the first relationship normally, then calculate the second relationship and add a portion of the result.

Here’s the math.

Using the Shared cM Project for the expected amount of shared DNA for both relationships, we’ve calculated the expected range for this pedigree collapse relationship.

Tying this back to degrees of relatedness.
Let’s look at ways to do Quick Calculations using the publicly available Shared cM charts and my composite tables, here.
Using Average Shared DNA
This first methodology uses average expected amount of shared, meaning matching, DNA. Please note, I’m not necessarily expecting you to DO this now, just read to follow.

Using Average Inherited DNA
Here’s a second method using average inherited DNA, meaning people wouldn’t be expected to match on all of the inherited DNA – just a portion.

You can’t always use the shared cM charts because all relationships aren’t represented, so you may need to use the amount of expected inherited DNA instead of shared DNA amounts.
Methodology Differences

Remember, none of these methodologies are foolproof because DNA inheritance is random. You may also have additional relationships that you’re aware of.
So, what’s the easiest method? Neither, actually. I’ve found an even easier method based on these proven methodologies.
Easy-Peasy Pedigree Collapse Shortcut Range Calculation in 4 Steps
Now that you understand the science and reasoning behind all of this, you can choose from multiple calculation methodologies after drawing a picture of the relevant tree.
You’re probably wondering, “What’s the easiest way to do this?”
- These quick calculation methods are the easiest to work with for non-scientists and non-math whizzes. These are the calculations I use because, taking into account random recombination, you can’t do any better than get close.
- Also, remember, if you’re dealing with double relationships, meaning double first cousins, you’ll need to take that into consideration, too.
- If endogamy is involved, your matches will be higher yet, and you should use the highest calculations below because you need to be on the highest end of the range – and that may still not be high enough.
In these Easy-Peasy calculations, you calculate for the lowest, then the highest, and that’s your range. Please note that these are options, and truly, one size does not fit all.

- For the lowest end of the range, simply use the average of the highest relationship. In this case, that would be 1C, which is 866 cM. Remember that you may not share DNA with third cousins. 10% of third cousins don’t share any DNA, and 50% of fourth cousins don’t.
- For the highest end of the range, find the second relationship in the Shared cM chart, divide the average by half, and add to the value from the closest relationship. In this case, half of the 3C value of 76 is 38.
- Add 38 to 866 for the highest end of the range of 904.
- If there’s yet another path to ANY shared ancestor, add half that amount too to calculate the high end of the range – unless it’s 4C or more distant, then don’t add anything.
You can see that this easy-peasy range calculation for pedigree collapse compares very well to the more complex but still easy calculations.
- Easy-peasy calculation: 866-904
- Other calculation methods: 850-903
- For this same relationship combination, Diahan’s statistical calculation was 850 cM.
Back to Genealogy
What’s the short story about how pedigree collapse affects genealogy?
Essentially, in close generations, meaning within a few generations of two first cousins marrying, descendants can expect to inherit and share significantly more DNA of the common ancestors, but not double the amount. As we move further away from those marriages in time, the effect becomes less pronounced and more difficult to detect. You can see that effect when calculating multiple paths where at the fourth cousin level, or more distant, those cousins have a 50% or greater possibility of not sharing DNA segments.
Of course, with multiple paths to the same ancestor, your chances of inheriting at least some segments from the common ancestor are increased because their DNA descends through multiple paths.
Today, close marriages are much less common and have been for several generations in many cultures, so we see fewer instances where pedigree collapse makes a significant difference.
Within a population or group of people, if pedigree collapse becomes common, meaning that there are multiple paths leading back to common ancestors, like our three-path example, DNA segments from the common ancestors are found among many people. Significant pedigree collapse becomes endogamy, especially if marriage outside of the group is difficult, impossible, or discouraged.
Normally, pedigree collapse is not recorded in actual records. It’s left to genealogists to discover those connections.

The exception, of course, is those wonderful Catholic parish records where the priest granted dispensations. Sometimes, that’s our only hint to earlier genealogy. In the case of the marriage of Marie-Josesphe LePrince to Jacques Forest, the priest wrote “dispense 3-3 consanguinity,” which tells us that they shared great-grandparents. It also tells us that their grandparents were siblings, that the bride and groom were second cousins, and that their children and descendants inherited an extra dose of DNA from their common great-grandparents.
How does that affect me today? Given that I’m their seventh-generation descendant – probably not at all. Of course, they are Acadian, and the Acadians are highly endogamous, which means I match many Acadians because all Acadians share the DNA of just a few founders, making it almost impossible to track segments to any particular ancestor. If it weren’t for endogamy, I would probably match few, if any, of their descendants.
Now, when you see those Catholic church dispensations or otherwise discover pedigree collapse, you can be really excited, because you understand the effects of pedigree collapse and how to calculate resulting matches! You might, just might, have retained a DNA segment from those ancestors because you inherited segments through multiple paths – increasing the probability that one survived.
_____________________________________________________________
Follow DNAexplain on Facebook, here.
Share the Love!
You’re always welcome to forward articles or links to friends and share on social media.
If you haven’t already subscribed (it’s free,) you can receive an email whenever I publish by clicking the “follow” button on the main blog page, here.
You Can Help Keep This Blog Free
I receive a small contribution when you click on some of the links to vendors in my articles. This does NOT increase your price but helps me keep the lights on and this informational blog free for everyone. Please click on the links in the articles or to the vendors below if you are purchasing products or DNA testing.
Thank you so much.
DNA Purchases and Free Uploads
- FamilyTreeDNA – Y, mitochondrial and autosomal DNA testing
- MyHeritage DNA – Autosomal DNA test
- MyHeritage FREE DNA file upload – Upload your DNA file from other vendors free
- AncestryDNA – Autosomal DNA test
- AncestryDNA Plus Traits
- 23andMe Ancestry – Autosomal DNA only, no Health
- 23andMe Ancestry Plus Health
Genealogy Products and Services
- MyHeritage FREE Tree Builder – Genealogy software for your computer
- MyHeritage Subscription with Free Trial
- Legacy Family Tree Webinars – Genealogy and DNA classes, subscription-based, some free
- Legacy Family Tree Software – Genealogy software for your computer
- Newspapers.com – Search newspapers for your ancestors
- NewspaperArchive – Search different newspapers for your ancestors
My Book
- DNA for Native American Genealogy – by Roberta Estes, for those ordering the e-book from anyplace, or paperback within the United States
- DNA for Native American Genealogy – for those ordering the paperback outside the US
Genealogy Books
- Genealogical.com – Lots of wonderful genealogy research books
- American Ancestors – Wonderful selection of genealogy books
Genealogy Research
- Legacy Tree Genealogists – Professional genealogy research


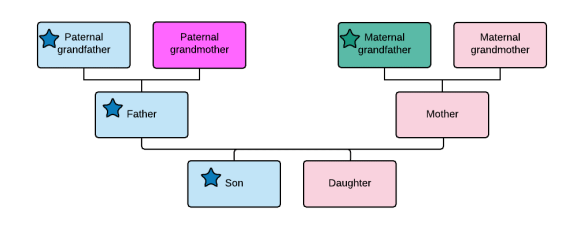
 You’ll notice that each parent carries more of each color DNA than they pass on to their own children, so different children receive different pieces of their parents’ DNA, and varying percentages of their grandparents’ DNA.